Code
import numpy as np
import pandas as pd
import matplotlib.pyplot as plt
from scipy.stats import t, normSource: Stents/stents.Rmd
The stents example compares treatment and control arms using only published summaries. The point is that comparing post-treatment means is less precise than comparing gains or a regression-adjusted post-treatment outcome when baseline and follow-up measurements are correlated.
import numpy as np
import pandas as pd
import matplotlib.pyplot as plt
from scipy.stats import t, normdef stent_summary(n, y_pre, y_post, s_pre, s_post, ci_width):
n = np.asarray(n, dtype=float)
y_pre = np.asarray(y_pre, dtype=float)
y_post = np.asarray(y_post, dtype=float)
s_pre = np.asarray(s_pre, dtype=float)
s_post = np.asarray(s_post, dtype=float)
ci_width = np.asarray(ci_width, dtype=float)
se_change = ci_width / (2 * t.ppf(.975, n - 1))
s_change = se_change * np.sqrt(n)
rho = (s_pre**2 + s_post**2 - s_change**2) / (2 * s_pre * s_post)
b = np.mean(rho * s_post / s_pre)
diff_simple = y_post[0] - y_post[1]
diff_gain = (y_post - y_pre)[0] - (y_post - y_pre)[1]
diff_reg = (y_post - b*y_pre)[0] - (y_post - b*y_pre)[1]
se_simple = np.sqrt(np.sum(s_post**2 / n))
se_gain = np.sqrt(np.sum(s_pre**2/n + s_post**2/n - 2*rho*s_pre*s_post/n))
se_reg = np.sqrt(np.sum(b**2*s_pre**2/n + s_post**2/n - 2*b*rho*s_pre*s_post/n))
out = pd.DataFrame({
"estimate": [diff_simple, diff_gain, diff_reg],
"std_error": [se_simple, se_gain, se_reg],
}, index=["post mean", "gain score", "regression adjusted"])
out["z"] = out.estimate / out.std_error
out["two_sided_p"] = 2 * norm.cdf(-np.abs(out.z))
return out, rho, bexercise, rho_ex, b_ex = stent_summary(
n=[104, 90],
y_pre=[528.0, 490.0],
y_post=[556.3, 501.8],
s_pre=[178.7, 195.0],
s_post=[178.7, 190.9],
ci_width=[45.1 - 11.6, 31.3 - (-7.8)],
)
exercise.round(2)| estimate | std_error | z | two_sided_p | |
|---|---|---|---|---|
| post mean | 54.50 | 26.68 | 2.04 | 0.04 |
| gain score | 16.50 | 12.97 | 1.27 | 0.20 |
| regression adjusted | 21.28 | 12.50 | 1.70 | 0.09 |
z = exercise.loc["regression adjusted", "z"]
power_right = 1 - norm.cdf(1.96 - z)
power_left = norm.cdf(-1.96 - z)
print(power_right, power_left)
0.3981780954972123 0.0001251590390651888treadmill, rho_tm, b_tm = stent_summary(
n=[104, 90],
y_pre=[4.24, 4.18],
y_post=[5.46, 4.28],
s_pre=[4.82, 4.65],
s_post=[4.79, 4.98],
ci_width=[2.07 - 0.37, 1.19 - (-0.99)],
)
treadmill.round(2)| estimate | std_error | z | two_sided_p | |
|---|---|---|---|---|
| post mean | 1.18 | 0.70 | 1.68 | 0.09 |
| gain score | 1.12 | 0.70 | 1.61 | 0.11 |
| regression adjusted | 1.15 | 0.61 | 1.88 | 0.06 |
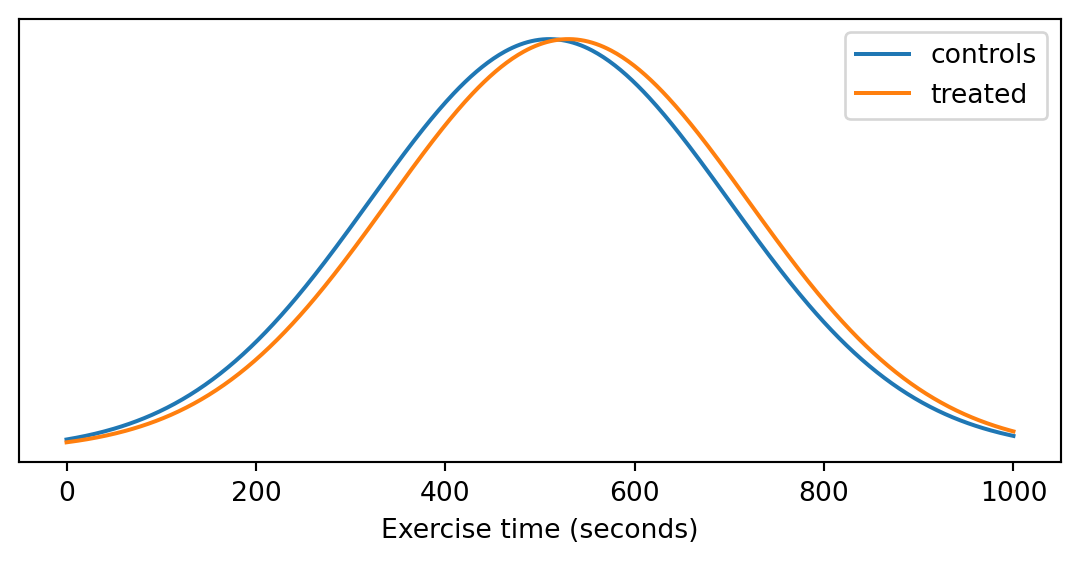
x = np.linspace(0, 1000, 500)
scale = norm.pdf(0, 0, 190)
fig, ax = plt.subplots(figsize=(7, 3))
ax.plot(x, norm.pdf(x, 510, 190) / scale, label="controls")
ax.plot(x, norm.pdf(x, 530, 190) / scale, label="treated")
ax.set_xlabel("Exercise time (seconds)")
ax.set_yticks([])
ax.legend()