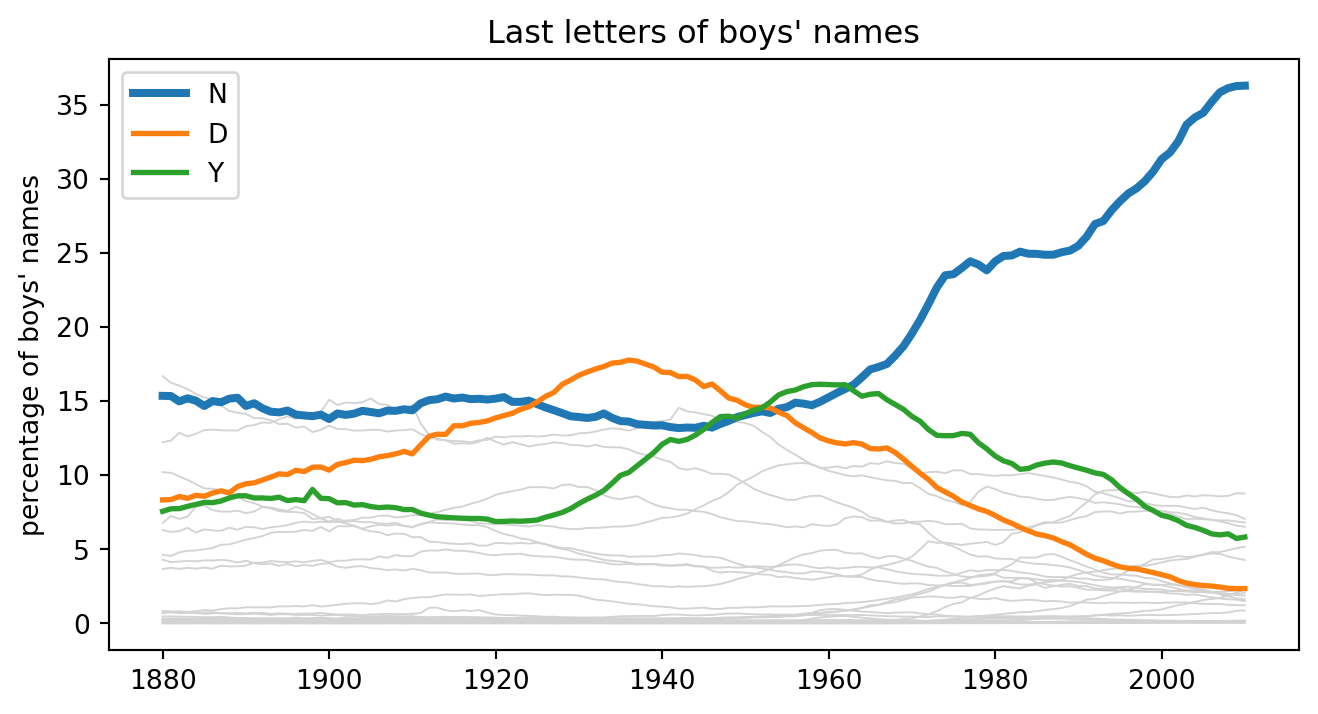
This example studies changes over time in the final letters of American baby names. The most famous pattern is the rise and fall of boys’ names ending in n, d, and y.
Code
from pathlib import Pathimport numpy as npimport pandas as pdimport matplotlib.pyplot as pltroot = Path("../../ROS-Examples")allnames = pd.read_csv(root /"Names/data/allnames_clean.csv")allnames.head()
X
name
sex
X1880
X1881
X1882
X1883
X1884
X1885
X1886
...
X2001
X2002
X2003
X2004
X2005
X2006
X2007
X2008
X2009
X2010
0
1
Mary
F
7065
6919
8149
8012
9217
9128
9891
...
5715
5439
4996
4792
4439
4073
3665
3478
3132
2826
1
2
Anna
F
2604
2698
3143
3306
3860
3994
4283
...
10564
10372
9429
9510
9085
8590
7866
7236
6755
6242
2
3
Emma
F
2003
2034
2303
2367
2587
2728
2764
...
13299
16520
22690
21591
20318
19092
18338
18765
17830
17179
3
4
Elizabeth
F
1939
1852
2187
2255
2549
2582
2680
...
14767
14581
14083
13536
12705
12397
13013
11956
10969
10135
4
5
Minnie
F
1746
1653
2004
2035
2243
2178
2372
...
25
33
25
26
31
37
17
43
28
37
5 rows × 134 columns
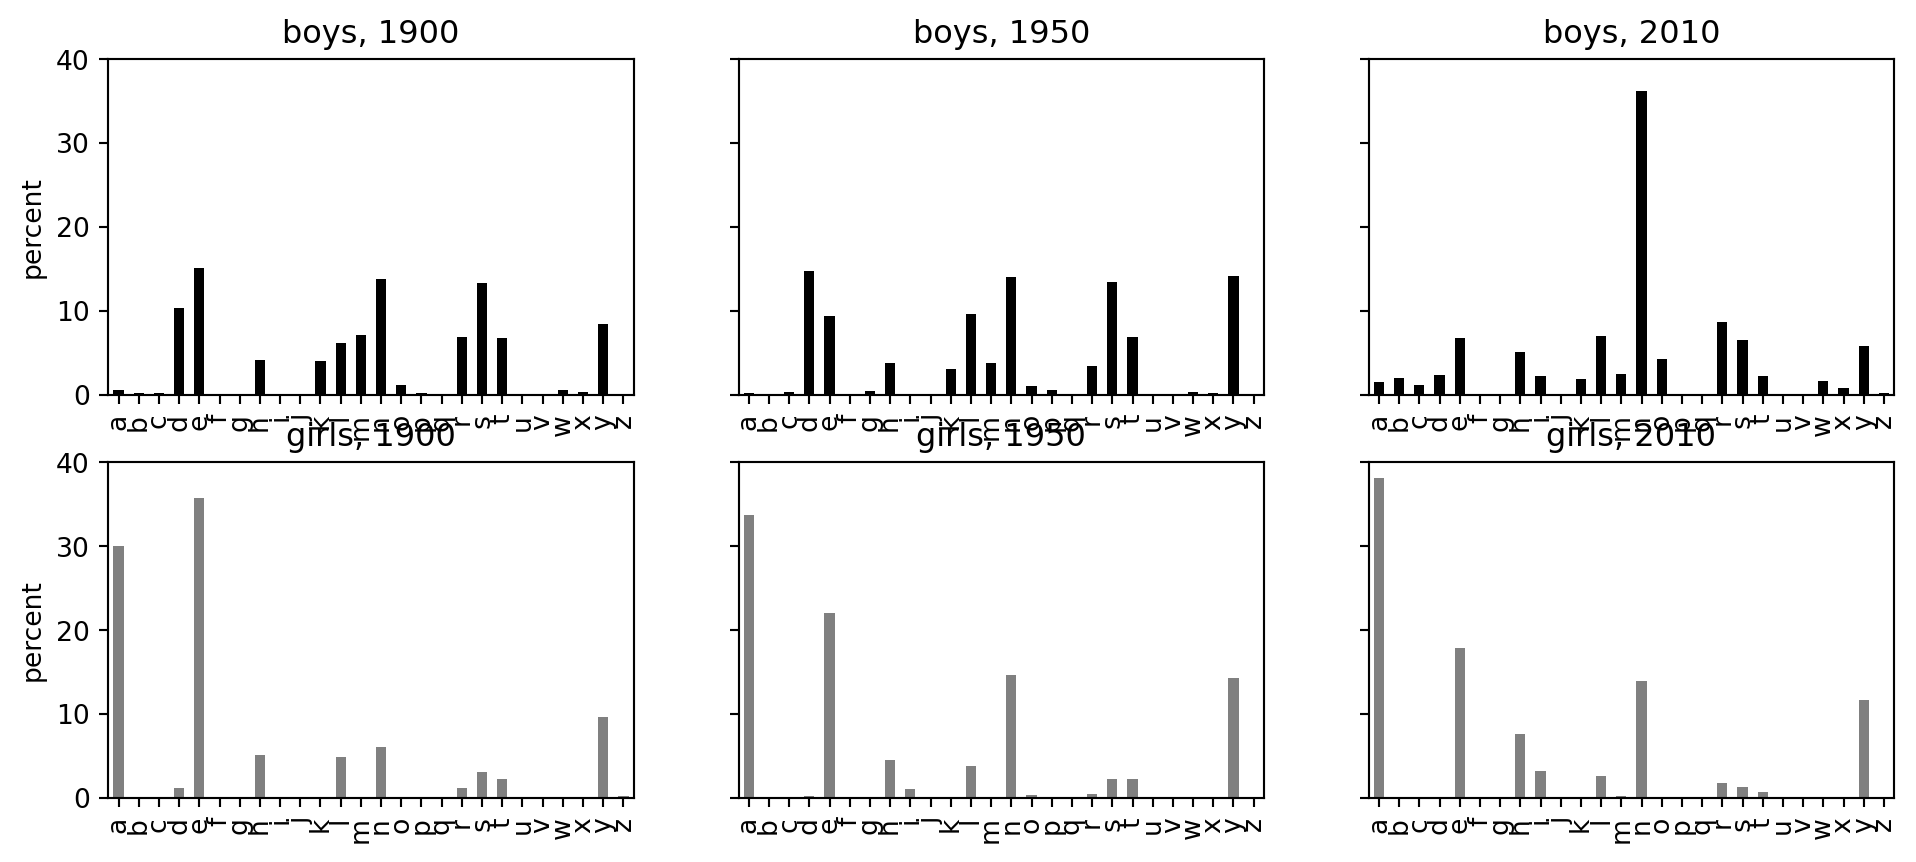
Last-letter distributions in selected years
Code
allnames["last"] = allnames["name"].str[-1].str.lower()allnames["first"] = allnames["name"].str[0].str.upper()letters =list("abcdefghijklmnopqrstuvwxyz")def letter_share(year, sex, which="last"): col =f"X{year}" sub = allnames[allnames.sex == sex] counts = sub.groupby(which)[col].sum().reindex(letters if which =="last"elselist("ABCDEFGHIJKLMNOPQRSTUVWXYZ"), fill_value=0)return100* counts / counts.sum()
years = np.arange(1880, 2011)boys = allnames[allnames.sex =="M"].copy()shares = {}for letter in letters: rows = boys[boys["last"] == letter] num = rows[[f"X{y}"for y in years]].sum(axis=0).to_numpy() den = boys[[f"X{y}"for y in years]].sum(axis=0).to_numpy() shares[letter] =100* num / denshares = pd.DataFrame(shares, index=years)
Code
fig, ax = plt.subplots(figsize=(8, 4))for letter in letters: ax.plot(shares.index, shares[letter], color="lightgray", linewidth=0.7)for letter, lw in [("n", 3), ("d", 2), ("y", 2)]: ax.plot(shares.index, shares[letter], label=letter.upper(), linewidth=lw)ax.set_ylabel("percentage of boys' names")ax.set_title("Last letters of boys' names")ax.legend()
Source Code
# Last letters of baby namesSource: `Names/lastletters.Rmd`This example studies changes over time in the final letters of American baby names. The most famous pattern is the rise and fall of boys' names ending in `n`, `d`, and `y`.```{python}from pathlib import Pathimport numpy as npimport pandas as pdimport matplotlib.pyplot as pltroot = Path("../../ROS-Examples")allnames = pd.read_csv(root /"Names/data/allnames_clean.csv")allnames.head()```## Last-letter distributions in selected years```{python}allnames["last"] = allnames["name"].str[-1].str.lower()allnames["first"] = allnames["name"].str[0].str.upper()letters =list("abcdefghijklmnopqrstuvwxyz")def letter_share(year, sex, which="last"): col =f"X{year}" sub = allnames[allnames.sex == sex] counts = sub.groupby(which)[col].sum().reindex(letters if which =="last"elselist("ABCDEFGHIJKLMNOPQRSTUVWXYZ"), fill_value=0)return100* counts / counts.sum()``````{python}fig, axs = plt.subplots(2, 3, figsize=(12, 5), sharey=True)for j, year inenumerate([1900, 1950, 2010]): letter_share(year, "M").plot.bar(ax=axs[0, j], color="black") axs[0, j].set_title(f"boys, {year}") letter_share(year, "F").plot.bar(ax=axs[1, j], color="gray") axs[1, j].set_title(f"girls, {year}")for ax in axs.ravel(): ax.set_xlabel("") ax.set_ylabel("percent")```## Time series of boys' final letters```{python}years = np.arange(1880, 2011)boys = allnames[allnames.sex =="M"].copy()shares = {}for letter in letters: rows = boys[boys["last"] == letter] num = rows[[f"X{y}"for y in years]].sum(axis=0).to_numpy() den = boys[[f"X{y}"for y in years]].sum(axis=0).to_numpy() shares[letter] =100* num / denshares = pd.DataFrame(shares, index=years)``````{python}fig, ax = plt.subplots(figsize=(8, 4))for letter in letters: ax.plot(shares.index, shares[letter], color="lightgray", linewidth=0.7)for letter, lw in [("n", 3), ("d", 2), ("y", 2)]: ax.plot(shares.index, shares[letter], label=letter.upper(), linewidth=lw)ax.set_ylabel("percentage of boys' names")ax.set_title("Last letters of boys' names")ax.legend()```