# KidIQ: multiple linear regression
Source: `KidIQ/kidiq.Rmd`
This page ports the core `rstanarm::stan_glm` examples to Python with the formula-first `lapylace` interface.
## Load data
```{python}
from pathlib import Path
import pandas as pd
import lapylace as lp
import numpy as np
import matplotlib.pyplot as plt

root = Path("../../ROS-Examples")
kidiq = pd.read_csv(root / "KidIQ/data/kidiq.csv")
kidiq.head()
```
```{python}
def coef_medians(fit):
    return pd.Series(
        [np.median(fit.alpha_draws()), *np.median(fit.beta_draws(), axis=0)],
        index=["Intercept", *fit.columns],
    )

def fit_gaussian(formula, seed):
    return lp.stan_glm(
        formula,
        data=kidiq,
        family=lp.gaussian(),
        prior=lp.normal(0, 10),
        prior_intercept=lp.normal(0, 30),
        prior_aux=lp.exponential(30),
        chains=4,
        parallel_chains=4,
        iter_warmup=500,
        iter_sampling=1000,
        seed=seed,
        refresh=100,
    )
```
## Single binary predictor
R original:
```r
stan_glm(kid_score ~ mom_hs, data=kidiq)
```
Python:
```{python}
fit_1 = fit_gaussian("kid_score ~ mom_hs", seed=16101)
fit_1.summary(["alpha", "beta", "sigma"])
```
## Single continuous predictor
```{python}
fit_2 = fit_gaussian("kid_score ~ mom_iq", seed=16102)
coef_2 = coef_medians(fit_2)
coef_2.round(2)
```
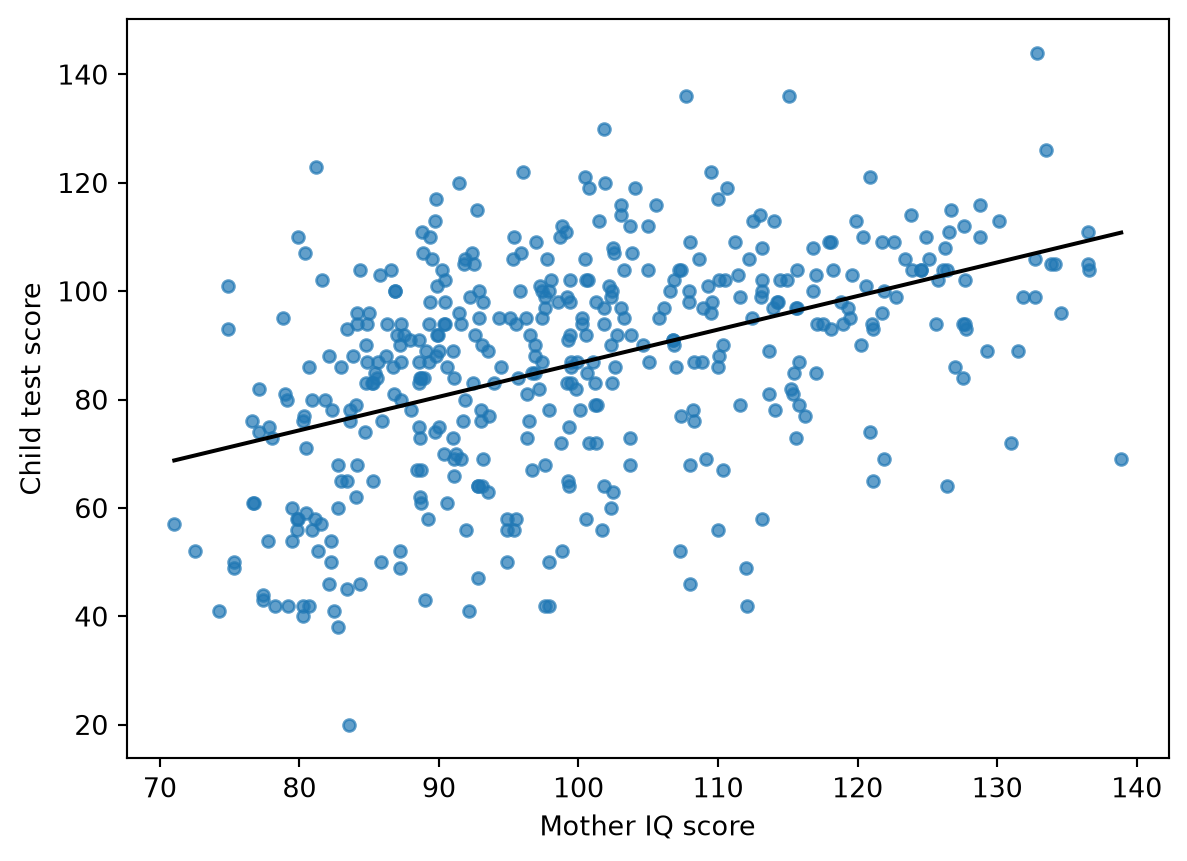
```{python}
ax = kidiq.plot.scatter("mom_iq", "kid_score", alpha=0.7)
xs = np.linspace(kidiq.mom_iq.min(), kidiq.mom_iq.max(), 100)
ax.plot(xs, coef_2["Intercept"] + coef_2["mom_iq"] * xs, color="black")
ax.set_xlabel("Mother IQ score")
ax.set_ylabel("Child test score")
```
## Two predictors
```{python}
fit_3 = fit_gaussian("kid_score ~ mom_hs + mom_iq", seed=16103)
coef_3 = coef_medians(fit_3)
coef_3.round(2)
```
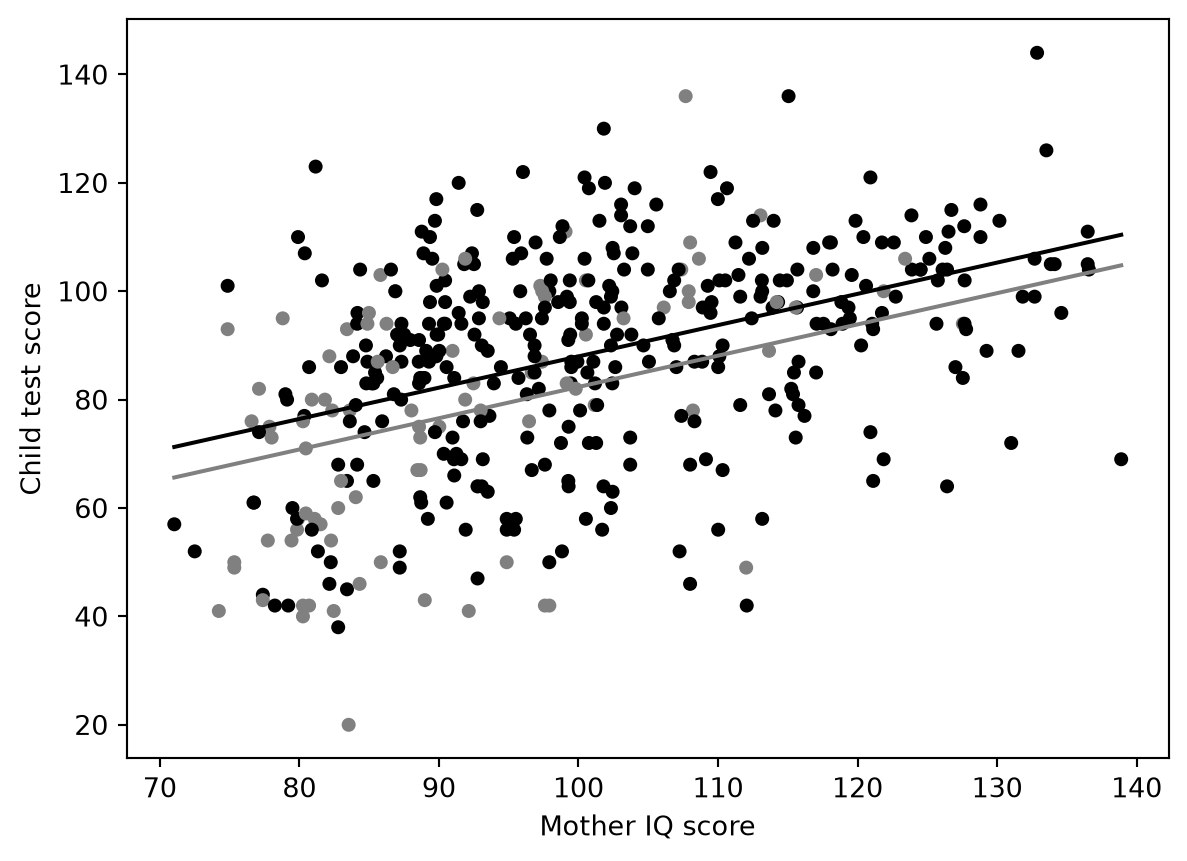
Two fitted lines, no interaction:
```{python}
fig, ax = plt.subplots()
colors = np.where(kidiq.mom_hs == 1, "black", "gray")
ax.scatter(kidiq.mom_iq, kidiq.kid_score, c=colors, s=18)
for hs, color in [(0, "gray"), (1, "black")]:
    ax.plot(xs, coef_3["Intercept"] + coef_3["mom_hs"]*hs + coef_3["mom_iq"]*xs, color=color)
ax.set_xlabel("Mother IQ score")
ax.set_ylabel("Child test score")
```
## Interaction model
```{python}
fit_4 = fit_gaussian("kid_score ~ mom_hs * mom_iq", seed=16104)
coef_medians(fit_4).round(2)
```
## Stan model generated by Lapylace
`lapylace` generates the same Gaussian regression structure behind the formula call.
```stan
data {
  int<lower=1> N;
  int<lower=1> K;
  matrix[N, K] X;
  vector[N] y;
}
parameters {
  vector[K] beta;
  real<lower=0> sigma;
}
model {
  beta ~ normal(0, 10);
  sigma ~ exponential(1);
  y ~ normal(X * beta, sigma);
}
```
## BlackJAX relevance
This example is a good teaching case for writing the Gaussian regression log density by hand, but `lapylace` is preferable for the main exposition. BlackJAX becomes useful when we want explicit NUTS mechanics or JAX-vectorized repeated simulations.