The R example demonstrates Stan as a general optimizer. The model has one constrained parameter and no data; all information is supplied by the target density.
The optimizer reports the posterior mode for x on the constrained interval (0, 100). Because the program only increments target, this is not a generative statistical model; it is a small example of putting an arbitrary objective into Stan’s optimizer.
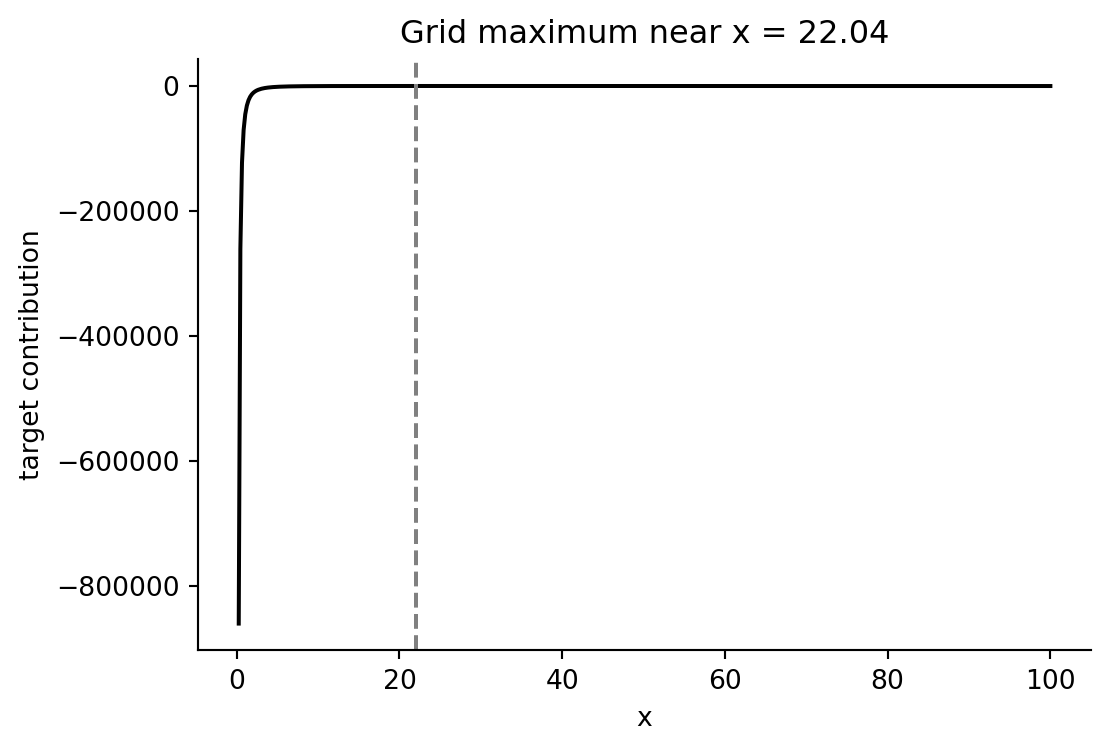
Check the objective directly
Code
import numpy as npimport matplotlib.pyplot as pltxs = np.linspace(0.25, 100, 500)target = (5000/ xs**2) * (xs -11)x_best_grid = xs[np.argmax(target)]fig, ax = plt.subplots(figsize=(6, 4))ax.plot(xs, target, color="black")ax.axvline(x_best_grid, color="0.5", ls="--")ax.set(xlabel="x", ylabel="target contribution", title=f"Grid maximum near x = {x_best_grid:.2f}")ax.spines[["top", "right"]].set_visible(False)
BlackJAX relevance
BlackJAX is not necessary here because there is no posterior distribution to sample. If the objective were converted into a proper log density, the core function would simply be:
Code
def restaurant_logdensity(z):# z is unconstrained; x is mapped to (0, 100). x =100/ (1+ np.exp(-z)) log_jac = np.log(100) + z -2* np.log1p(np.exp(z))return (5000/ x**2) * (x -11) + log_jacrestaurant_logdensity(0.0)
np.float64(81.2188758248682)
Source Code
# Restaurant optimization in StanSource: `Restaurant/restaurant.Rmd`The R example demonstrates Stan as a general optimizer. The model has one constrained parameter and no data; all information is supplied by the target density.## Stan program```stanparameters { real<lower=0,upper=100> x;}model { target += (5000/x^2)*(x-11);}```## Optimize with CmdStanPy```{python}from pathlib import Pathfrom cmdstanpy import CmdStanModelroot = Path("../../ROS-Examples")stan_file = root /"Restaurant/restaurant.stan"print(stan_file.read_text())restaurant_model = CmdStanModel(stan_file=str(stan_file))fit = restaurant_model.optimize(data={}, seed=1507)fit.optimized_params_dict```The optimizer reports the posterior mode for `x` on the constrained interval `(0, 100)`. Because the program only increments `target`, this is not a generative statistical model; it is a small example of putting an arbitrary objective into Stan's optimizer.## Check the objective directly```{python}import numpy as npimport matplotlib.pyplot as pltxs = np.linspace(0.25, 100, 500)target = (5000/ xs**2) * (xs -11)x_best_grid = xs[np.argmax(target)]fig, ax = plt.subplots(figsize=(6, 4))ax.plot(xs, target, color="black")ax.axvline(x_best_grid, color="0.5", ls="--")ax.set(xlabel="x", ylabel="target contribution", title=f"Grid maximum near x = {x_best_grid:.2f}")ax.spines[["top", "right"]].set_visible(False)```## BlackJAX relevanceBlackJAX is not necessary here because there is no posterior distribution to sample. If the objective were converted into a proper log density, the core function would simply be:```{python}def restaurant_logdensity(z):# z is unconstrained; x is mapped to (0, 100). x =100/ (1+ np.exp(-z)) log_jac = np.log(100) + z -2* np.log1p(np.exp(z))return (5000/ x**2) * (x -11) + log_jacrestaurant_logdensity(0.0)```