Source: Death/polls.Rmd
This example combines polling time series with state-level death-sentence reversal rates.
Code
from pathlib import Path
import numpy as np
import pandas as pd
import matplotlib.pyplot as plt

root = Path("../../ROS-Examples")
polls = np.fromstring((root / "Death/data/polls.dat").read_text(), sep=" ").reshape(-1, 5)
support = polls[:, 2] / (polls[:, 2] + polls[:, 3])
year = polls[:, 0] + (polls[:, 1] - 6) / 12
death = pd.read_table(root / "Death/data/dataforandy.txt", sep=r"\s+")
death.head()
| AL |
296.0 |
33.47 |
32.65 |
11.61 |
11.56 |
77.0 |
5.0 |
| AR |
77.0 |
15.40 |
15.65 |
9.70 |
9.71 |
79.0 |
4.0 |
| AZ |
231.0 |
41.50 |
39.42 |
7.92 |
7.60 |
70.0 |
2.0 |
| CA |
528.0 |
9.21 |
9.14 |
8.80 |
8.45 |
87.0 |
0.4 |
| CO |
9.0 |
2.67 |
2.74 |
5.48 |
5.43 |
NaN |
NaN |
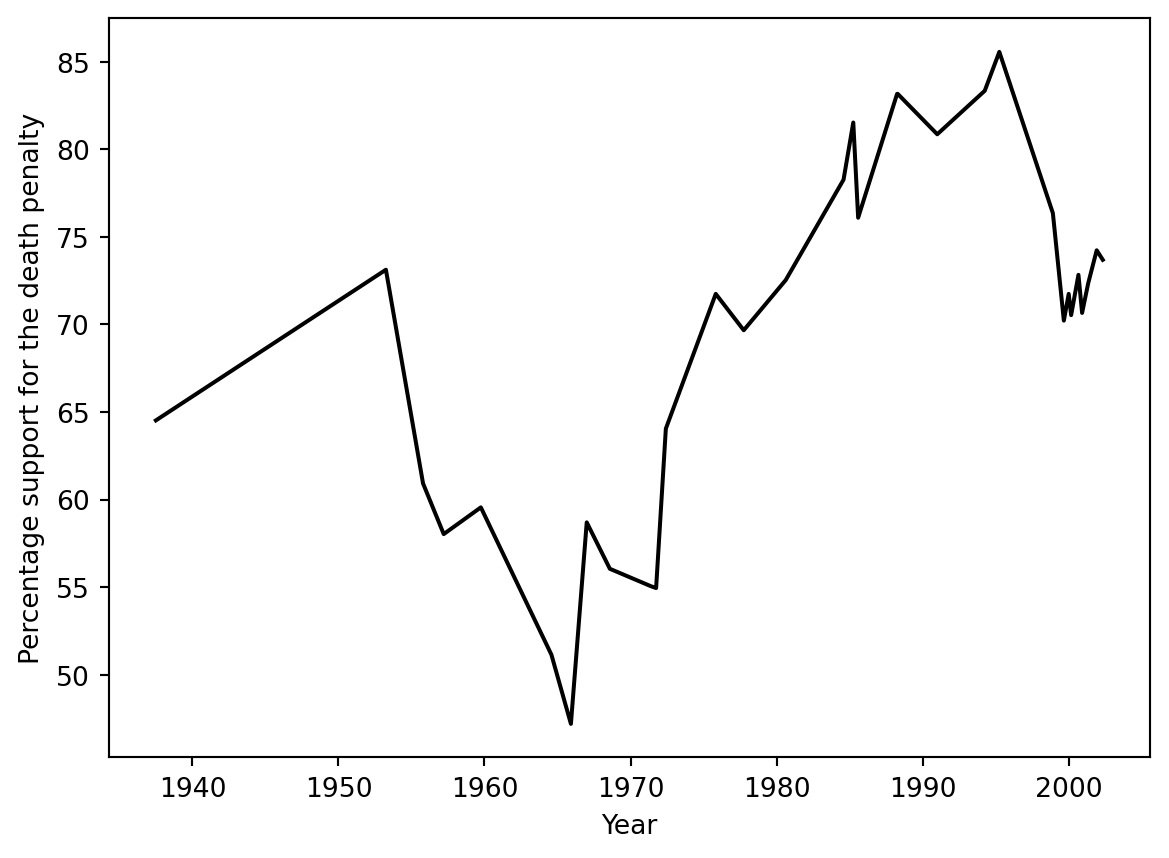
Support for the death penalty
Code
fig, ax = plt.subplots()
ax.plot(year, 100*support, color="black")
ax.set_xlabel("Year")
ax.set_ylabel("Percentage support for the death penalty")
Text(0, 0.5, 'Percentage support for the death penalty')
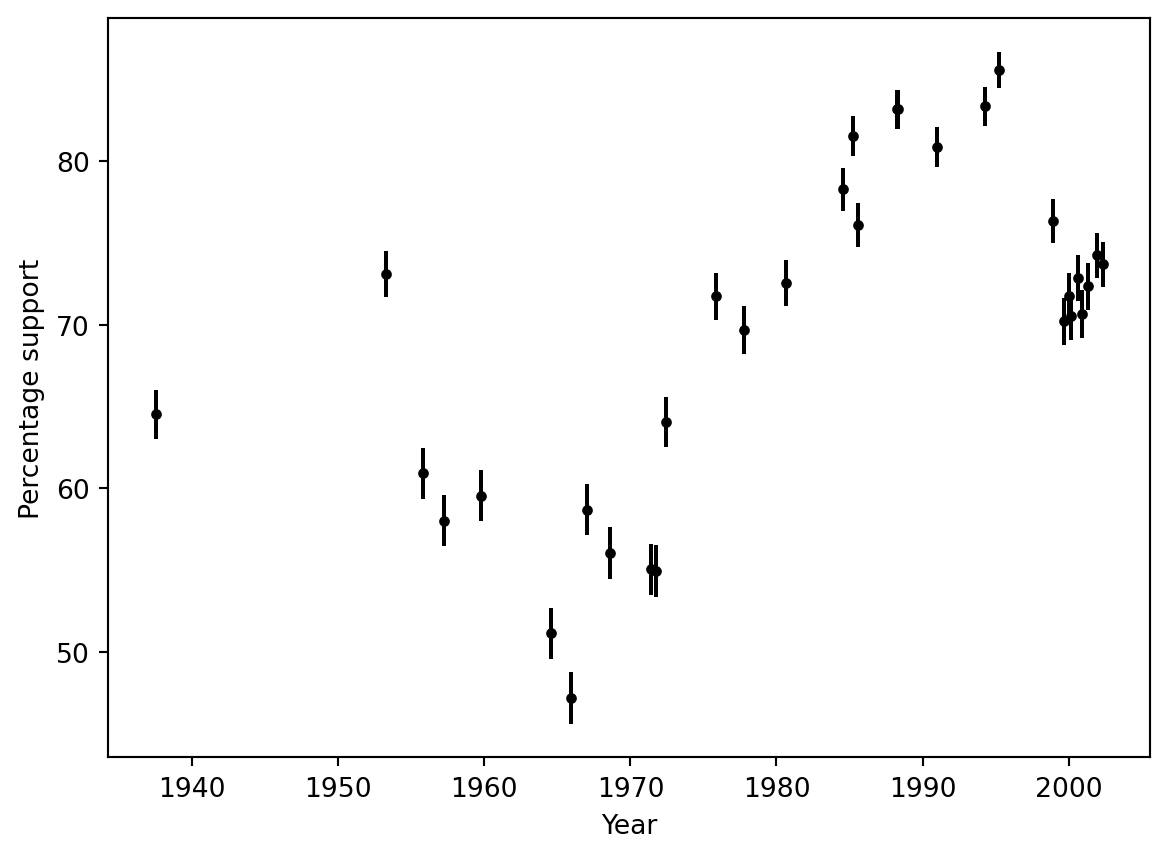
With approximate binomial uncertainty, assuming the original poll denominator is near 1000 as in the R graphic:
Code
sd = np.sqrt(support * (1 - support) / 1000)
fig, ax = plt.subplots()
ax.errorbar(year, 100*support, yerr=100*sd, fmt="o", color="black", markersize=3)
ax.set_xlabel("Year")
ax.set_ylabel("Percentage support")
Text(0, 0.5, 'Percentage support')
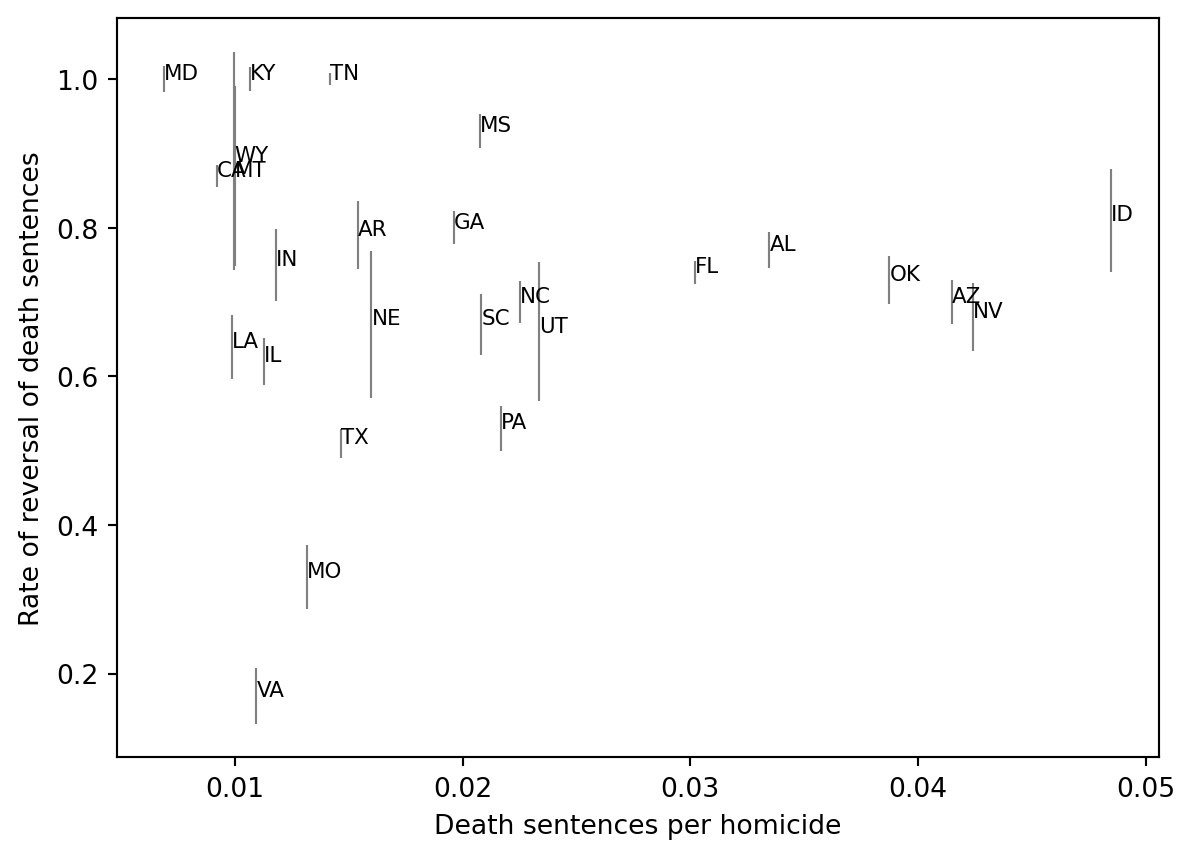
State reversal rates
Code
ex_rate = death.iloc[:, 6] / 100
err_rate = death.iloc[:, 5] / 100
hom_rate = death.iloc[:, 3] / 100000
ds_per_homicide = death.iloc[:, 1] / 1000
ds = death.iloc[:, 0]
err = err_rate * ds
hom = ds / ds_per_homicide
std_err_rate = np.sqrt((err + 1) * (ds + 1 - err) / ((ds + 2)**2 * (ds + 3)))
state_abbrs = death.index.astype(str)
Code
fig, ax = plt.subplots(figsize=(7, 5))
x = ds / hom
ax.errorbar(x, err_rate, yerr=std_err_rate, fmt="none", ecolor="gray", linewidth=0.8)
for xi, yi, label in zip(x, err_rate, state_abbrs):
    ax.text(xi, yi, label, fontsize=8)
ax.set_xlabel("Death sentences per homicide")
ax.set_ylabel("Rate of reversal of death sentences")
Text(0, 0.5, 'Rate of reversal of death sentences')