import os
import numpy as np
import preliz as pz

import matplotlib.pyplot as plt
pz.style.use('preliz-doc')Chapter 6, demo 4
Bayesian data analysis
Posterior predictive checking
Light speed example
# data
data_path = os.path.abspath(
    os.path.join(
        os.path.pardir,
        'utilities_and_data',
        'light.txt'
    )
)
y = np.loadtxt(data_path)
# sufficient statistics
n = len(y)
s2 = np.var(y, ddof=1)
my = np.mean(y)
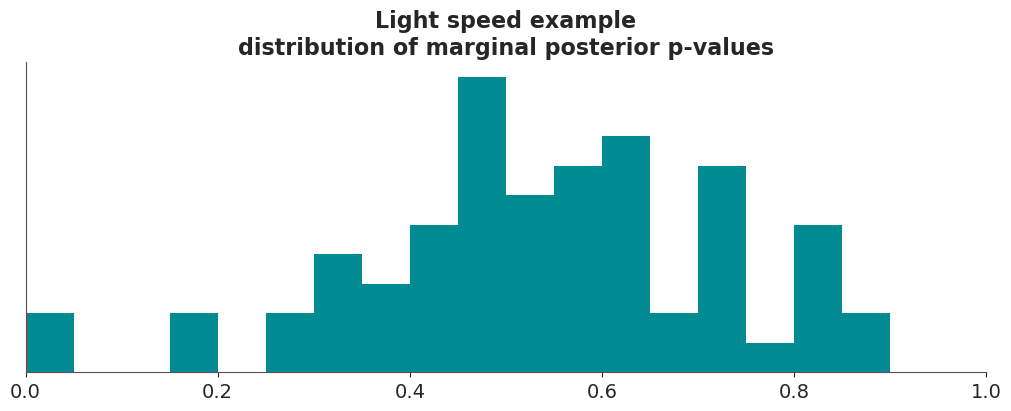
# tail area probabilities of marginal predictive distributions
Ty = pz.StudentT(n-1, my, np.sqrt(s2*(1+1/n))).cdf(y)# plot
_, ax = plt.subplots(figsize=(10, 4))
ax.hist(Ty, np.arange(0, 1.01, 0.05))
ax.set(xlim=(0, 1), yticks=[])
ax.set_title('Light speed example\ndistribution of marginal posterior p-values');