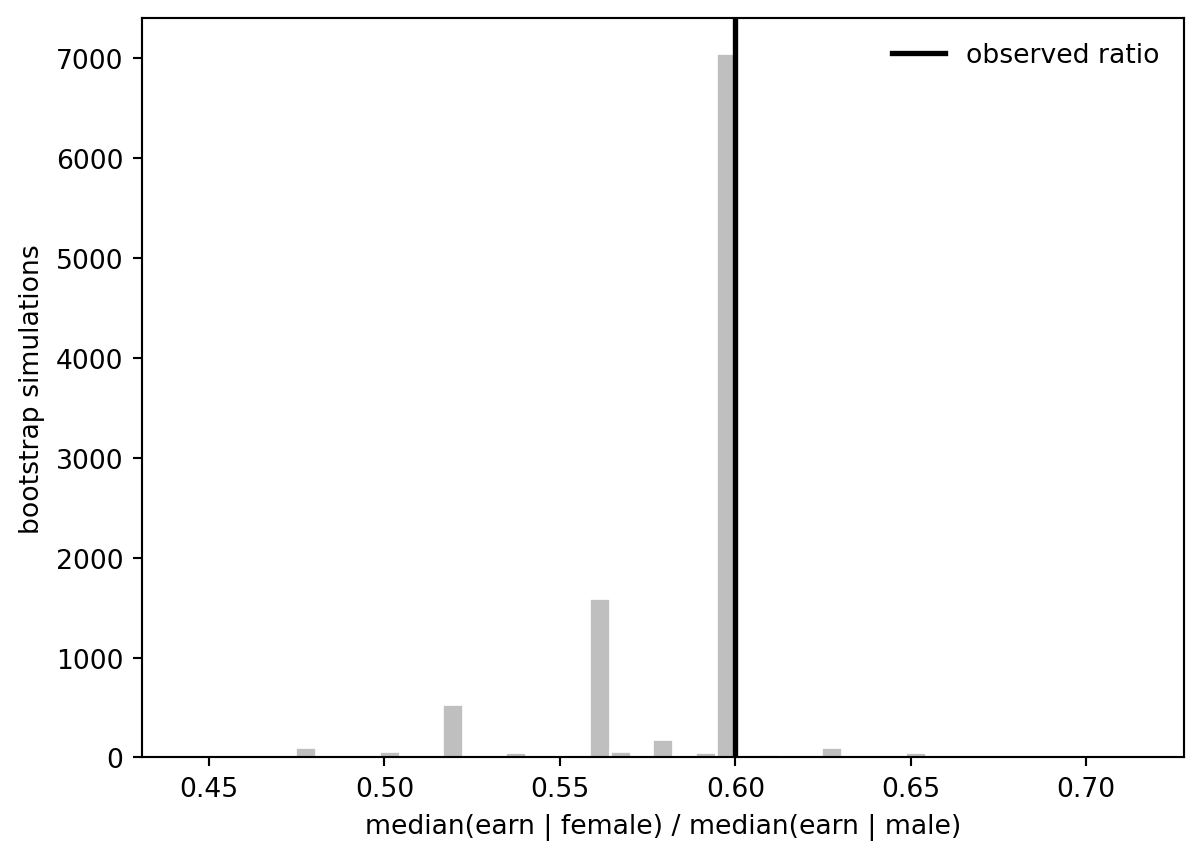
This example uses the nonparametric bootstrap to approximate the sampling distribution of a ratio: median earnings among women divided by median earnings among men. The bootstrap resamples rows of the survey data, preserving the joint distribution of earnings and the sex indicator.
Setup and data
Code
from pathlib import Pathimport numpy as npimport pandas as pdimport matplotlib.pyplot as pltroot = Path("../../ROS-Examples")earnings = pd.read_csv(root /"Earnings/data/earnings.csv")rng = np.random.default_rng(20260531)earnings.head()
The statistic is deliberately simple. The bootstrap question is: if this dataset were a stand-in for the population, how much would this ratio move under repeated samples of the same size?
A single bootstrap resample
Code
n =len(earnings)boot_index = rng.integers(0, n, size=n)earnings_boot = earnings.iloc[boot_index]ratio_boot = female_to_male_median_ratio(earnings_boot)ratio_boot
The standard deviation of the simulated ratios is the bootstrap standard error. The percentile interval is not a model-based confidence interval; it is the direct middle 95% of the resampled statistics.
Source Code
# Earnings bootstrapSource: `Earnings/earnings_bootstrap.Rmd`This example uses the nonparametric bootstrap to approximate the sampling distribution of a ratio: median earnings among women divided by median earnings among men. The bootstrap resamples rows of the survey data, preserving the joint distribution of earnings and the sex indicator.## Setup and data```{python}from pathlib import Pathimport numpy as npimport pandas as pdimport matplotlib.pyplot as pltroot = Path("../../ROS-Examples")earnings = pd.read_csv(root /"Earnings/data/earnings.csv")rng = np.random.default_rng(20260531)earnings.head()``````{python}earnings[["earn", "male", "height", "education", "age"]].describe()```## Ratio in the observed sample```{python}def female_to_male_median_ratio(data): female_median = data.loc[data["male"] ==0, "earn"].median() male_median = data.loc[data["male"] ==1, "earn"].median()return female_median / male_medianobserved_ratio = female_to_male_median_ratio(earnings)observed_ratio```The statistic is deliberately simple. The bootstrap question is: if this dataset were a stand-in for the population, how much would this ratio move under repeated samples of the same size?## A single bootstrap resample```{python}n =len(earnings)boot_index = rng.integers(0, n, size=n)earnings_boot = earnings.iloc[boot_index]ratio_boot = female_to_male_median_ratio(earnings_boot)ratio_boot```## Bootstrap distribution```{python}def bootstrap_ratio(data, rng): boot_index = rng.integers(0, len(data), size=len(data))return female_to_male_median_ratio(data.iloc[boot_index])n_sims =10_000boot_ratios = np.array([bootstrap_ratio(earnings, rng) for _ inrange(n_sims)])pd.Series(boot_ratios).describe(percentiles=[0.025, 0.25, 0.5, 0.75, 0.975])``````{python}fig, ax = plt.subplots()ax.hist(boot_ratios, bins=45, color="0.75", edgecolor="white")ax.axvline(observed_ratio, color="black", linewidth=2, label="observed ratio")ax.set_xlabel("median(earn | female) / median(earn | male)")ax.set_ylabel("bootstrap simulations")ax.legend(frameon=False)``````{python}bootstrap_se = boot_ratios.std(ddof=1)bootstrap_interval = np.quantile(boot_ratios, [0.025, 0.975])bootstrap_se, bootstrap_interval```The standard deviation of the simulated ratios is the bootstrap standard error. The percentile interval is not a model-based confidence interval; it is the direct middle 95% of the resampled statistics.