This page loads the McDonald and Schwing air-pollution/mortality data. The dataset is used later for regression diagnostics and coefficient stability.
Code
from pathlib import Pathimport pandas as pdimport matplotlib.pyplot as pltroot = Path("../../ROS-Examples")pollution = pd.read_csv(root /"Pollution/data/pollution.csv")pollution.head()
prec
jant
jult
ovr65
popn
educ
hous
dens
nonw
wwdrk
poor
hc
nox
so2
humid
mort
0
36
27
71
8.1
3.34
11.4
81.5
3243
8.8
42.6
11.7
21
15
59
59
921.870
1
35
23
72
11.1
3.14
11.0
78.8
4281
3.5
50.7
14.4
8
10
39
57
997.875
2
44
29
74
10.4
3.21
9.8
81.6
4260
0.8
39.4
12.4
6
6
33
54
962.354
3
47
45
79
6.5
3.41
11.1
77.5
3125
27.1
50.2
20.6
18
8
24
56
982.291
4
43
35
77
7.6
3.44
9.6
84.6
6441
24.4
43.7
14.3
43
38
206
55
1071.289
Variable summaries
Code
pollution.describe().T
count
mean
std
min
25%
50%
75%
max
prec
60.0
37.366667
9.984678
10.000
32.750
38.000
43.25000
60.000
jant
60.0
33.983333
10.168899
12.000
27.000
31.500
40.00000
67.000
jult
60.0
74.583333
4.763177
63.000
72.000
74.000
77.25000
85.000
ovr65
60.0
8.798333
1.464552
5.600
7.675
9.000
9.70000
11.800
popn
60.0
3.263167
0.135252
2.920
3.210
3.265
3.36000
3.530
educ
60.0
10.973333
0.845299
9.000
10.400
11.050
11.50000
12.300
hous
60.0
80.913333
5.141373
66.800
78.375
81.150
83.60000
90.700
dens
60.0
3876.050000
1454.102361
1441.000
3104.250
3567.000
4519.75000
9699.000
nonw
60.0
11.870000
8.921148
0.800
4.950
10.400
15.65000
38.500
wwdrk
60.0
46.081667
4.613043
33.800
43.250
45.500
49.52500
59.700
poor
60.0
14.373333
4.160096
9.400
12.000
13.200
15.15000
26.400
hc
60.0
37.850000
91.977673
1.000
7.000
14.500
30.25000
648.000
nox
60.0
22.650000
46.333290
1.000
4.000
9.000
23.75000
319.000
so2
60.0
53.766667
63.390468
1.000
11.000
30.000
69.00000
278.000
humid
60.0
57.666667
5.369931
38.000
55.000
57.000
60.00000
73.000
mort
60.0
940.358433
62.206278
790.733
898.372
943.683
983.20575
1113.156
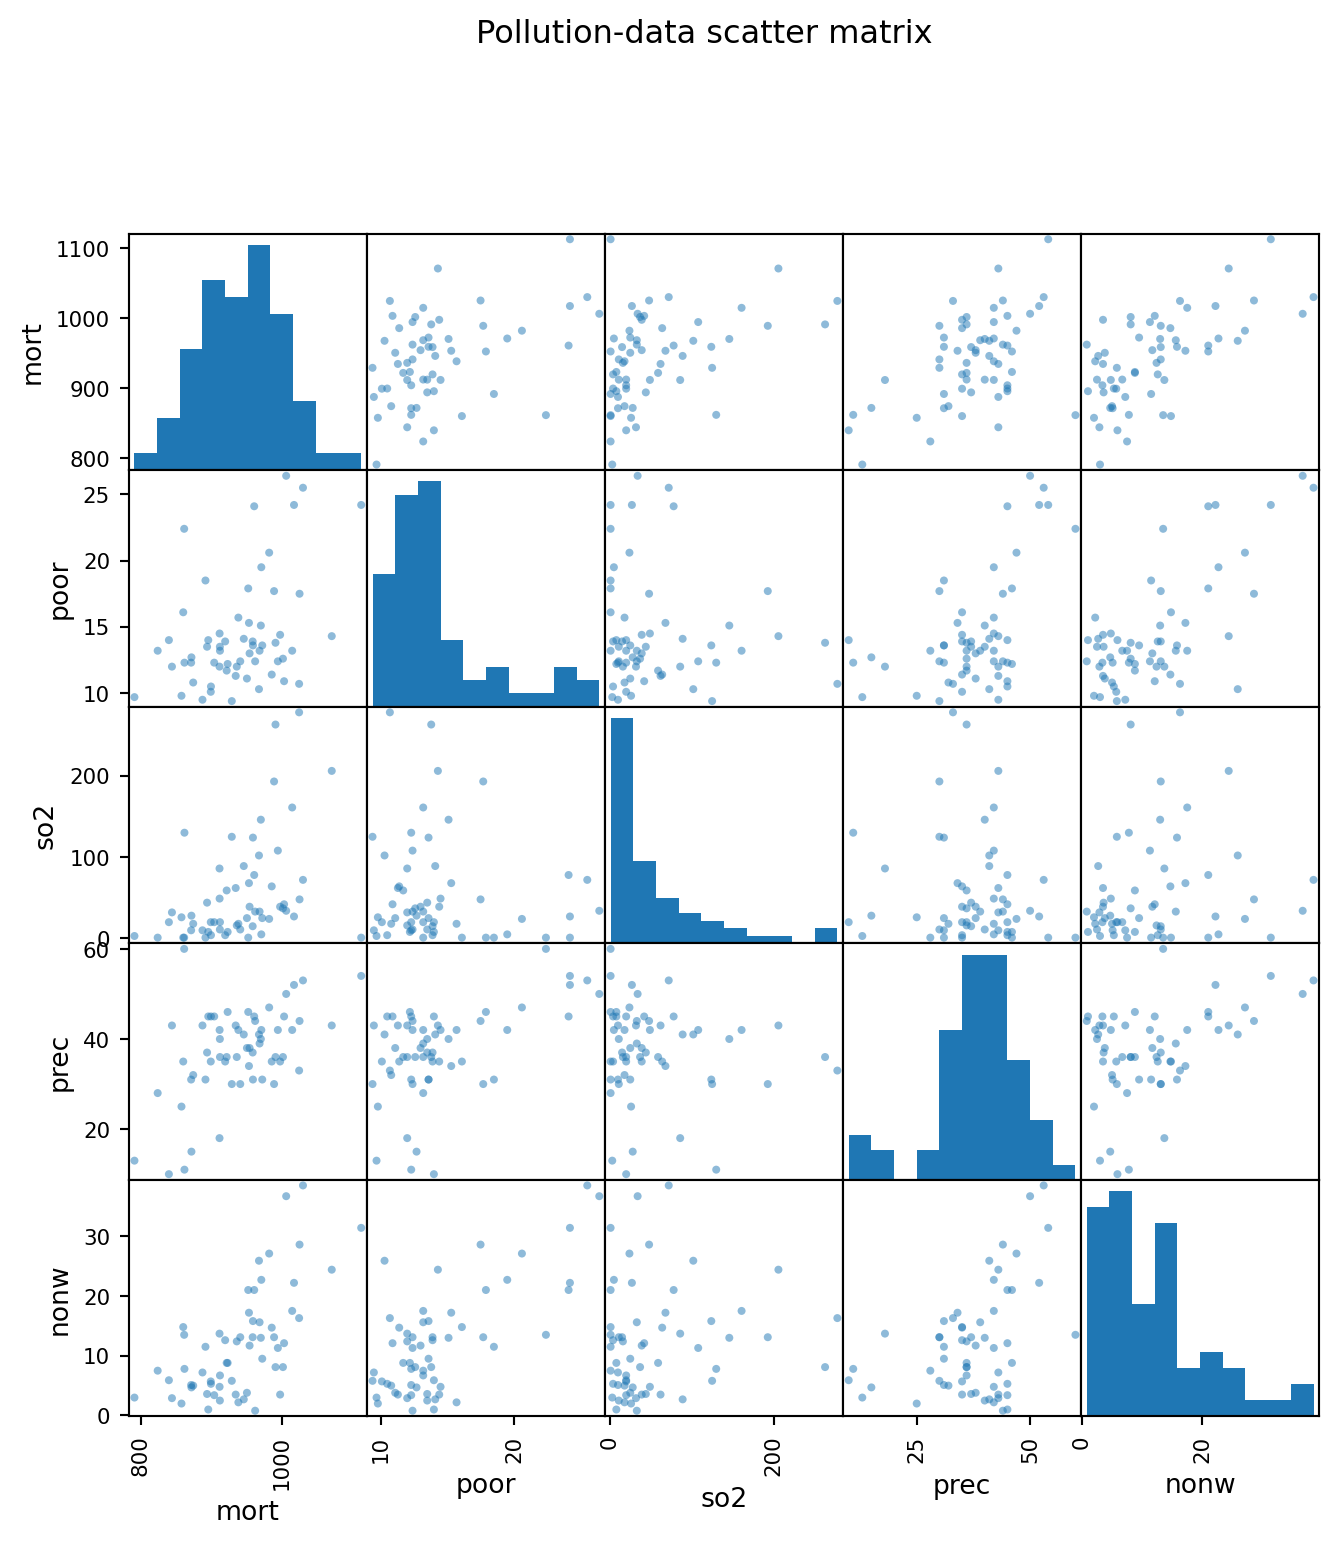
Pairwise associations with mortality
Code
target_candidates = [c for c in pollution.columns if c.lower() in {"mort", "mortality", "mortality_rate"}]target = target_candidates[0] if target_candidates else pollution.select_dtypes('number').columns[0]corr = pollution.select_dtypes('number').corr()[target].sort_values()corr
num = pollution.select_dtypes('number')cols = [target] + [c for c in corr.index[-5:] if c != target]pd.plotting.scatter_matrix(num[cols], figsize=(8, 8), diagonal="hist")plt.suptitle("Pollution-data scatter matrix", y=1.02)
Text(0.5, 1.02, 'Pollution-data scatter matrix')
Source Code
# Pollution and mortality dataSource: `Pollution/pollution.Rmd`This page loads the McDonald and Schwing air-pollution/mortality data. The dataset is used later for regression diagnostics and coefficient stability.```{python}from pathlib import Pathimport pandas as pdimport matplotlib.pyplot as pltroot = Path("../../ROS-Examples")pollution = pd.read_csv(root /"Pollution/data/pollution.csv")pollution.head()```## Variable summaries```{python}pollution.describe().T```## Pairwise associations with mortality```{python}target_candidates = [c for c in pollution.columns if c.lower() in {"mort", "mortality", "mortality_rate"}]target = target_candidates[0] if target_candidates else pollution.select_dtypes('number').columns[0]corr = pollution.select_dtypes('number').corr()[target].sort_values()corr``````{python}num = pollution.select_dtypes('number')cols = [target] + [c for c in corr.index[-5:] if c != target]pd.plotting.scatter_matrix(num[cols], figsize=(8, 8), diagonal="hist")plt.suptitle("Pollution-data scatter matrix", y=1.02)```