import numpy as np
from scipy.stats import gaussian_kde
import preliz as pz

import matplotlib.pyplot as plt
from matplotlib.patches import ConnectionPatch
pz.style.use('preliz-doc')Chapter 10, demo 1
Bayesian data analysis
Rejection sampling example
In rejection sampling the proposal distribution \(g(\theta)\) has to form an envelope over the target distribution \(q(\theta)\), that is, there has to be value \(M\) so that
\[ \frac{q(\theta)}{M g(\theta)} \leq 1. \]
# fake interesting distribution
x = np.linspace(-3, 3, 200)
r = np.array([ 1.1 ,  1.3 , -0.1 , -0.7 ,  0.2 , -0.4 ,  0.06, -1.7 ,
               1.7 ,  0.3 ,  0.7 ,  1.6 , -2.06, -0.74,  0.2 ,  0.5 ])
# Estimate the density (named q, to emphasize that it does not need to be
# normalized). Parameter bw_method=0.48 is used to mimic the outcome of the
# kernelp function in Matlab.
q = gaussian_kde(r, bw_method=0.48).evaluate(x)
# rejection sampling example
g_mean = 0
g_std = 1.1
g = pz.Normal(g_mean, g_std).pdf(x)
# M is computed by discrete approximation
M = np.max(q/g)
# prescale
g *= M# Create figure and axes
_, ax = plt.subplots(figsize=(10, 6))
# Plot densities
ax.plot(x, q, label=r'$q(\theta|y)$')
ax.plot(x, g, 'C3--', label=r'$Mg(\theta)$')
ax.fill_between(x, q, color='C0', alpha=0.1)
ax.set(xlim=(x[[0, -1]]), yticks=[])
ax.legend()
# Illustrate one sample
r1 = -0.8
zi = np.argmin(np.abs(x - r1)) # closest grid point
# Vertical lines
ax.vlines(x[zi], 0, q[zi], color='gray')
ax.vlines(x[zi], q[zi], g[zi], color='gray', linestyles='--')
# Mark points
r21, r22 = 0.3 * g[zi], 0.8 * g[zi]
ax.plot(r1, r21, 'o', color="C1", markersize=12)
ax.plot(r1, r22, 'o', color="C2", markersize=12)
# Annotations
ax.text(x[zi], q[zi], r'$\leftarrow \, q(\theta=r|y)$')
ax.text(x[zi], g[zi], r'$\leftarrow \, g(\theta=r)$')
ax.text(r1 - 0.1, r21, 'accepted', ha='right')
ax.text(r1 - 0.1, r22, 'rejected', ha='right')
plt.show()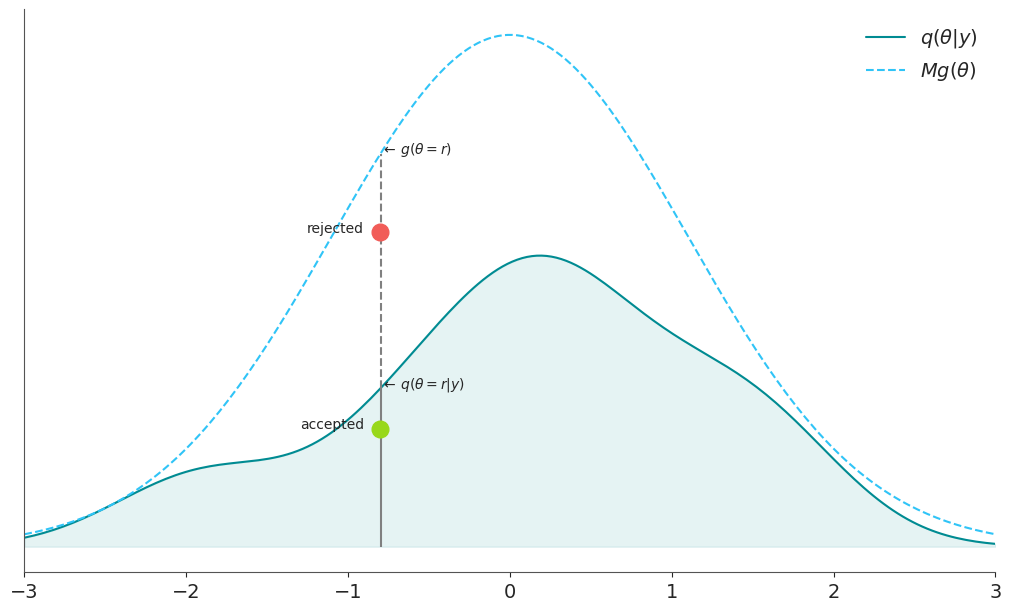
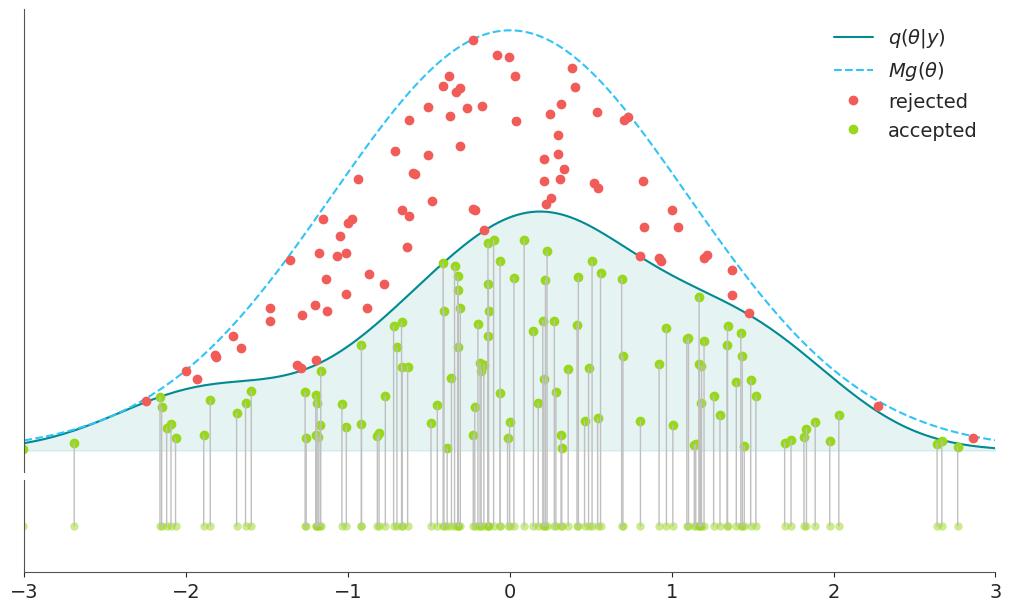
# get nsamp samples
nsamp = 200
r1 = pz.Normal(g_mean, g_std).rvs(size=nsamp)
zi = np.argmin(np.abs(x[:,None] - r1), axis=0)
r2 = np.random.rand(nsamp) * g[zi]
acc = r2 < q[zi]
# Plot the densities
fig, (ax_top, ax_bottom) = plt.subplots(2, 1, figsize=(10, 6), sharex=True, gridspec_kw={'height_ratios': [5, 1]})
# Densities and samples
ax_top.plot(x, q, label=r'$q(\theta|y)$')
ax_top.plot(x, g, 'C3--', label=r'$Mg(\theta)$')
ax_top.set(xlim=(x[[0, -1]]), yticks=[])
ax_top.fill_between(x, q, color='C0', alpha=0.1)
# remove bottom xticks and spines
ax_top.spines['bottom'].set_visible(False)
ax_top.tick_params(axis='x', which='both', bottom=False)
# Plot rejected and accepted samples
ax_top.plot(r1[~acc], r2[~acc], 'C2o', label='rejected')
ax_top.plot(r1[acc], r2[acc], 'C1o', label='accepted')
ax_top.legend()
# Only accepted samples
ax_bottom.plot(r1[acc], np.ones(acc.sum()), 'C1o', alpha=0.5, mec="none")
ax_bottom.set(yticks=[], xlim=(x[[0, -1]]))
# Add inter-axis lines
for sample_idx in range(nsamp):
if acc[sample_idx] and x[0] <= r1[sample_idx] <= x[-1]:
x_pos = r1[sample_idx]
fig.add_artist(ConnectionPatch(
xyA=(x_pos, 1),
xyB=(x_pos, r2[sample_idx]),
coordsA=ax_bottom.transData,
coordsB=ax_top.transData,
axesA=ax_bottom,
axesB=ax_top,
color='0.75',
))
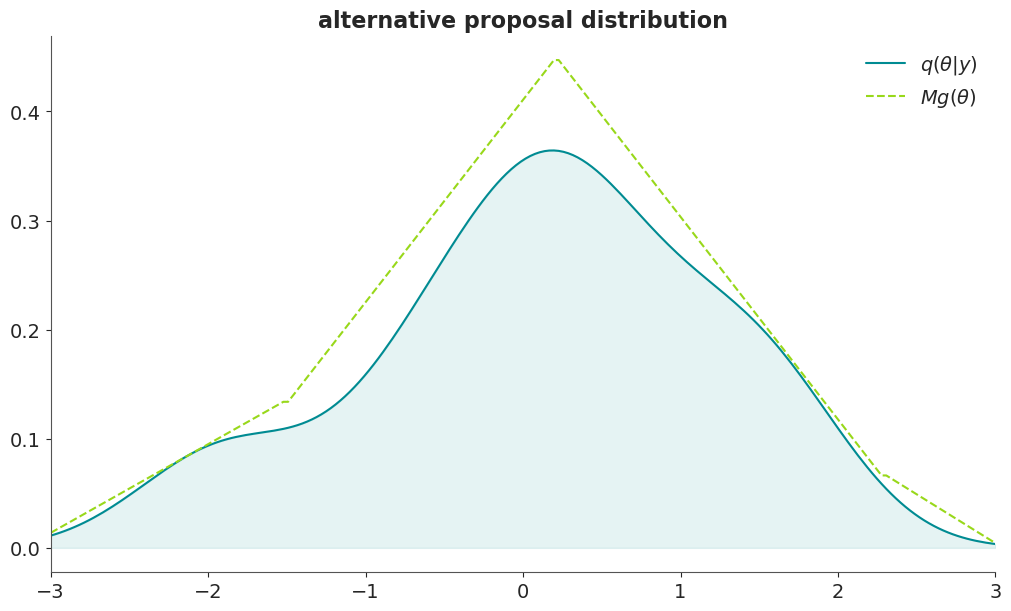
# alternative proposal distribution
g = np.empty(x.shape)
g[x <= -1.5] = np.linspace(q[0], np.max(q[x<=-1.5]), len(x[x<=-1.5]))
g[(x > -1.5) & (x <= 0.2)] = np.linspace(
    np.max(q[x<=-1.5]),
    np.max(q[(x>-1.5) & (x<=0.2)]),
    len(x[(x>-1.5) & (x<=0.2)])
)
g[(x > 0.2) & (x <= 2.3)] = np.linspace(
    np.max(q[(x>-1.5) & (x<=0.2)]),
    np.max(q[x>2.3]),
    len(x[(x>0.2) & (x<=2.3)])
)
g[x > 2.3] = np.linspace(np.max(q[x>2.3]), q[-1], len(x[x>2.3]))
M = np.max(q/g)
g *= M

# plot
plt.figure(figsize=(10, 6))
plt.plot(x, q)
plt.plot(x, g, linestyle='--')
plt.fill_between(x, q, color='C0', alpha=0.1)
plt.legend((r'$q(\theta|y)$', r'$Mg(\theta)$'))
plt.xlim([x[0], x[-1]])
plt.title('alternative proposal distribution');