# import necessary packages

# fast array routines for numerical calculation
import numpy as np
# PreliZ is a package for exploring and eliciting probability distributions
import preliz as pzChapter 2, demo 1
Bayesian Data Analysis, 3rd ed
Probability of a girl birth given placenta previa (BDA3 p. 37). 437 girls and 543 boys have been observed. Calculate and plot the posterior distribution of the proportion of girls \(\theta\), using uniform prior on \(\theta\).
# set preliz style
pz.style.use("preliz-doc")
# Change default credible interval kind and probability
# By default PreliZ uses highest density interval (HDI) and 0.94 probability
pz.rcParams["stats.ci_kind"] = "eti"
pz.rcParams["stats.ci_prob"] = 0.95
The posterior distribution is Beta(438, 544)
# Instantiate the Beta distribution
dist = pz.Beta(438, 544)
We can plot the distribution using the built-in plot_pdf method.
dist.plot_pdf(pointinterval=True);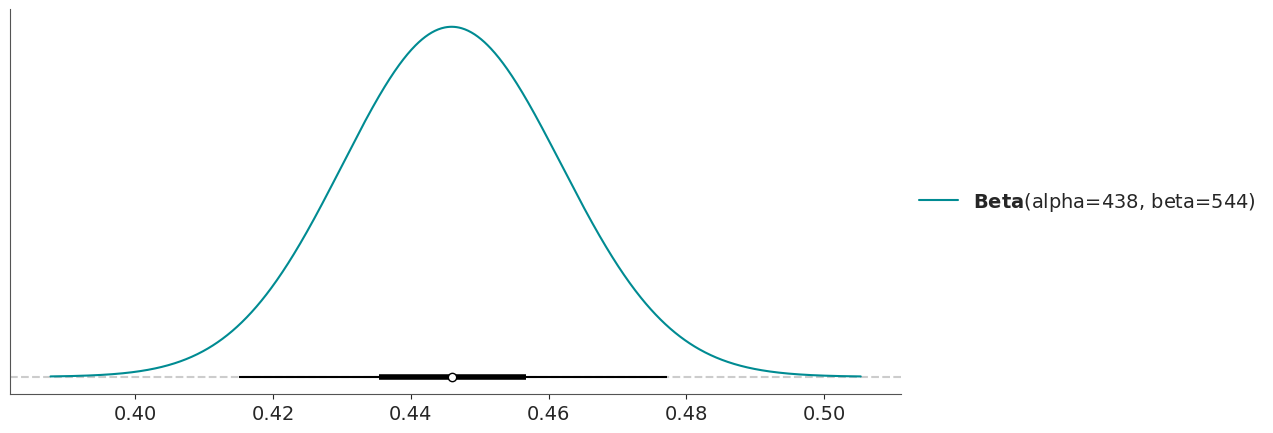
But we want to customize the plot a bit more.
# plot PDF with custom legend
ax = dist.plot_pdf(legend=r"$p(\theta|y,n)$")
# Set custom title
ax.set_title(f'Uniform prior -> Posterior is Beta({dist.alpha:.0f}, {dist.beta:.0f})')
# Add vertical line and annotation for general population proportion
ax.axvline(0.485, color='C2')
ax.annotate('proportion in general\npopulation', (0.485 + 0.001, 14), ha='left')

# shade the 95% central posterior interval
# dist.ppf is percent point function (inverse of CDF)
x_vals = np.linspace(*dist.ppf([0.025, 0.975]))
ax.fill_between(x_vals, dist.pdf(x_vals), color='lightgray')
# add text into the shaded area
ax.text(dist.median(), 8, "95%", horizontalalignment='center', fontsize=18)
# # add labels and title
ax.set_xlabel(r'$\theta$');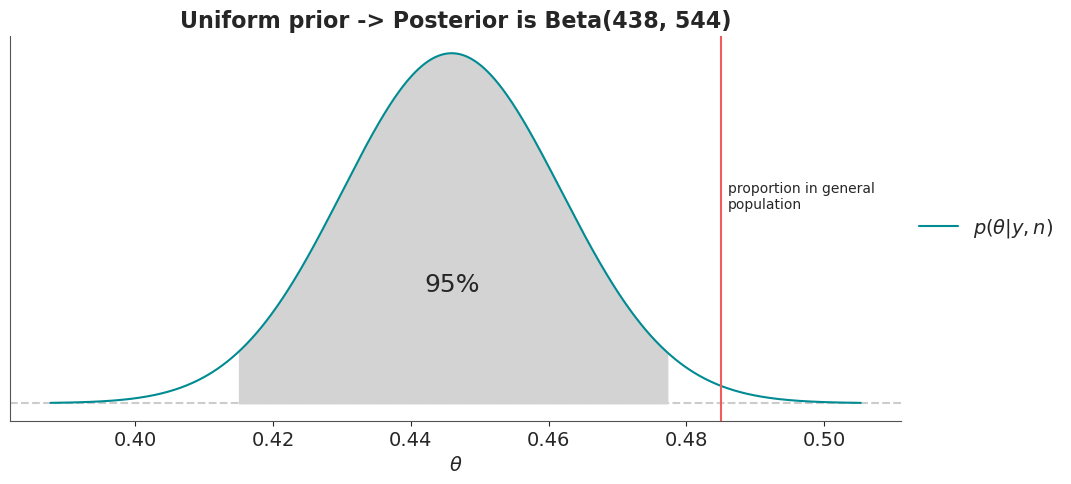
Authors: - Aki Vehtari aki.vehtari@aalto.fi - Tuomas Sivula tuomas.sivula@aalto.fi - Osvaldo A. Martin osvaldo.martin@aalto.fi