# import necessary packages

import matplotlib.pyplot as plt
import numpy as np
import preliz as pz

pz.style.use("preliz-doc")Chapter 2, demo 3
Bayesian Data Analysis, 3rd ed
Probability of a girl birth given placenta previa (BDA3 p. 37). Simulate samples from Beta(438,544), draw a histogram with quantiles, and do the same for a transformed variable.
# Sample from posterior Beta(438,544).
# Obtain all draws at once and store them in vector 'theta'
n = 10000
theta = pz.Beta(438, 544).rvs(size=n)

# Compute odds ratio for all draws
phi = (1-theta)/theta
_, axes = plt.subplots(1, 2, figsize=(10, 4), sharey=True)
for sample, title, ax in zip((theta, phi),
(r"$\theta$", r"$\phi$"),
axes.ravel()):
# Histogram plots with 30 bins for theta and phi
ax.hist(sample, bins=30, density=True)
# Compute 2.5% and 97.5% quantile approximation using samples
q_s = np.quantile(sample, [0.025, 0.975])
ax.axvline(q_s[0], color="C2", ls="--")
ax.axvline(q_s[1], color="C2", ls="--")
ax.text(q_s[0], 20, "2.5%", color="k")
ax.text(q_s[1], 20, "97.5%", color="k")
ax.set_yticks([])
ax.set_title(title)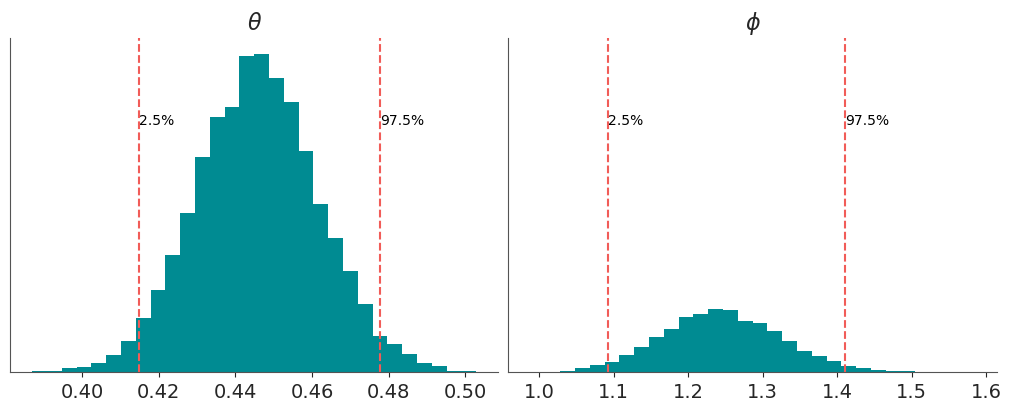
Authors: - Aki Vehtari aki.vehtari@aalto.fi - Tuomas Sivula tuomas.sivula@aalto.fi - Osvaldo A. Martin osvaldo.martin@aalto.fi