import numpy as np
import preliz as pz

import matplotlib.pyplot as plt
pz.style.use('preliz-doc')Chapter 6, demo 2
Bayesian data analysis
Posterior predictive checking
Binomial example - Testing sequential dependence example
# Testing sequential dependence example (Gelman et al p. 163)
y = np.array([1, 1, 0, 0, 0, 0, 0, 1, 1, 1, 1, 1, 0, 0, 0, 0, 0, 0, 0, 0])
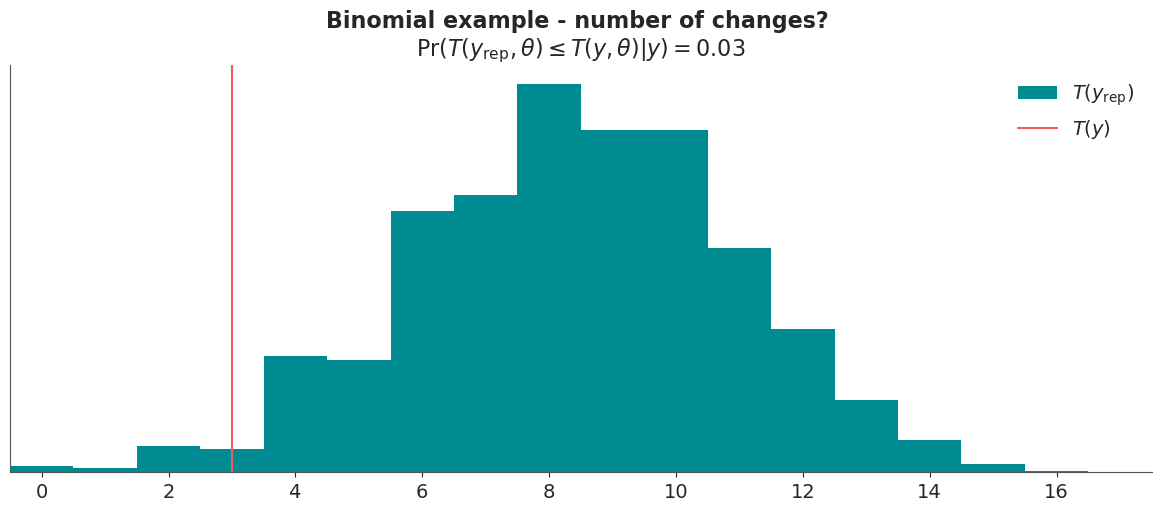
Ty = np.count_nonzero(np.diff(y))

# sufficient statistics
n = len(y)
s = y.sum()

nsamp = 10000
t = np.random.beta(s+1, n-s+1, size=nsamp)
yr = np.random.rand(n, nsamp) < t
Tyr = np.count_nonzero(np.diff(yr, axis=0), axis=0)
# plot
plt.hist(
Tyr,
np.arange(19),
align='left',
label=r'$T(y_\mathrm{rep})$',
color='C0',
)
plt.axvline(Ty, color='C2', label='$T(y)$')
plt.xlim((-0.5, 17.5))
plt.yticks([])
plt.title(
'Binomial example - number of changes? \n'
r'$\operatorname{Pr}(T(y_\mathrm{rep},\theta) \leq T(y,\theta)|y) = 0.03$',
)
plt.legend();