import matplotlib.pyplot as plt
import numpy as np

from crabbymetrics import MatrixCompletion

np.set_printoptions(precision=4, suppress=True)MatrixCompletion Example
Low-rank counterfactual completion for treated panel cells
MatrixCompletion treats untreated panel cells as observed entries and treated cells as missing counterfactuals. The public panel API is the same as the other high-level panel estimators: fit(Y, W) where Y is a balanced outcome matrix and W is a same-shaped absorbing-treatment indicator.
This example uses a genuinely low-rank untreated panel, adds unit and time effects, masks treated cells through W, and asks MatrixCompletion to fill the counterfactual surface.
Objective and RMSE histories refer to the same post-update iterate. An objective increase no longer satisfies the convergence check. summary(include_matrices=False) omits the four large arrays completed, low_rank, counterfactual, and treatment_effect; diagnostics, effects summaries, and one-dimensional arrays remain available. The default still returns independent owned matrices.
1 Simulate A Low-Rank Panel
rng = np.random.default_rng(4402)

n_units = 52
n_periods = 30
time = np.arange(n_periods)
rank = 2

unit_effects = rng.normal(scale=0.4, size=n_units)
time_effects = 0.05 * time + 0.4 * np.sin(time / 4.0)
loadings = rng.normal(size=(n_units, rank))
factors = np.vstack(
    [
        np.sin(np.linspace(0.0, 2.5 * np.pi, n_periods)),
        np.cos(np.linspace(0.0, 1.5 * np.pi, n_periods)),
    ]
)

Y0 = unit_effects[:, None] + time_effects[None, :] + loadings @ factors
Y = Y0 + rng.normal(scale=0.08, size=Y0.shape)
W = np.zeros_like(Y)

treated_units = np.arange(8)
cohort_starts = np.r_[np.repeat(18, 4), np.repeat(23, 4)]
for unit, start in zip(treated_units, cohort_starts):
    W[unit, start:] = 1.0
    Y[unit, start:] += 0.9 + 0.04 * np.arange(n_periods - start)

true_att = float((Y - Y0)[W == 1].mean())
print("Y shape:", Y.shape)
print("treated cells:", int(W.sum()))
print("true ATT:", round(true_att, 4))
Y shape: (52, 30)
treated cells: 76
true ATT: 1.0852 Fit Matrix Completion
model = MatrixCompletion(
    lambda_fraction=0.20,
    fit_unit_effects=True,
    fit_time_effects=True,
    max_iterations=400,
    tolerance=1e-6,
)
model.fit(Y, W)
summary = model.summary()

print("estimated ATT:", round(float(summary["att"]), 4))
print("lambda_l:", round(float(summary["lambda_l"]), 4))
print(
    "fit diagnostics:",
    {key: summary[key] for key in ["converged", "iterations", "termination_reason", "objective"]},
)
print("final observed-cell RMSE:", round(float(summary["history_rmse"][-1]), 4))
estimated ATT: 1.1784
lambda_l: 0.0088
fit diagnostics: {'converged': True, 'iterations': 7, 'termination_reason': 'Relative objective tolerance reached', 'objective': 0.36268185281652116}
final observed-cell RMSE: 0.2593completed = np.asarray(summary["completed"])
counterfactual = np.asarray(summary["counterfactual"])
treatment_effect = np.asarray(summary["treatment_effect"])
fig, axes = plt.subplots(1, 3, figsize=(13, 4.0), constrained_layout=True)
for ax, matrix, title in [
(axes[0], Y, "Observed Y"),
(axes[1], counterfactual, "Counterfactual Surface"),
(axes[2], treatment_effect, "Observed - Counterfactual"),
]:
im = ax.imshow(matrix, aspect="auto", cmap="viridis")
ax.set_title(title)
ax.set_xlabel("Period")
ax.set_ylabel("Unit")
fig.colorbar(im, ax=ax, shrink=0.78)
plt.show()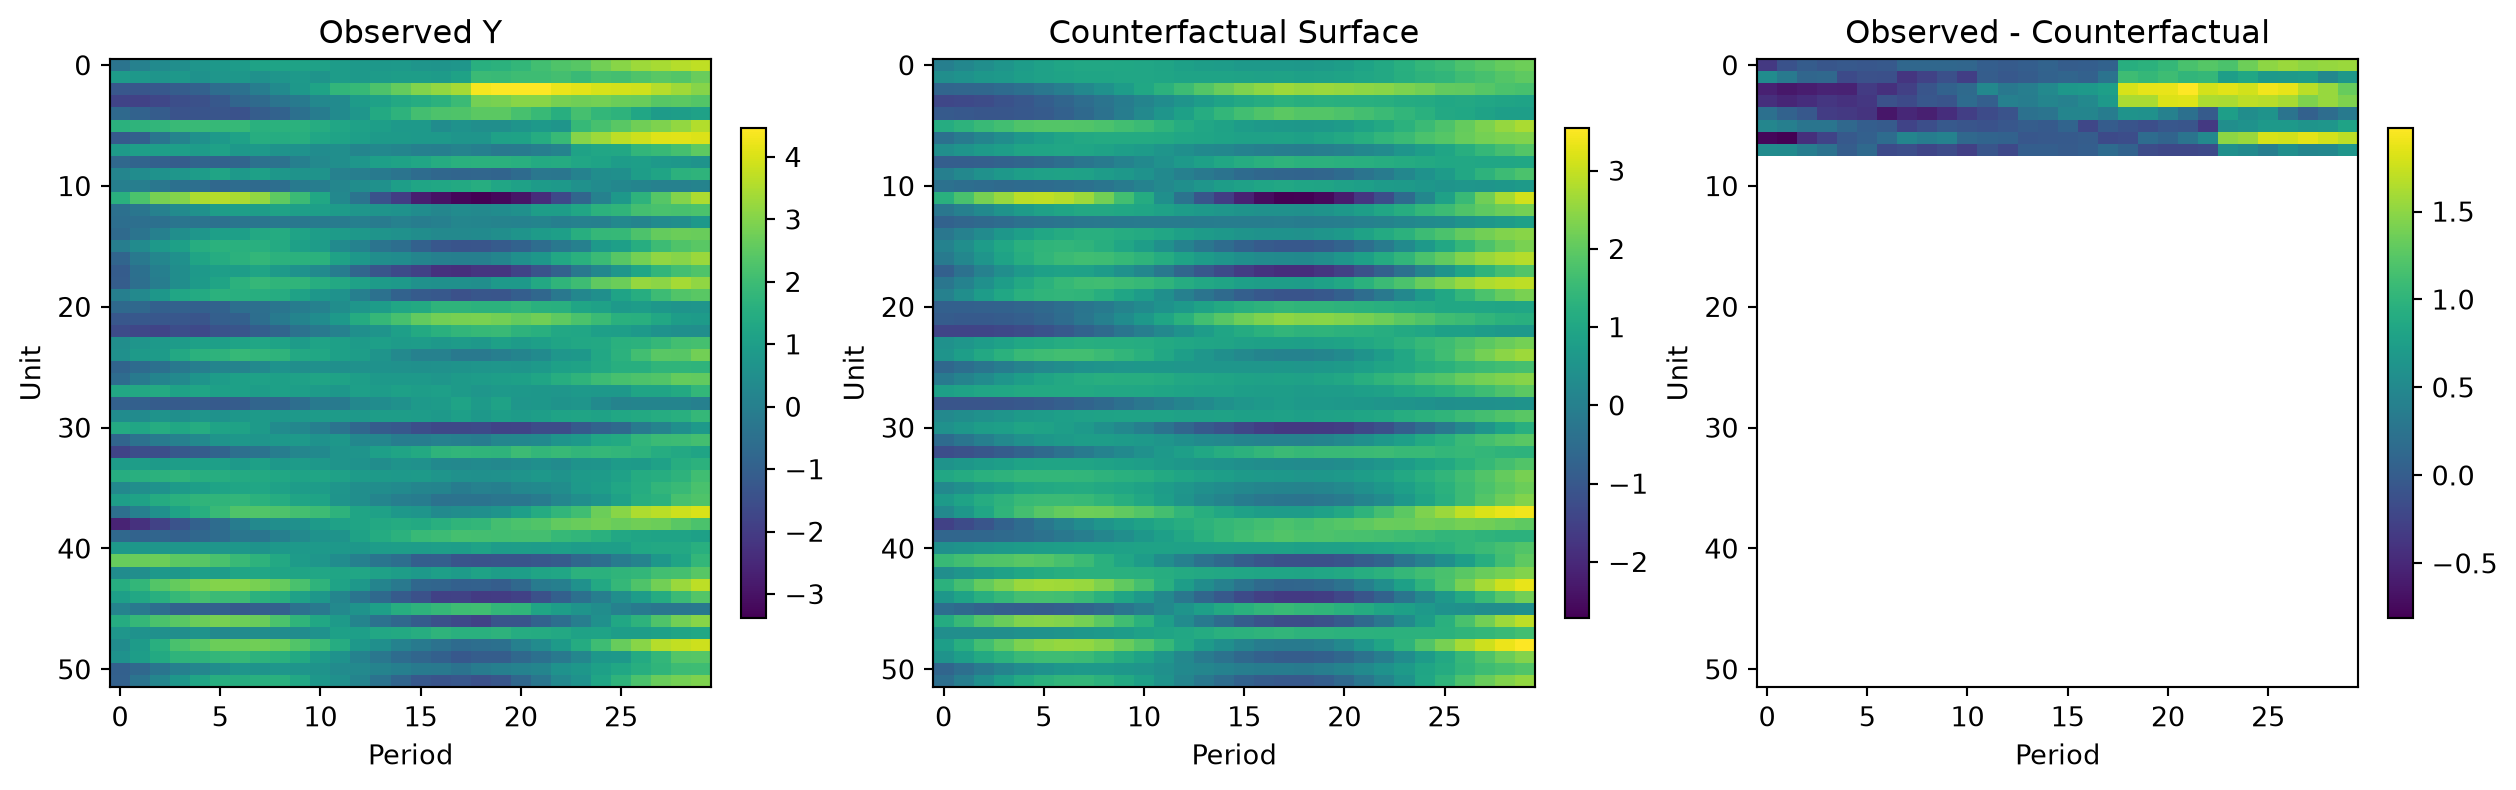
summary() also returns the low-rank component, singular values, event-study summaries, and group means. The important contract is that the estimator owns the panel bookkeeping: users supply matrices, not hand-built donor lists or long data frames.