Do Powerful Politicians Really Cause Corporate Downsizing? — expanded estimators
Archive index · Regression tests · Results & settings (JSON) · Methods & code
Snyder and Welch (2017), JPE. https://doi.org/10.1086/694204
21 specifications. Effects are in outcome standard deviations; intervals are 95%.
Treatment adoption

S02-P017: seeded sample of 100 of 8,642 eligible units. Purple untreated; yellow treated; white unobserved.
AM005-P2587-T2-CAPEX-ACTUAL
160,503 observations · 14,831 units · 2,018 clusters · 843 treated / 13,988 control units.
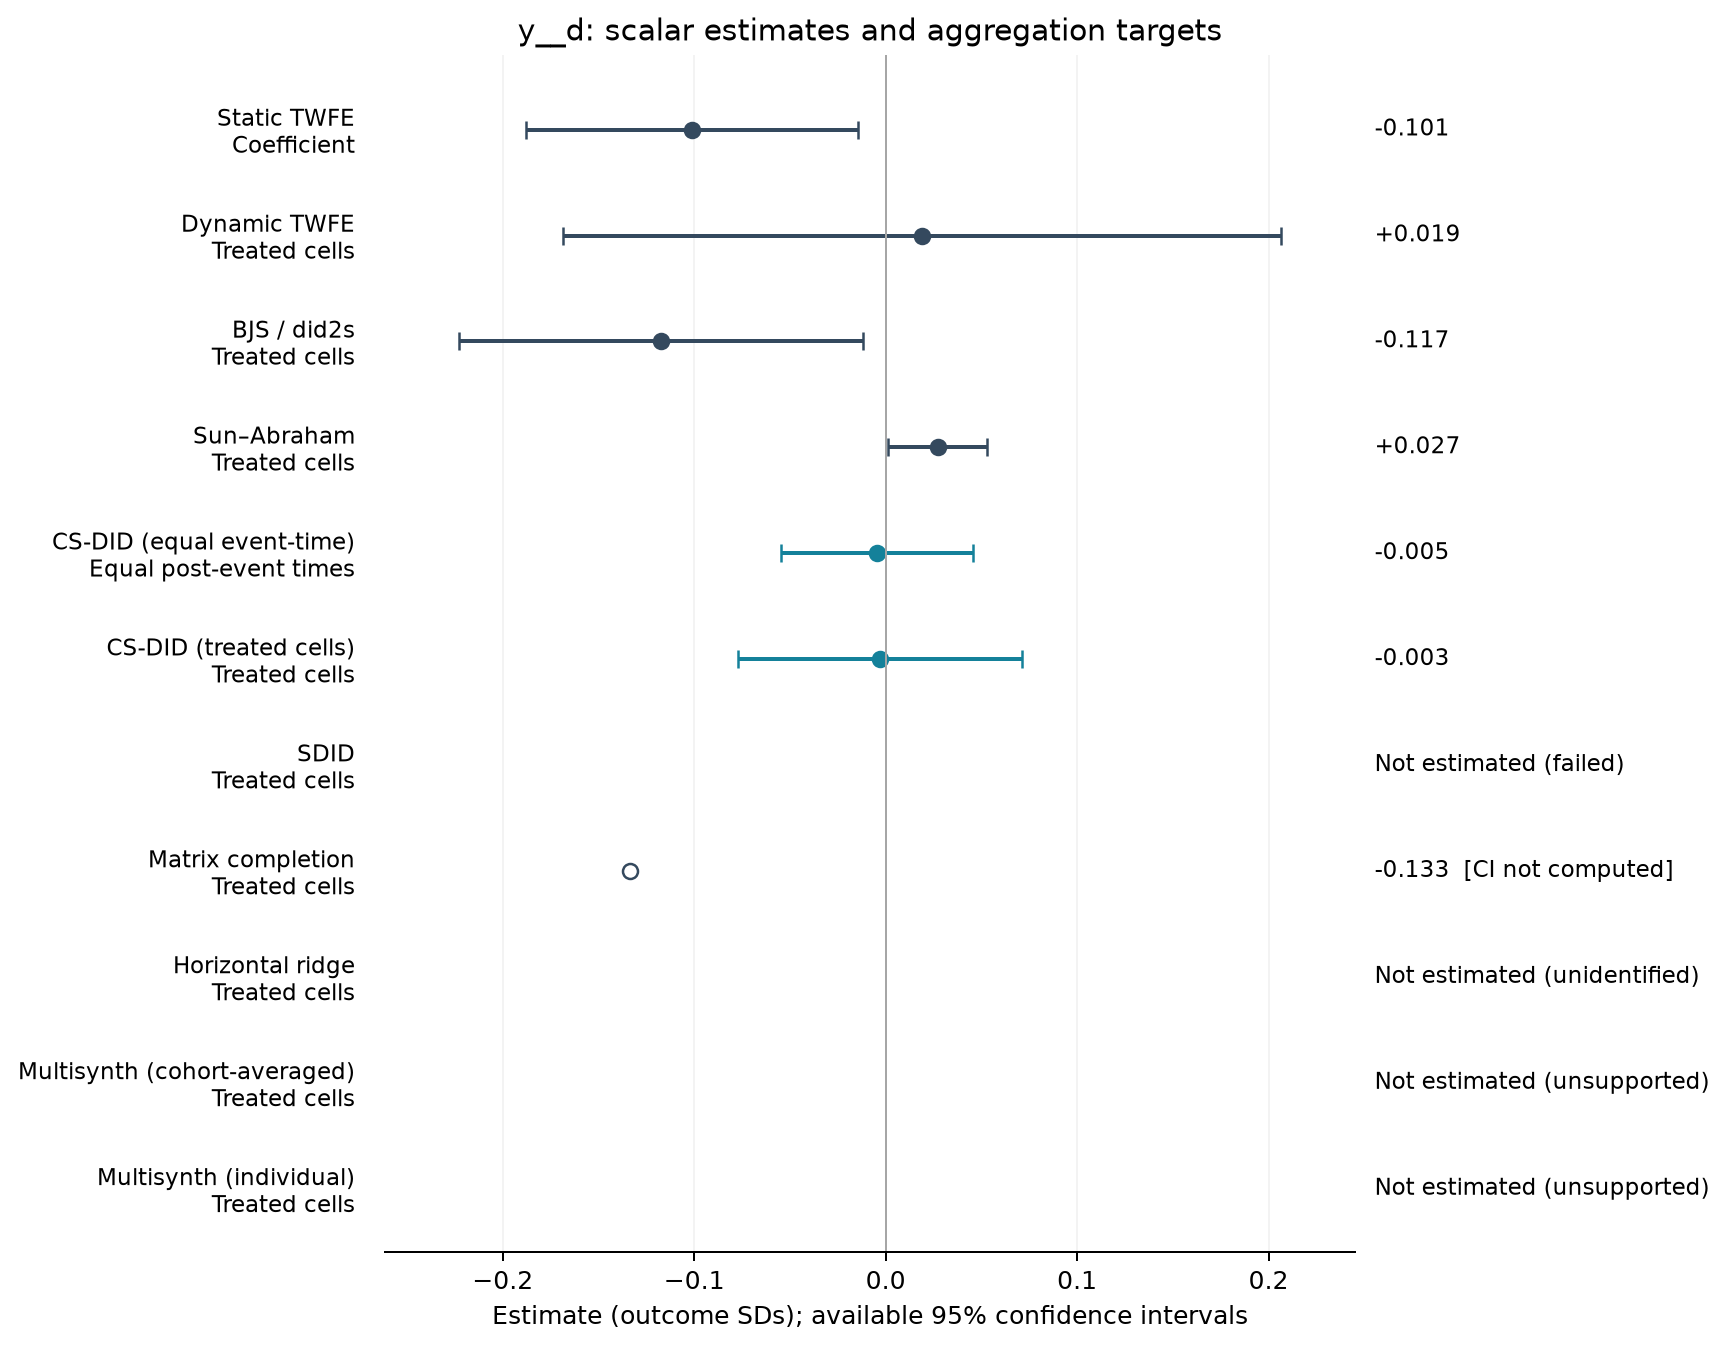
Estimate comparison
| Estimator | Estimate (SDs) | SE | 95% CI | Averaging |
|---|---|---|---|---|
| Static TWFE | -0.101 | 0.044 | [-0.188, -0.014] | Coefficient |
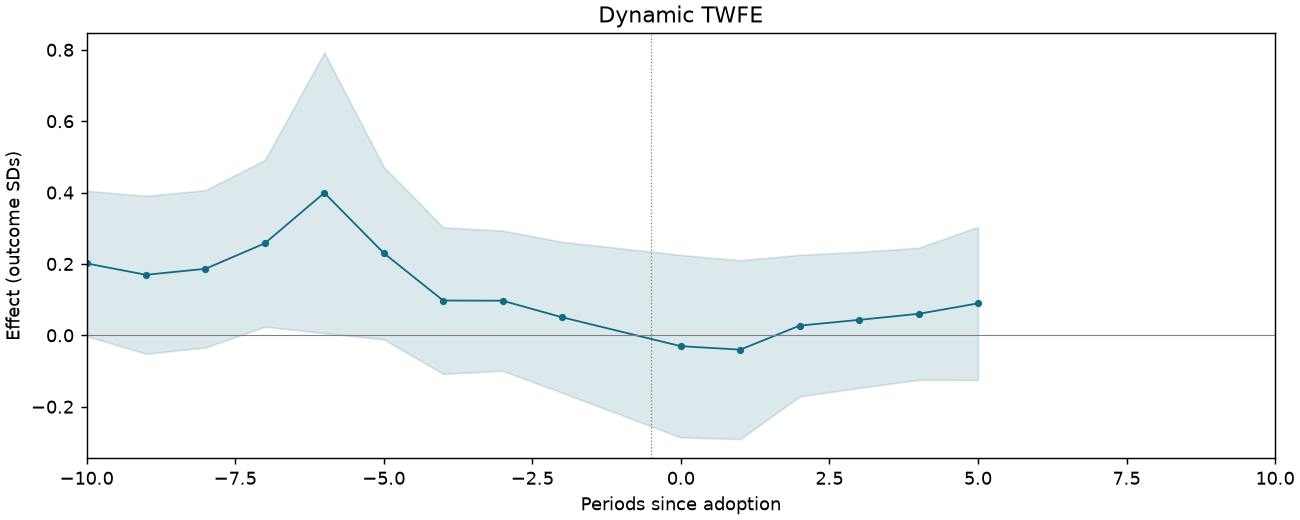
| Dynamic TWFE | 0.019 | 0.096 | [-0.169, 0.207] | Treated cells |
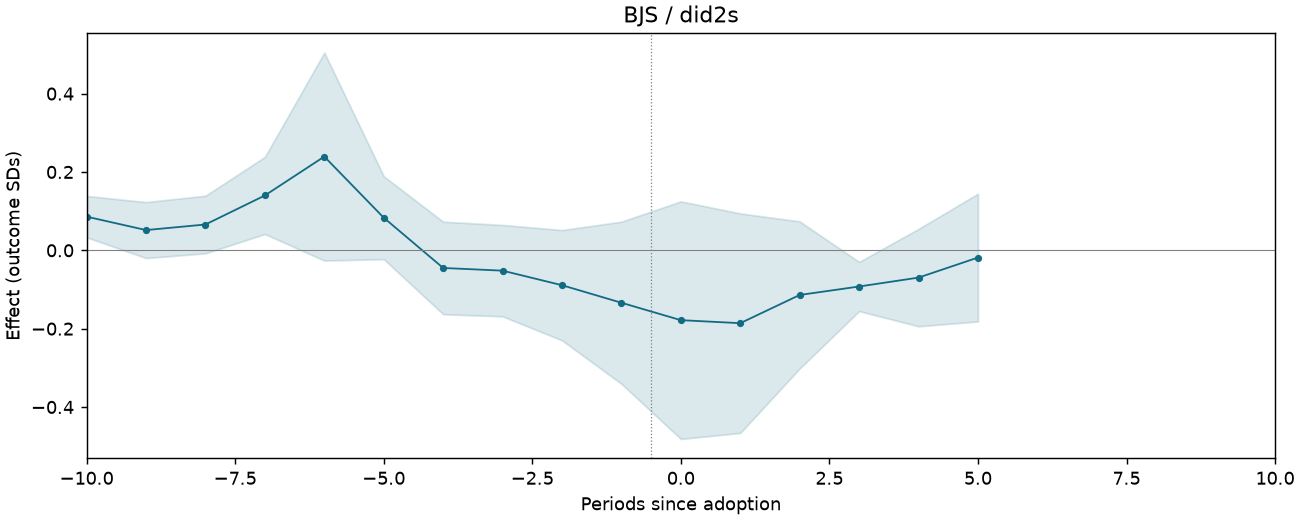
| BJS / did2s | -0.117 | 0.054 | [-0.223, -0.012] | Treated cells |
| Sun–Abraham | 0.027 | 0.013 | [0.001, 0.053] | Treated cells |
| CS-DID (equal event-time) | -0.005 | 0.026 | [-0.055, 0.045] | Equal post-event times |
| CS-DID (treated cells) | -0.003 | 0.038 | [-0.077, 0.071] | Treated cells |
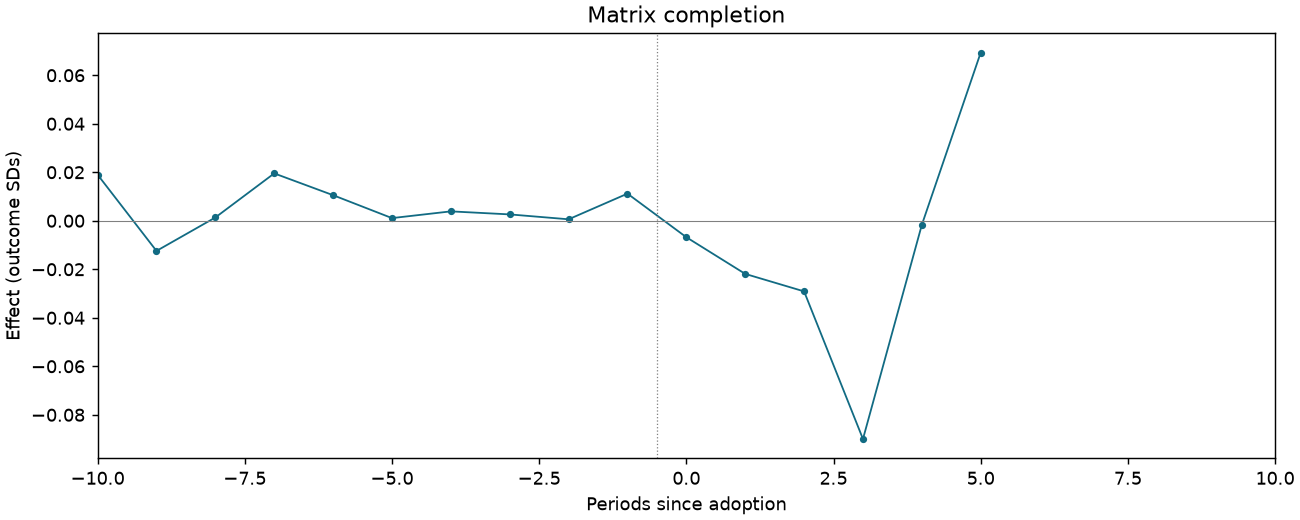
| Matrix completion | -0.133 | — | — | Treated cells |
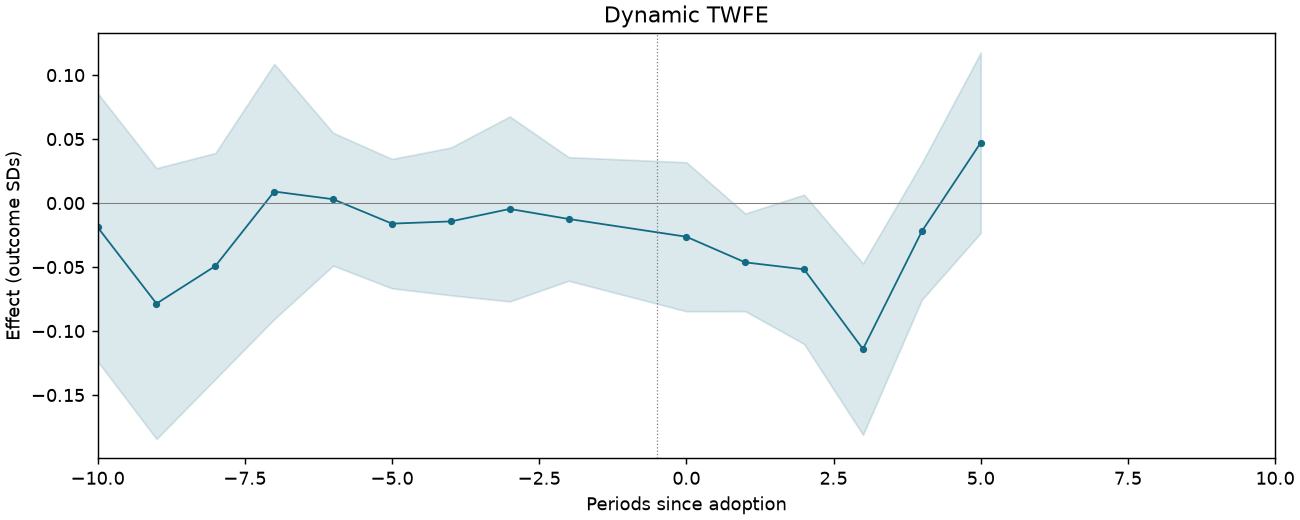
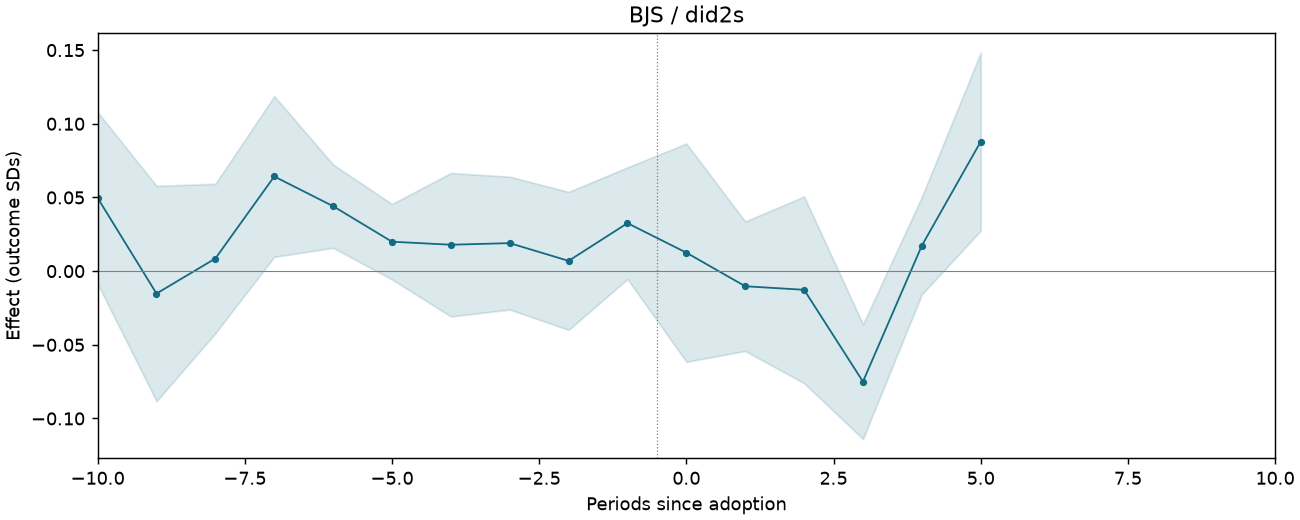
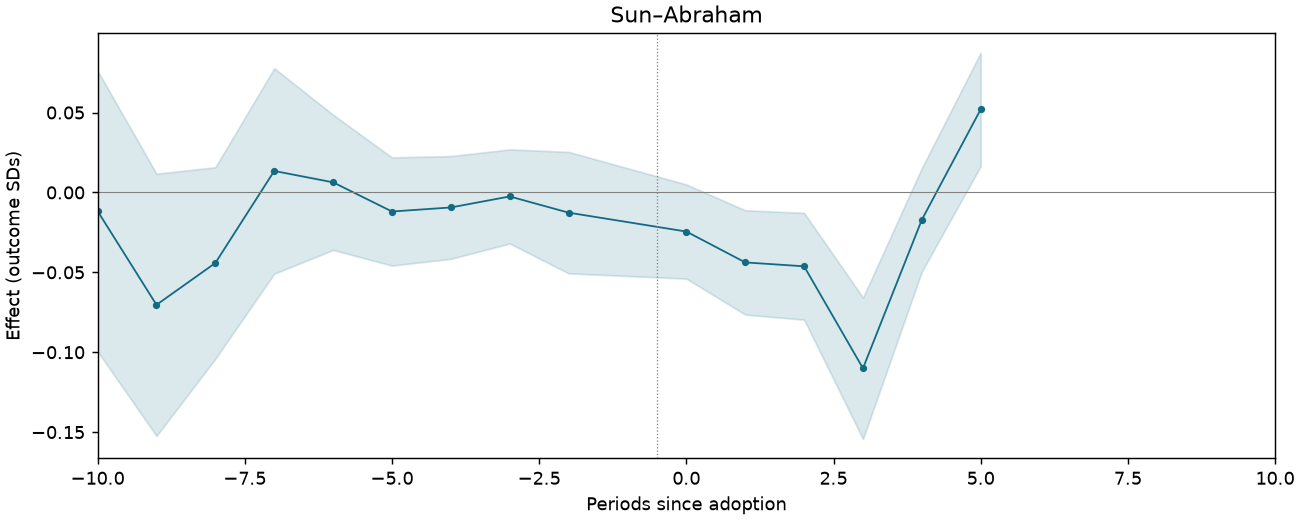
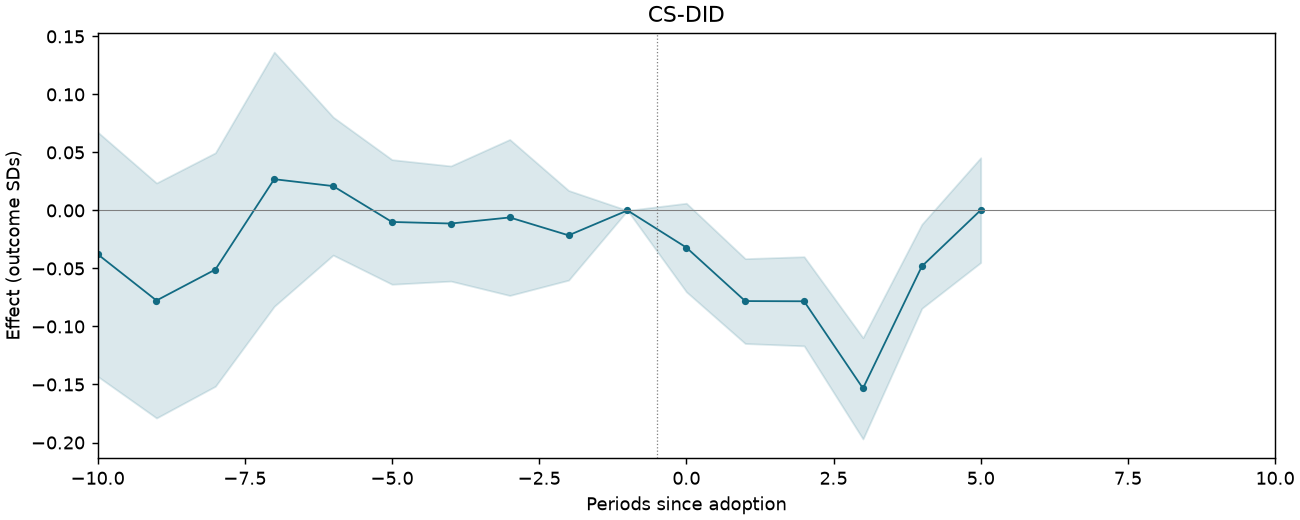
Event studies
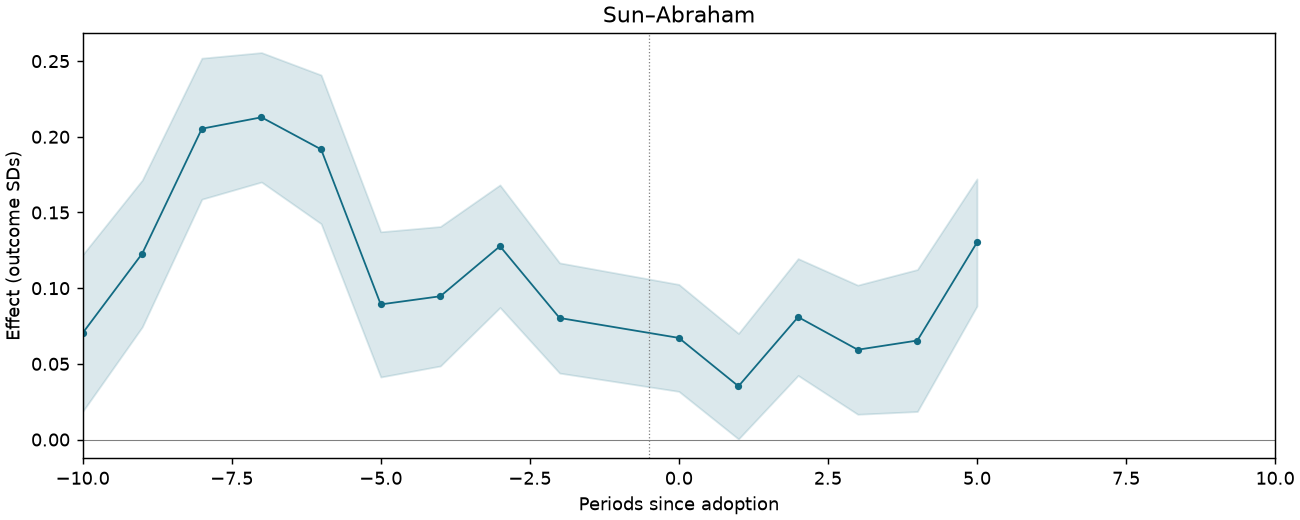
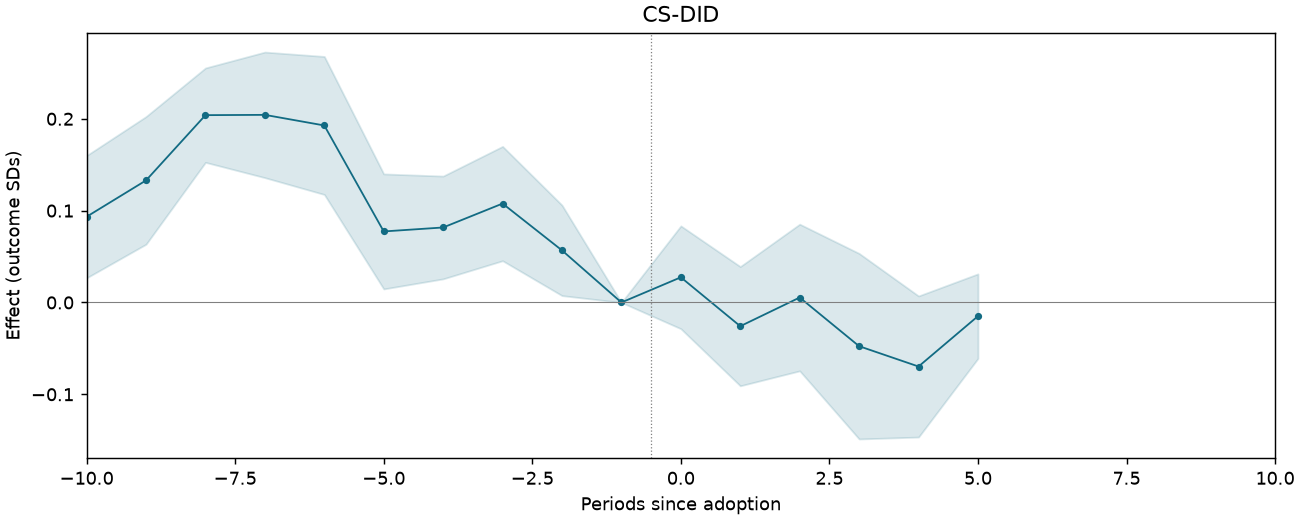
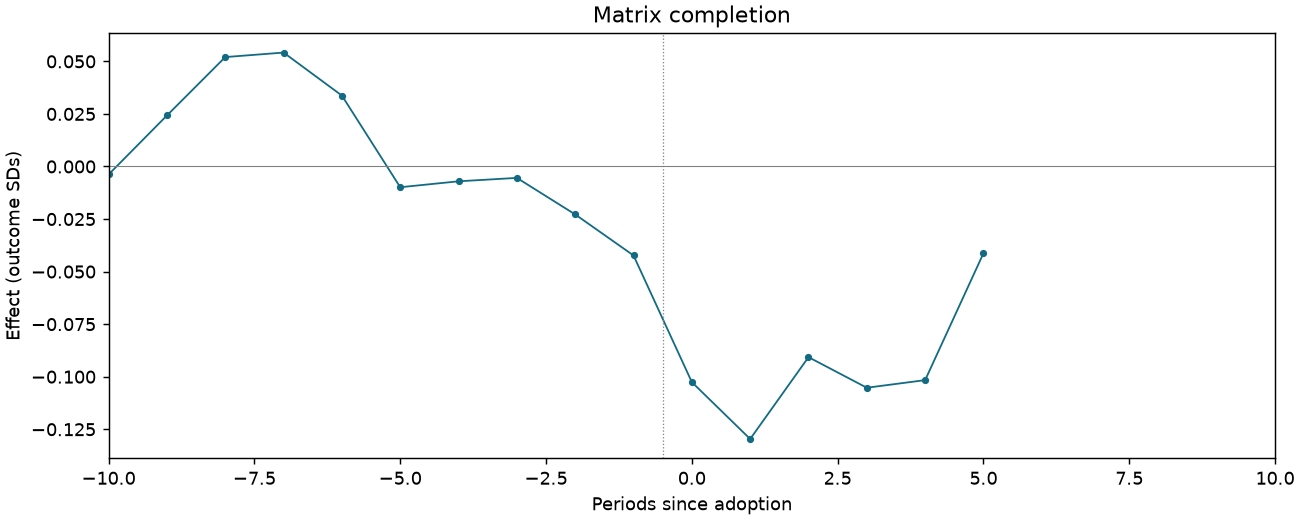
Periods −10 to +10; pointwise 95% intervals where available.
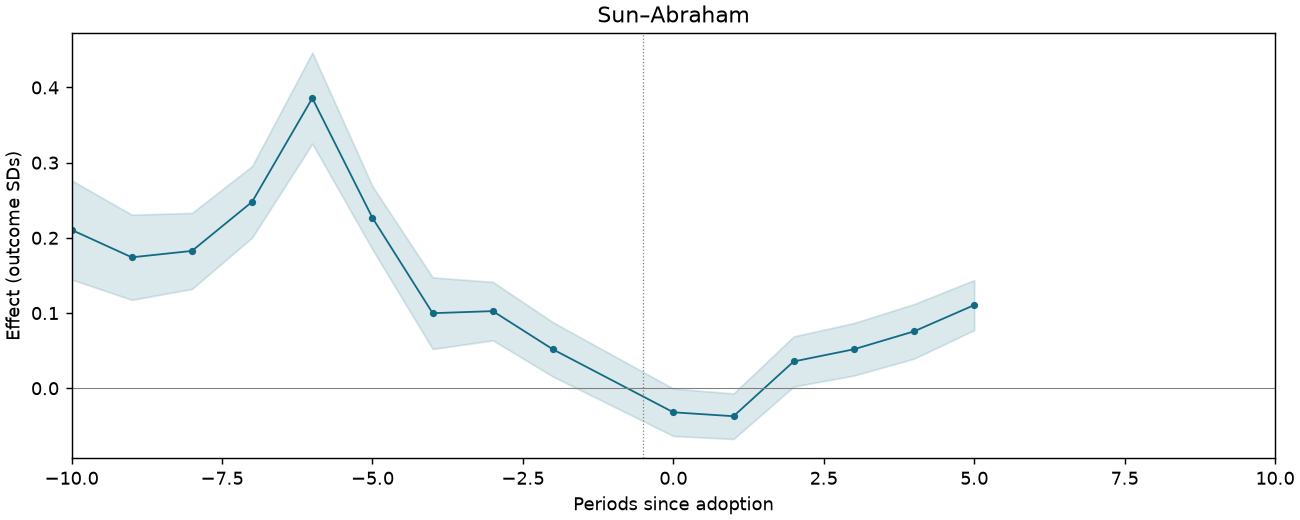
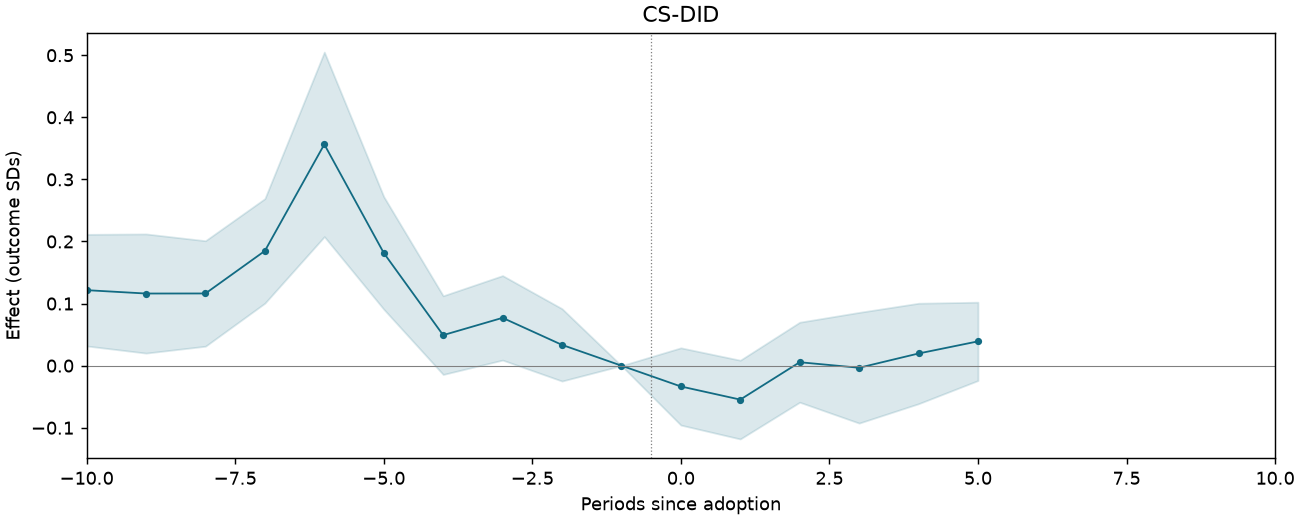
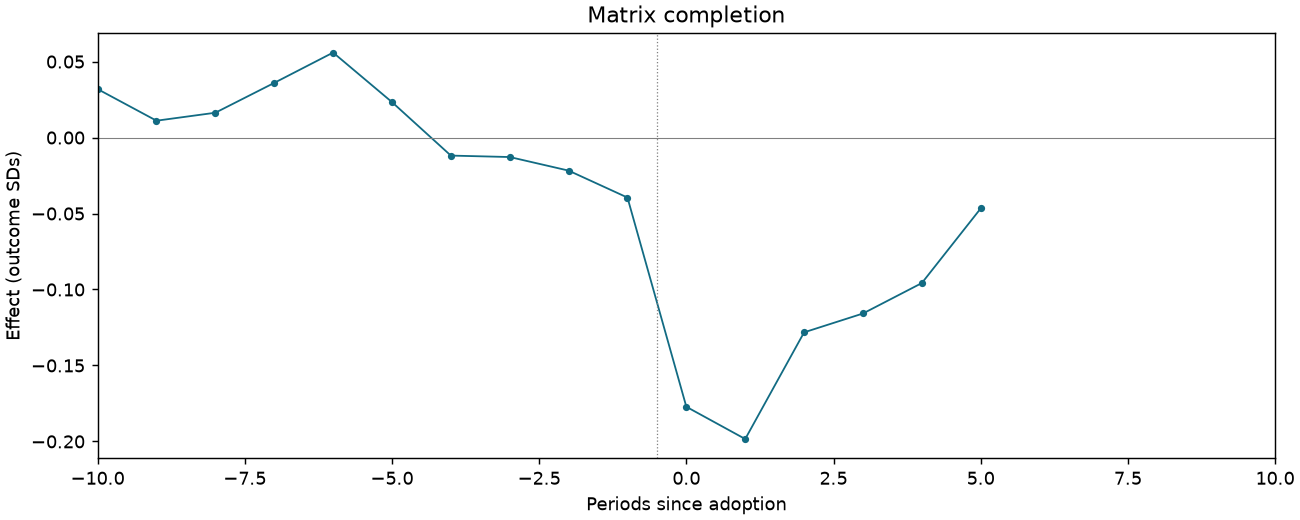
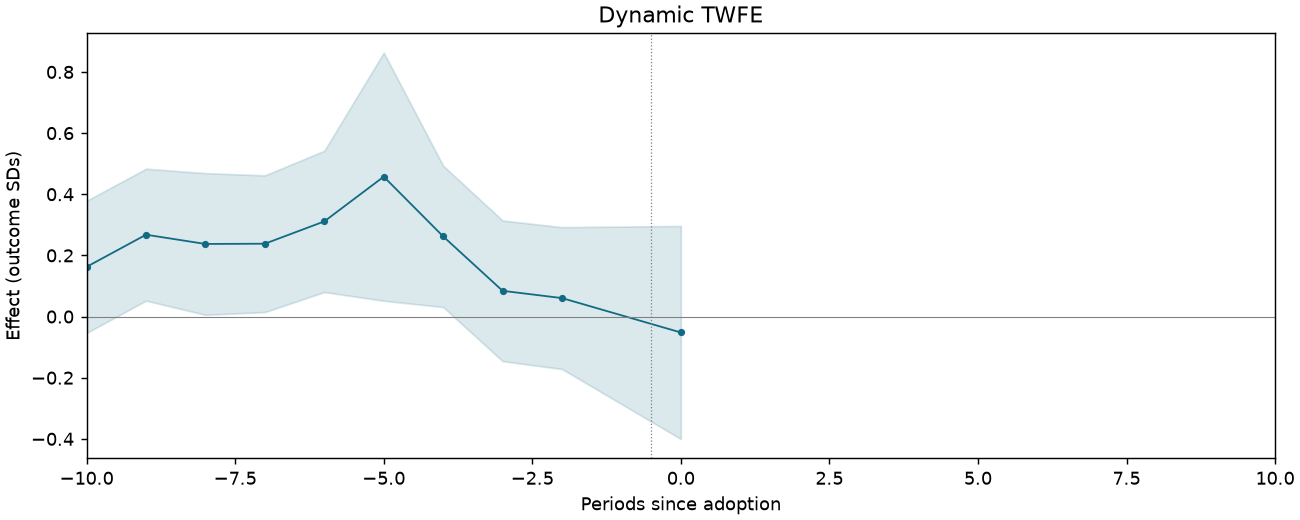
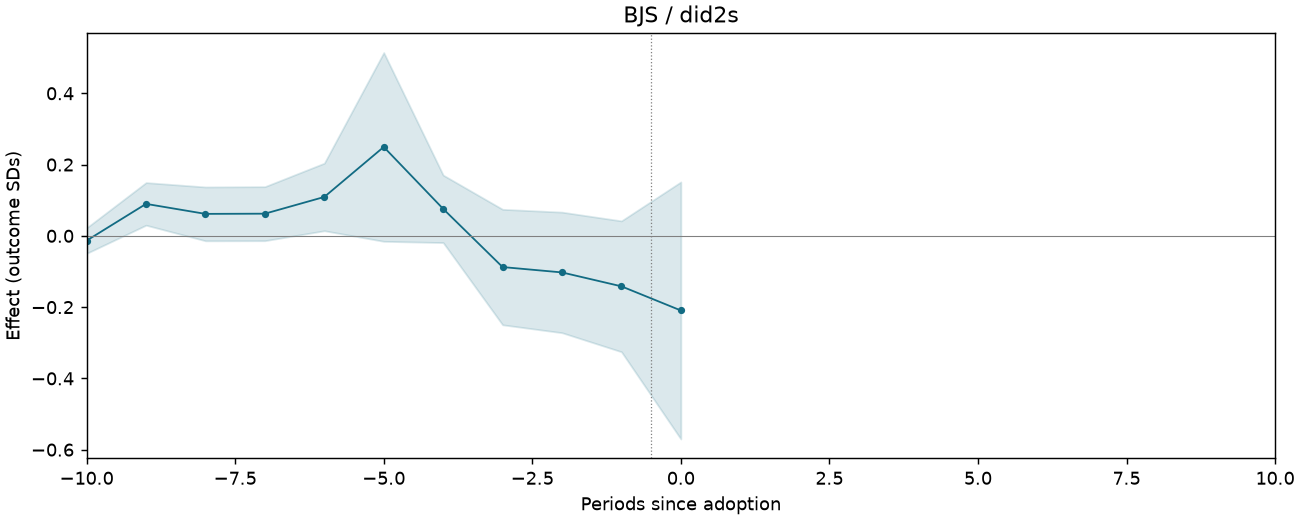
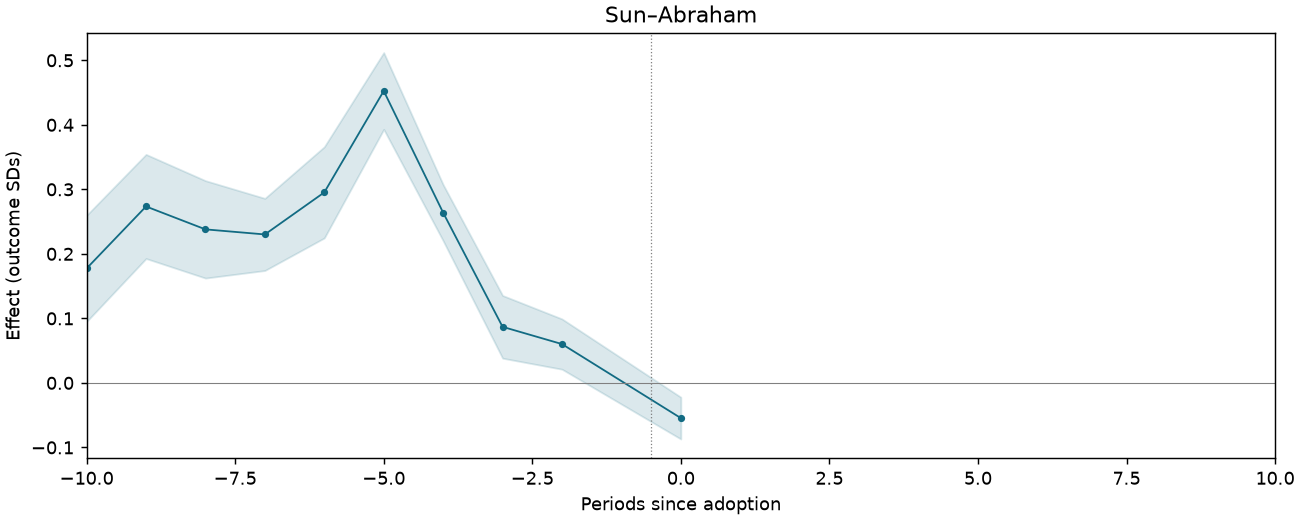
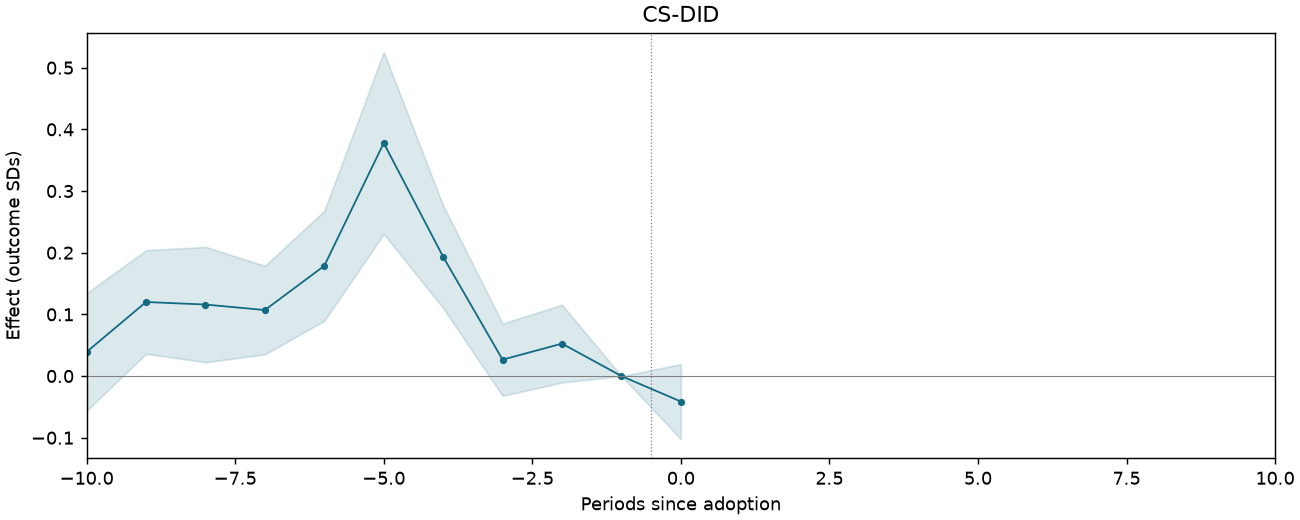
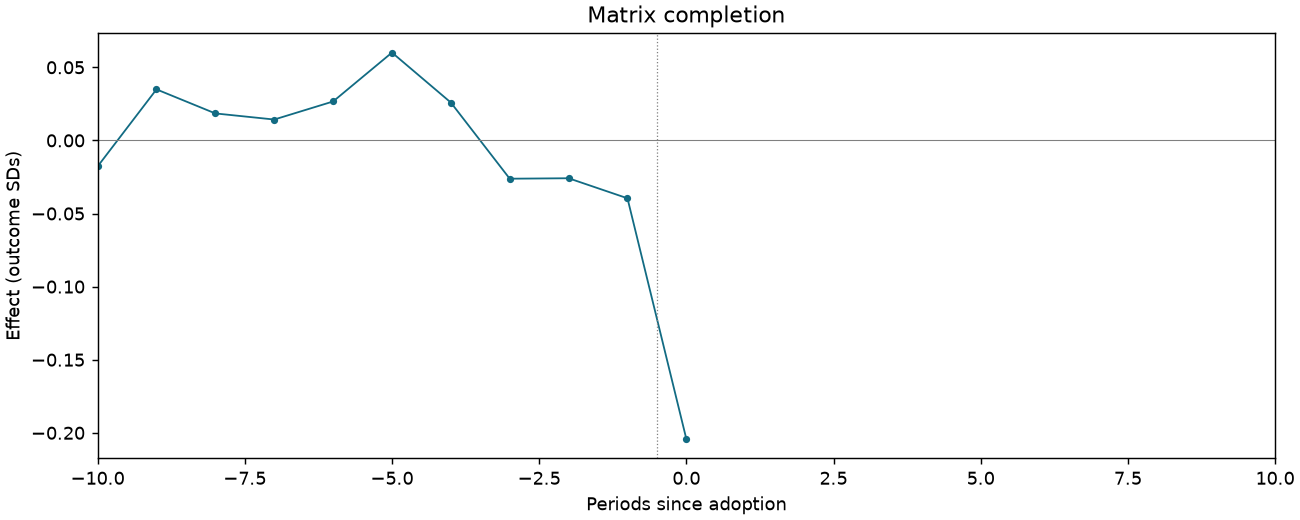
AM005-P2587-T2-CAPEX-NOOV-M1
158,170 observations · 14,949 units · 2,015 clusters · 824 treated / 14,125 control units.
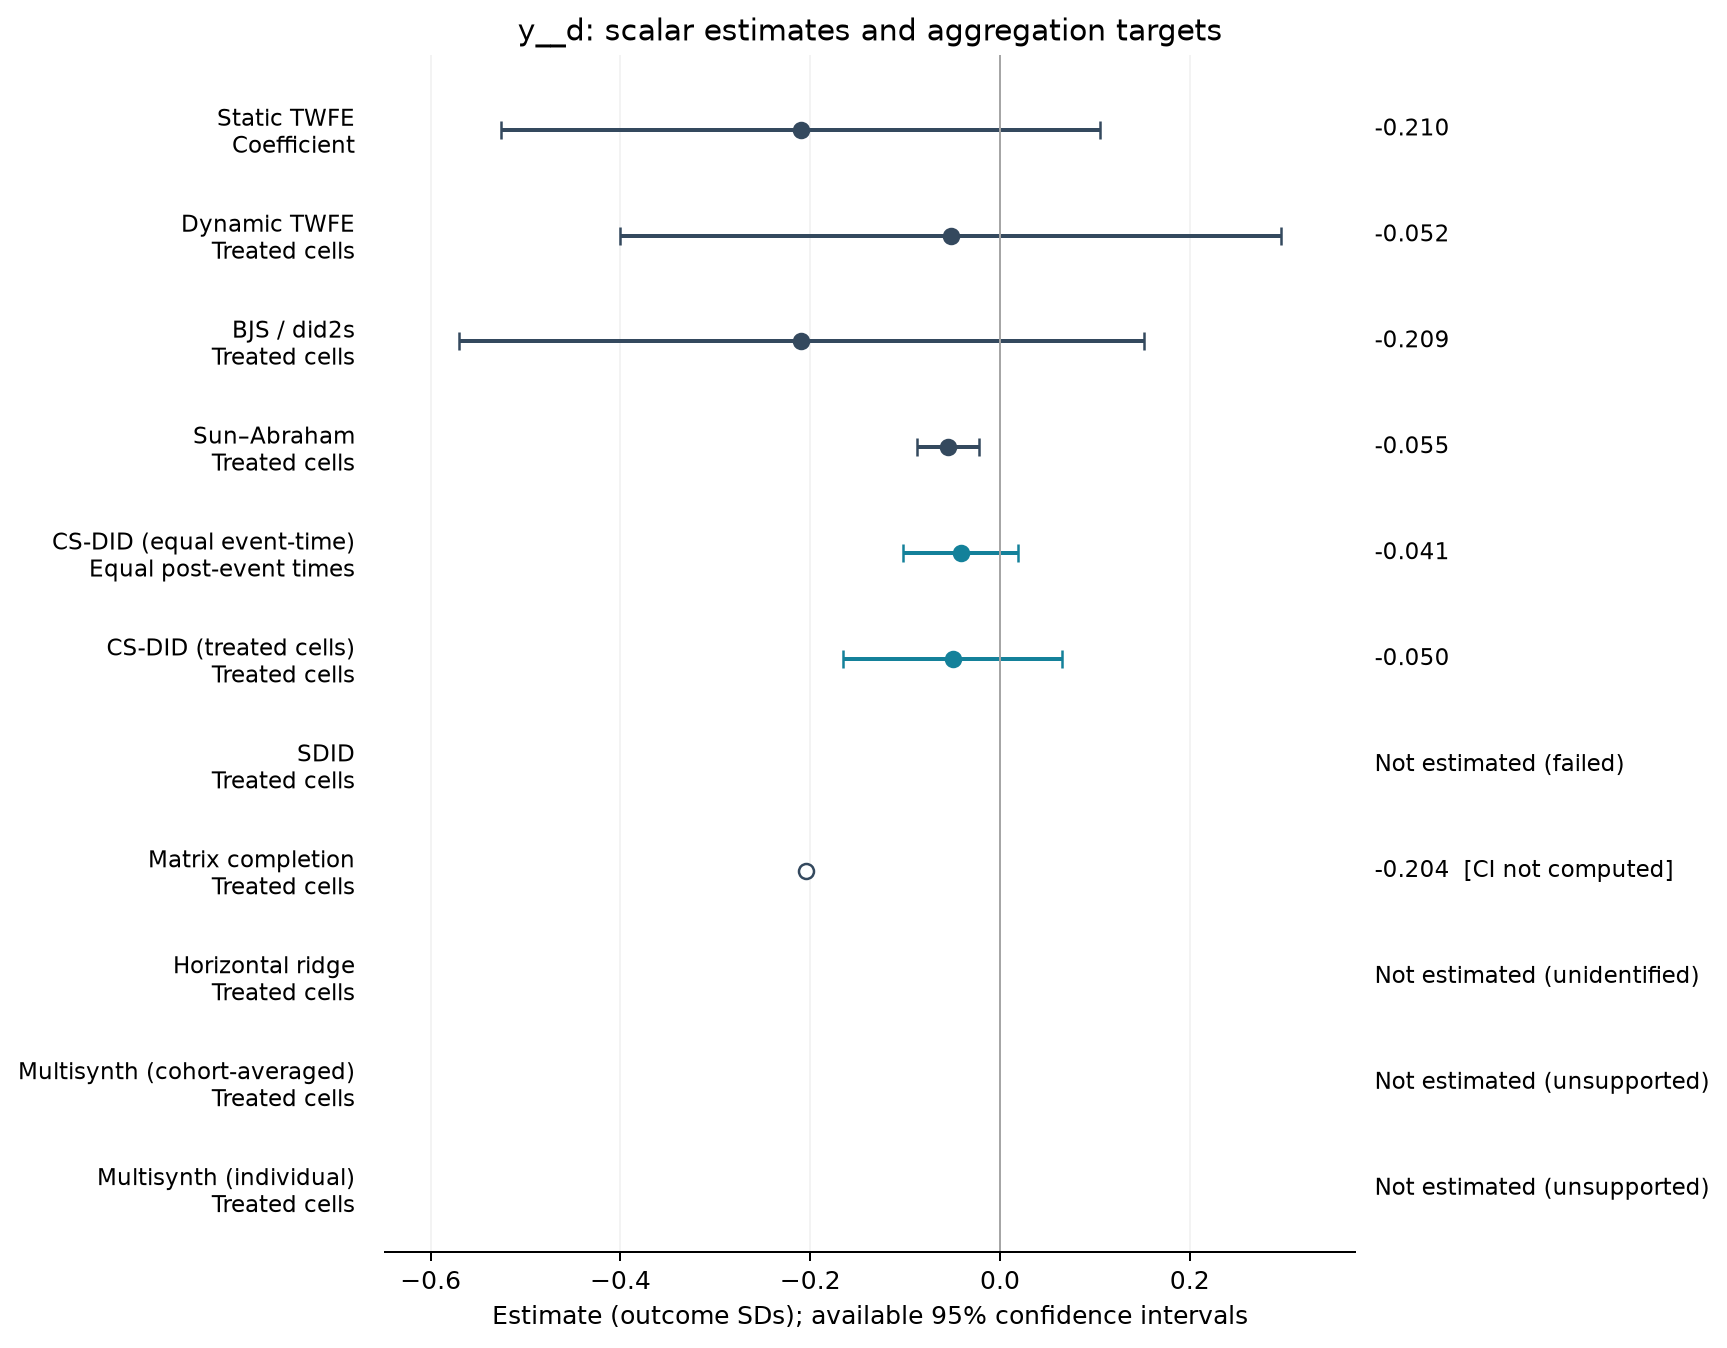
Estimate comparison
| Estimator | Estimate (SDs) | SE | 95% CI | Averaging |
|---|---|---|---|---|
| Static TWFE | -0.210 | 0.161 | [-0.525, 0.105] | Coefficient |
| Dynamic TWFE | -0.052 | 0.178 | [-0.400, 0.296] | Treated cells |
| BJS / did2s | -0.209 | 0.184 | [-0.570, 0.151] | Treated cells |
| Sun–Abraham | -0.055 | 0.017 | [-0.087, -0.022] | Treated cells |
| CS-DID (equal event-time) | -0.041 | 0.031 | [-0.102, 0.019] | Equal post-event times |
| CS-DID (treated cells) | -0.050 | 0.059 | [-0.166, 0.066] | Treated cells |
| Matrix completion | -0.204 | — | — | Treated cells |
Event studies
Periods −10 to +10; pointwise 95% intervals where available.
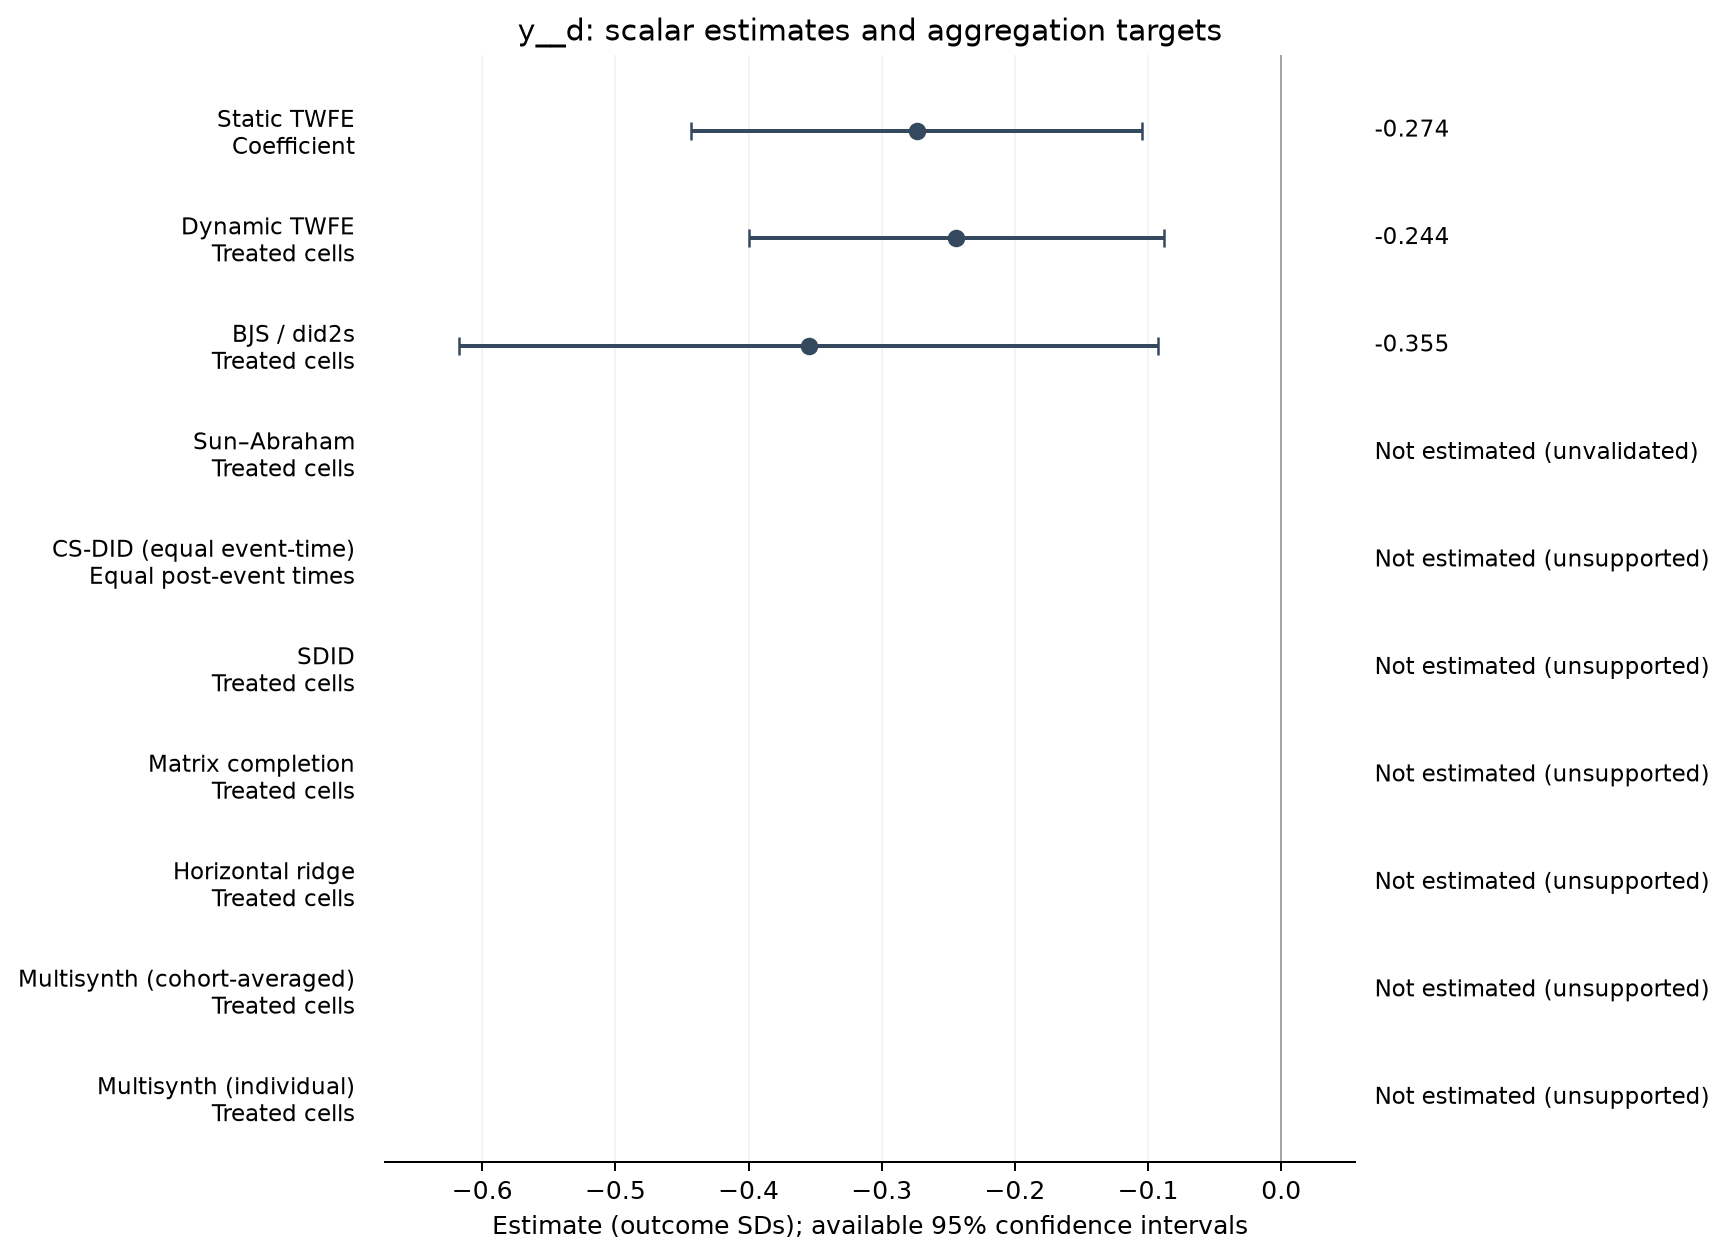
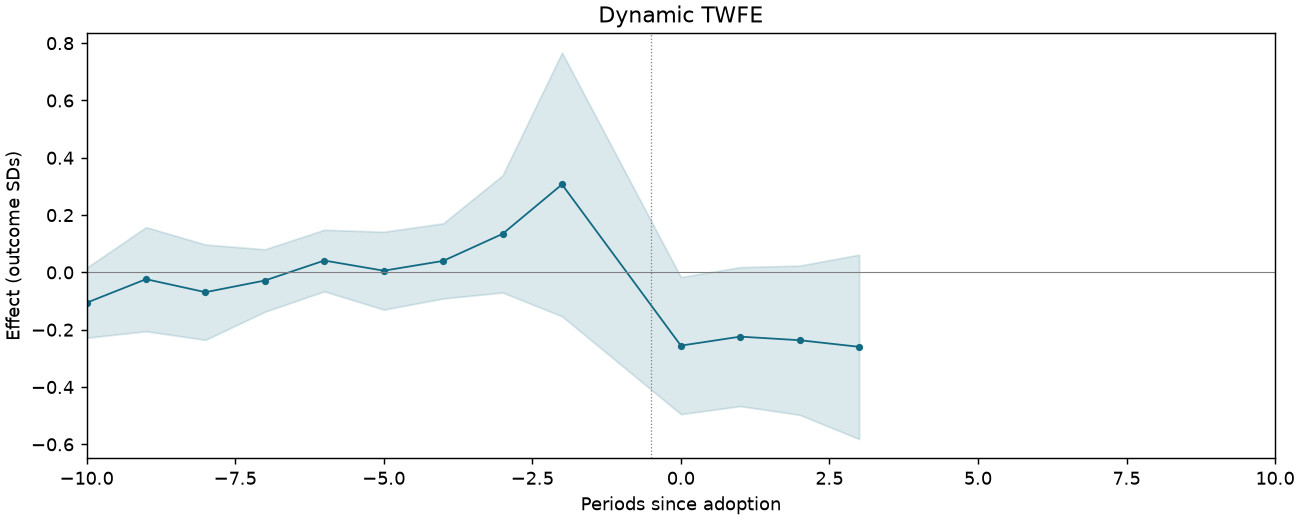
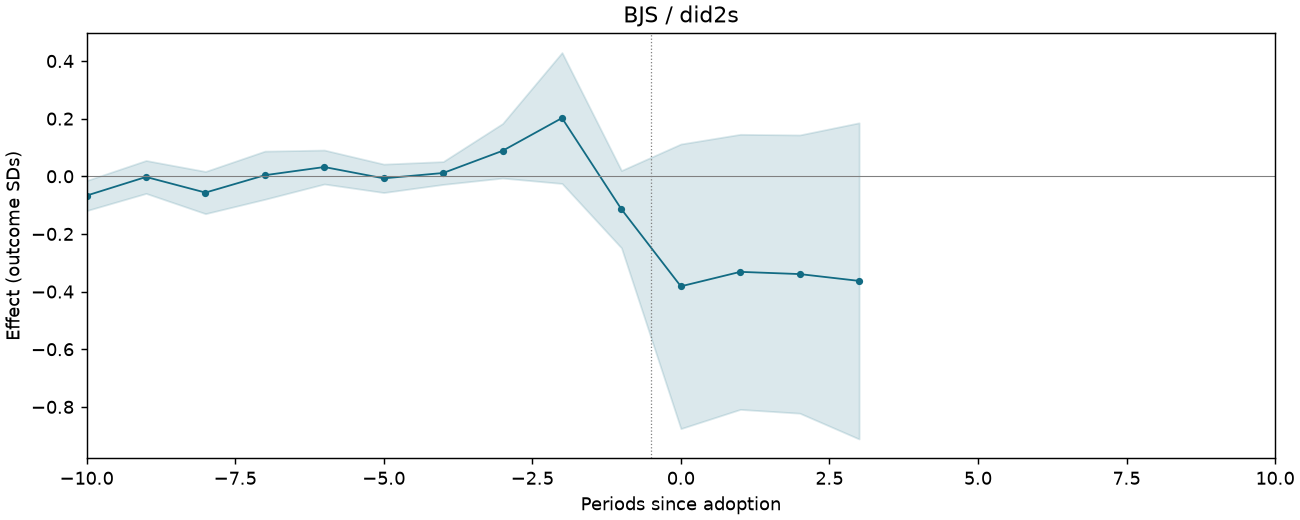
AM005-P2587-T2-CAPEX-NOOV-M4M1
157,555 observations · 14,903 units · 2,013 clusters · 904 treated / 13,999 control units.
Estimate comparison
| Estimator | Estimate (SDs) | SE | 95% CI | Averaging |
|---|---|---|---|---|
| Static TWFE | -0.274 | 0.086 | [-0.443, -0.104] | Coefficient |
| Dynamic TWFE | -0.244 | 0.080 | [-0.400, -0.088] | Treated cells |
| BJS / did2s | -0.355 | 0.134 | [-0.617, -0.092] | Treated cells |
Event studies
Periods −10 to +10; pointwise 95% intervals where available.
AM005-P2587-T2-CAPEX-QP-M1
159,423 observations · 14,746 units · 2,018 clusters · 826 treated / 13,920 control units.
Estimate comparison
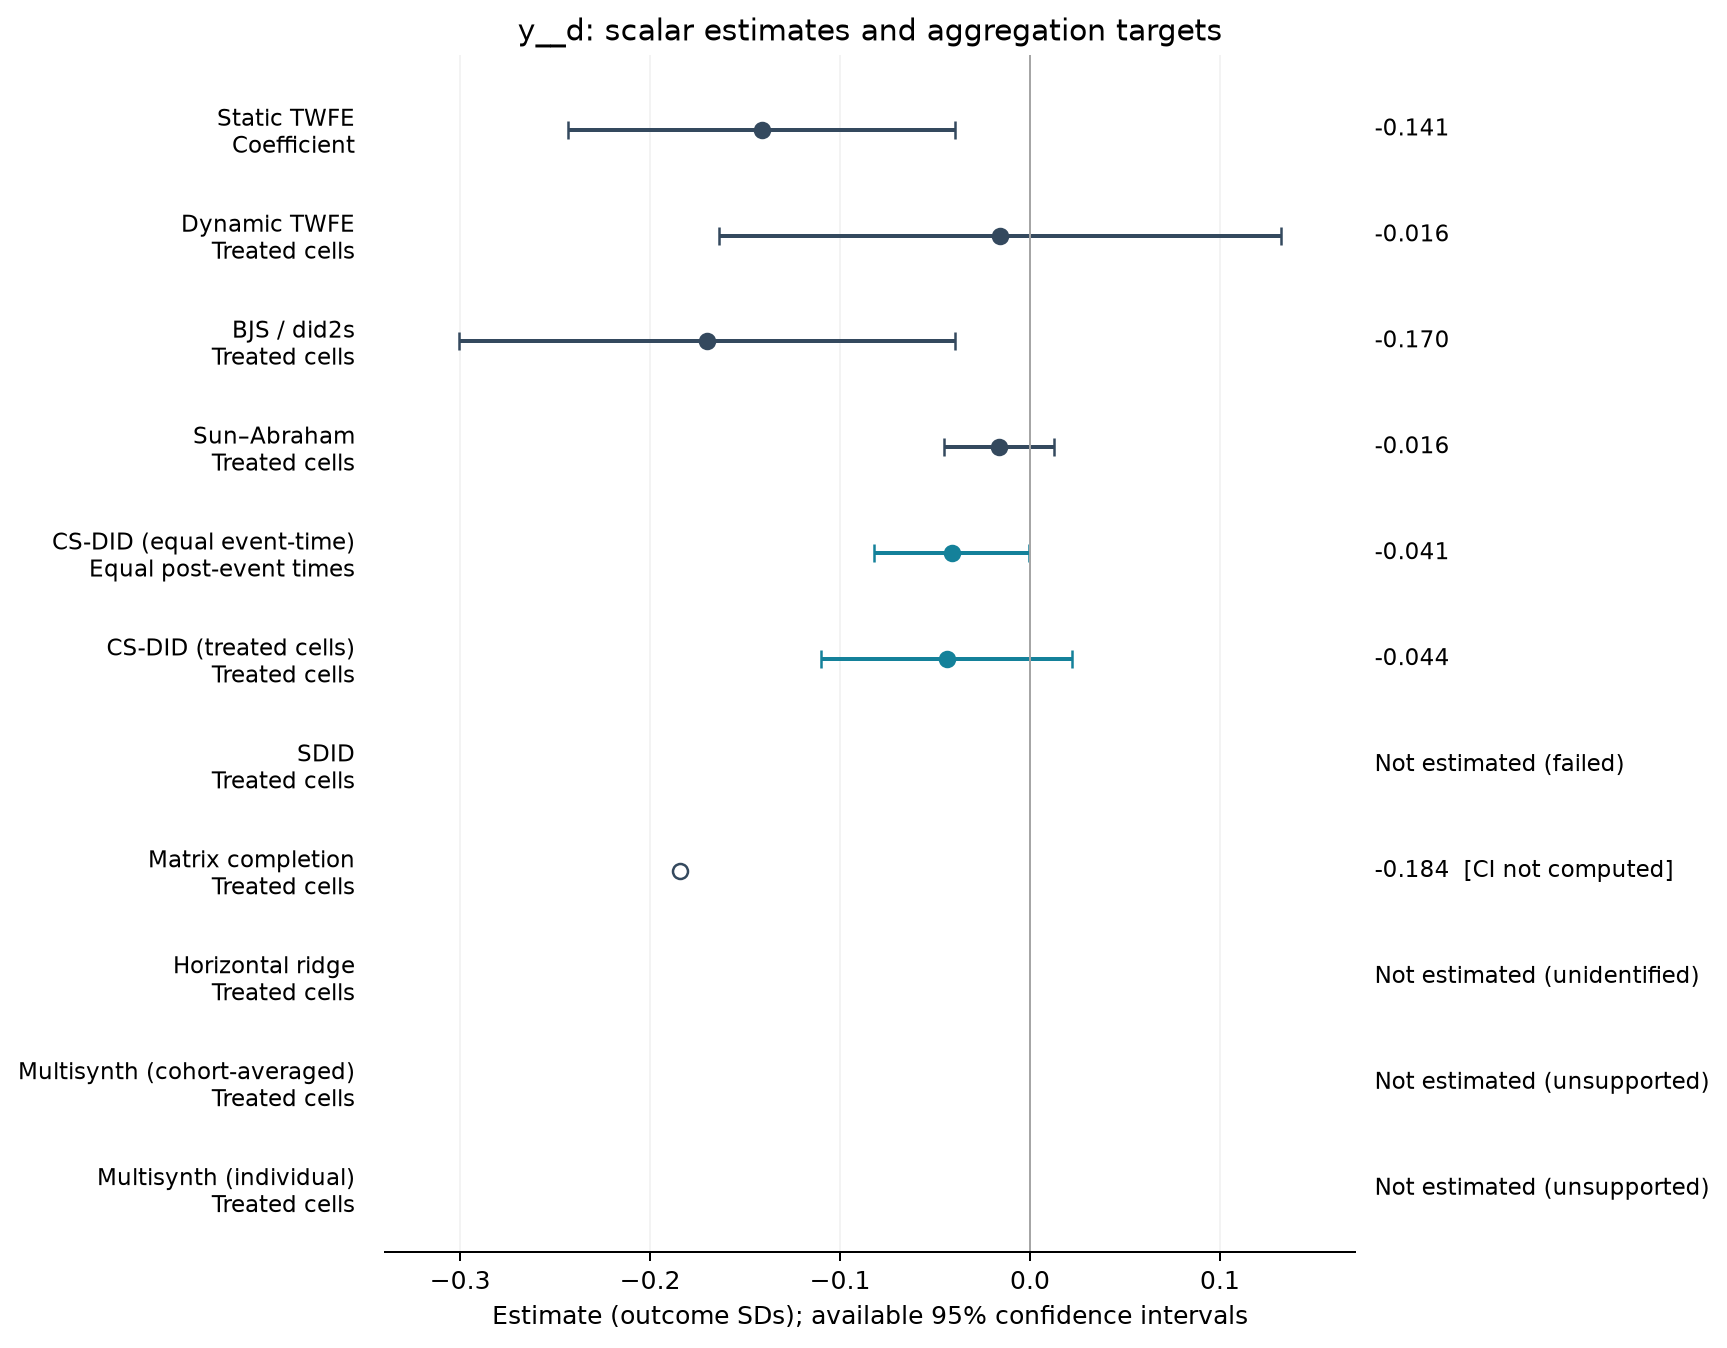
| Estimator | Estimate (SDs) | SE | 95% CI | Averaging |
|---|---|---|---|---|
| Static TWFE | -0.141 | 0.052 | [-0.243, -0.039] | Coefficient |
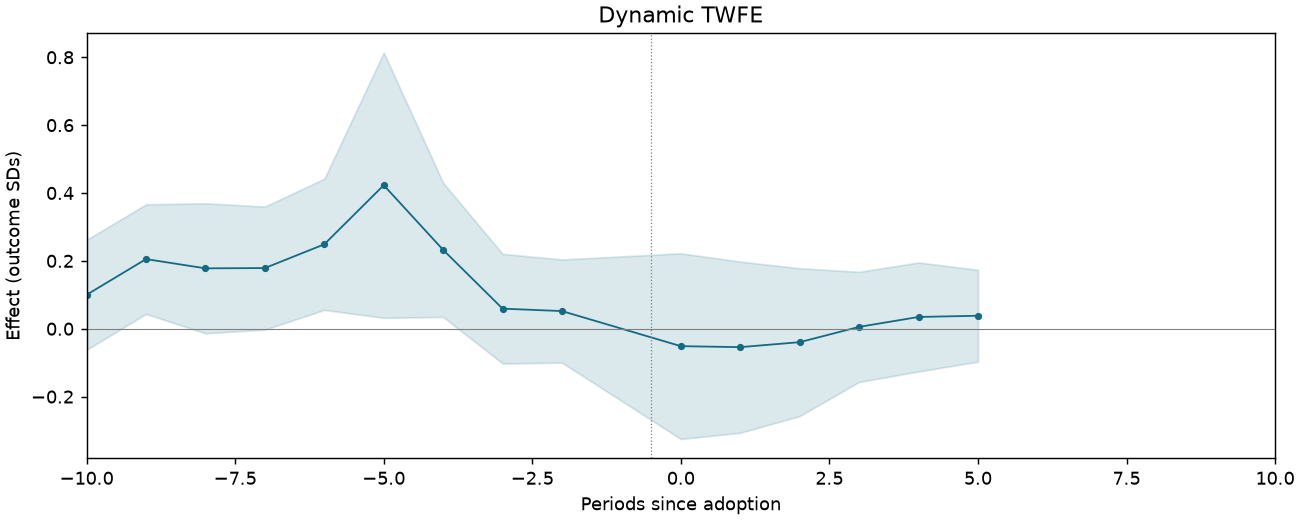
| Dynamic TWFE | -0.016 | 0.075 | [-0.164, 0.132] | Treated cells |
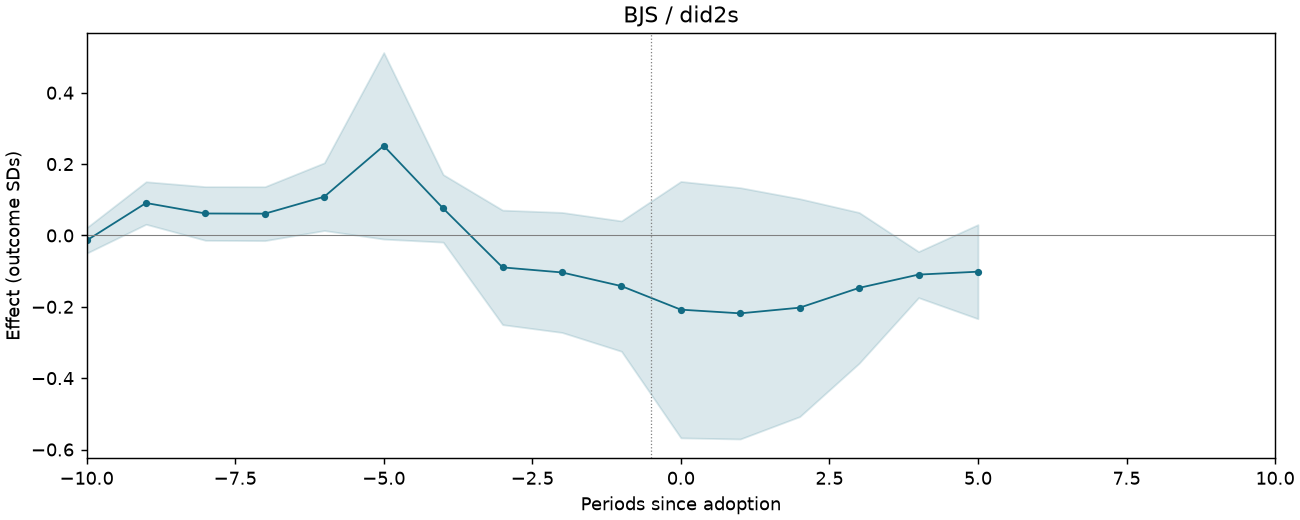
| BJS / did2s | -0.170 | 0.067 | [-0.301, -0.040] | Treated cells |
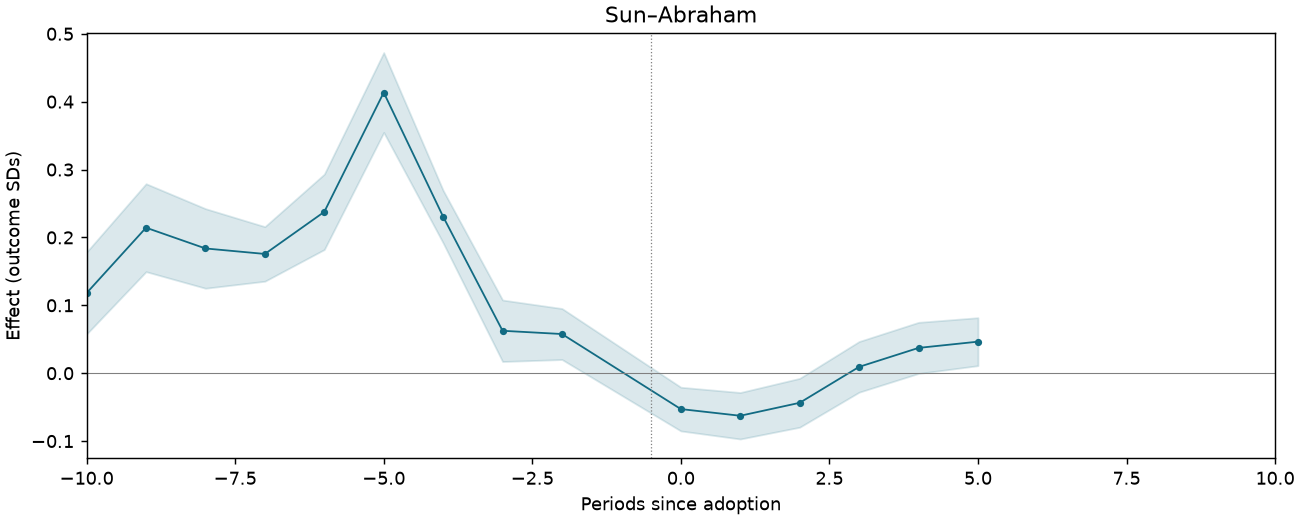
| Sun–Abraham | -0.016 | 0.015 | [-0.045, 0.013] | Treated cells |
| CS-DID (equal event-time) | -0.041 | 0.021 | [-0.082, -0.000] | Equal post-event times |
| CS-DID (treated cells) | -0.044 | 0.034 | [-0.110, 0.022] | Treated cells |
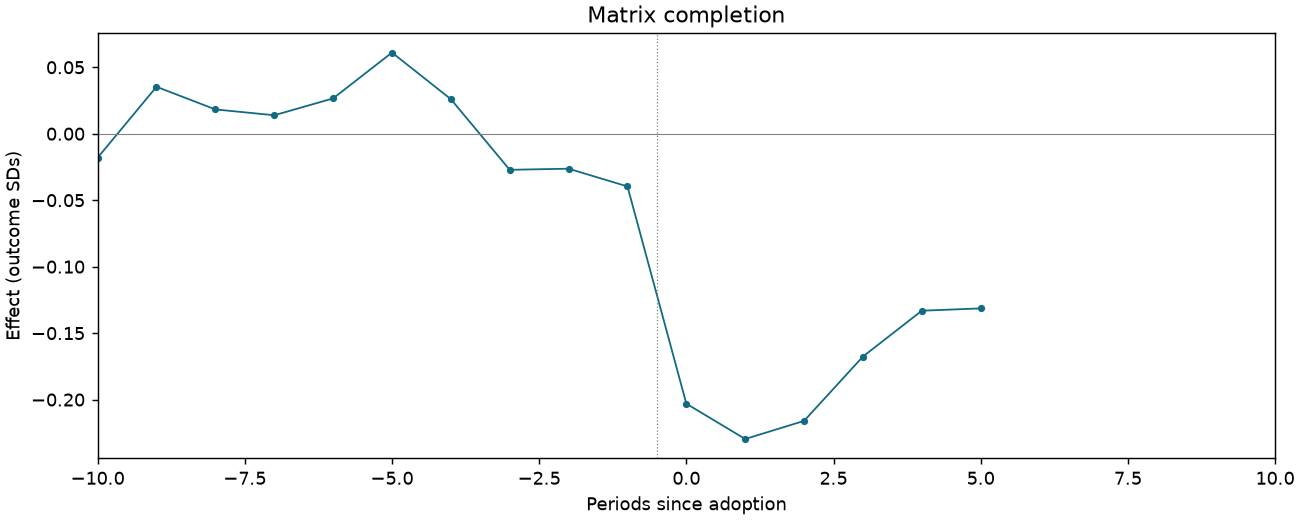
| Matrix completion | -0.184 | — | — | Treated cells |
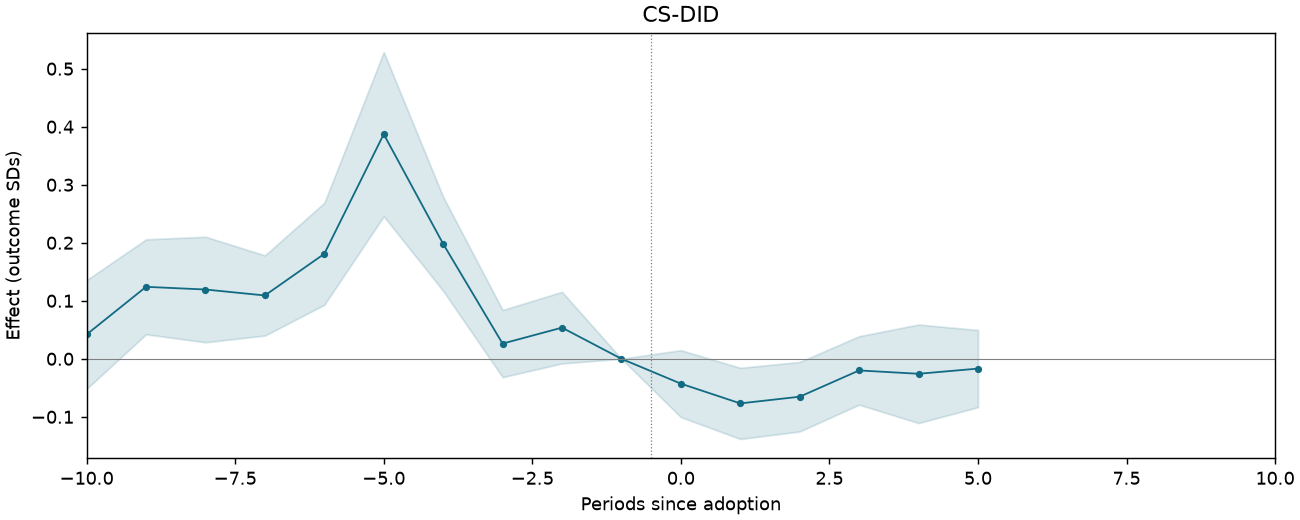
Event studies
Periods −10 to +10; pointwise 95% intervals where available.
AM005-P2587-T2-CAPEX-QP-M4
156,920 observations · 14,712 units · 2,012 clusters · 904 treated / 13,808 control units.
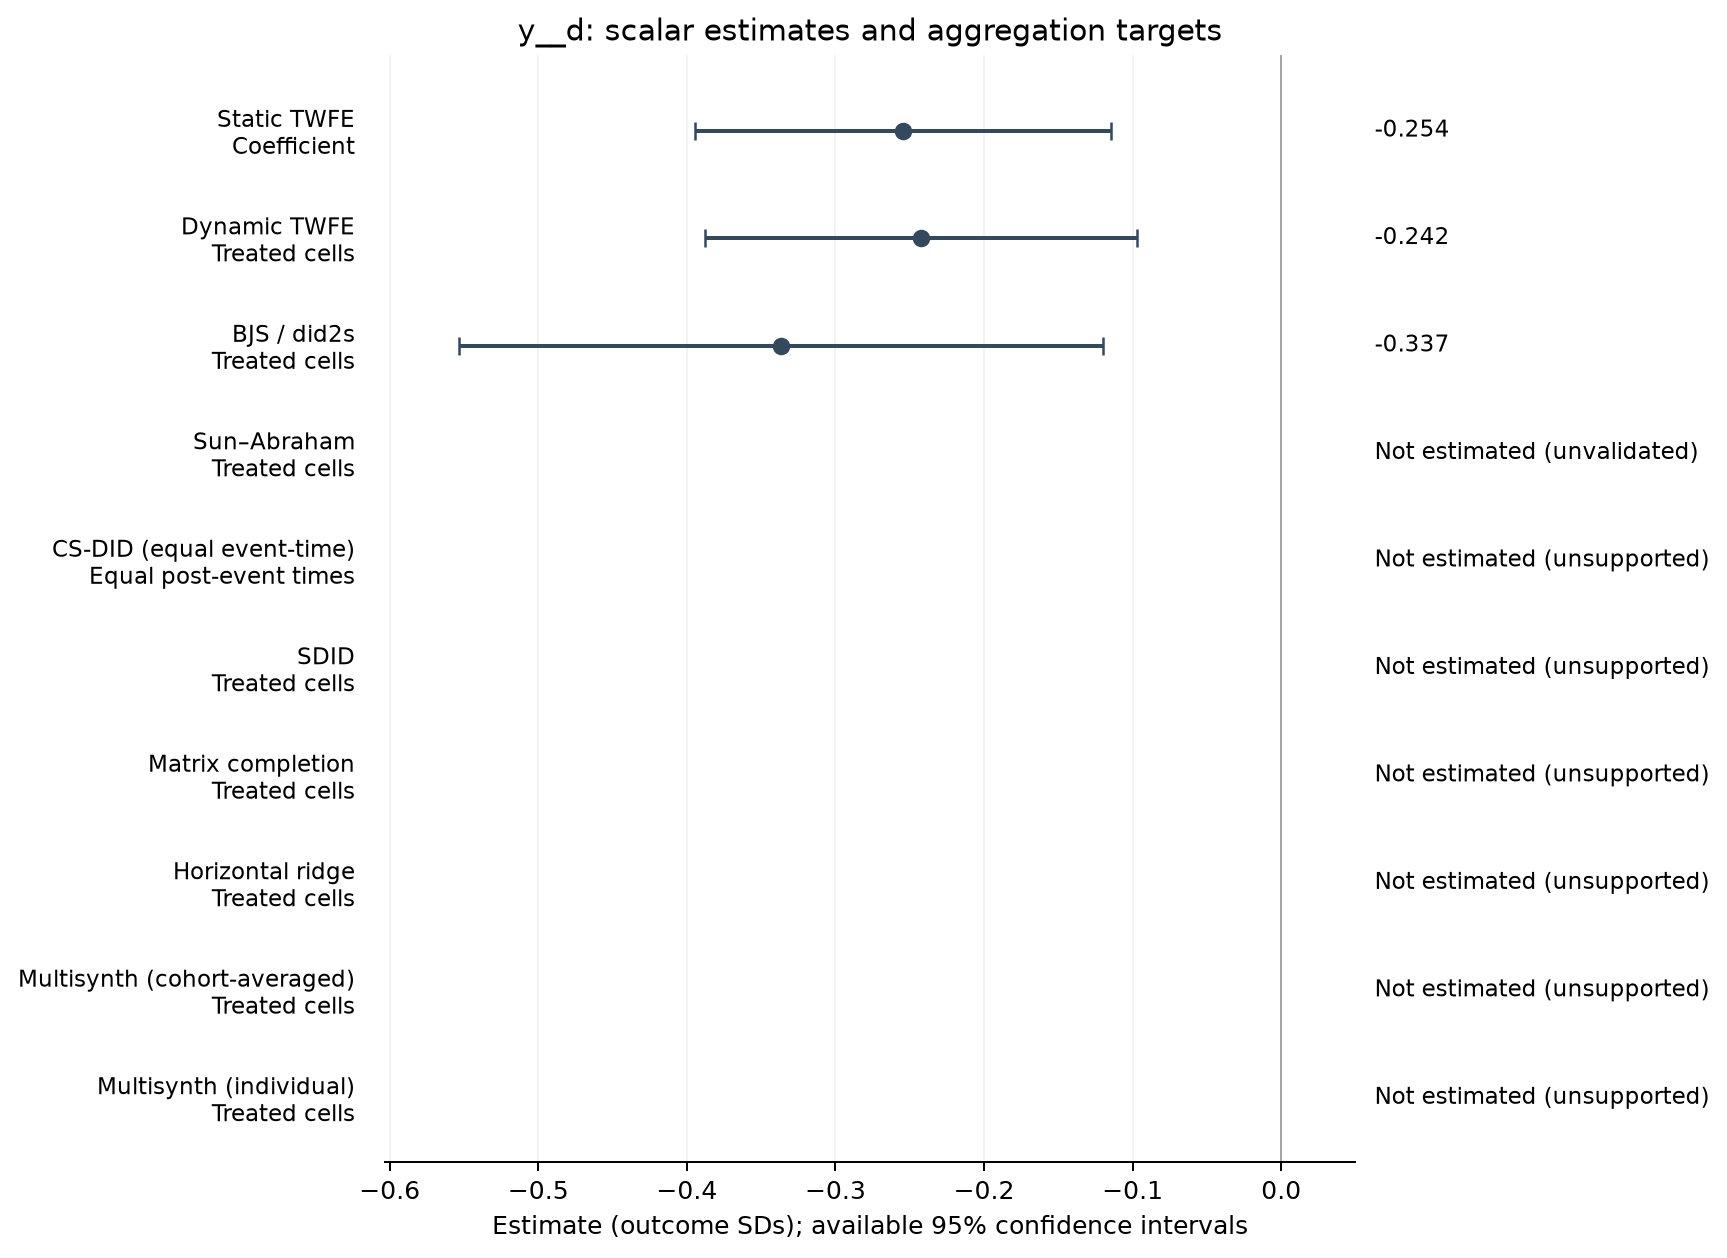
Estimate comparison
| Estimator | Estimate (SDs) | SE | 95% CI | Averaging |
|---|---|---|---|---|
| Static TWFE | -0.254 | 0.071 | [-0.394, -0.114] | Coefficient |
| Dynamic TWFE | -0.242 | 0.074 | [-0.388, -0.097] | Treated cells |
| BJS / did2s | -0.337 | 0.110 | [-0.553, -0.120] | Treated cells |
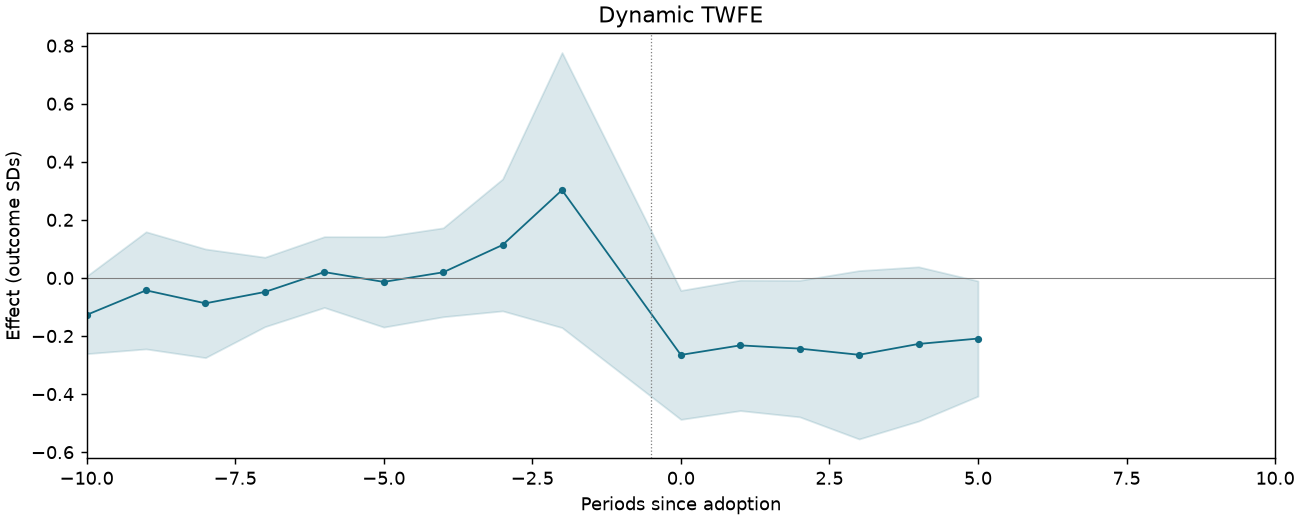
Event studies
Periods −10 to +10; pointwise 95% intervals where available.
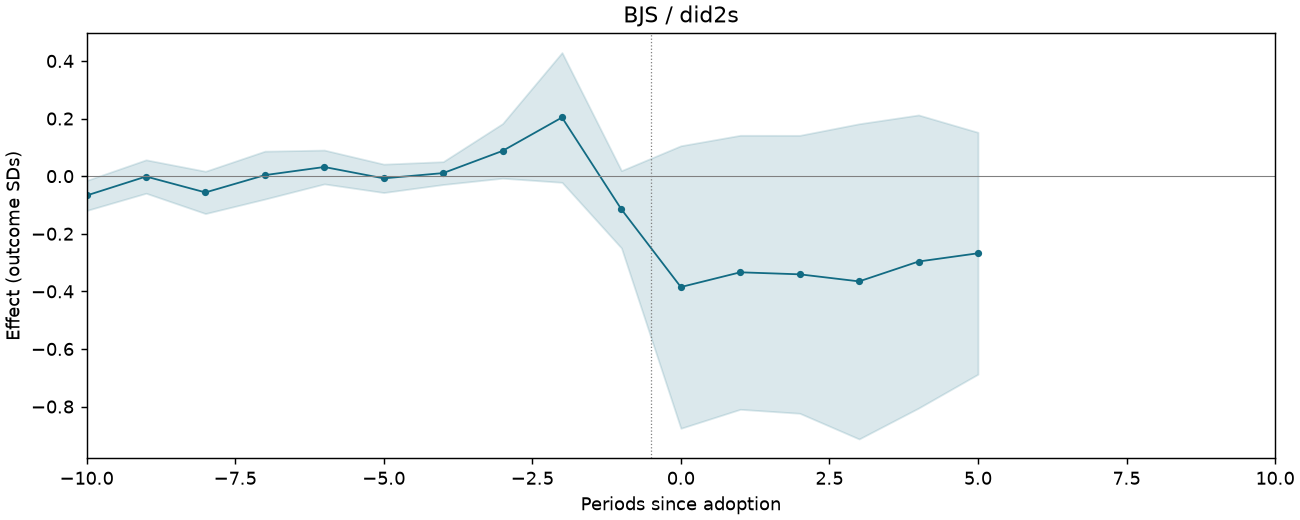
AM005-P2587-T2-DEMP-ACTUAL
159,985 observations · 14,759 units · 2,018 clusters · 801 treated / 13,958 control units.
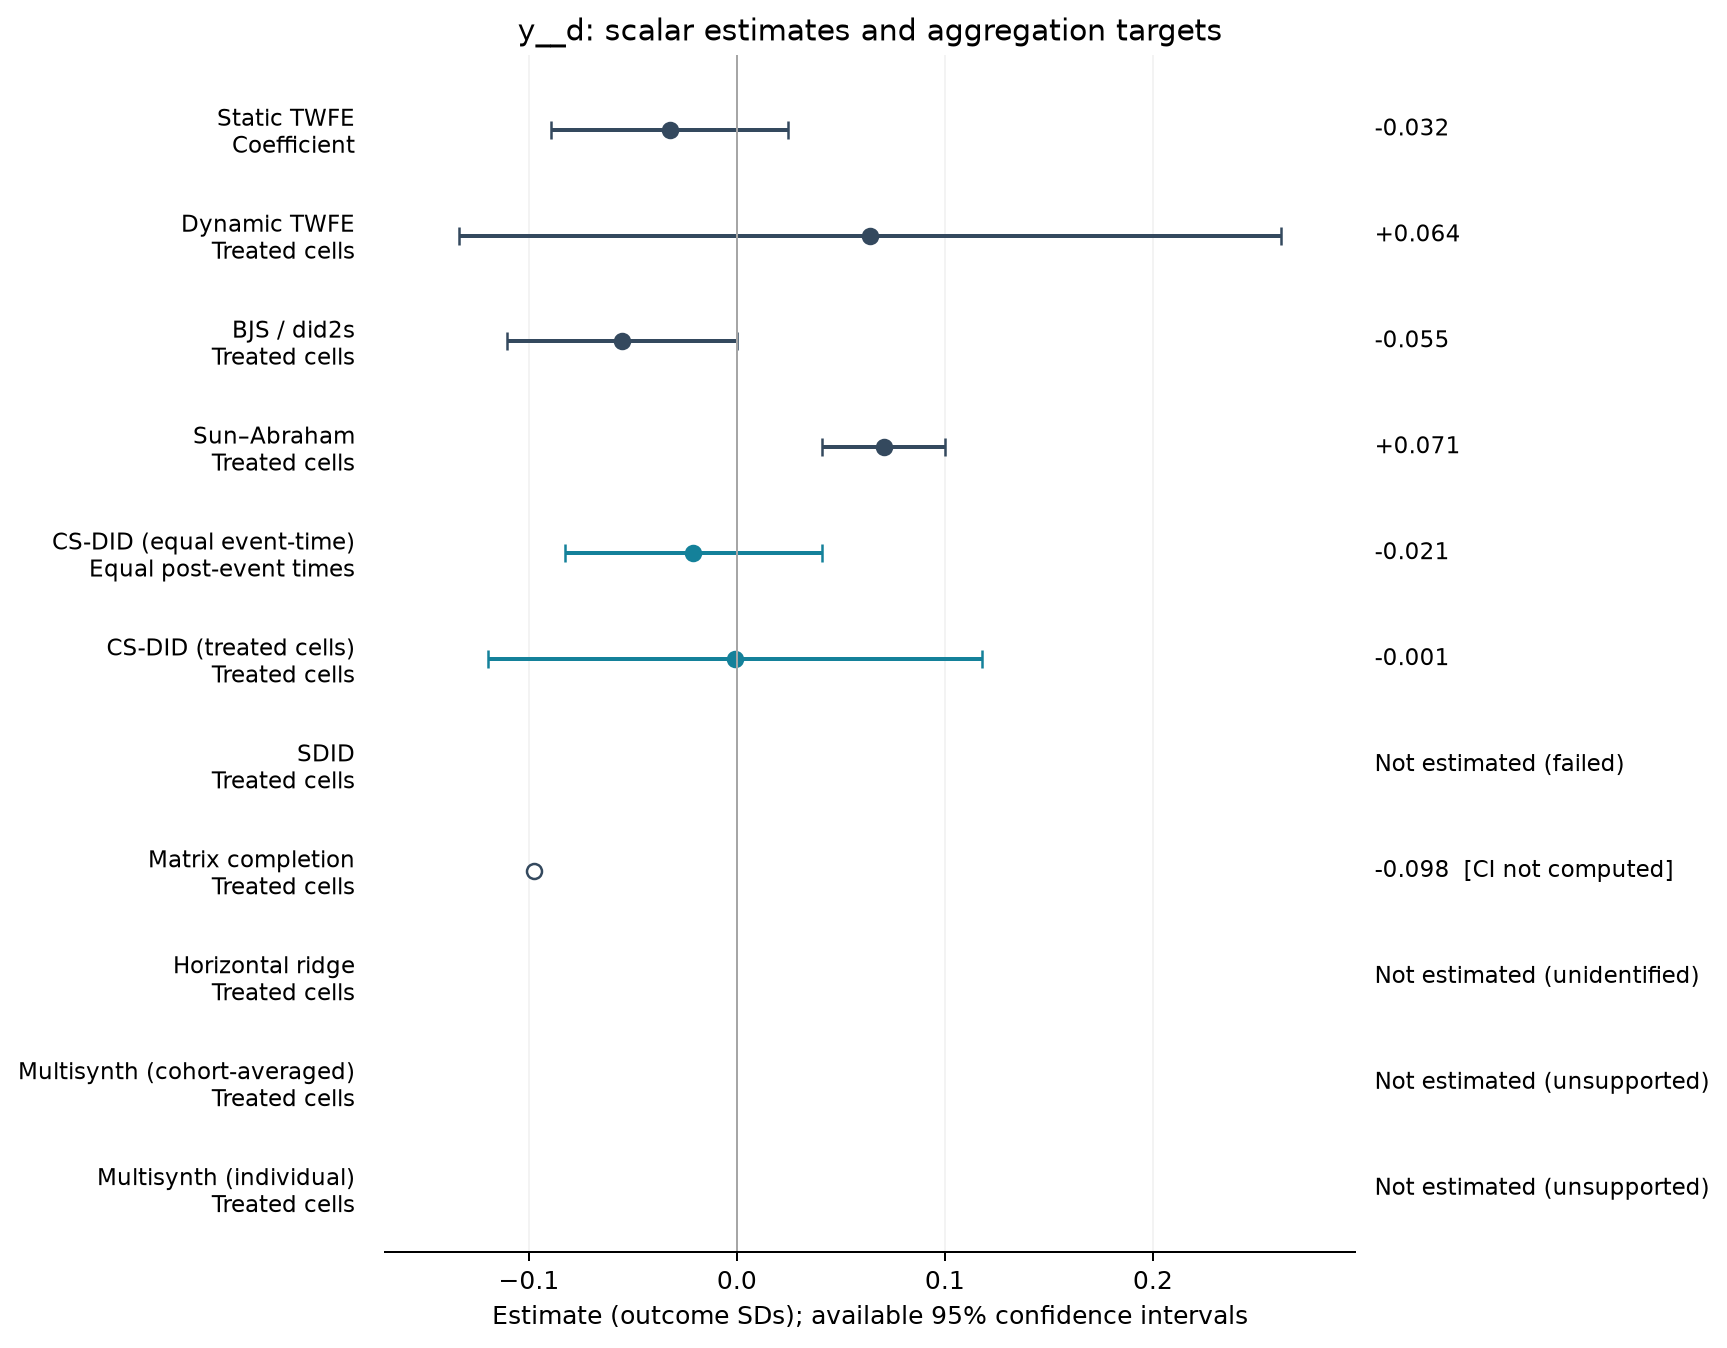
Estimate comparison
| Estimator | Estimate (SDs) | SE | 95% CI | Averaging |
|---|---|---|---|---|
| Static TWFE | -0.032 | 0.029 | [-0.089, 0.025] | Coefficient |
| Dynamic TWFE | 0.064 | 0.101 | [-0.134, 0.262] | Treated cells |
| BJS / did2s | -0.055 | 0.028 | [-0.111, -0.000] | Treated cells |
| Sun–Abraham | 0.071 | 0.015 | [0.041, 0.100] | Treated cells |
| CS-DID (equal event-time) | -0.021 | 0.032 | [-0.083, 0.041] | Equal post-event times |
| CS-DID (treated cells) | -0.001 | 0.061 | [-0.120, 0.118] | Treated cells |
| Matrix completion | -0.098 | — | — | Treated cells |
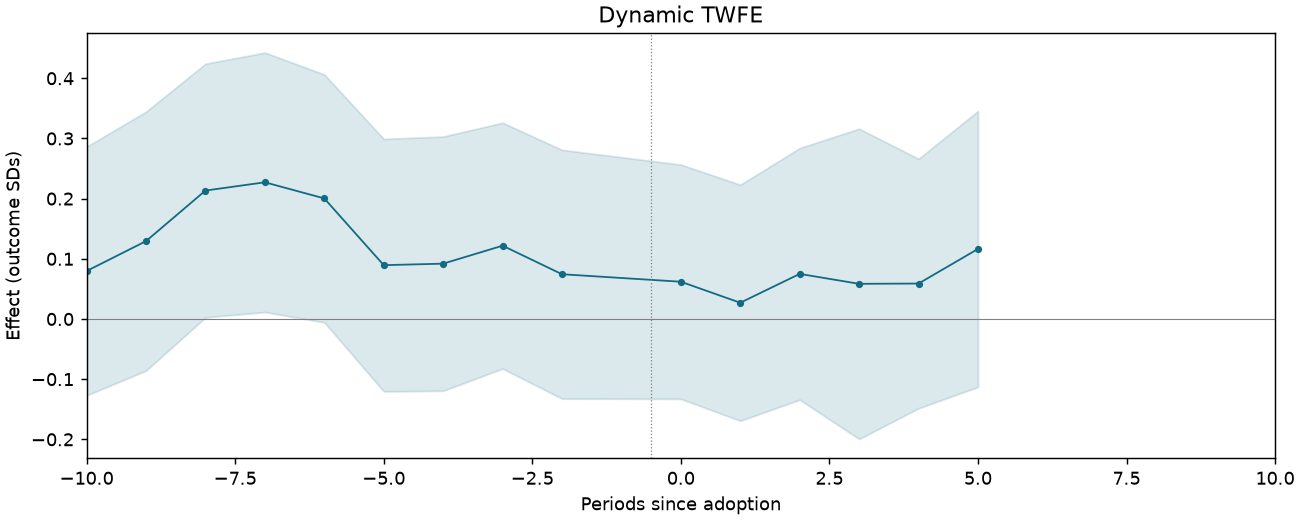
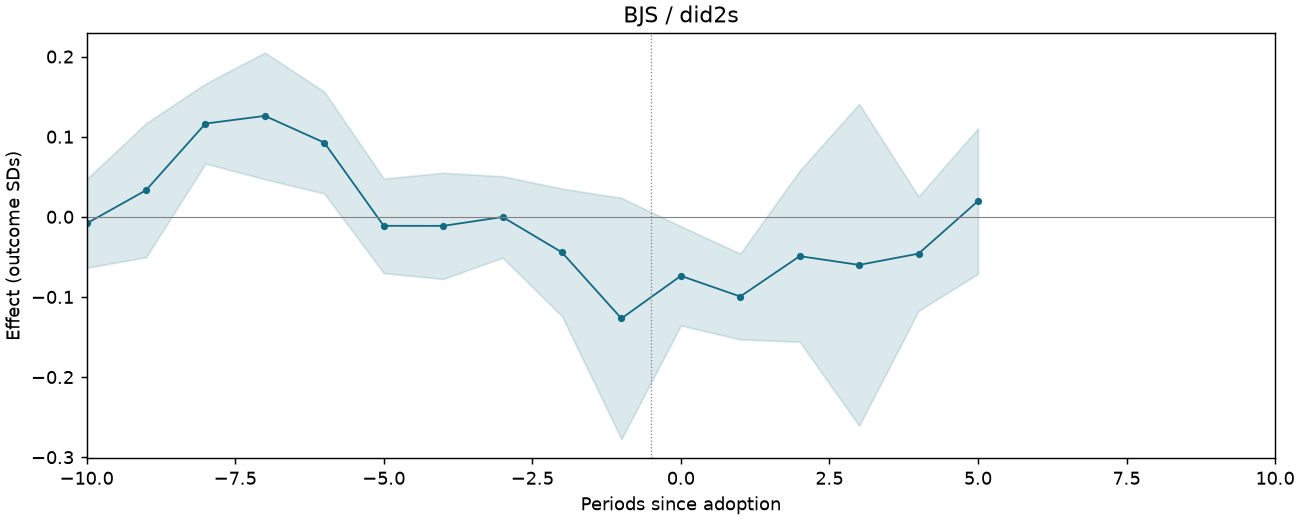
Event studies
Periods −10 to +10; pointwise 95% intervals where available.
AM005-P2587-T2-DEMP-NOOV-M1
157,949 observations · 14,885 units · 2,013 clusters · 790 treated / 14,095 control units.
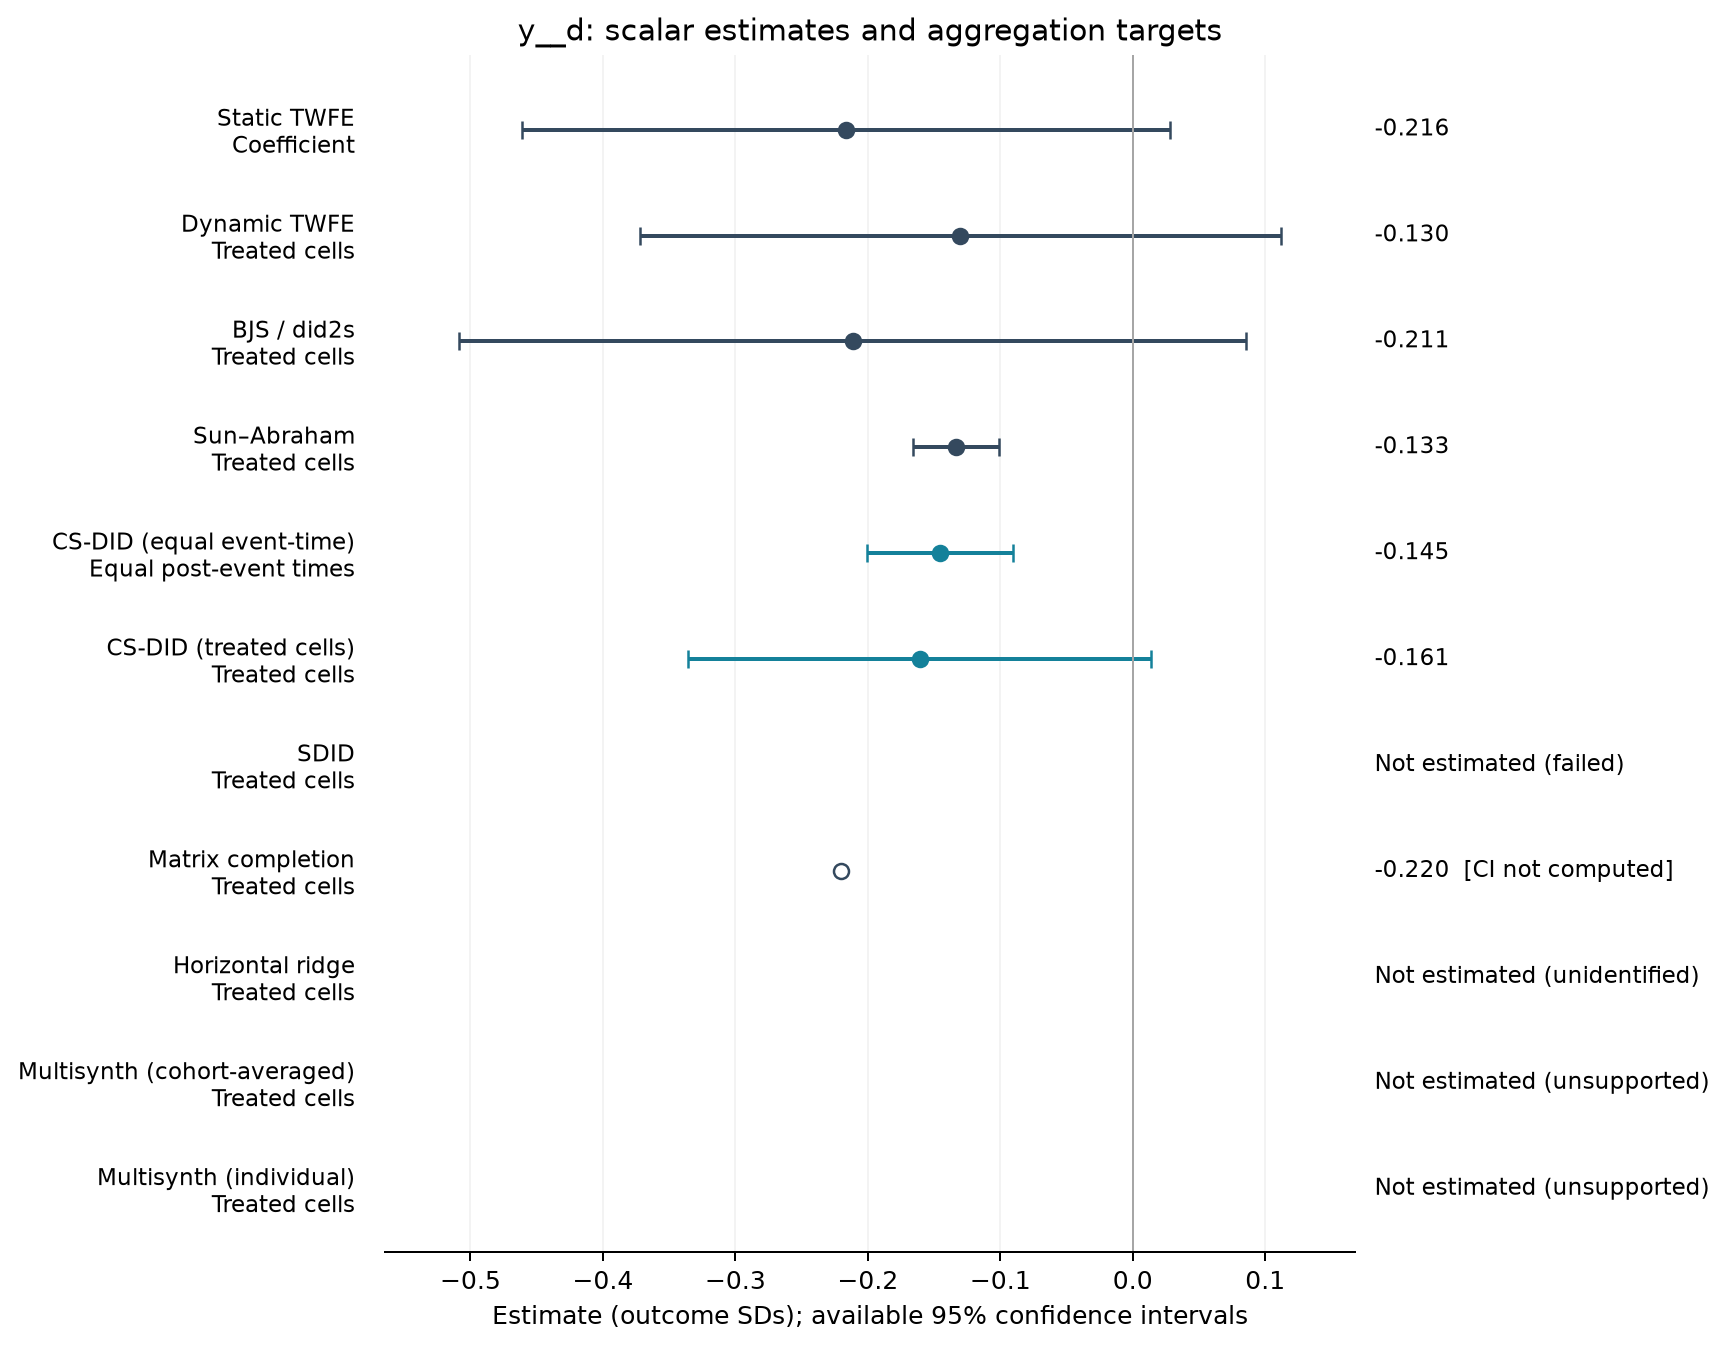
Estimate comparison
| Estimator | Estimate (SDs) | SE | 95% CI | Averaging |
|---|---|---|---|---|
| Static TWFE | -0.216 | 0.125 | [-0.461, 0.028] | Coefficient |
| Dynamic TWFE | -0.130 | 0.123 | [-0.372, 0.112] | Treated cells |
| BJS / did2s | -0.211 | 0.152 | [-0.509, 0.086] | Treated cells |
| Sun–Abraham | -0.133 | 0.017 | [-0.166, -0.101] | Treated cells |
| CS-DID (equal event-time) | -0.145 | 0.028 | [-0.200, -0.090] | Equal post-event times |
| CS-DID (treated cells) | -0.161 | 0.089 | [-0.336, 0.014] | Treated cells |
| Matrix completion | -0.220 | — | — | Treated cells |
Event studies
Periods −10 to +10; pointwise 95% intervals where available.
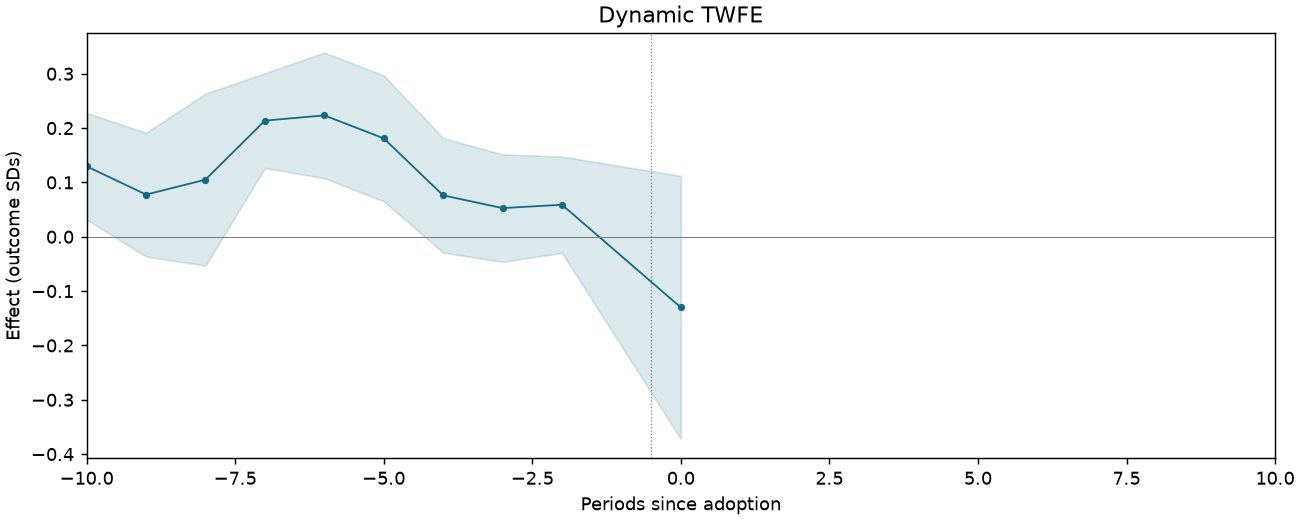
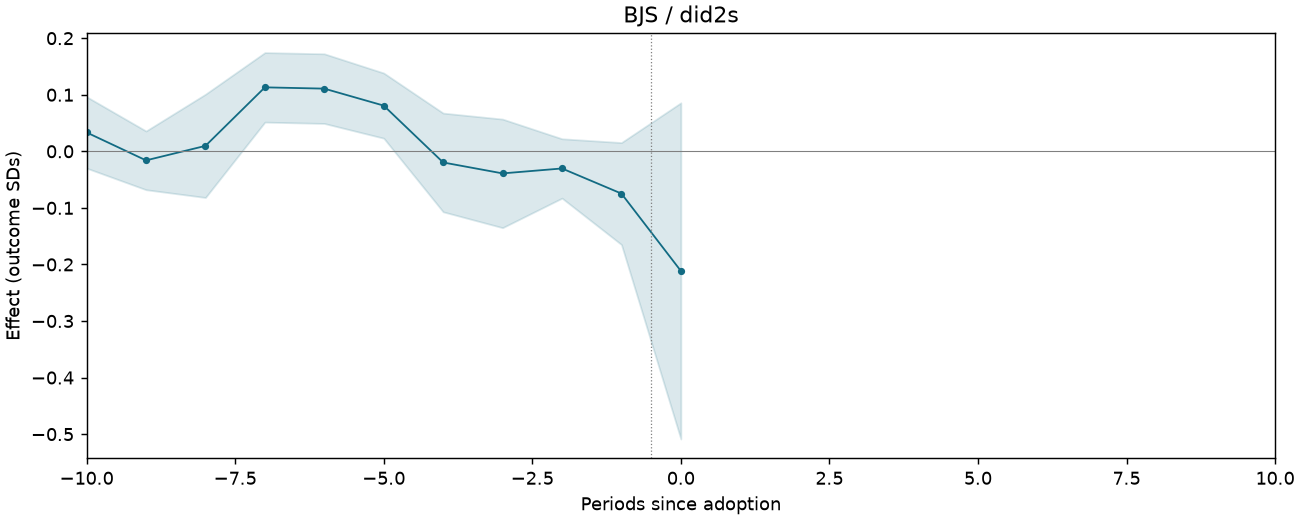
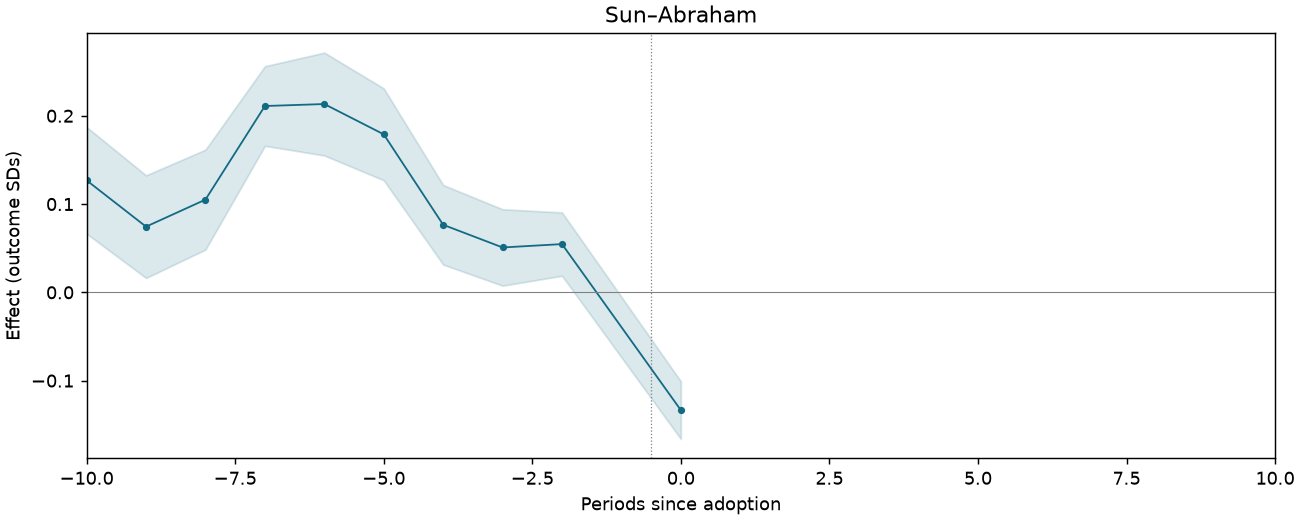
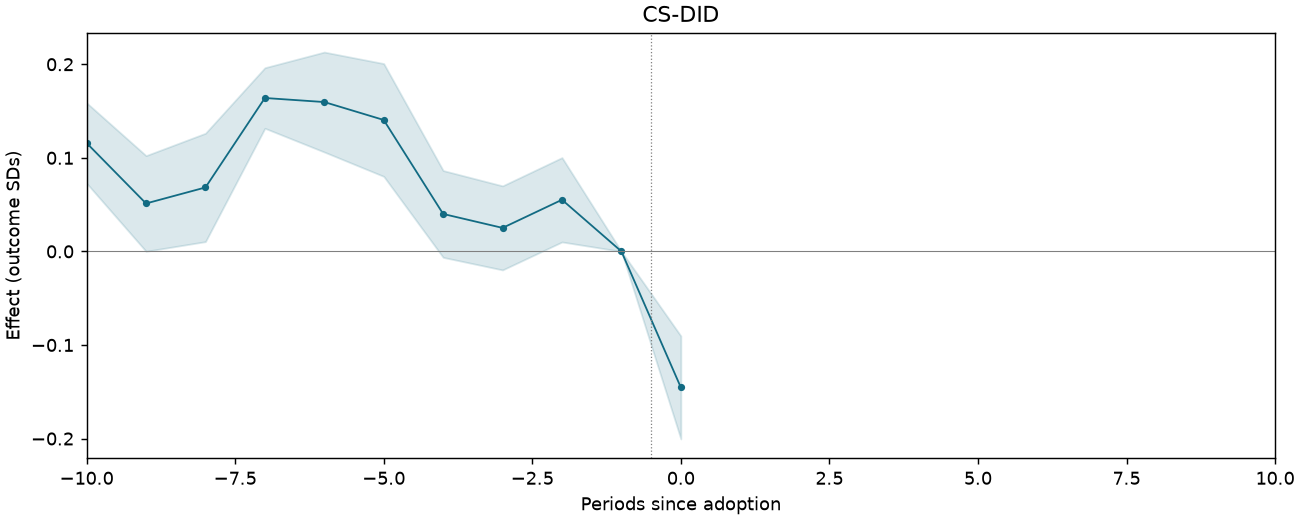
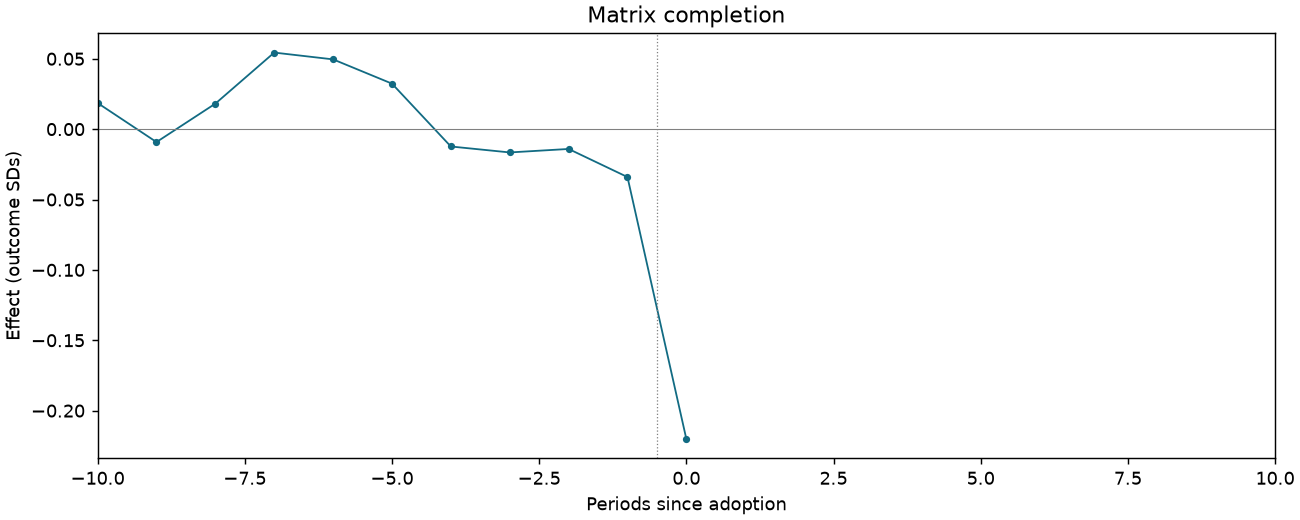
AM005-P2587-T2-DEMP-NOOV-M4M1
157,219 observations · 14,831 units · 2,010 clusters · 866 treated / 13,965 control units.
Estimate comparison
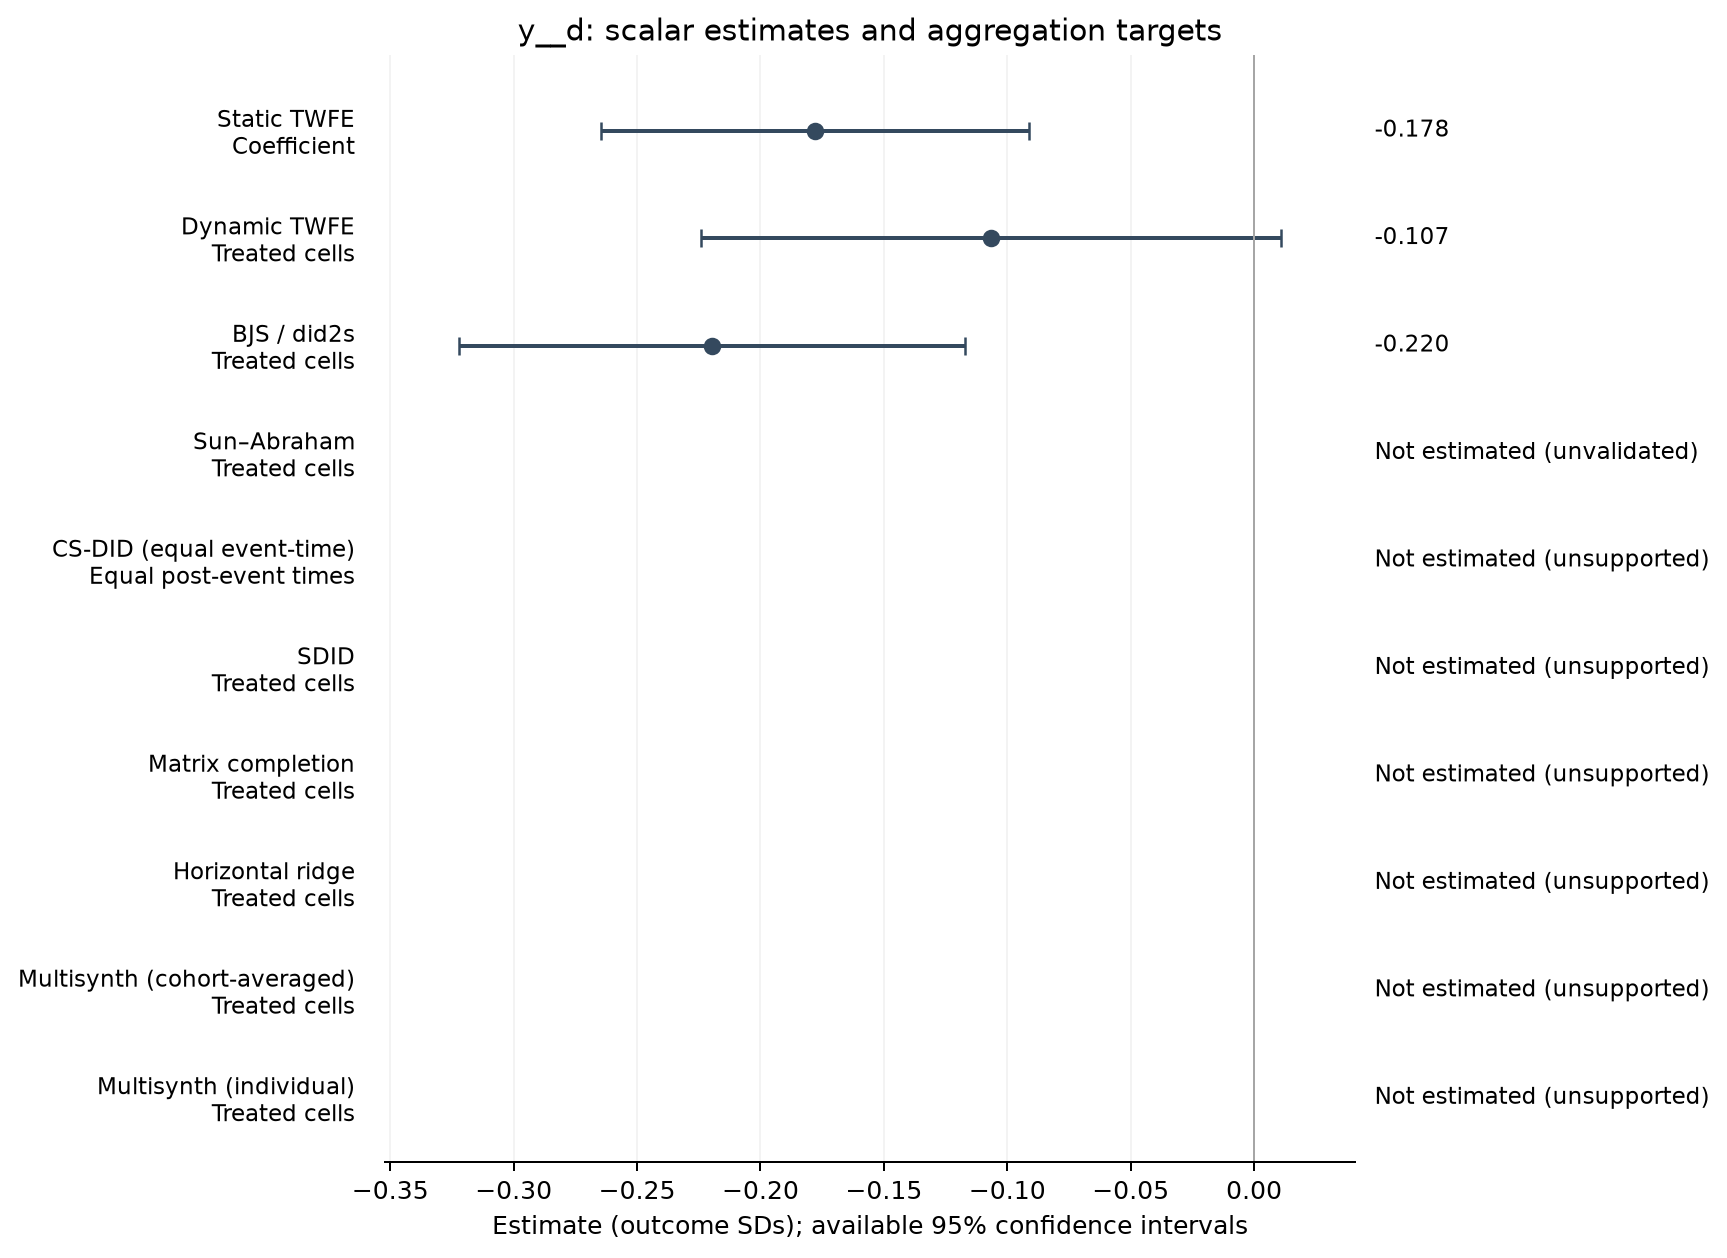
| Estimator | Estimate (SDs) | SE | 95% CI | Averaging |
|---|---|---|---|---|
| Static TWFE | -0.178 | 0.044 | [-0.265, -0.091] | Coefficient |
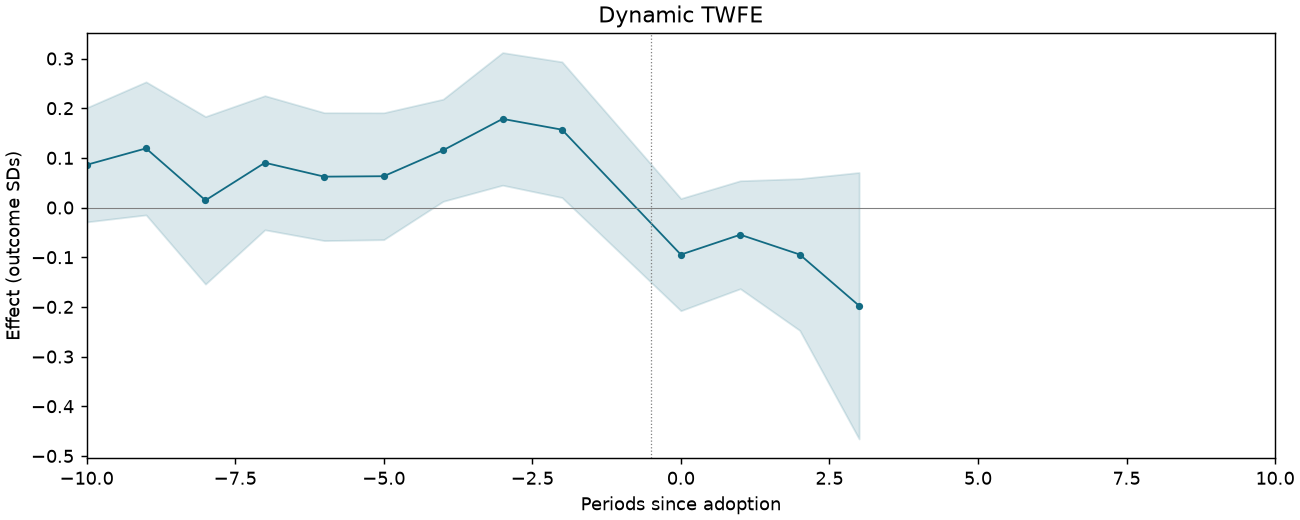
| Dynamic TWFE | -0.107 | 0.060 | [-0.224, 0.011] | Treated cells |
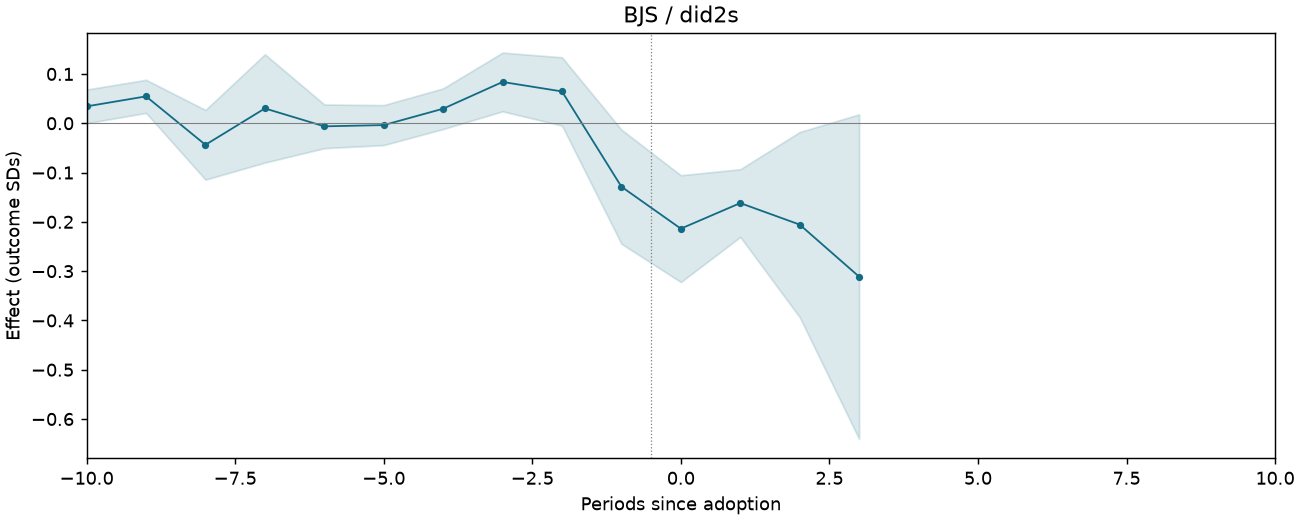
| BJS / did2s | -0.220 | 0.052 | [-0.322, -0.117] | Treated cells |
Event studies
Periods −10 to +10; pointwise 95% intervals where available.
AM005-P2587-T2-DEMP-QP-M1
158,933 observations · 14,681 units · 2,018 clusters · 792 treated / 13,889 control units.
Estimate comparison
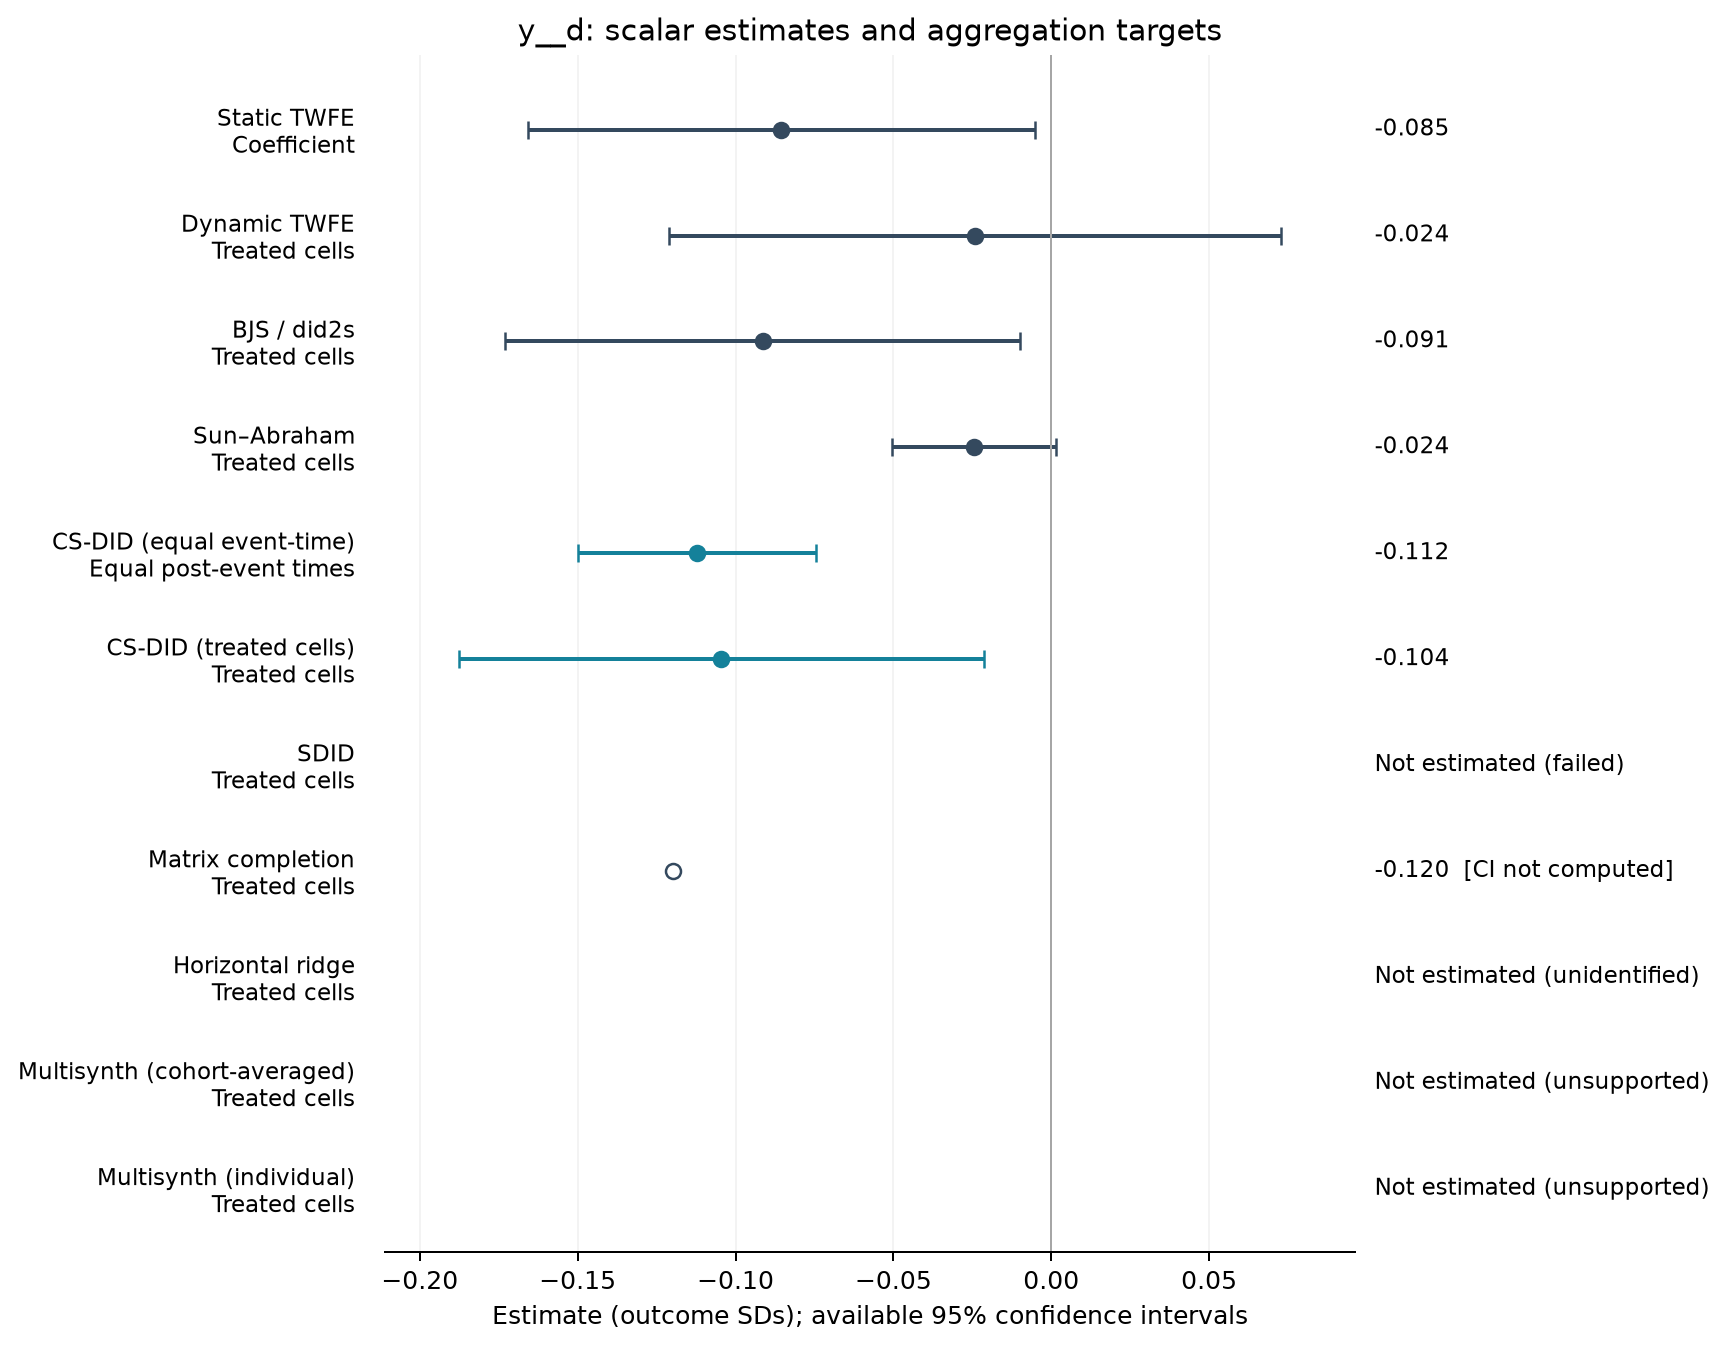
| Estimator | Estimate (SDs) | SE | 95% CI | Averaging |
|---|---|---|---|---|
| Static TWFE | -0.085 | 0.041 | [-0.166, -0.005] | Coefficient |
| Dynamic TWFE | -0.024 | 0.049 | [-0.121, 0.073] | Treated cells |
| BJS / did2s | -0.091 | 0.042 | [-0.173, -0.010] | Treated cells |
| Sun–Abraham | -0.024 | 0.013 | [-0.050, 0.002] | Treated cells |
| CS-DID (equal event-time) | -0.112 | 0.019 | [-0.150, -0.075] | Equal post-event times |
| CS-DID (treated cells) | -0.104 | 0.042 | [-0.188, -0.021] | Treated cells |
| Matrix completion | -0.120 | — | — | Treated cells |
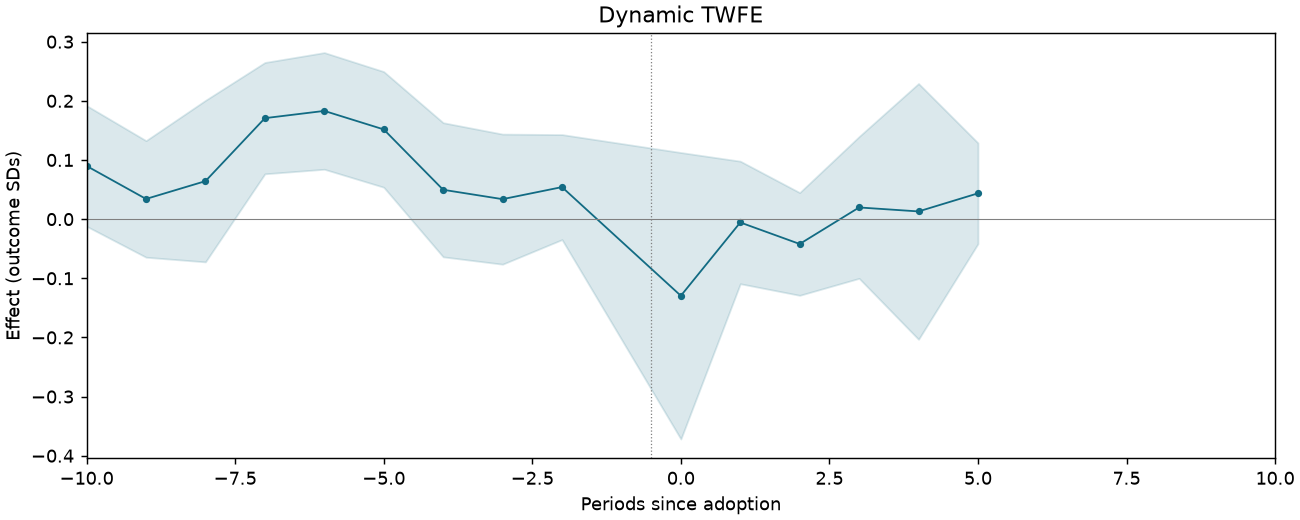
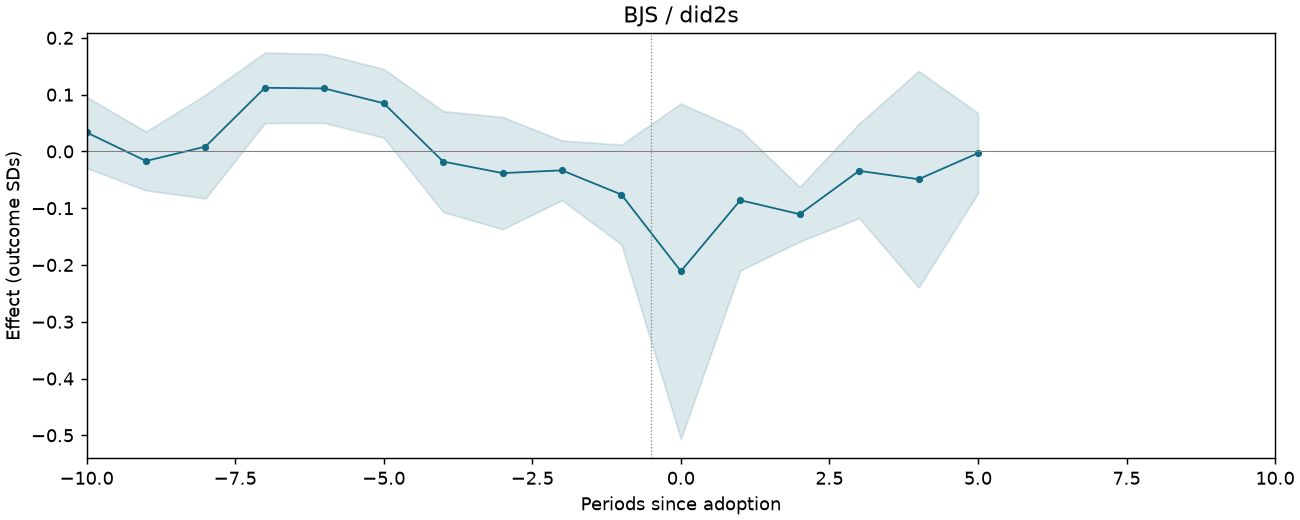
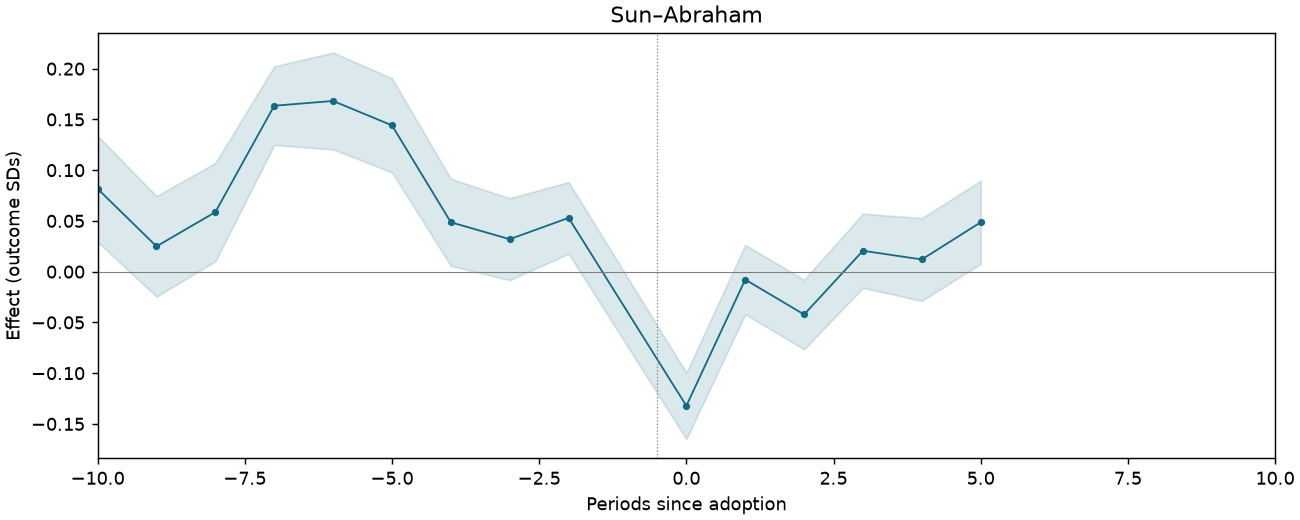
Event studies
Periods −10 to +10; pointwise 95% intervals where available.
AM005-P2587-T2-DEMP-QP-M4
156,719 observations · 14,659 units · 2,011 clusters · 866 treated / 13,793 control units.
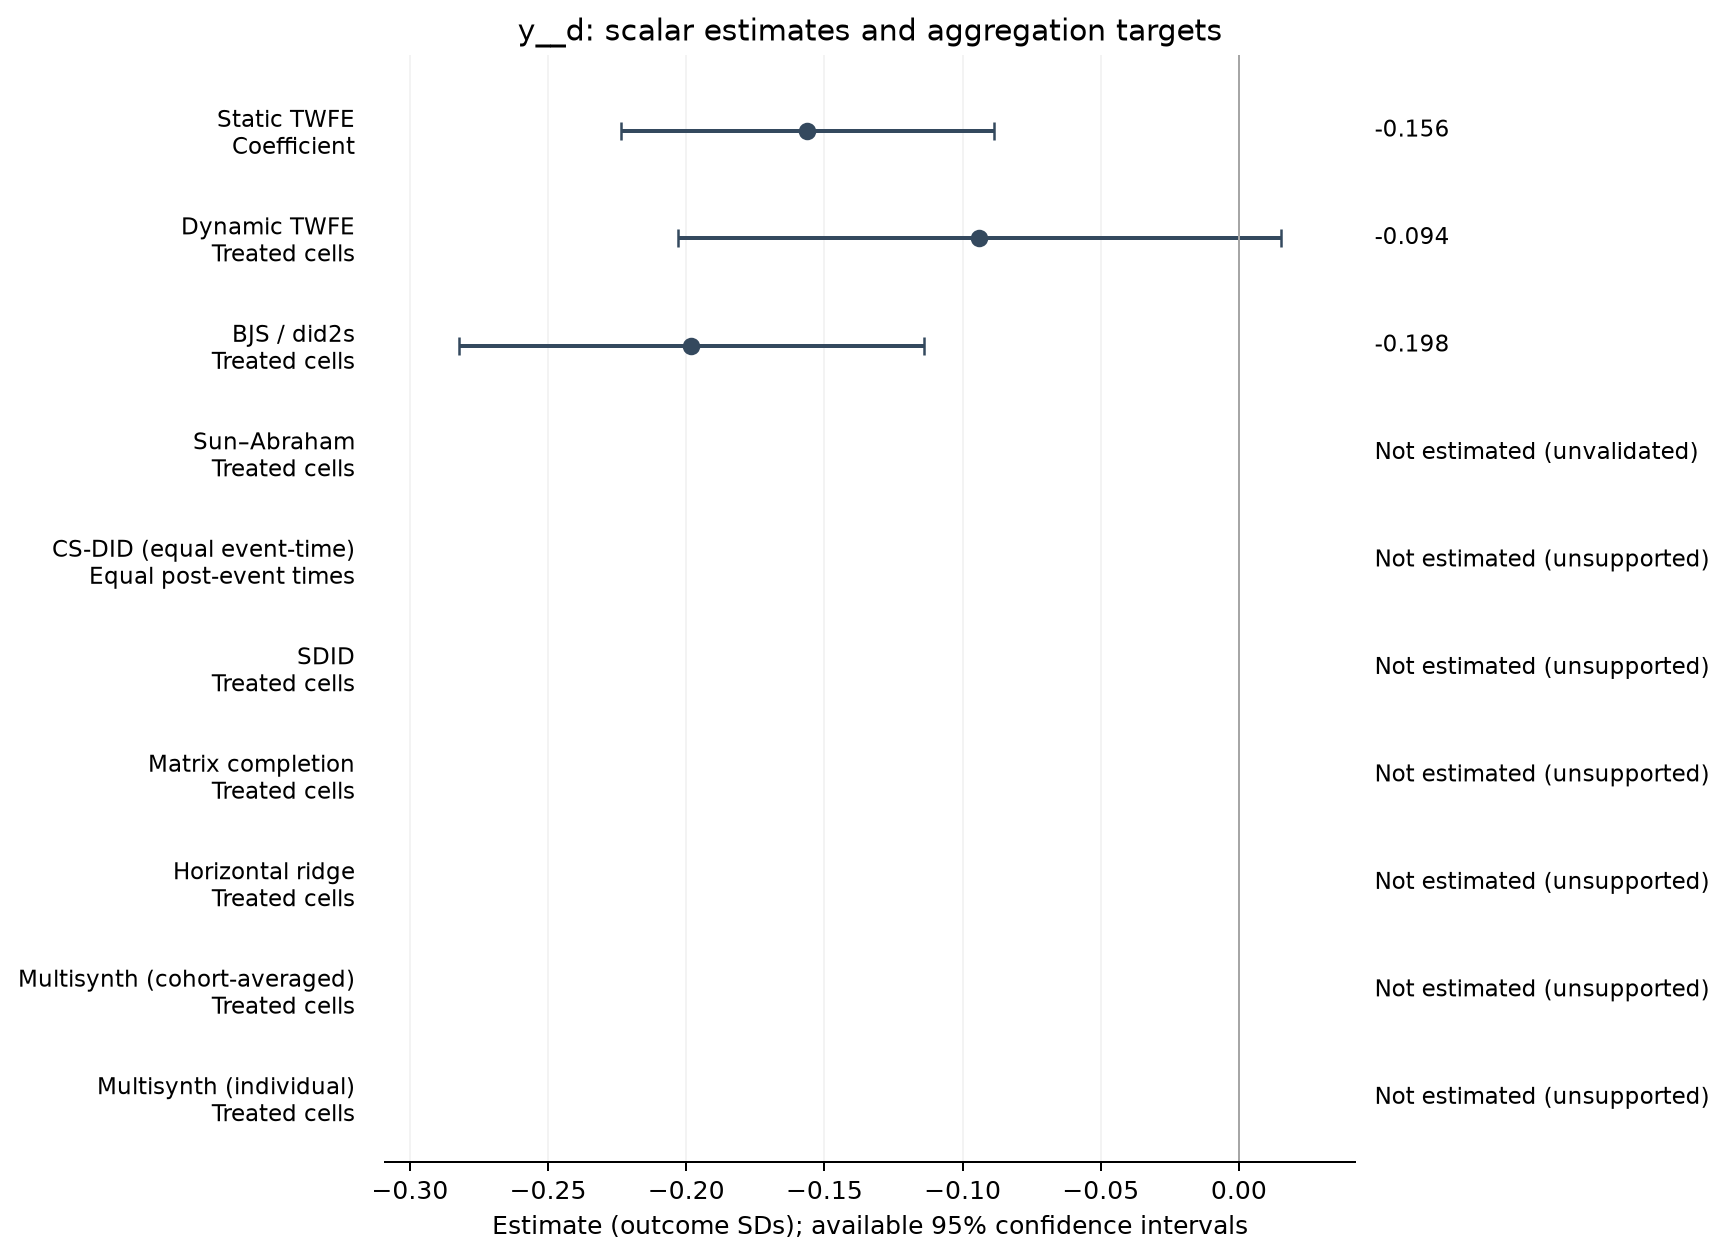
Estimate comparison
| Estimator | Estimate (SDs) | SE | 95% CI | Averaging |
|---|---|---|---|---|
| Static TWFE | -0.156 | 0.034 | [-0.224, -0.089] | Coefficient |
| Dynamic TWFE | -0.094 | 0.056 | [-0.203, 0.015] | Treated cells |
| BJS / did2s | -0.198 | 0.043 | [-0.282, -0.114] | Treated cells |
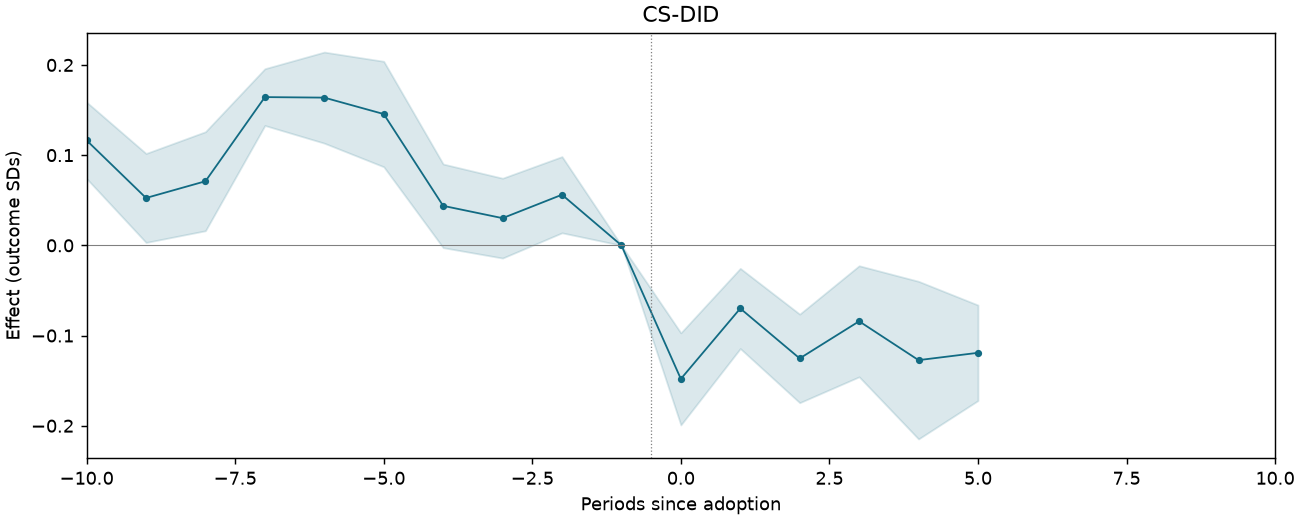
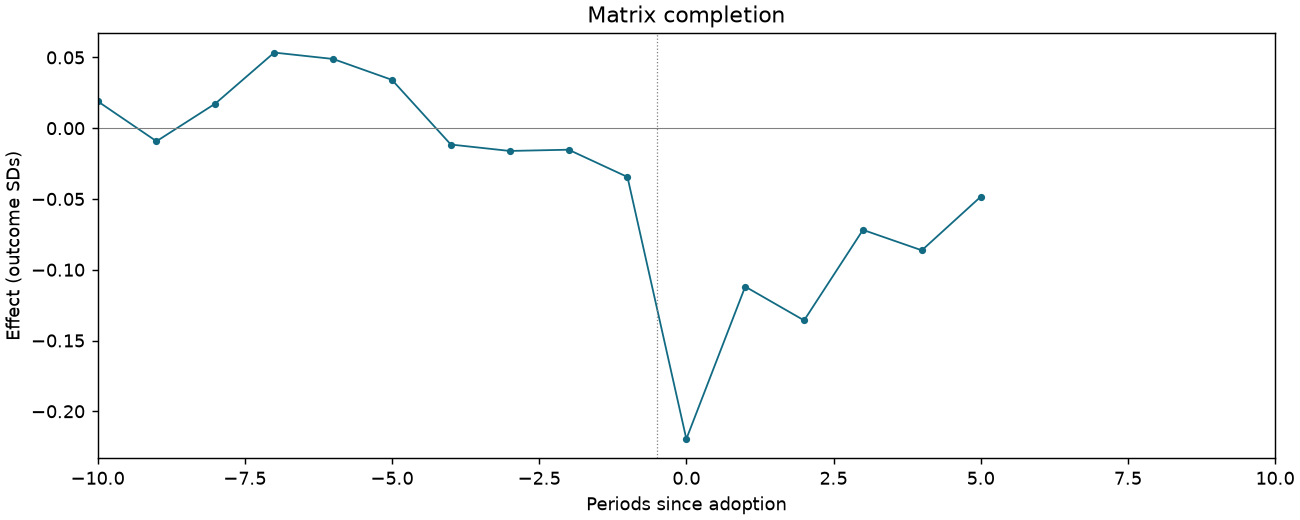
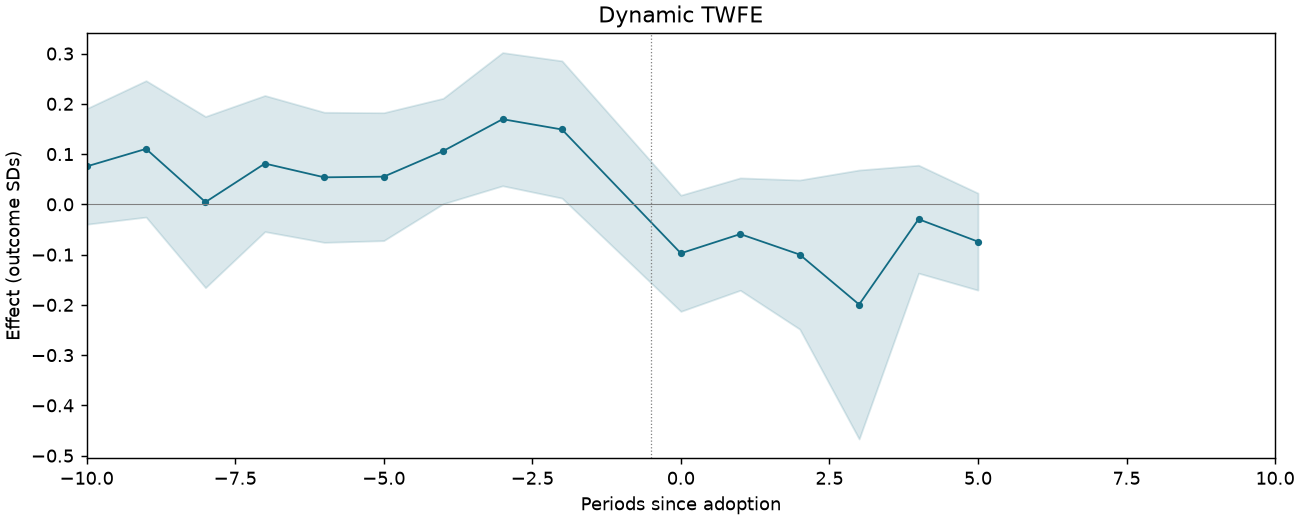
Event studies
Periods −10 to +10; pointwise 95% intervals where available.
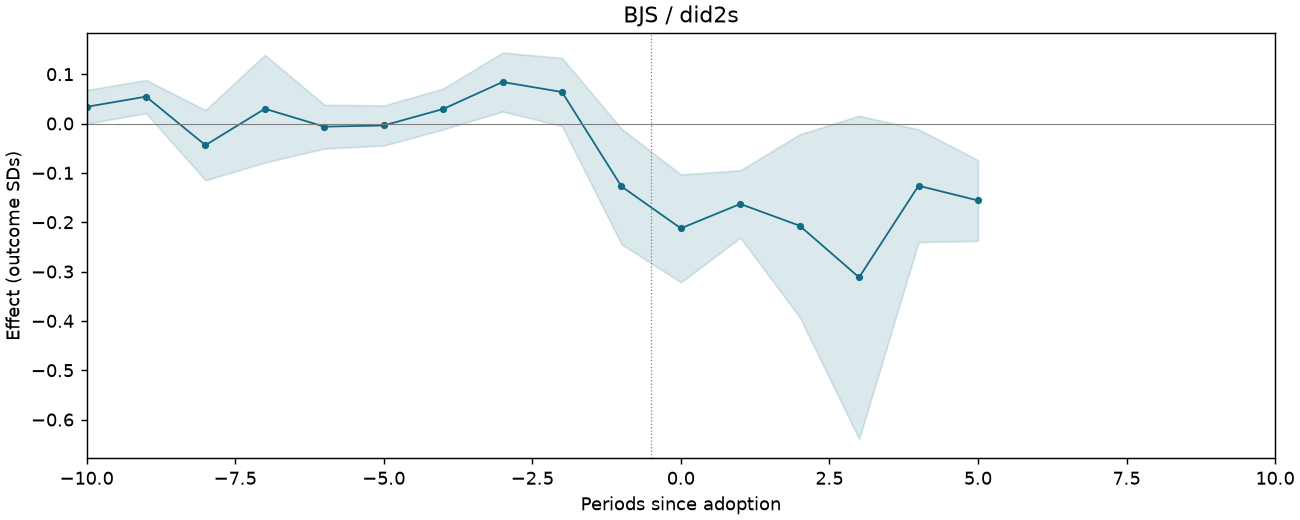
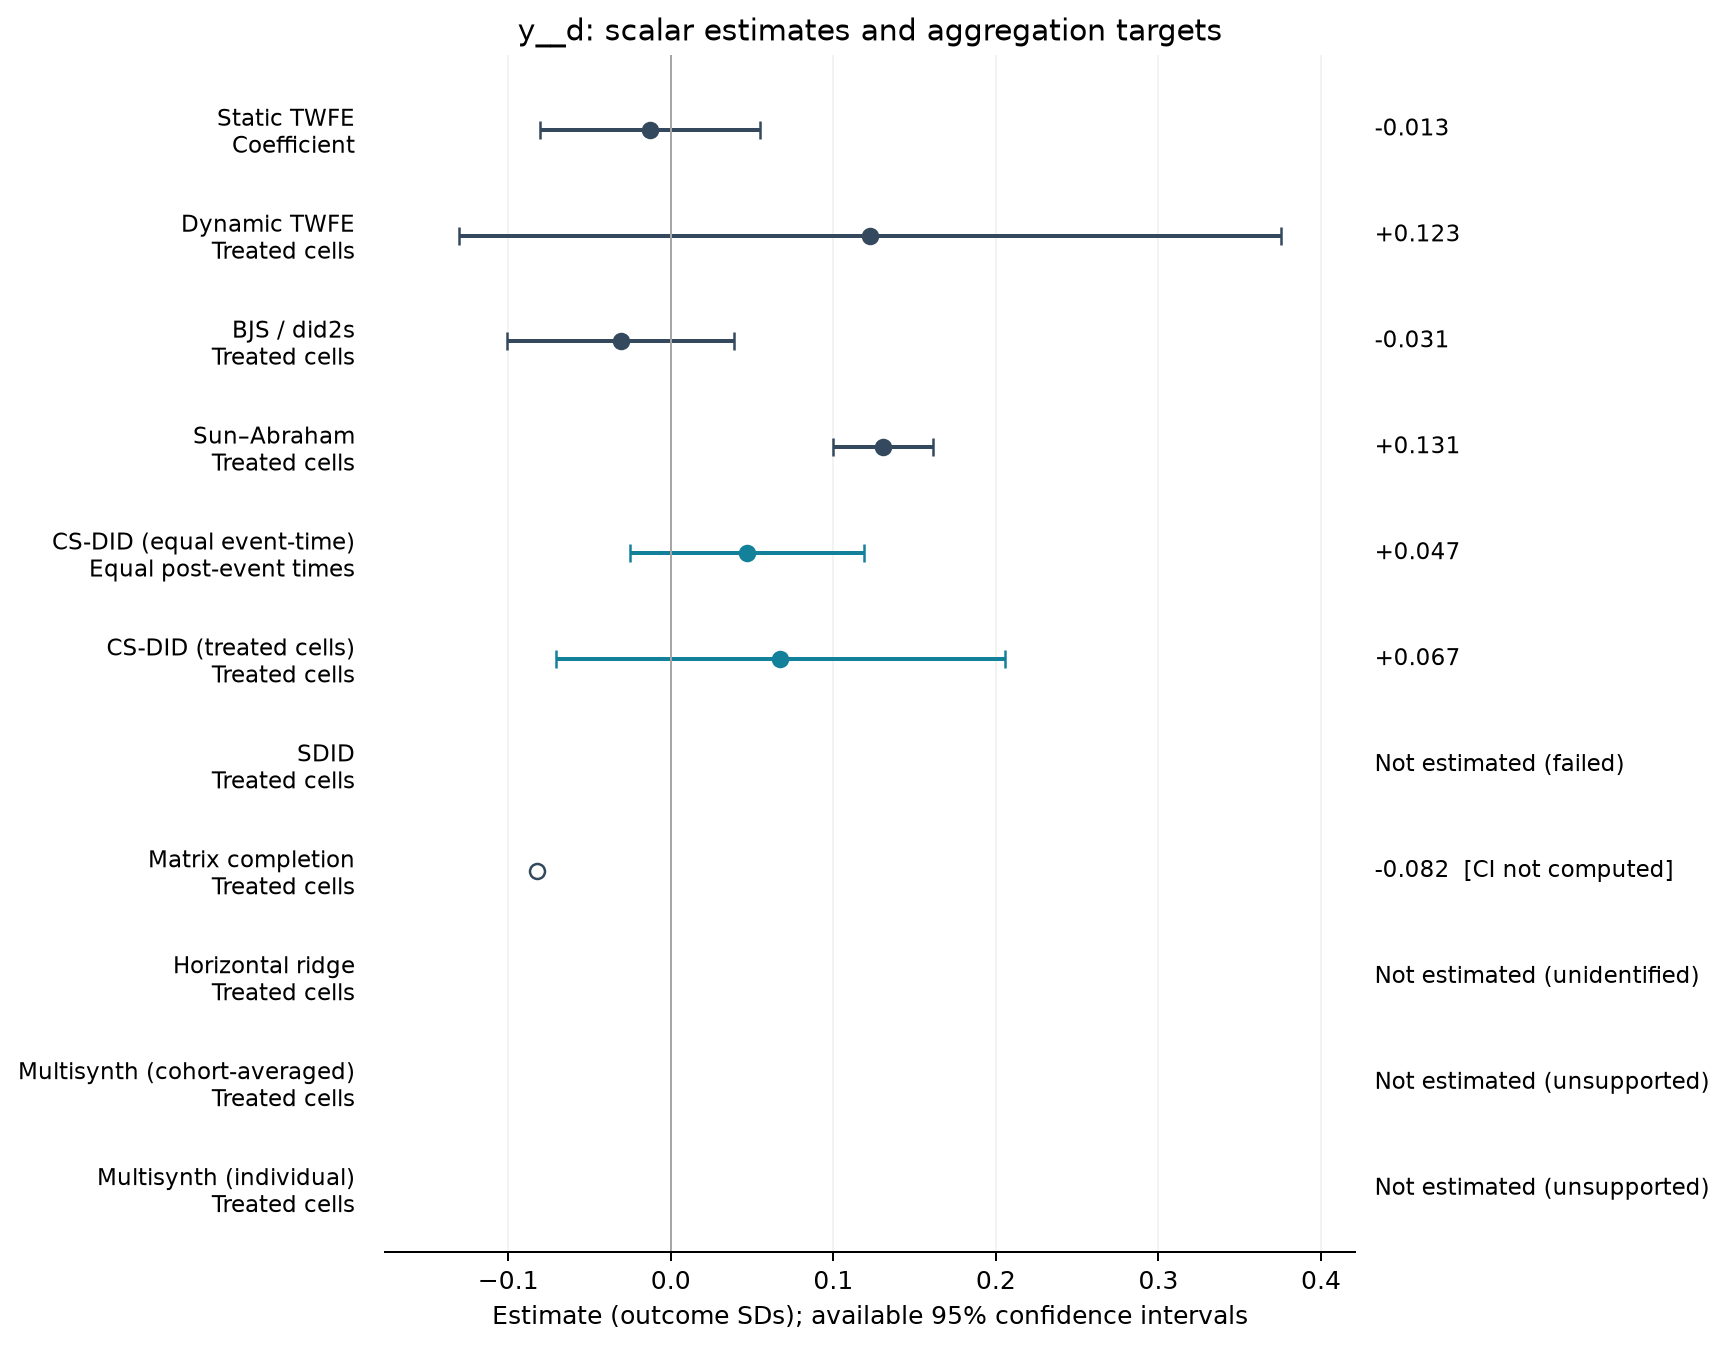
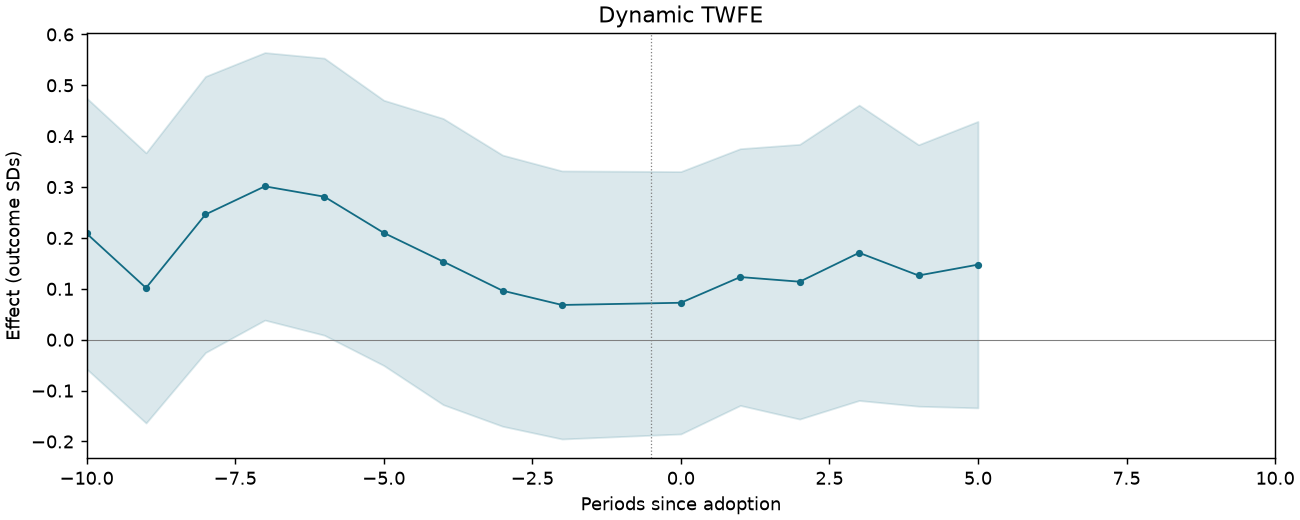
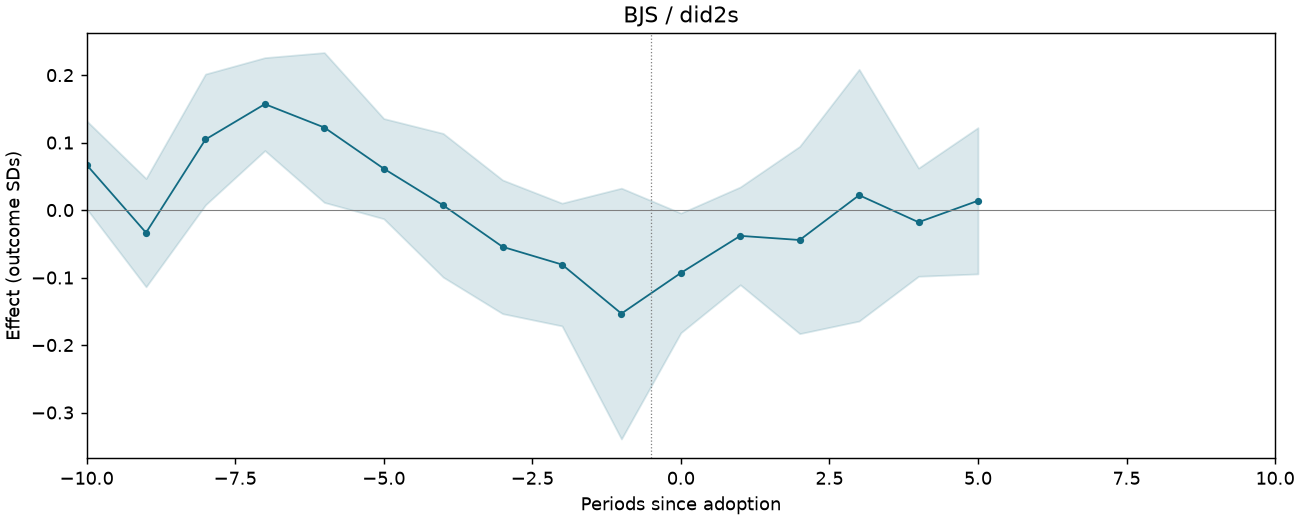
AM005-P2587-T2-DSALES-ACTUAL
172,342 observations · 15,535 units · 2,028 clusters · 887 treated / 14,648 control units.
Estimate comparison
| Estimator | Estimate (SDs) | SE | 95% CI | Averaging |
|---|---|---|---|---|
| Static TWFE | -0.013 | 0.034 | [-0.080, 0.055] | Coefficient |
| Dynamic TWFE | 0.123 | 0.129 | [-0.130, 0.376] | Treated cells |
| BJS / did2s | -0.031 | 0.036 | [-0.101, 0.039] | Treated cells |
| Sun–Abraham | 0.131 | 0.016 | [0.100, 0.162] | Treated cells |
| CS-DID (equal event-time) | 0.047 | 0.037 | [-0.025, 0.119] | Equal post-event times |
| CS-DID (treated cells) | 0.067 | 0.070 | [-0.071, 0.205] | Treated cells |
| Matrix completion | -0.082 | — | — | Treated cells |
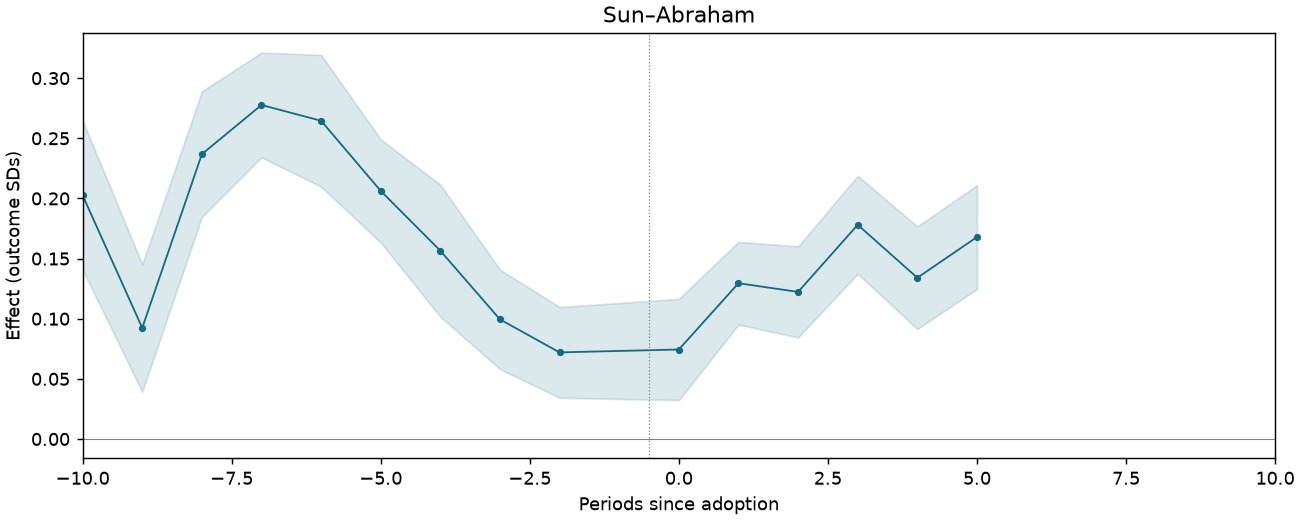
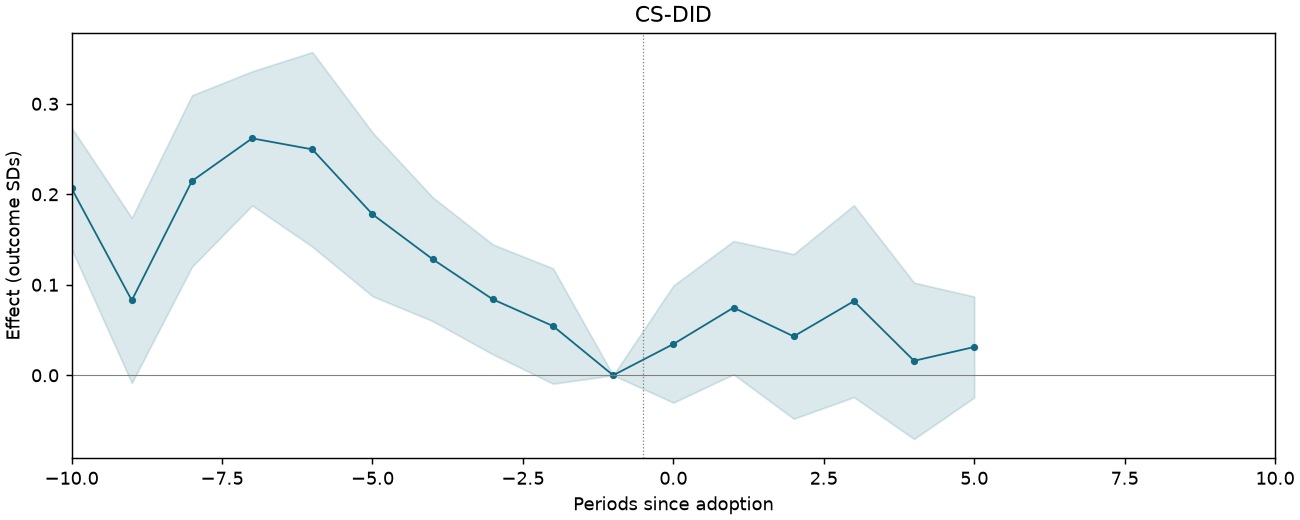
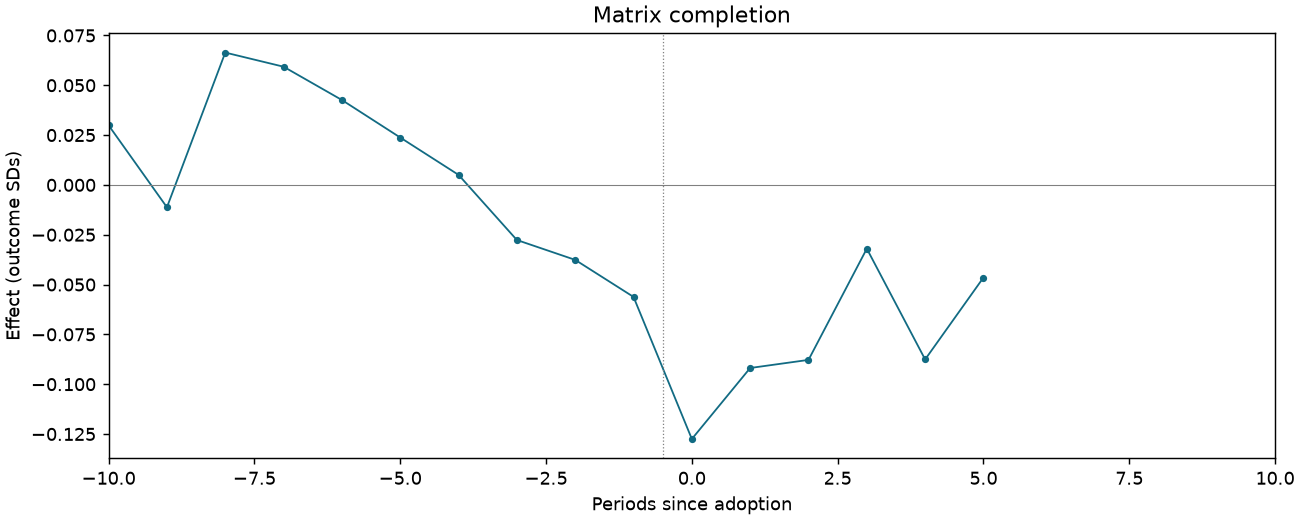
Event studies
Periods −10 to +10; pointwise 95% intervals where available.
AM005-P2587-T2-DSALES-NOOV-M1
170,067 observations · 15,686 units · 2,024 clusters · 878 treated / 14,808 control units.
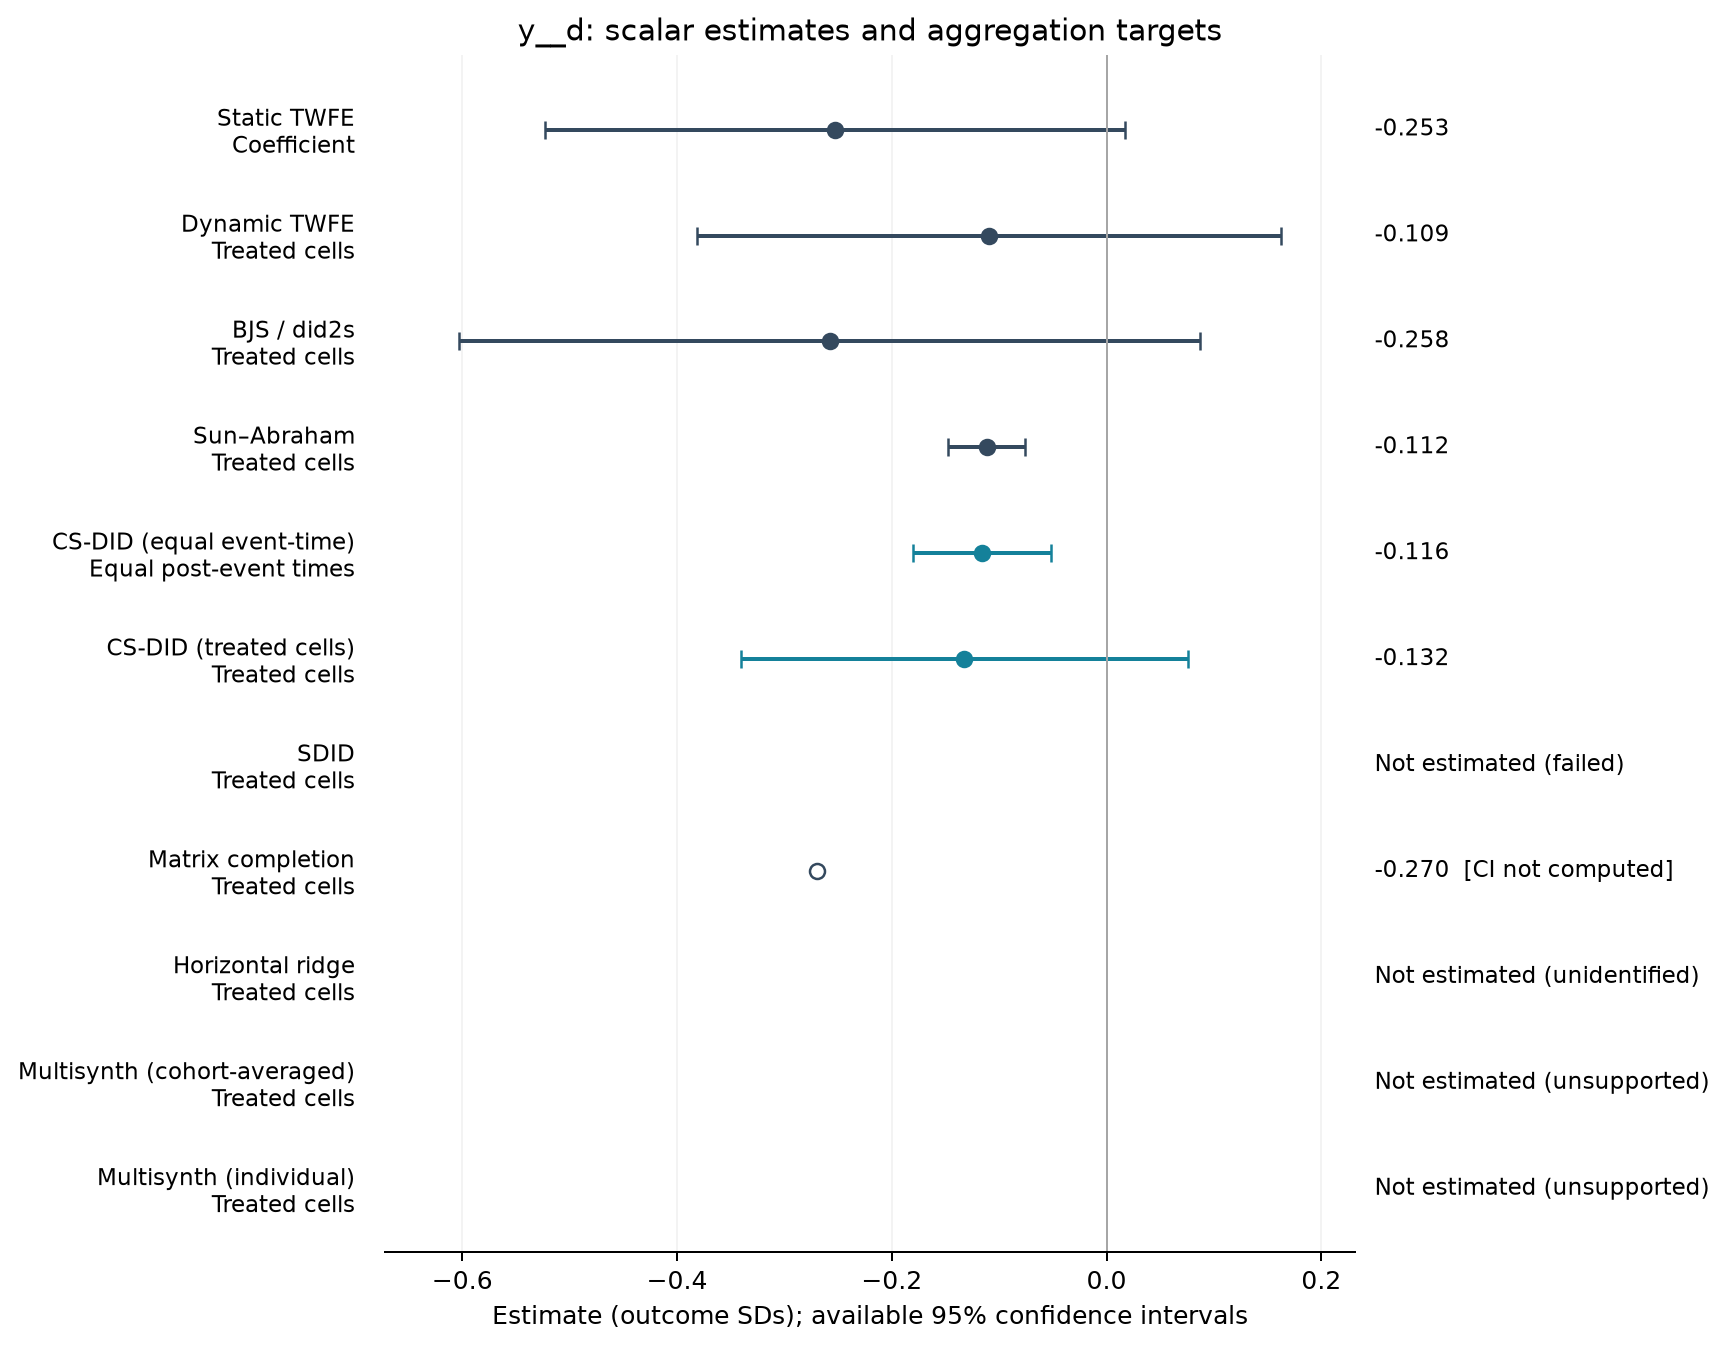
Estimate comparison
| Estimator | Estimate (SDs) | SE | 95% CI | Averaging |
|---|---|---|---|---|
| Static TWFE | -0.253 | 0.138 | [-0.523, 0.017] | Coefficient |
| Dynamic TWFE | -0.109 | 0.139 | [-0.381, 0.163] | Treated cells |
| BJS / did2s | -0.258 | 0.176 | [-0.603, 0.087] | Treated cells |
| Sun–Abraham | -0.112 | 0.018 | [-0.148, -0.076] | Treated cells |
| CS-DID (equal event-time) | -0.116 | 0.033 | [-0.180, -0.052] | Equal post-event times |
| CS-DID (treated cells) | -0.132 | 0.106 | [-0.341, 0.076] | Treated cells |
| Matrix completion | -0.270 | — | — | Treated cells |
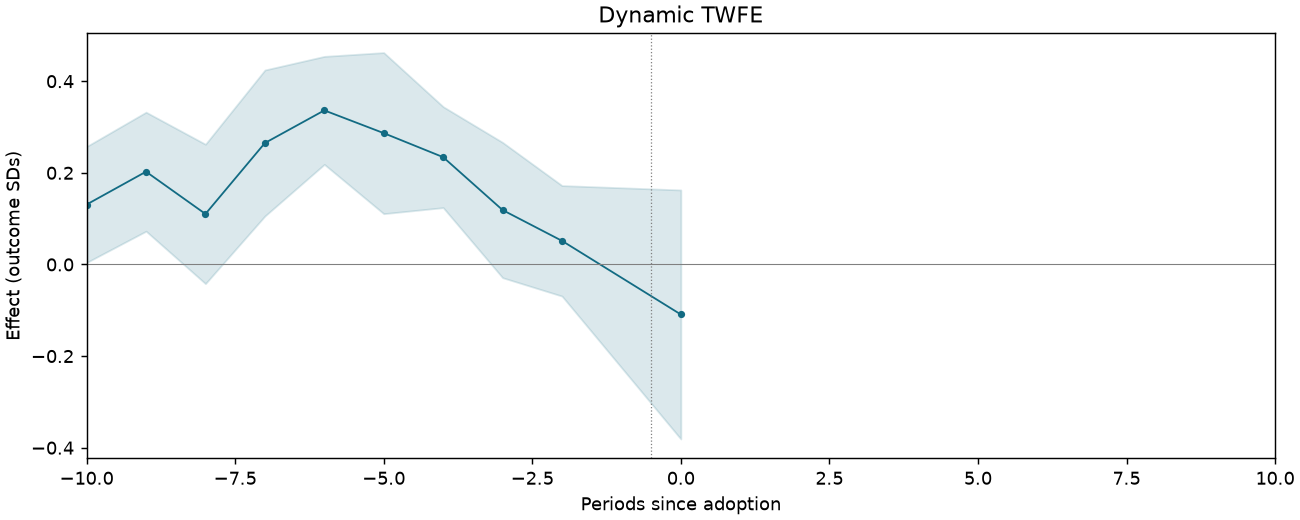
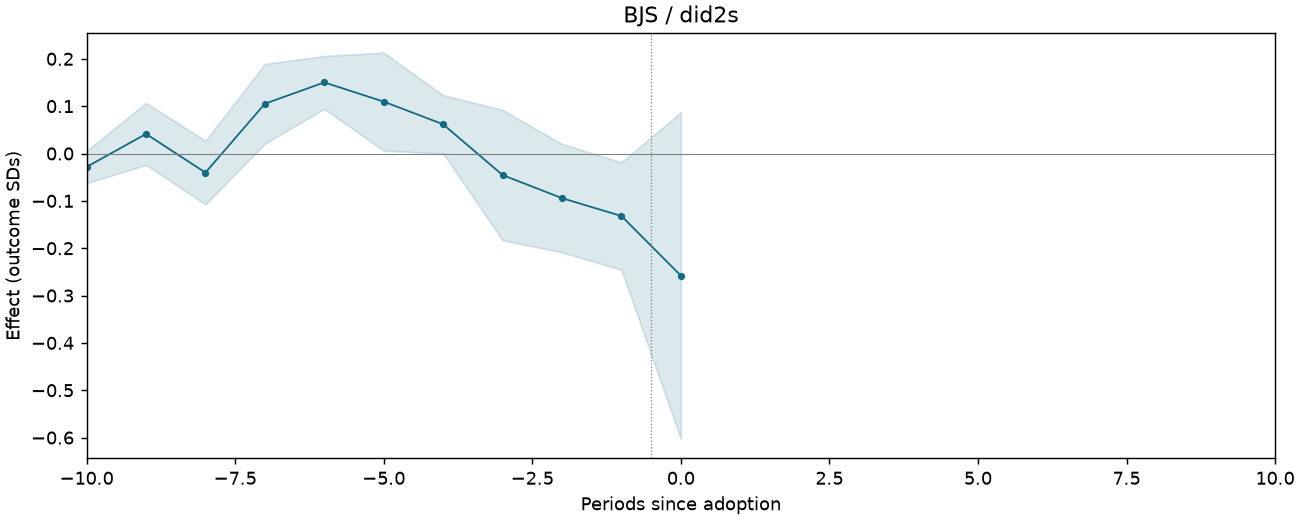
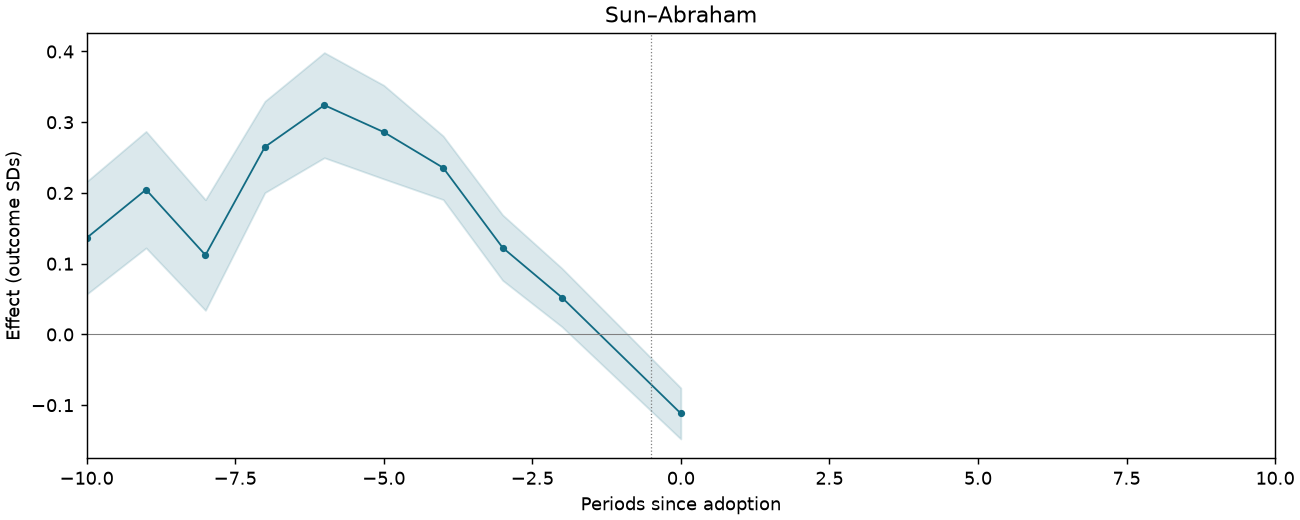
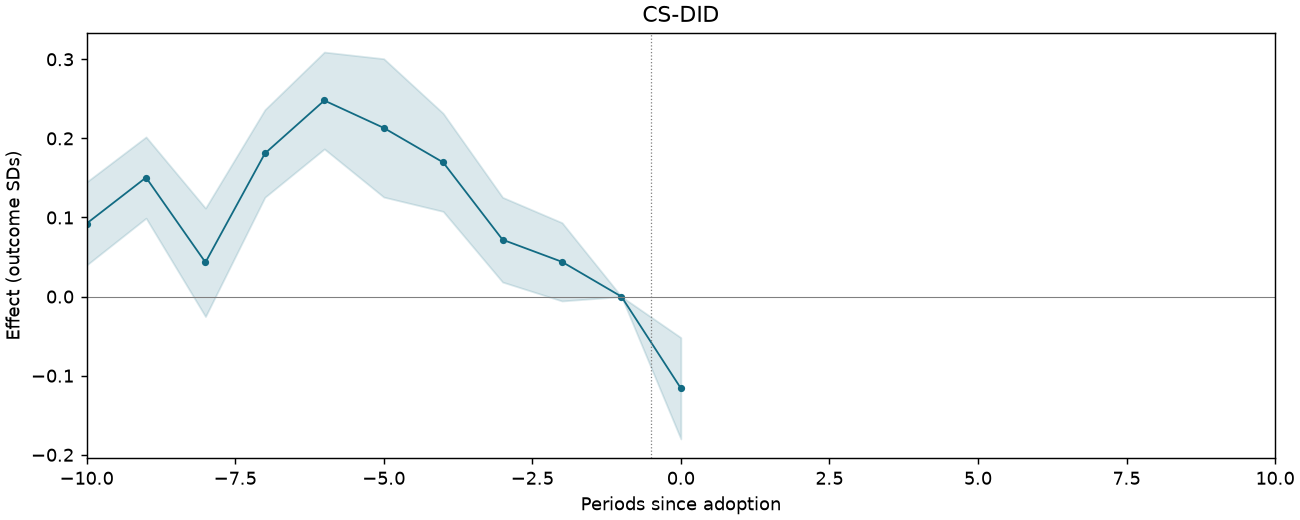
Event studies
Periods −10 to +10; pointwise 95% intervals where available.
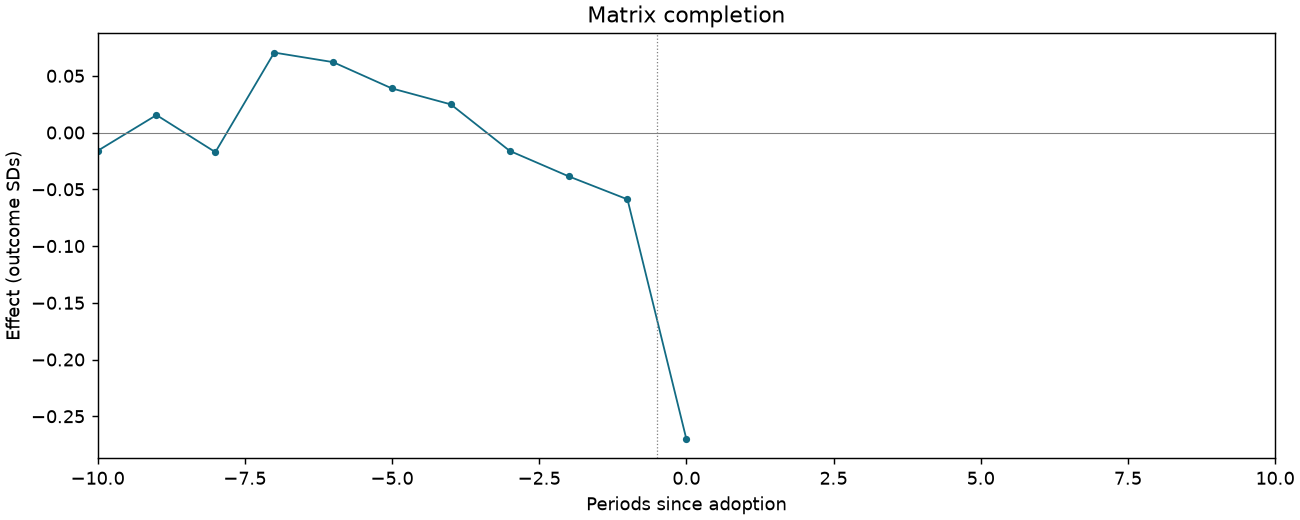
AM005-P2587-T2-DSALES-NOOV-M4M1
169,446 observations · 15,631 units · 2,021 clusters · 947 treated / 14,684 control units.
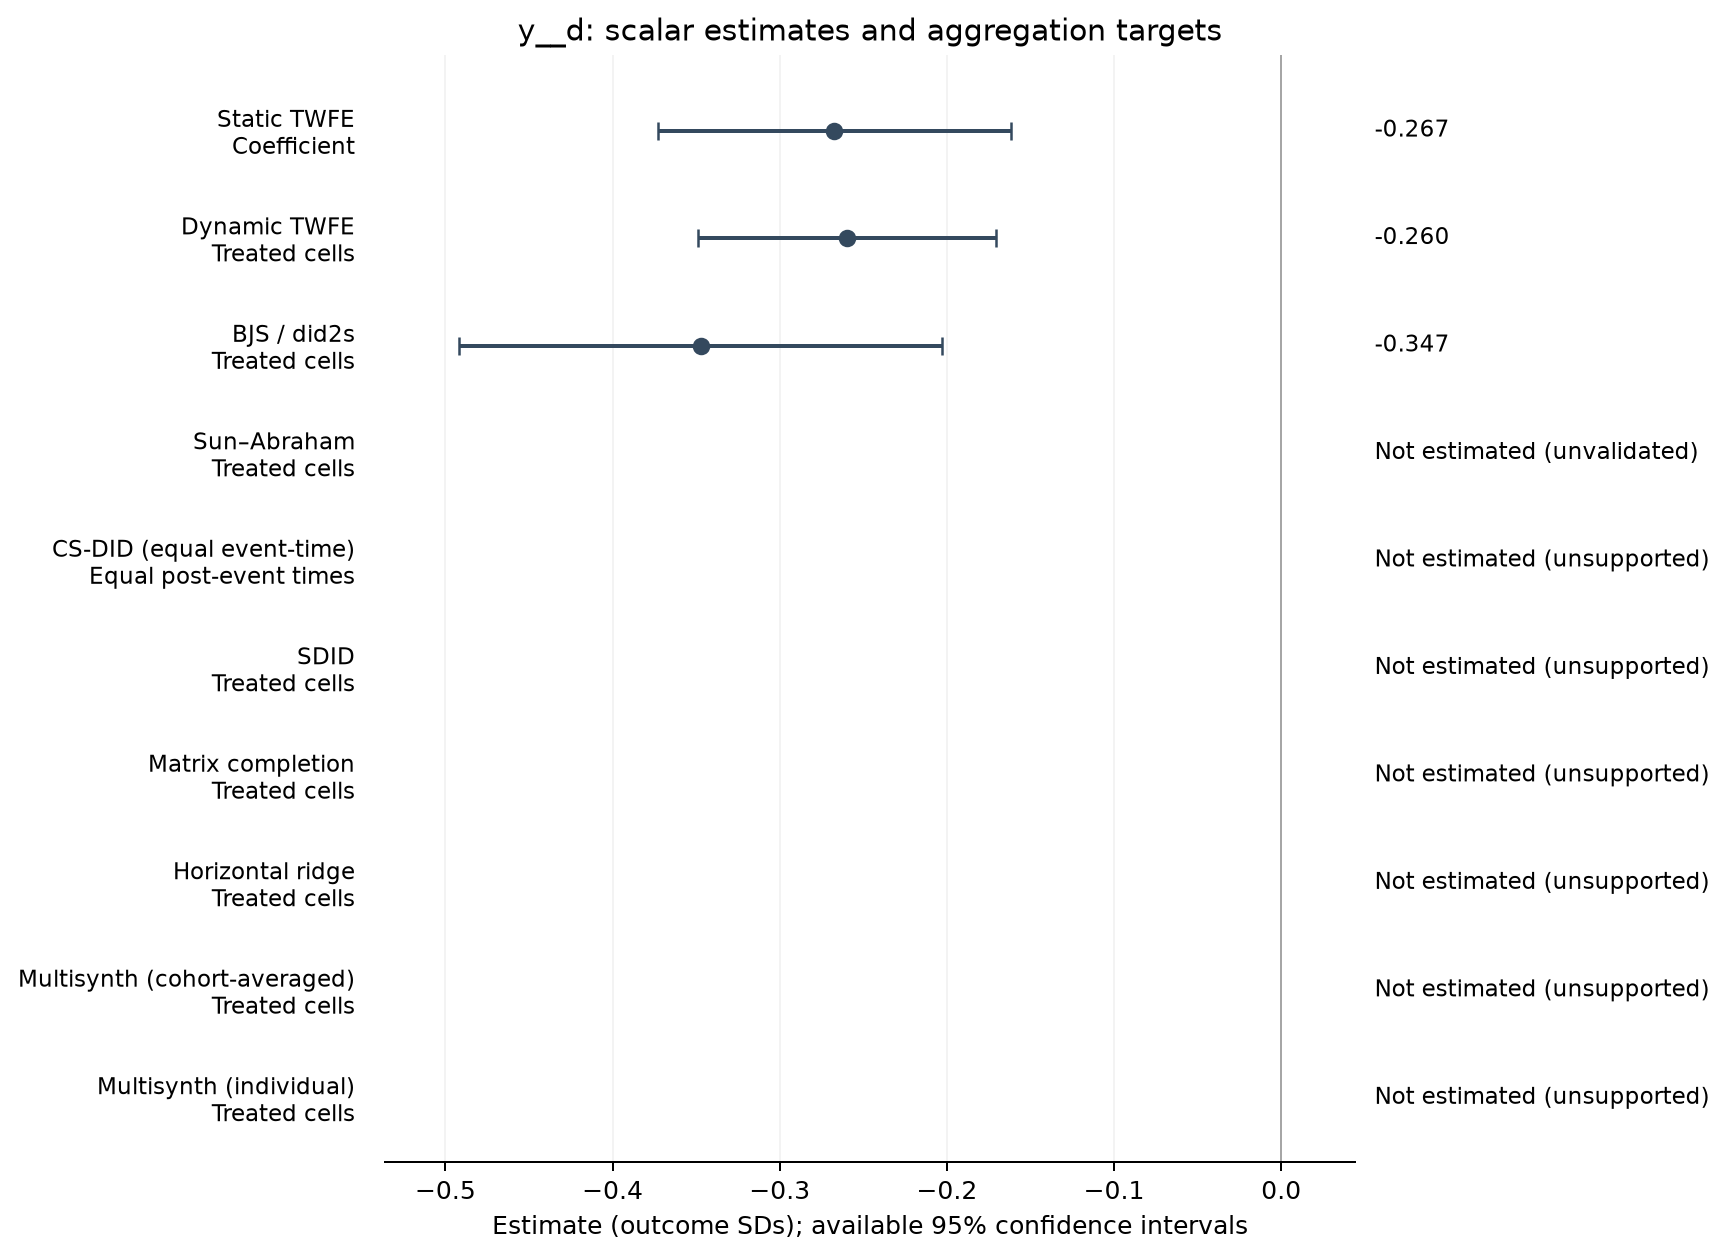
Estimate comparison
| Estimator | Estimate (SDs) | SE | 95% CI | Averaging |
|---|---|---|---|---|
| Static TWFE | -0.267 | 0.054 | [-0.373, -0.161] | Coefficient |
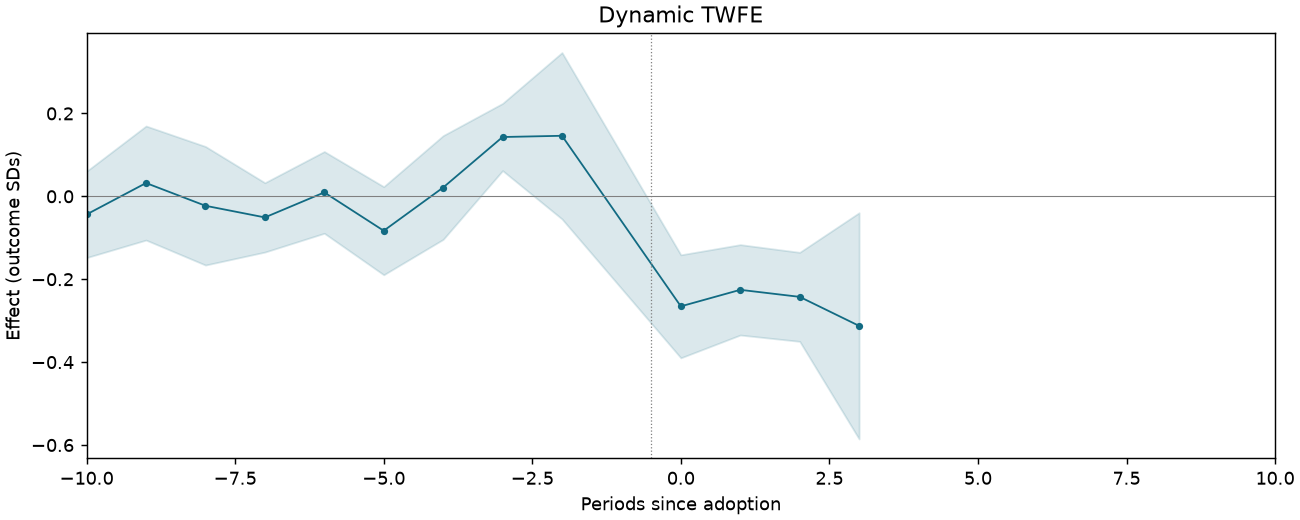
| Dynamic TWFE | -0.260 | 0.045 | [-0.349, -0.171] | Treated cells |
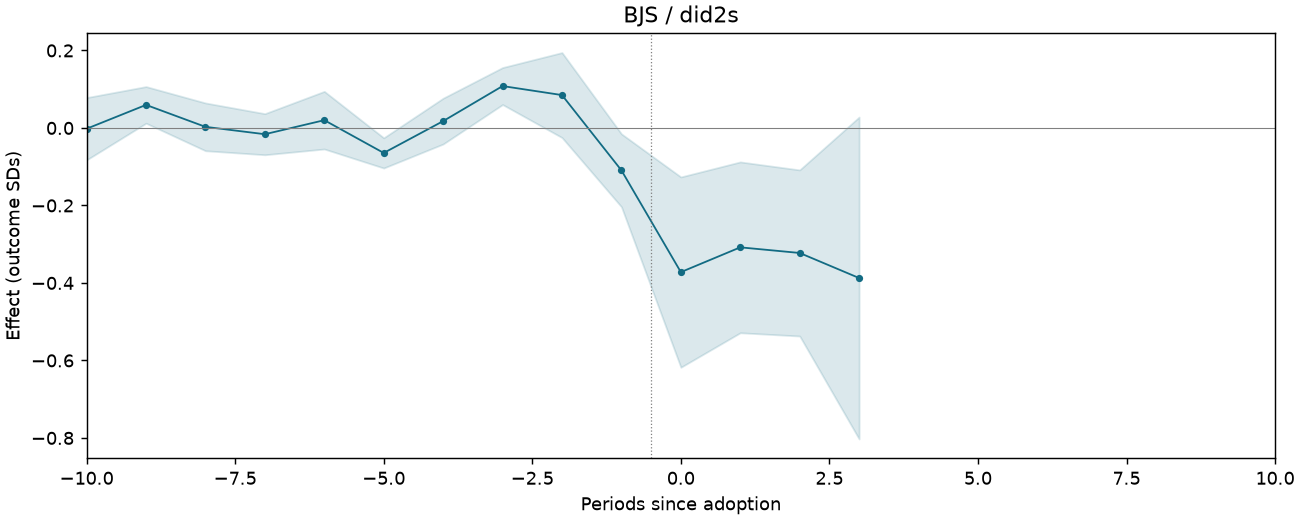
| BJS / did2s | -0.347 | 0.074 | [-0.492, -0.203] | Treated cells |
Event studies
Periods −10 to +10; pointwise 95% intervals where available.
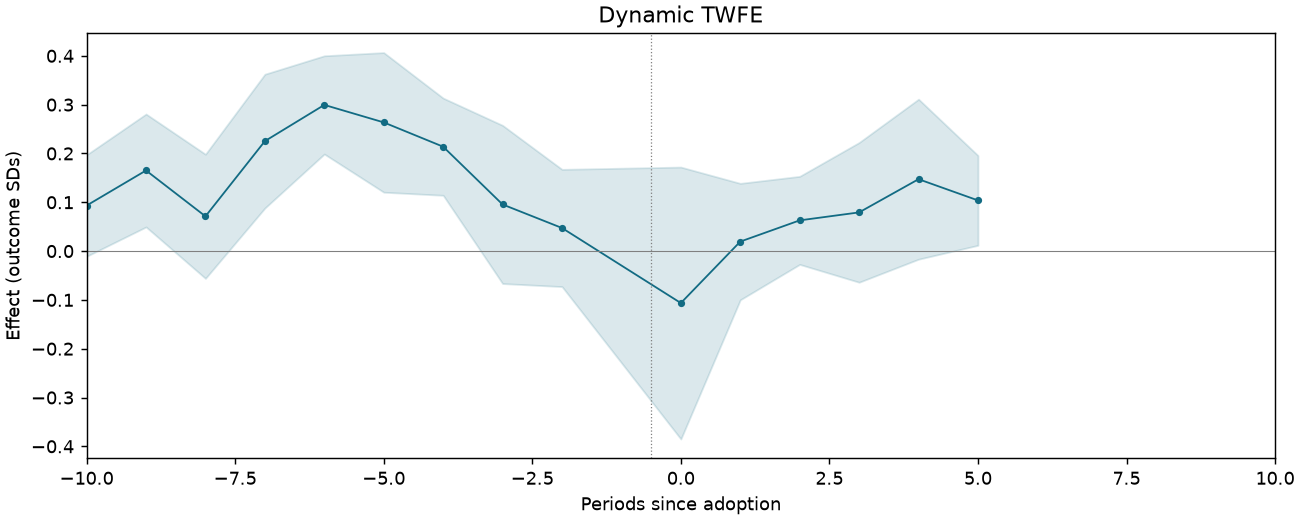
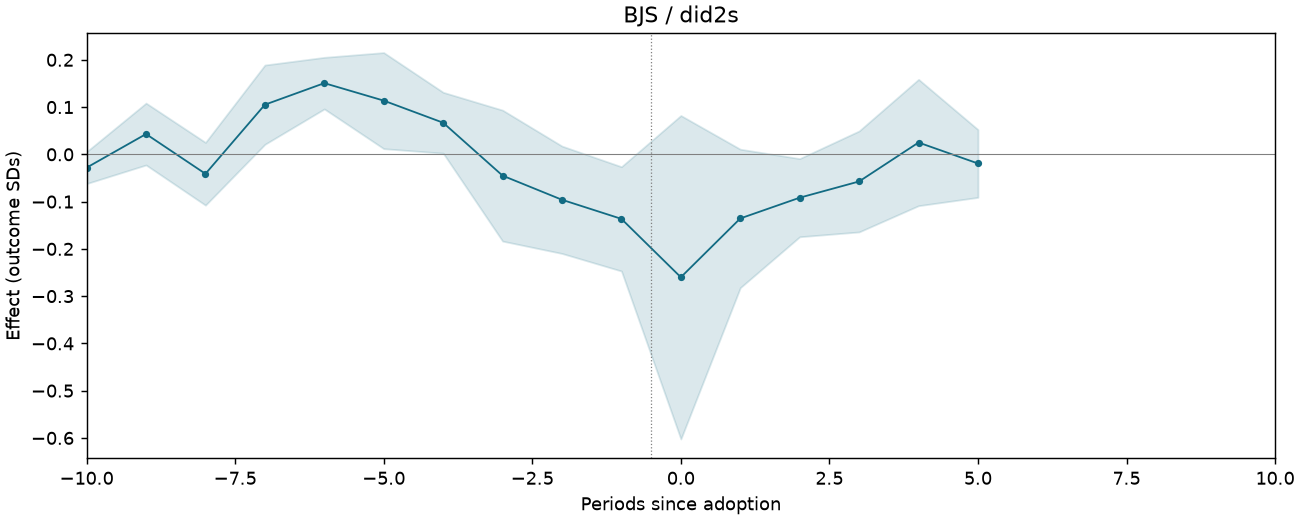
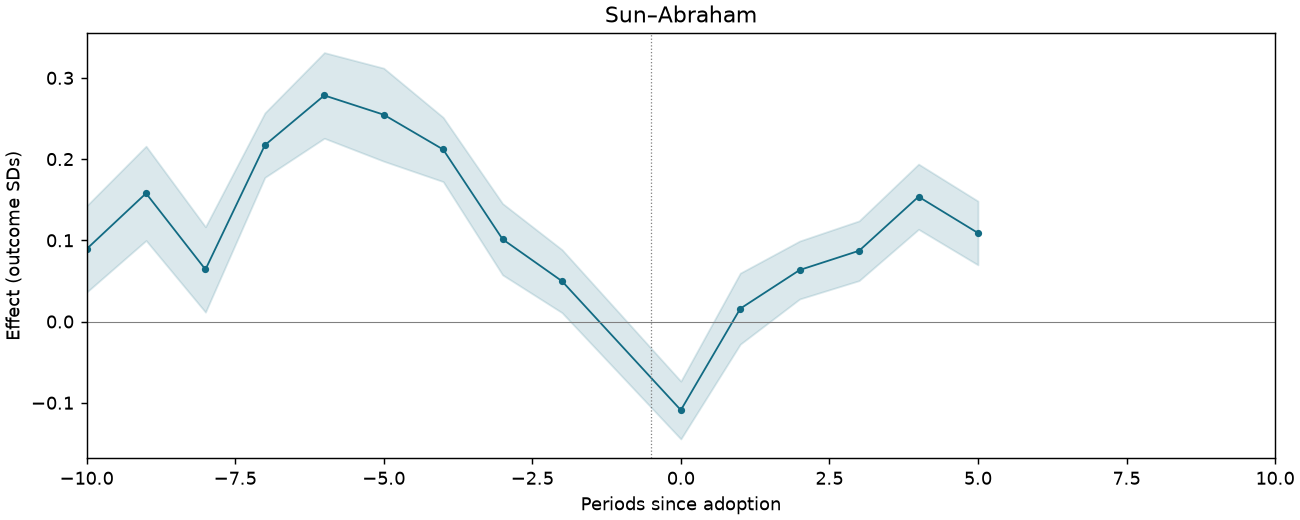
AM005-P2587-T2-DSALES-QP-M1
171,347 observations · 15,459 units · 2,028 clusters · 880 treated / 14,579 control units.
Estimate comparison
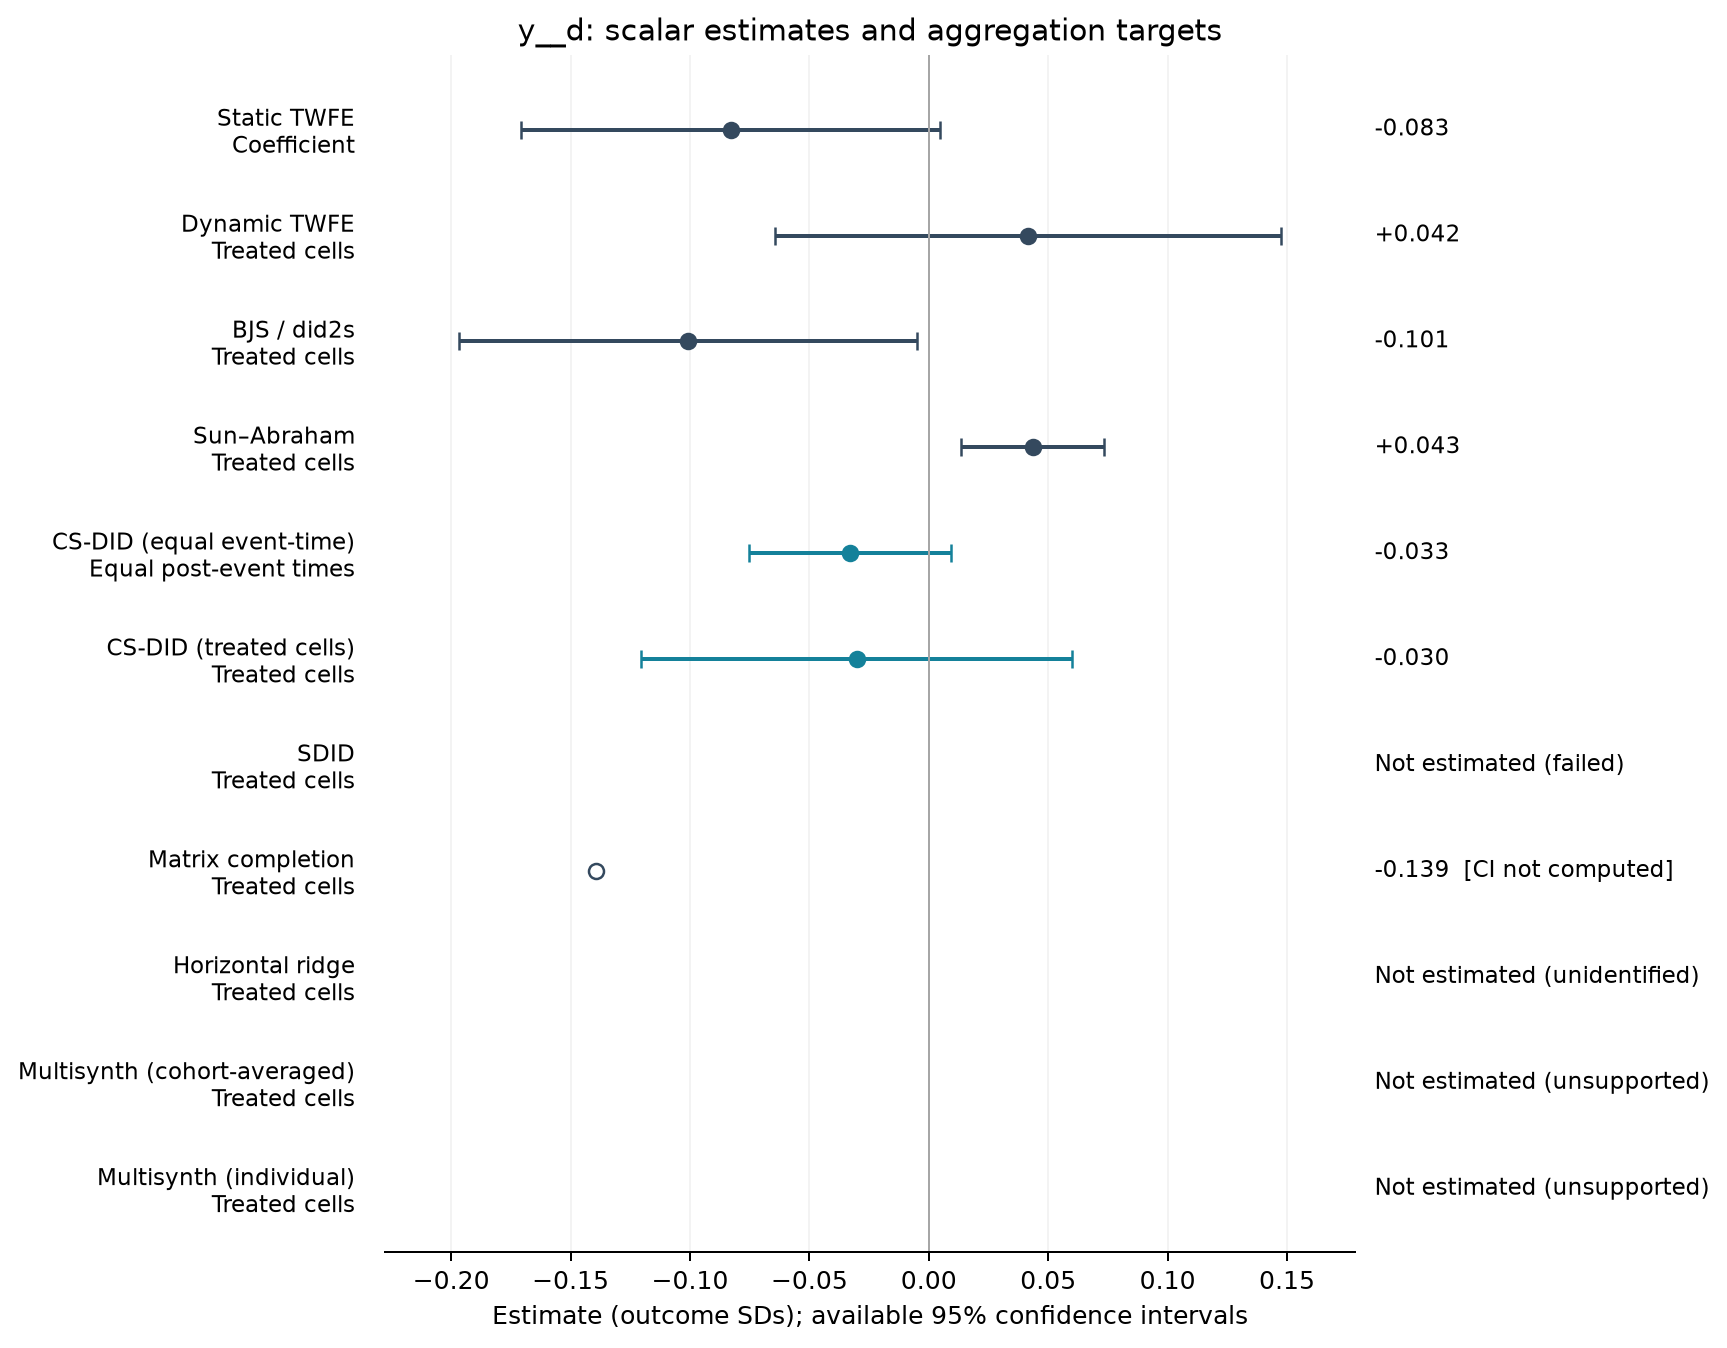
| Estimator | Estimate (SDs) | SE | 95% CI | Averaging |
|---|---|---|---|---|
| Static TWFE | -0.083 | 0.045 | [-0.171, 0.005] | Coefficient |
| Dynamic TWFE | 0.042 | 0.054 | [-0.064, 0.148] | Treated cells |
| BJS / did2s | -0.101 | 0.049 | [-0.197, -0.005] | Treated cells |
| Sun–Abraham | 0.043 | 0.015 | [0.013, 0.074] | Treated cells |
| CS-DID (equal event-time) | -0.033 | 0.022 | [-0.075, 0.009] | Equal post-event times |
| CS-DID (treated cells) | -0.030 | 0.046 | [-0.120, 0.060] | Treated cells |
| Matrix completion | -0.139 | — | — | Treated cells |
Event studies
Periods −10 to +10; pointwise 95% intervals where available.
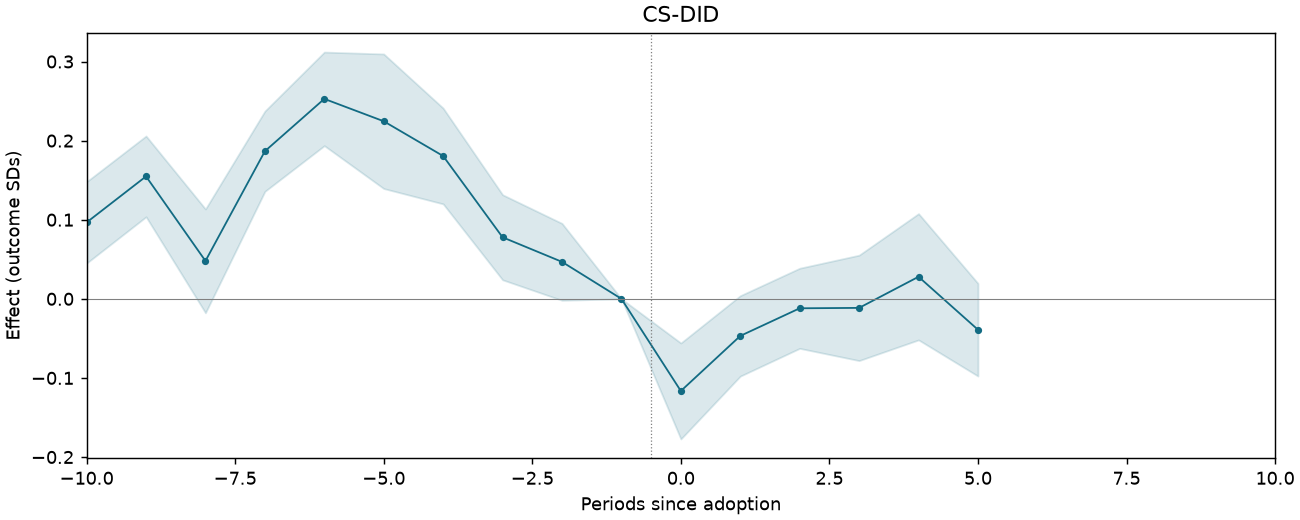
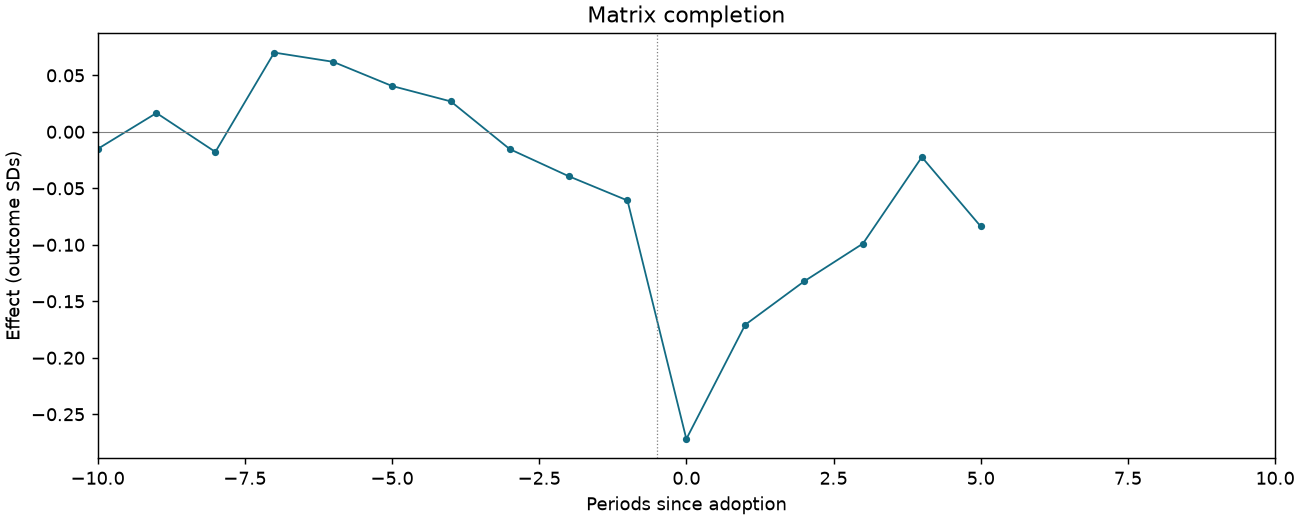
AM005-P2587-T2-DSALES-QP-M4
168,711 observations · 15,419 units · 2,020 clusters · 947 treated / 14,472 control units.
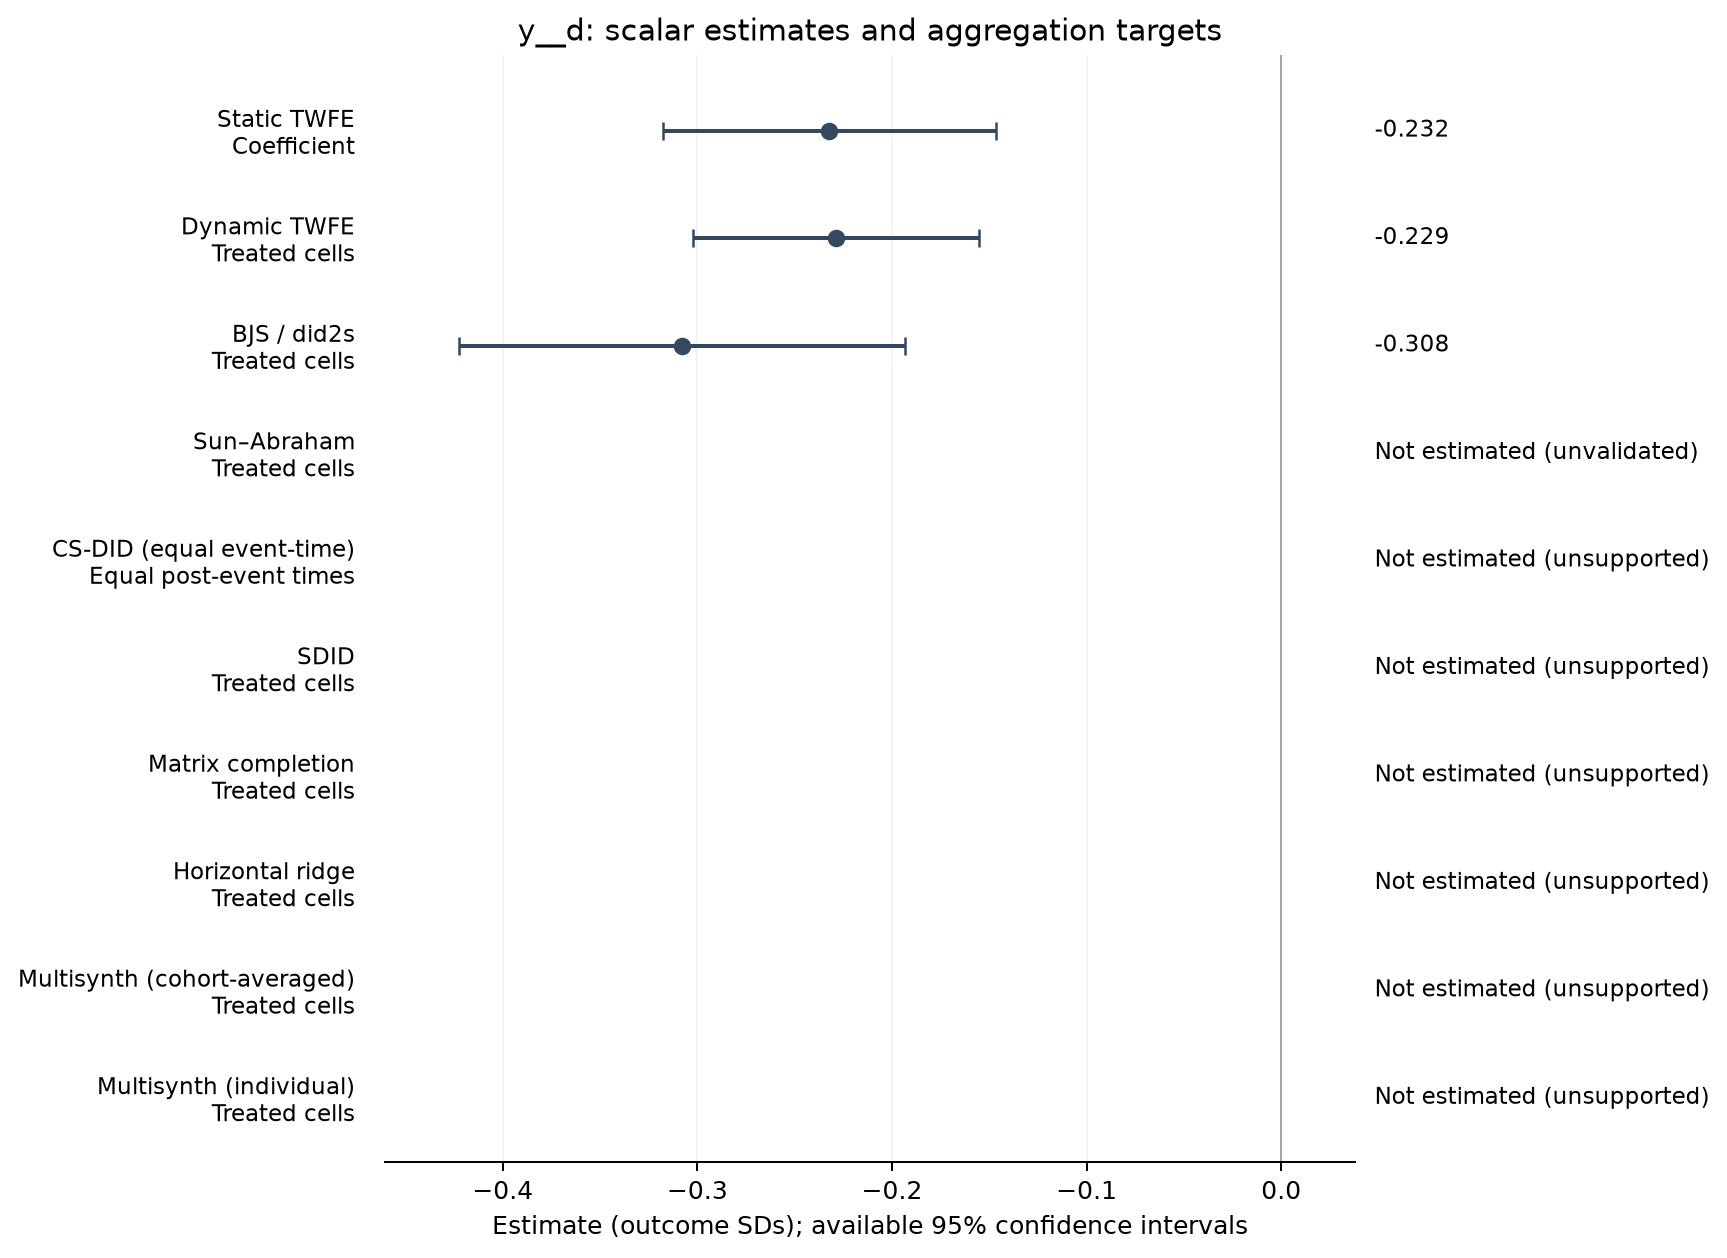
Estimate comparison
| Estimator | Estimate (SDs) | SE | 95% CI | Averaging |
|---|---|---|---|---|
| Static TWFE | -0.232 | 0.044 | [-0.318, -0.147] | Coefficient |
| Dynamic TWFE | -0.229 | 0.037 | [-0.302, -0.155] | Treated cells |
| BJS / did2s | -0.308 | 0.058 | [-0.422, -0.193] | Treated cells |
Event studies
Periods −10 to +10; pointwise 95% intervals where available.
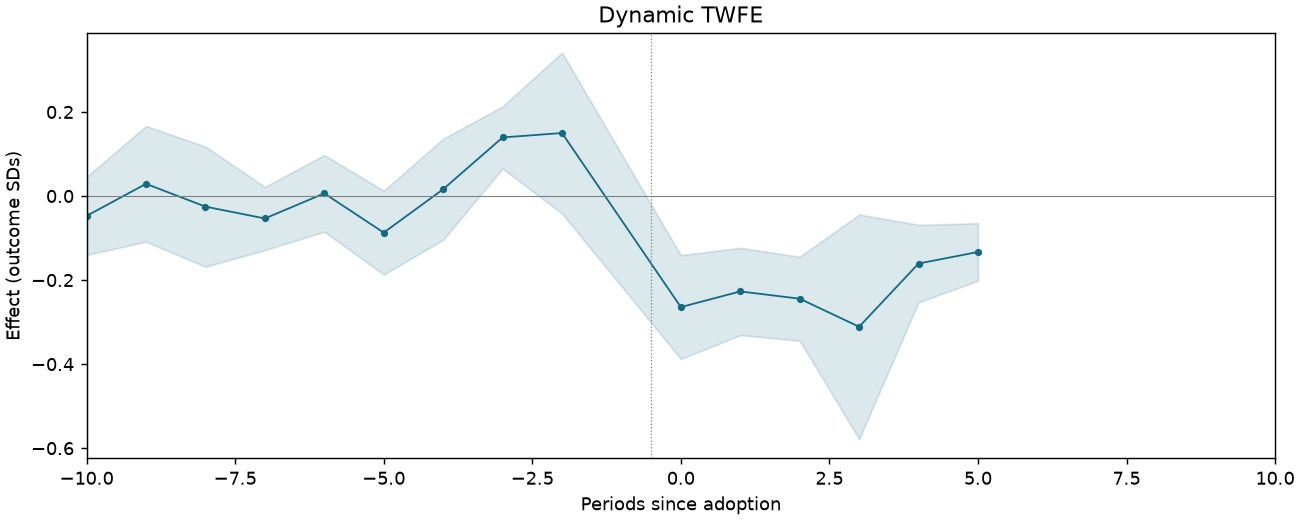
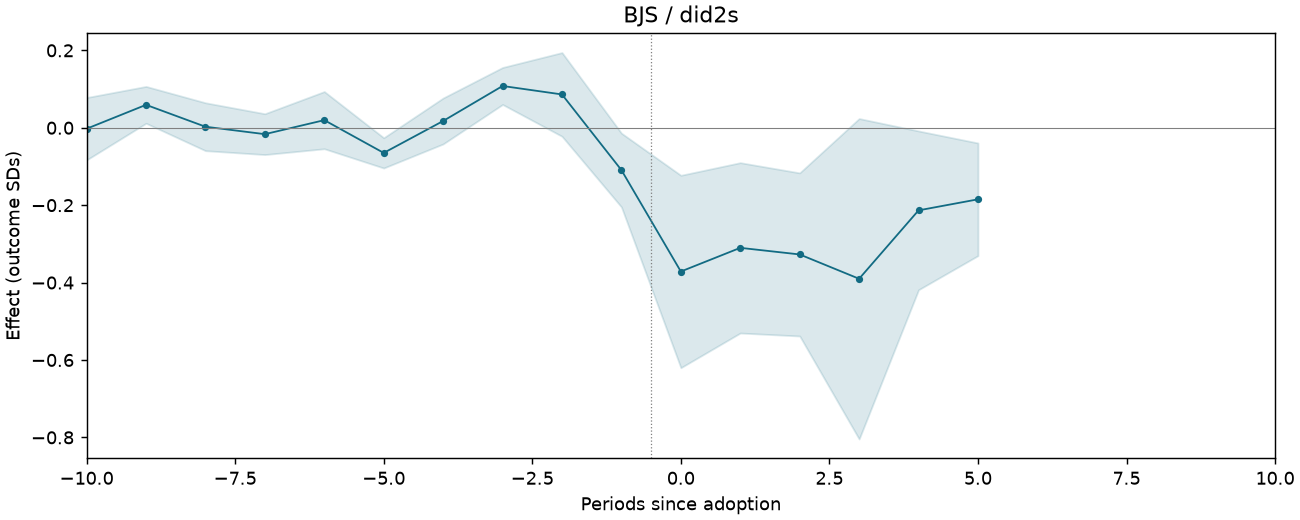
AM005-P2587-T2-RD-ACTUAL
83,997 observations · 8,574 units · 1,918 clusters · 330 treated / 8,244 control units.
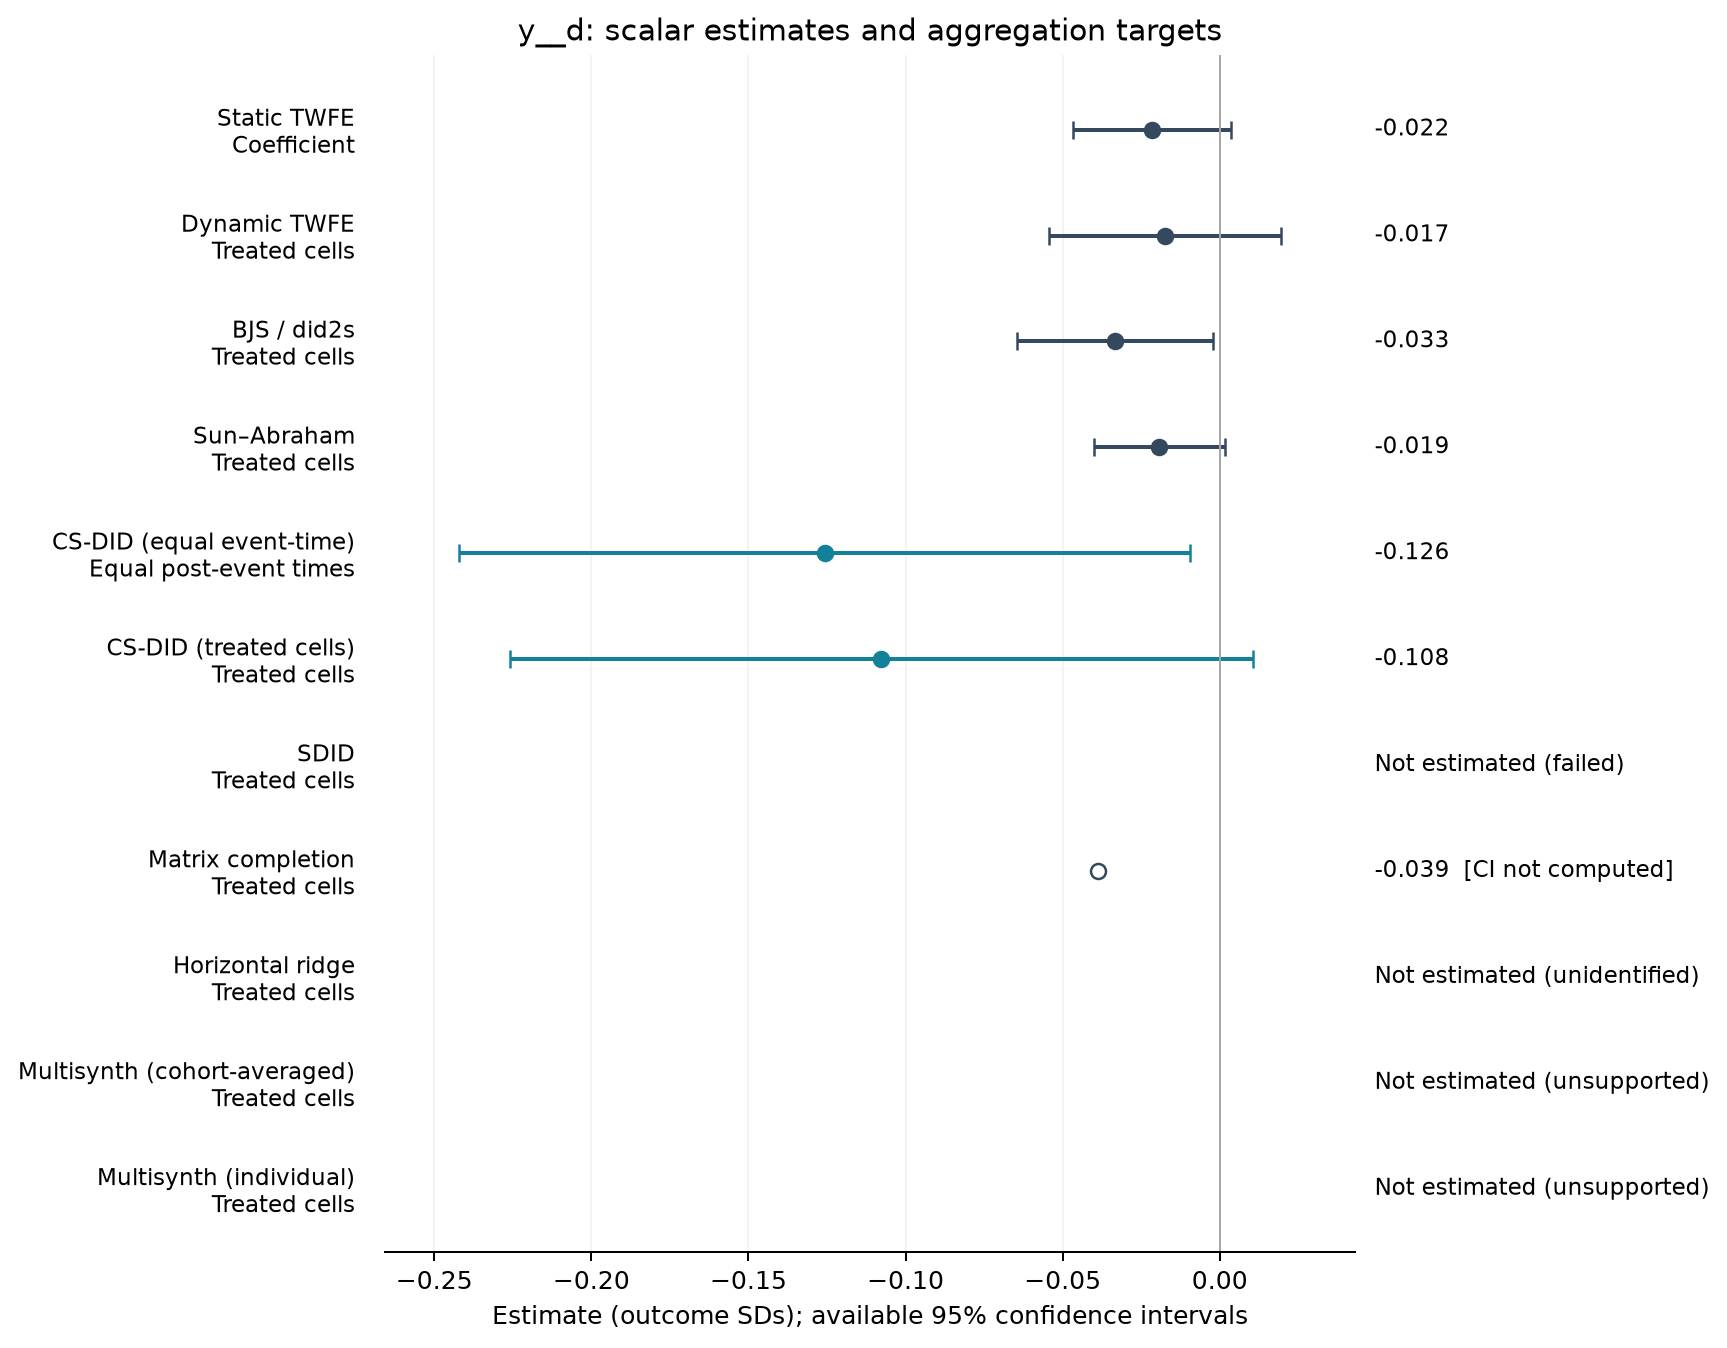
Estimate comparison
| Estimator | Estimate (SDs) | SE | 95% CI | Averaging |
|---|---|---|---|---|
| Static TWFE | -0.022 | 0.013 | [-0.047, 0.004] | Coefficient |
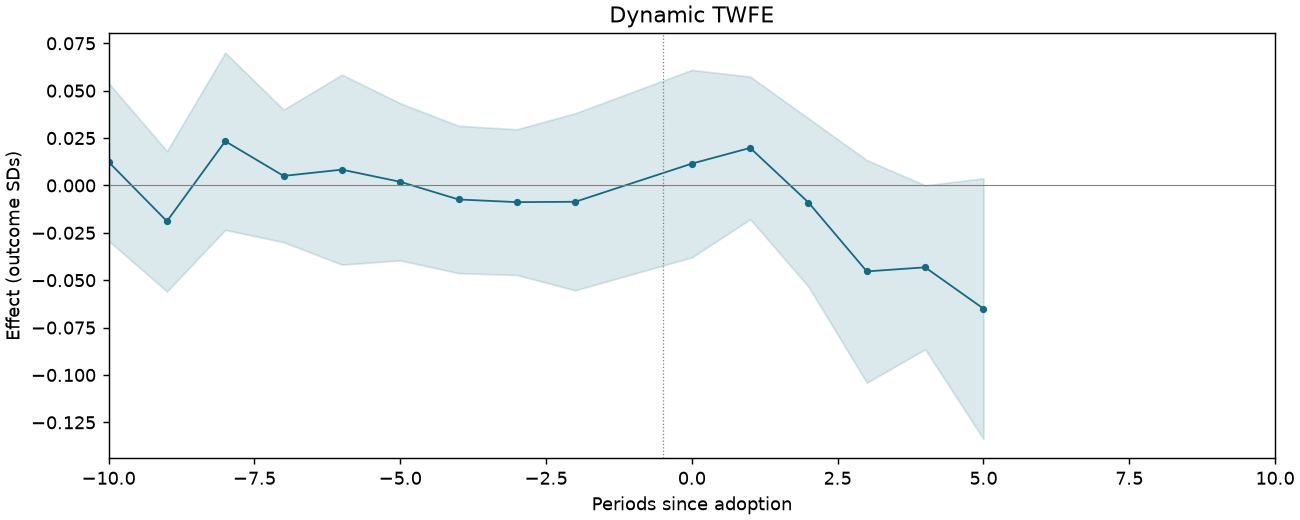
| Dynamic TWFE | -0.017 | 0.019 | [-0.054, 0.020] | Treated cells |
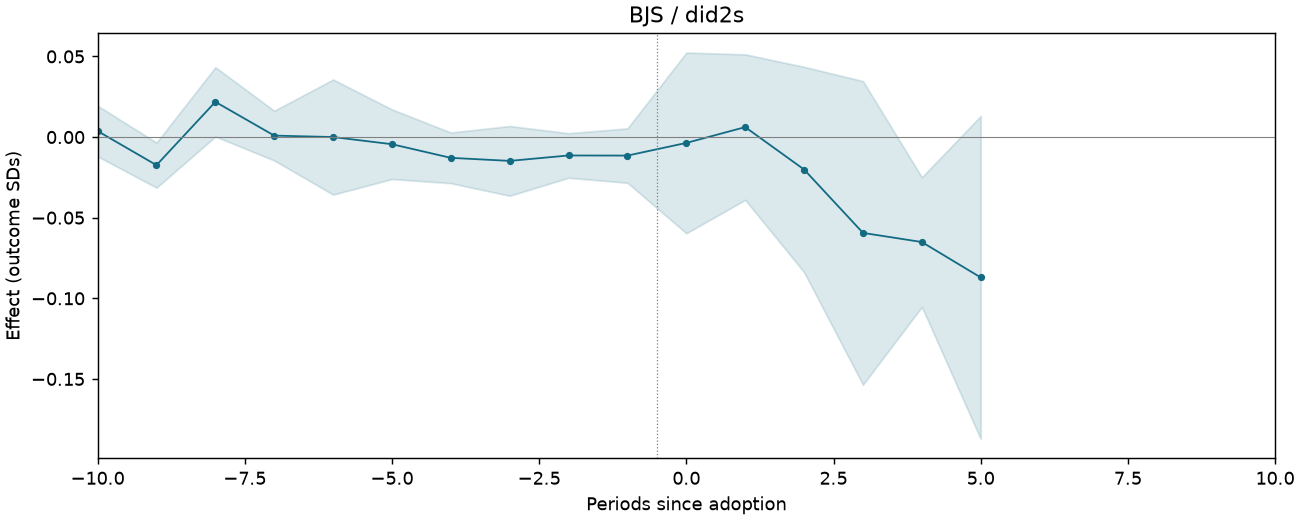
| BJS / did2s | -0.033 | 0.016 | [-0.064, -0.002] | Treated cells |
| Sun–Abraham | -0.019 | 0.011 | [-0.040, 0.002] | Treated cells |
| CS-DID (equal event-time) | -0.126 | 0.059 | [-0.242, -0.009] | Equal post-event times |
| CS-DID (treated cells) | -0.108 | 0.060 | [-0.226, 0.010] | Treated cells |
| Matrix completion | -0.039 | — | — | Treated cells |
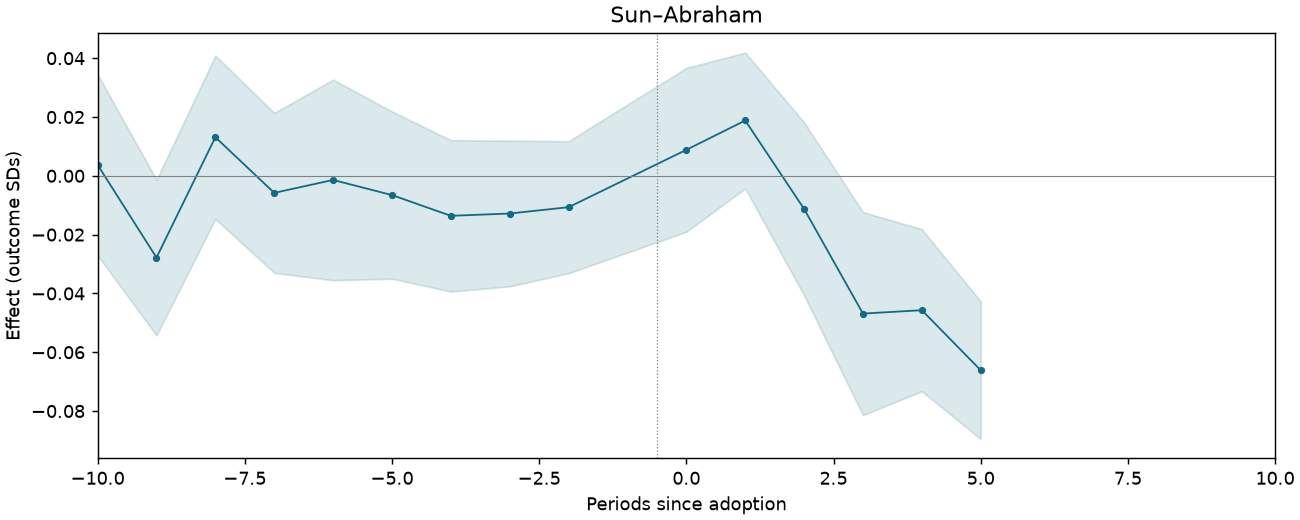
Event studies
Periods −10 to +10; pointwise 95% intervals where available.
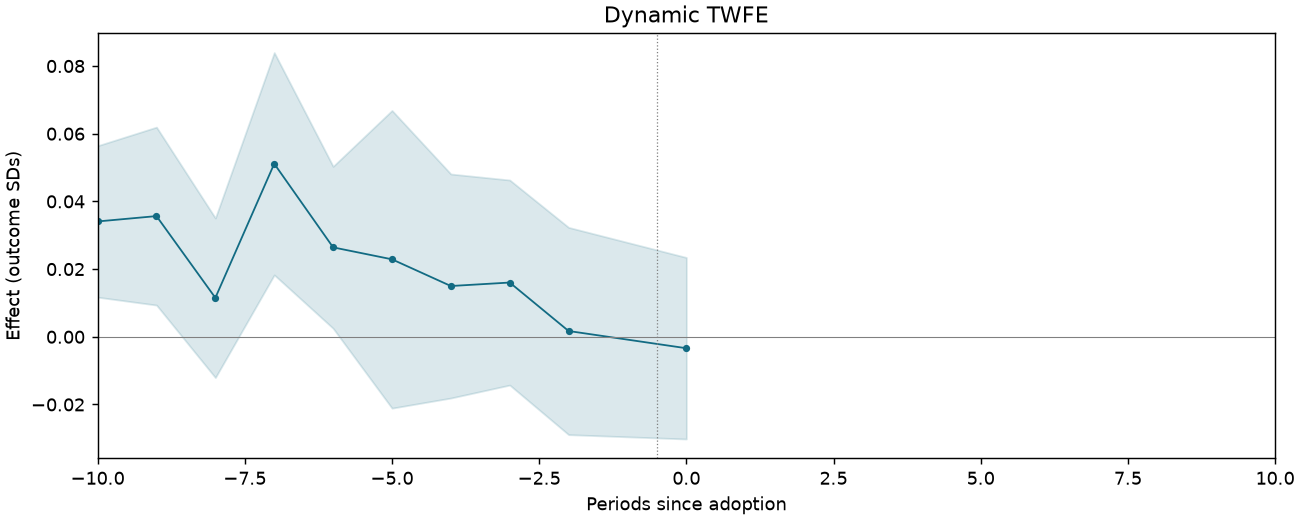
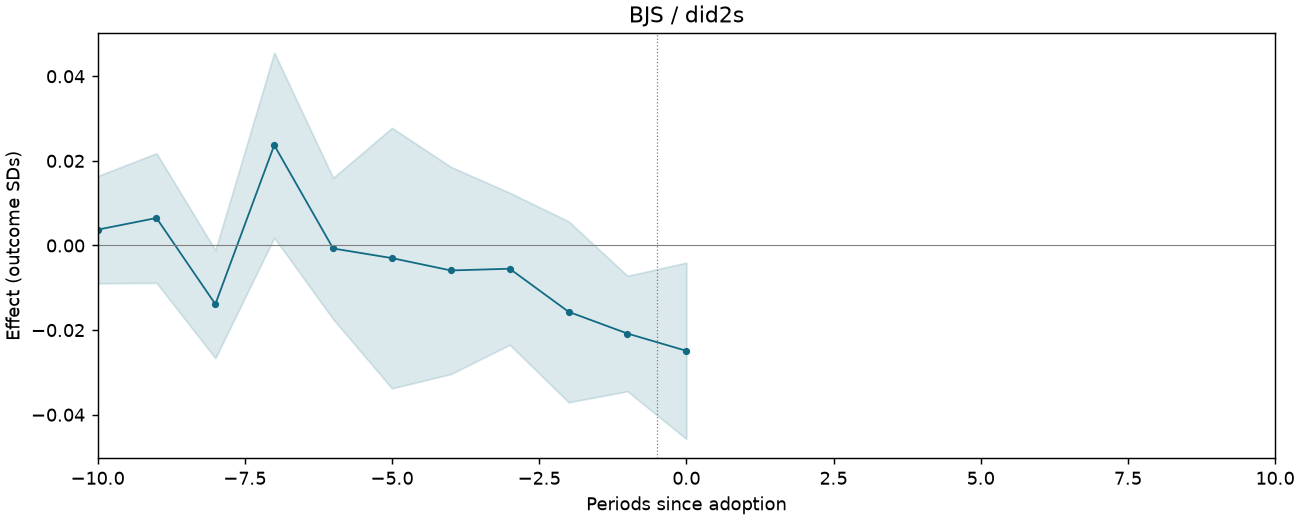
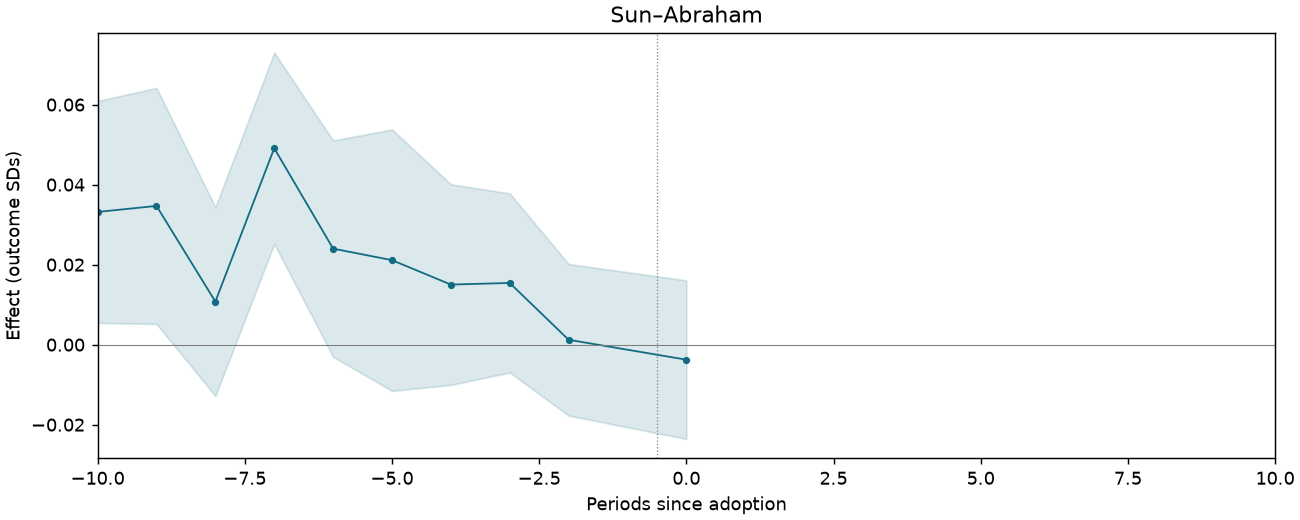
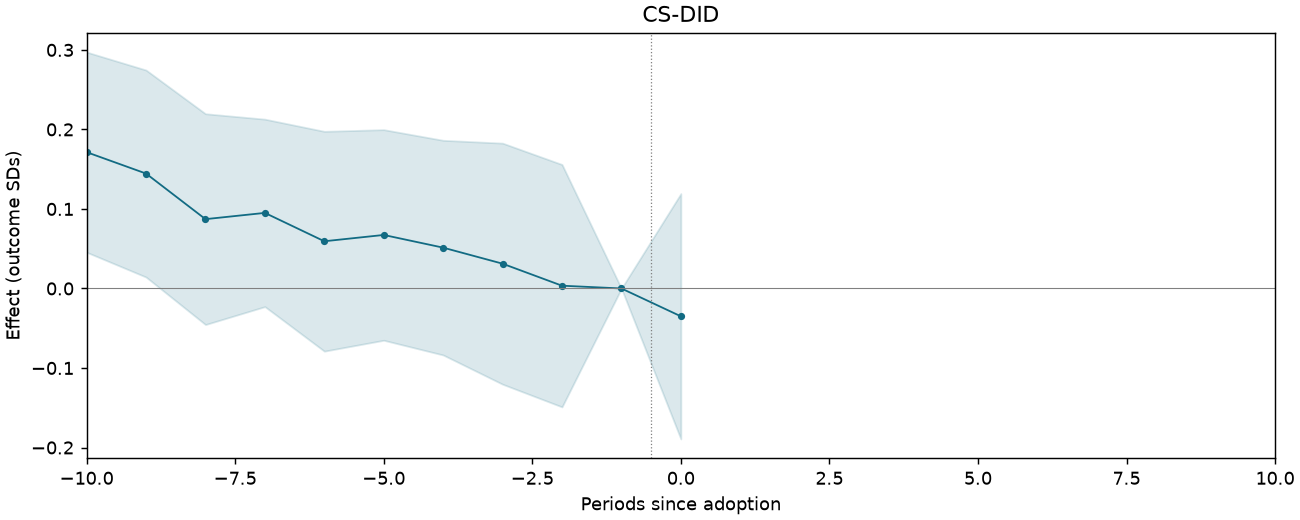
AM005-P2587-T2-RD-NOOV-M1
83,423 observations · 8,642 units · 1,911 clusters · 320 treated / 8,322 control units.
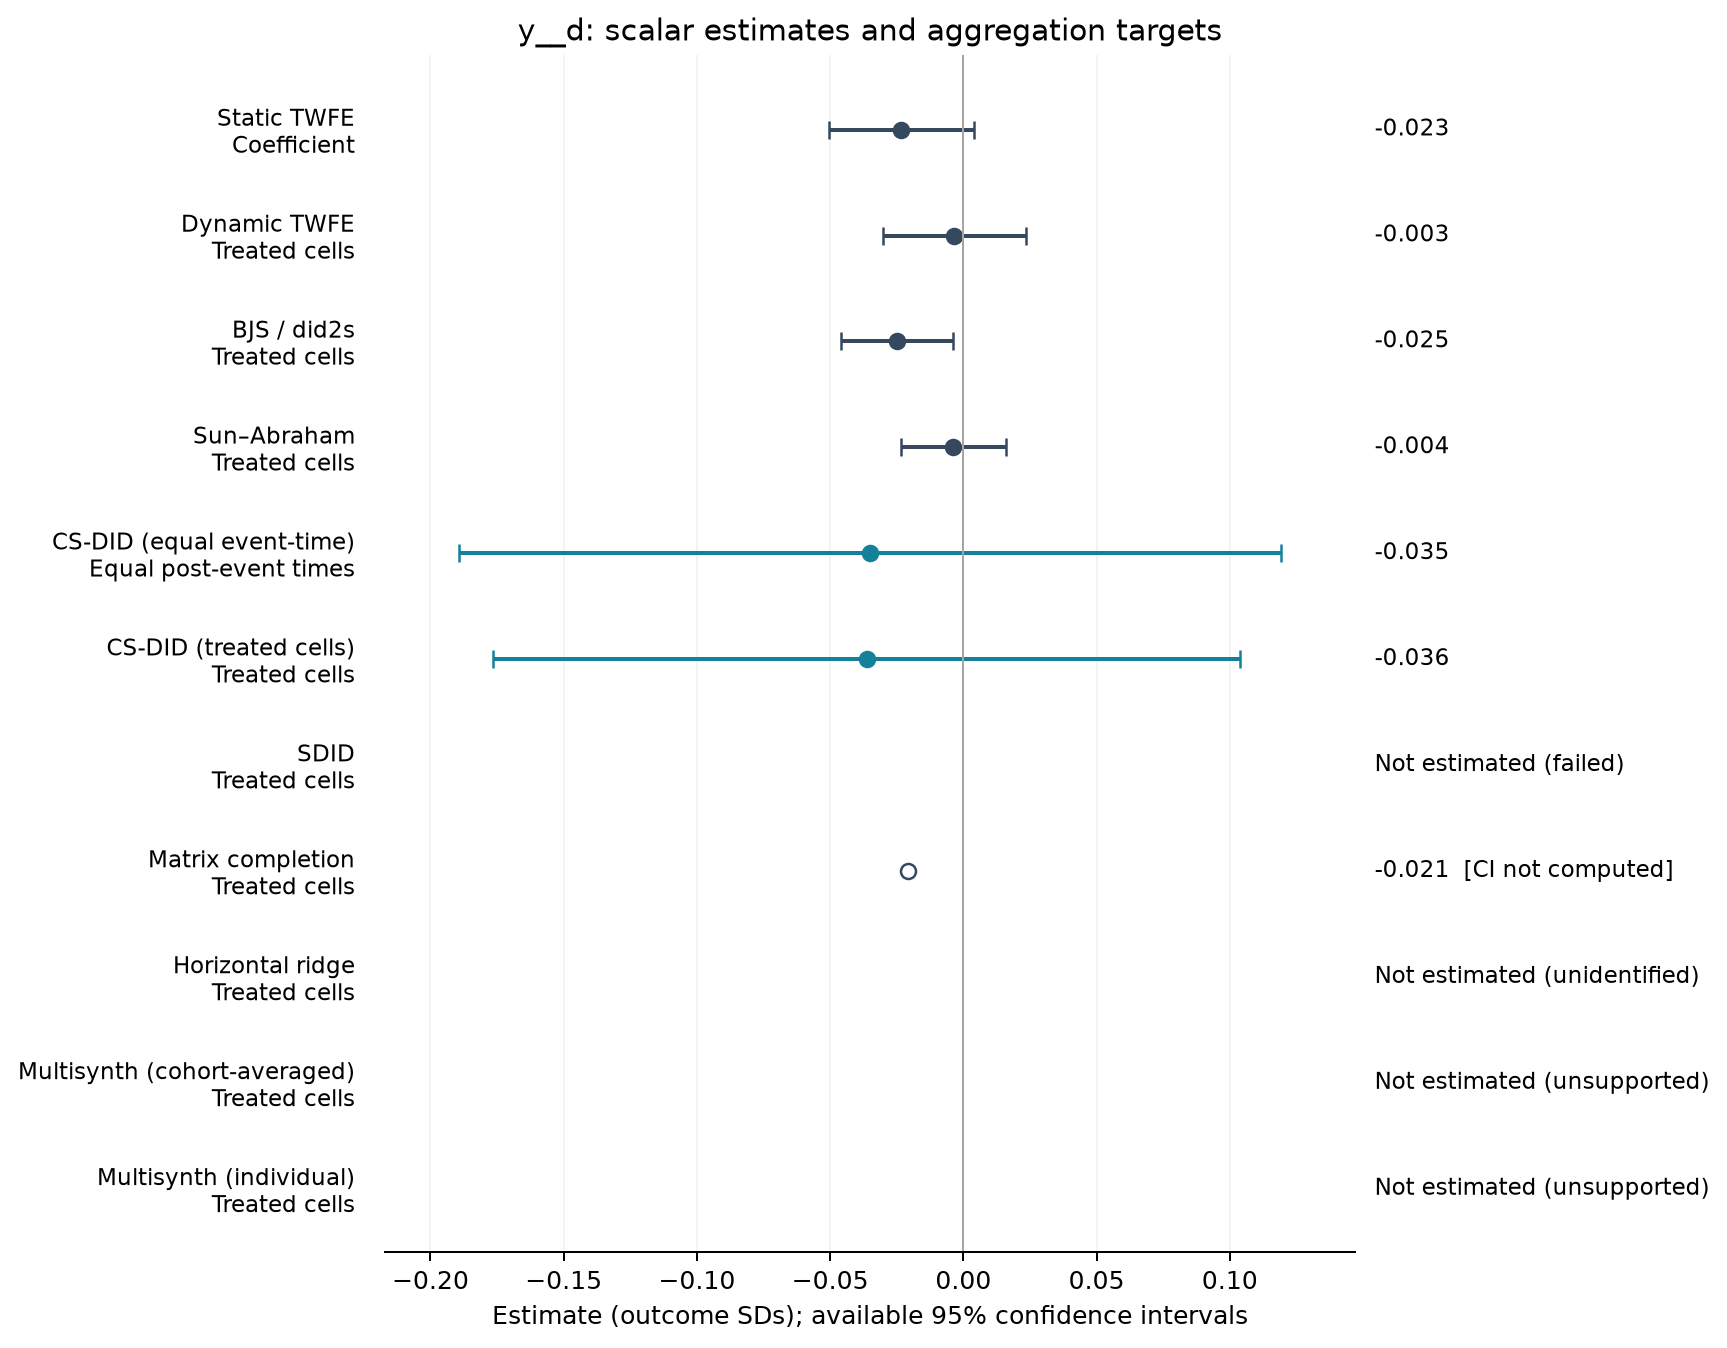
Estimate comparison
| Estimator | Estimate (SDs) | SE | 95% CI | Averaging |
|---|---|---|---|---|
| Static TWFE | -0.023 | 0.014 | [-0.050, 0.004] | Coefficient |
| Dynamic TWFE | -0.003 | 0.014 | [-0.030, 0.023] | Treated cells |
| BJS / did2s | -0.025 | 0.011 | [-0.046, -0.004] | Treated cells |
| Sun–Abraham | -0.004 | 0.010 | [-0.024, 0.016] | Treated cells |
| CS-DID (equal event-time) | -0.035 | 0.079 | [-0.189, 0.119] | Equal post-event times |
| CS-DID (treated cells) | -0.036 | 0.072 | [-0.177, 0.104] | Treated cells |
| Matrix completion | -0.021 | — | — | Treated cells |
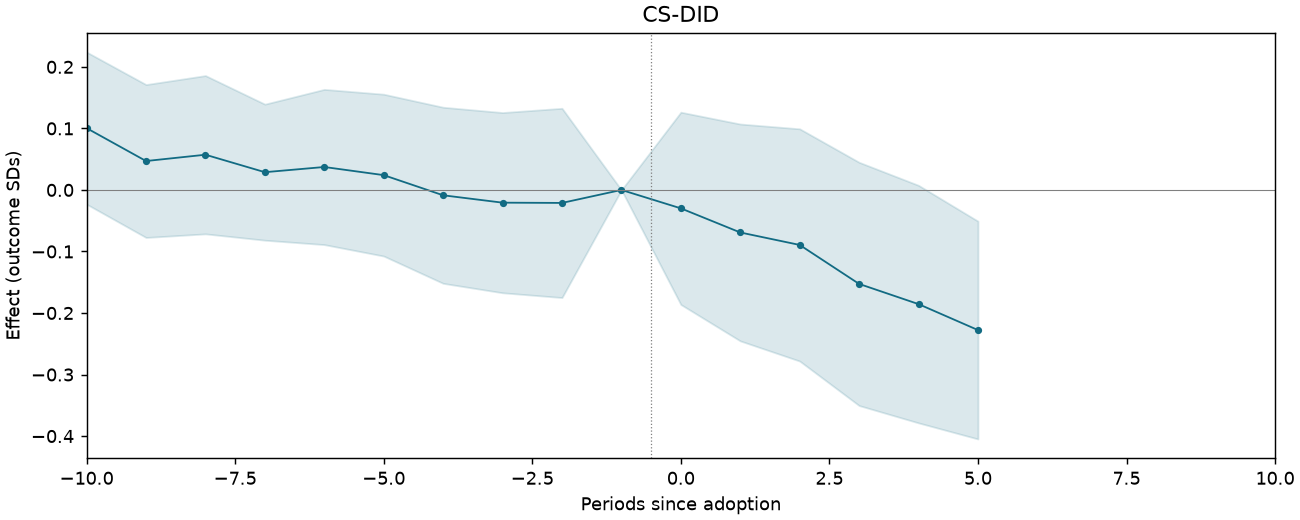
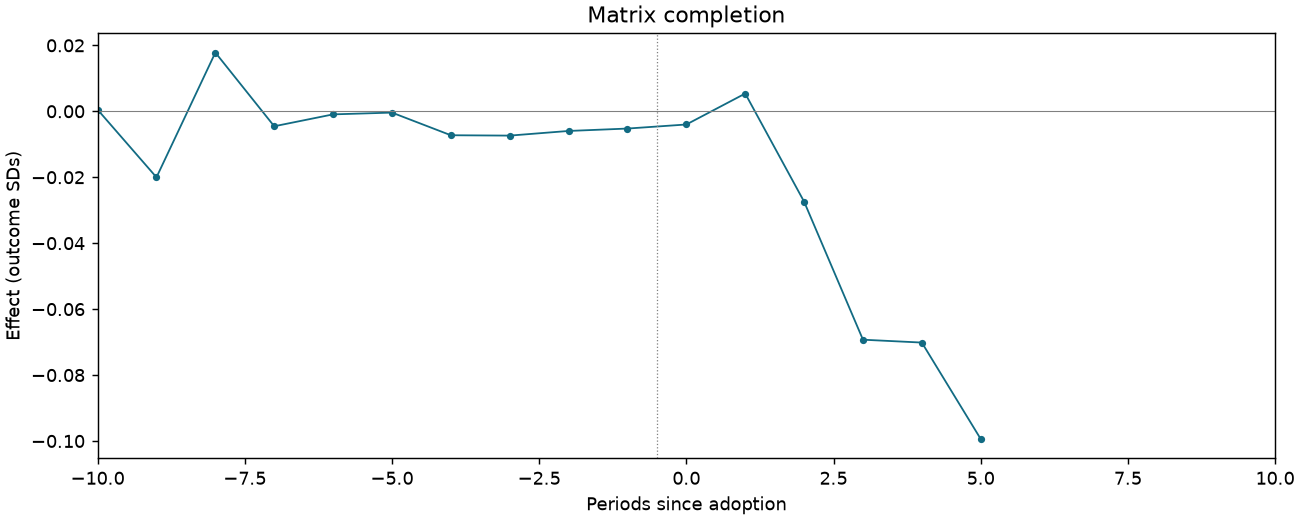
Event studies
Periods −10 to +10; pointwise 95% intervals where available.
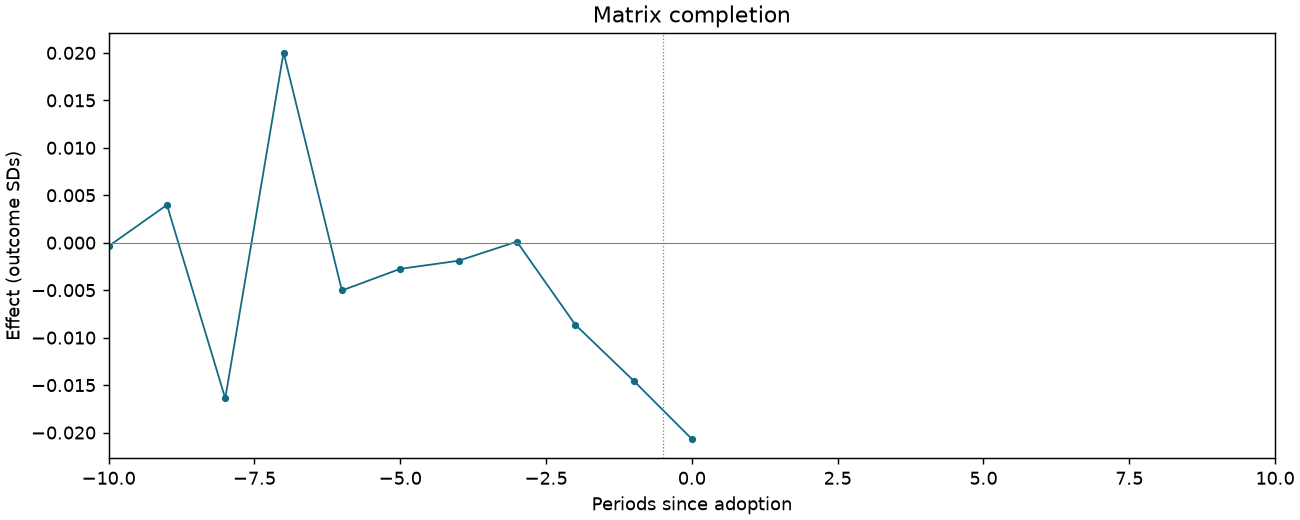
AM005-P2587-T2-RD-NOOV-M4M1
83,038 observations · 8,586 units · 1,911 clusters · 347 treated / 8,239 control units.
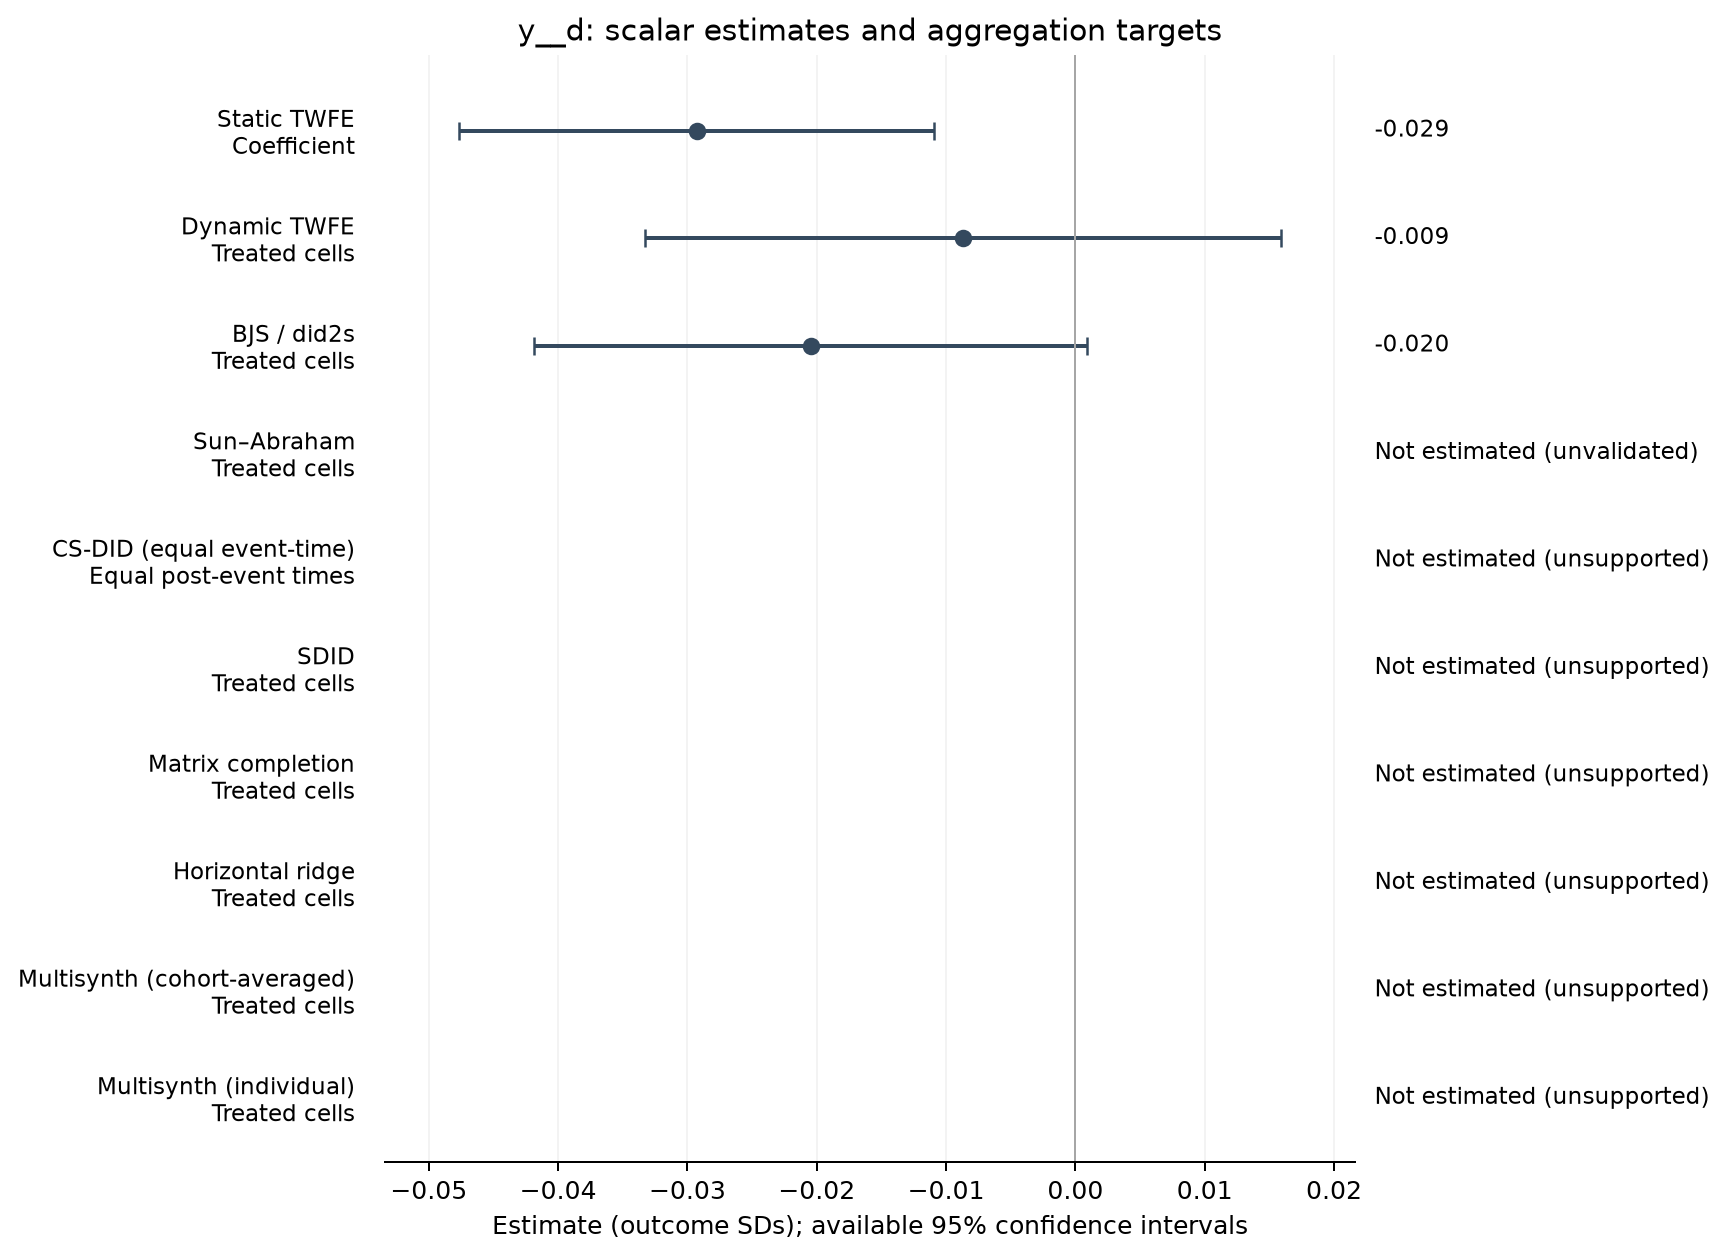
Estimate comparison
| Estimator | Estimate (SDs) | SE | 95% CI | Averaging |
|---|---|---|---|---|
| Static TWFE | -0.029 | 0.009 | [-0.048, -0.011] | Coefficient |
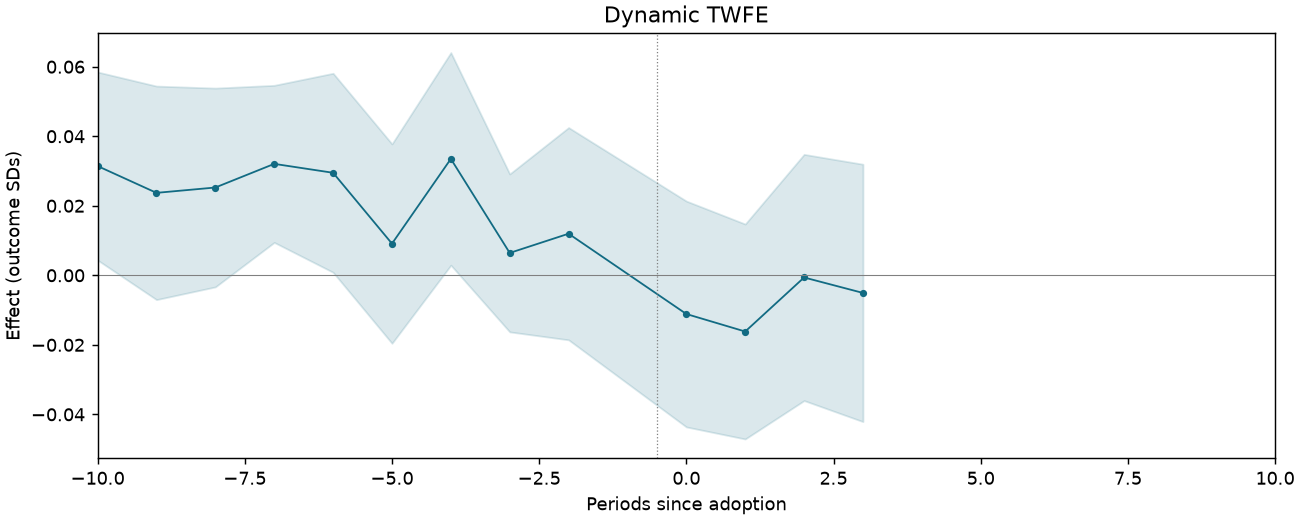
| Dynamic TWFE | -0.009 | 0.013 | [-0.033, 0.016] | Treated cells |
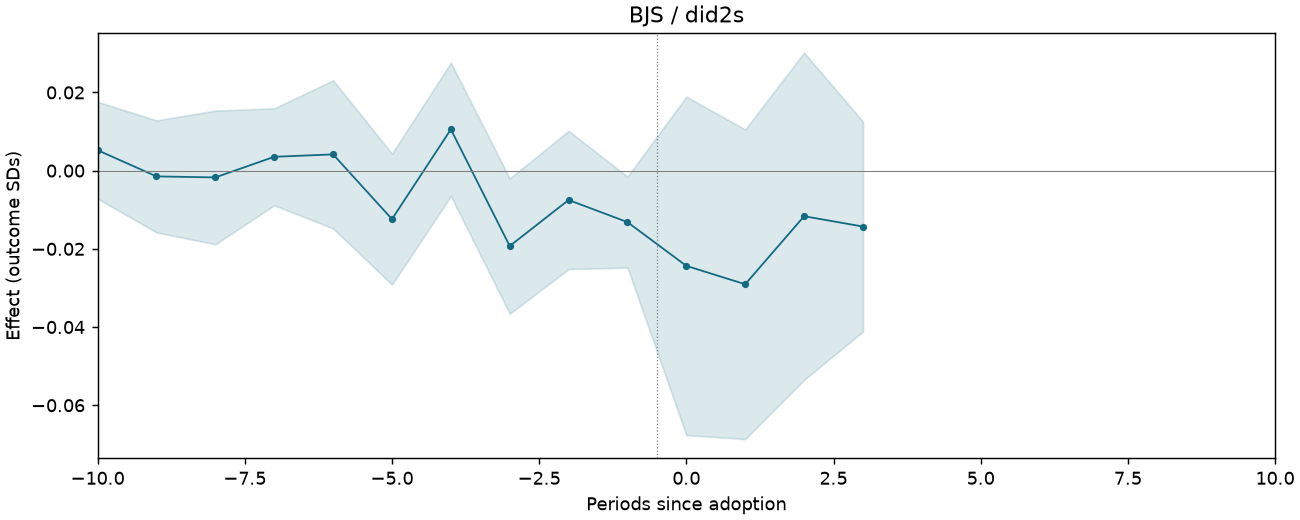
| BJS / did2s | -0.020 | 0.011 | [-0.042, 0.001] | Treated cells |
Event studies
Periods −10 to +10; pointwise 95% intervals where available.
AM005-P2587-T2-RD-QP-M1
83,517 observations · 8,531 units · 1,916 clusters · 322 treated / 8,209 control units.
Estimate comparison
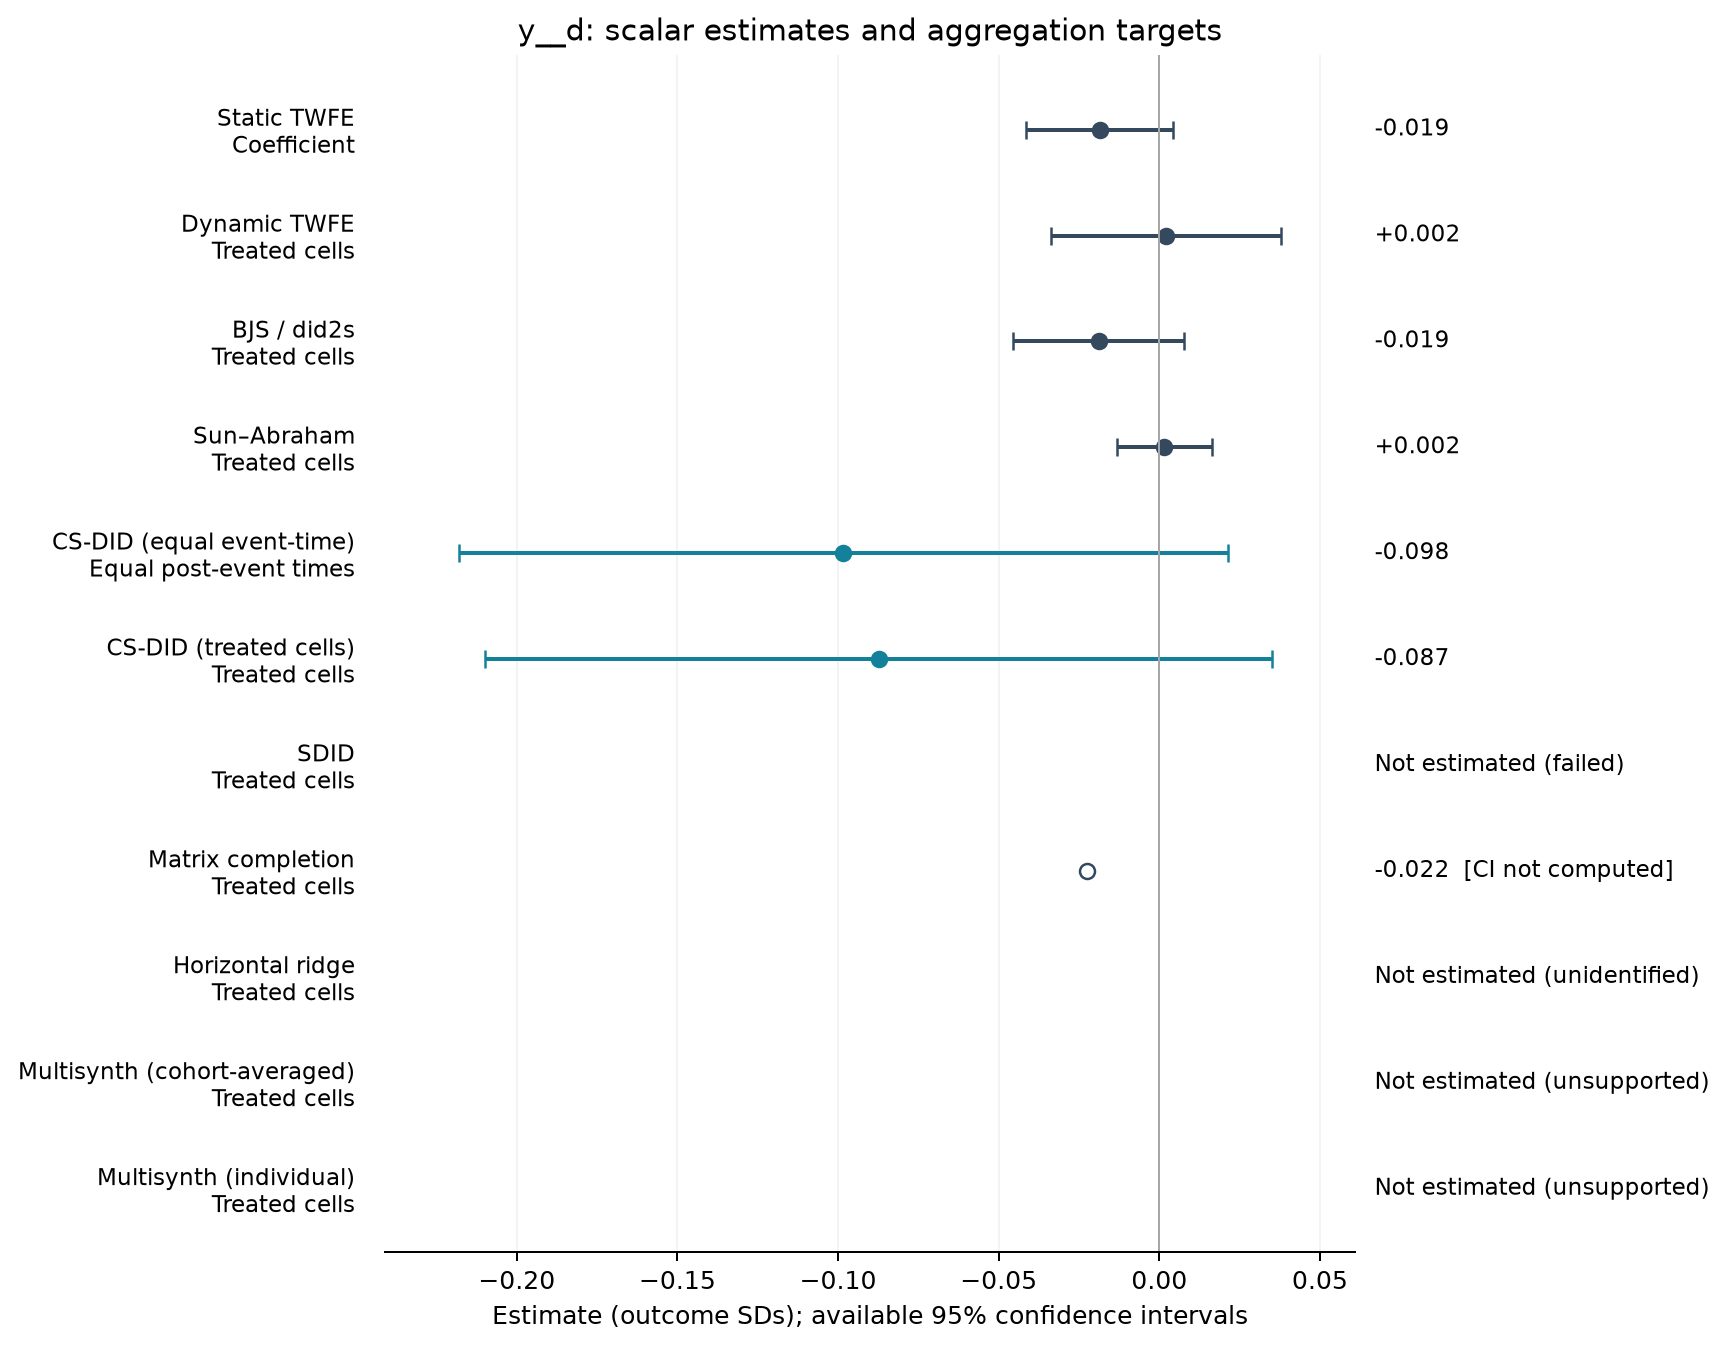
| Estimator | Estimate (SDs) | SE | 95% CI | Averaging |
|---|---|---|---|---|
| Static TWFE | -0.019 | 0.012 | [-0.041, 0.004] | Coefficient |
| Dynamic TWFE | 0.002 | 0.018 | [-0.034, 0.038] | Treated cells |
| BJS / did2s | -0.019 | 0.014 | [-0.046, 0.008] | Treated cells |
| Sun–Abraham | 0.002 | 0.008 | [-0.013, 0.016] | Treated cells |
| CS-DID (equal event-time) | -0.098 | 0.061 | [-0.218, 0.021] | Equal post-event times |
| CS-DID (treated cells) | -0.087 | 0.062 | [-0.210, 0.035] | Treated cells |
| Matrix completion | -0.022 | — | — | Treated cells |
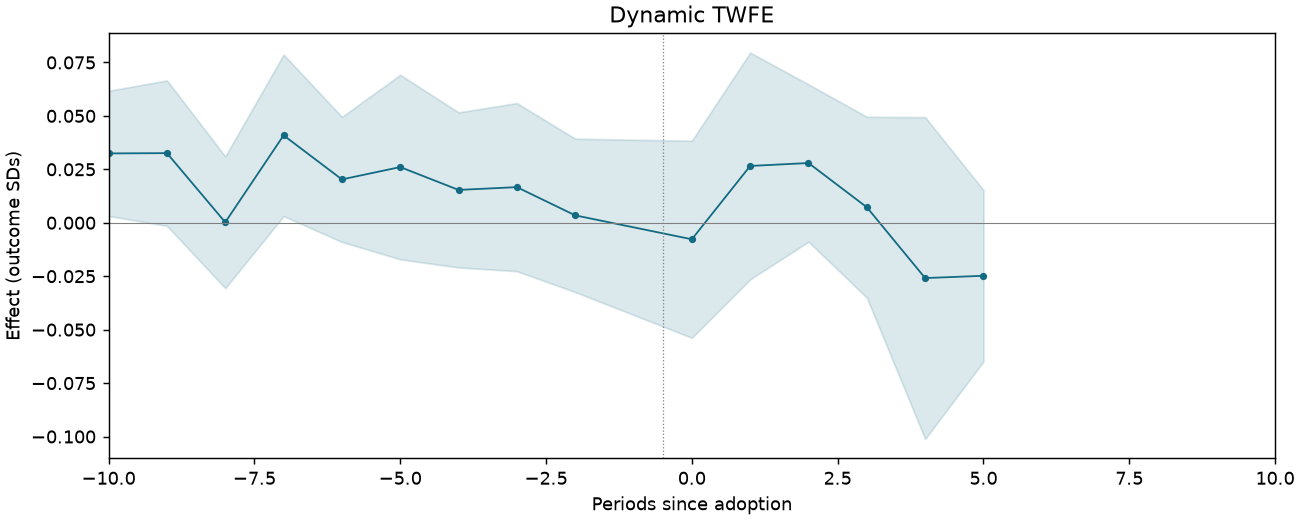
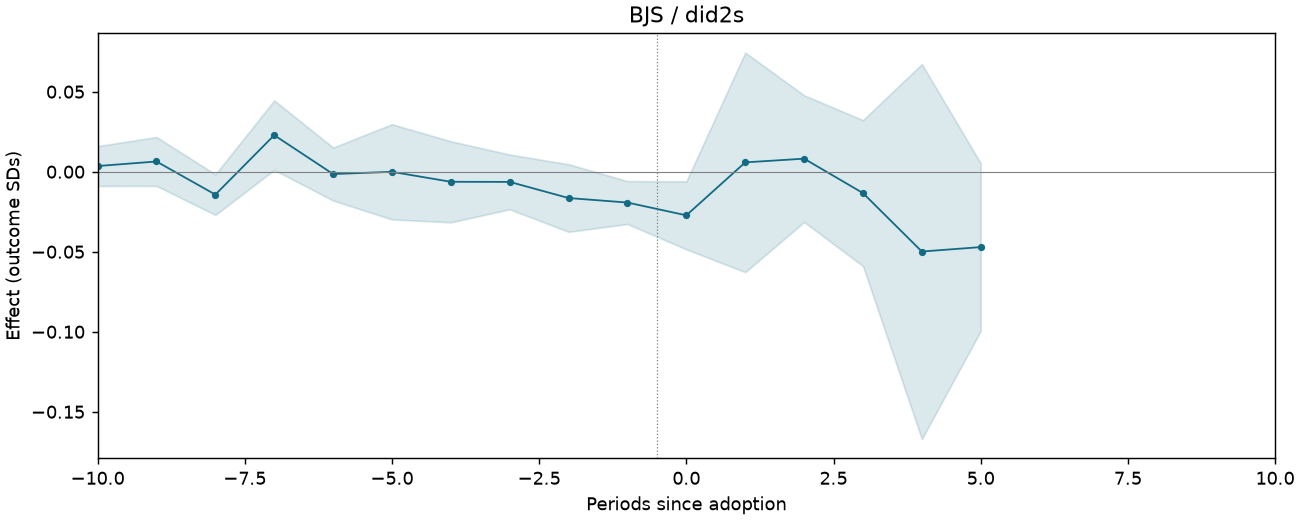
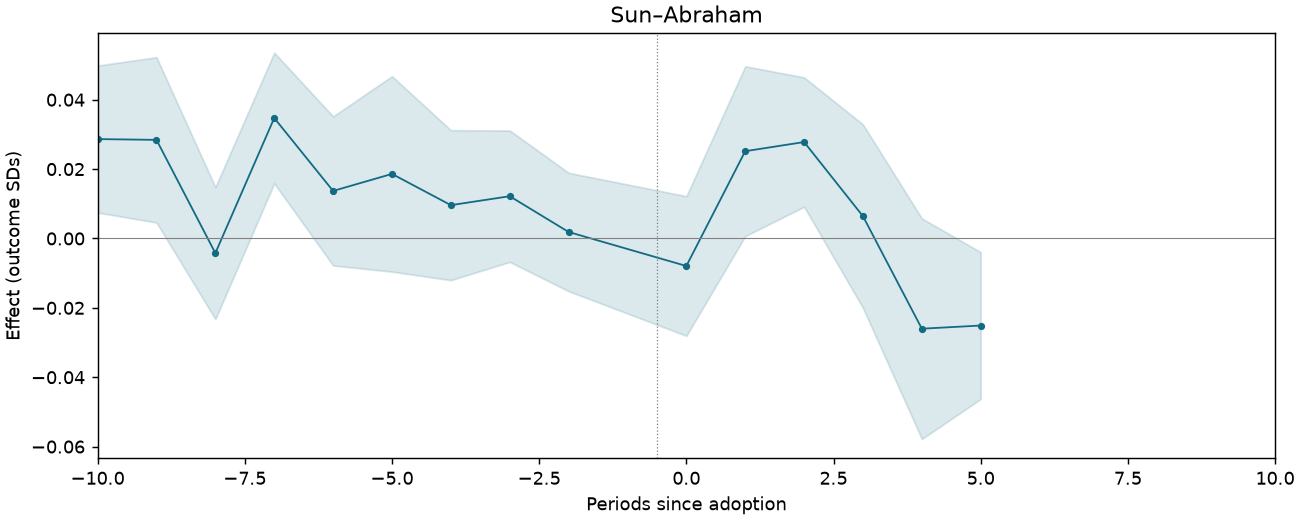
Event studies
Periods −10 to +10; pointwise 95% intervals where available.
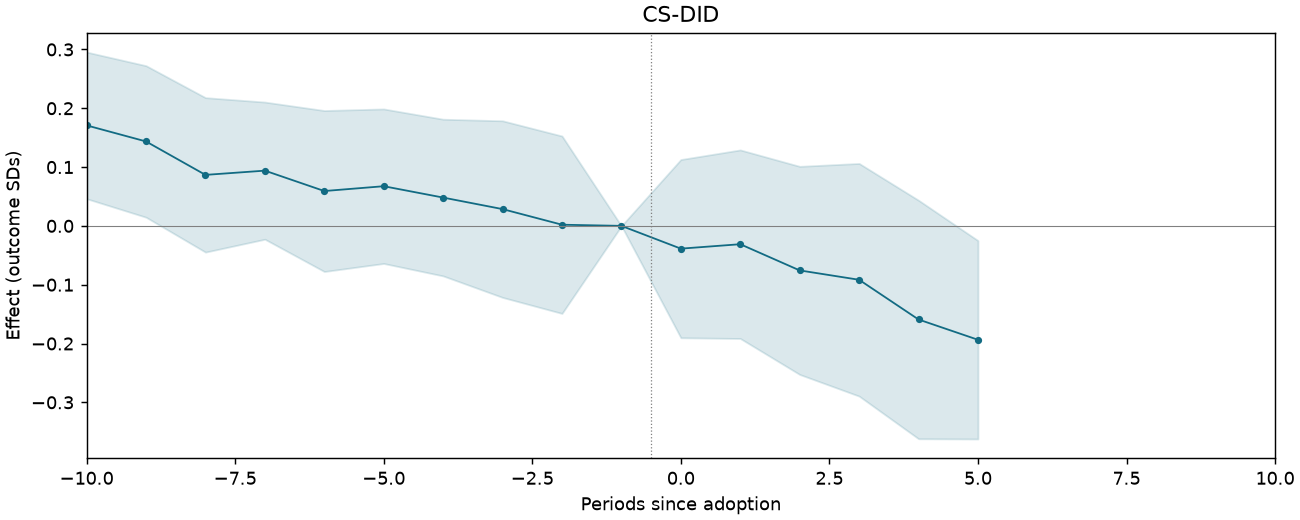
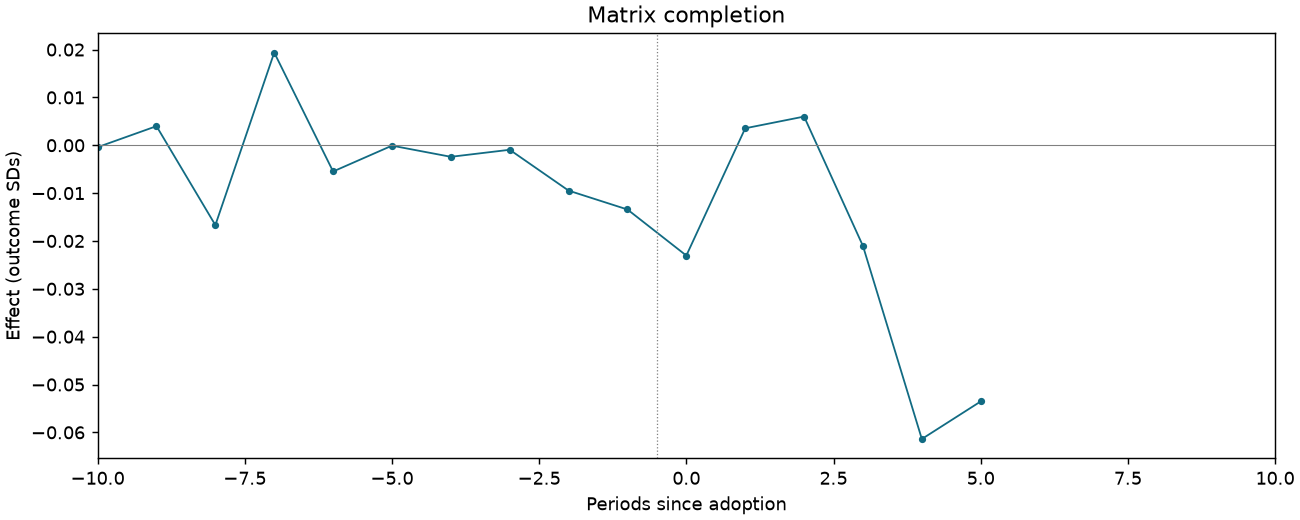
AM005-P2587-T2-RD-QP-M4
82,596 observations · 8,499 units · 1,914 clusters · 347 treated / 8,152 control units.
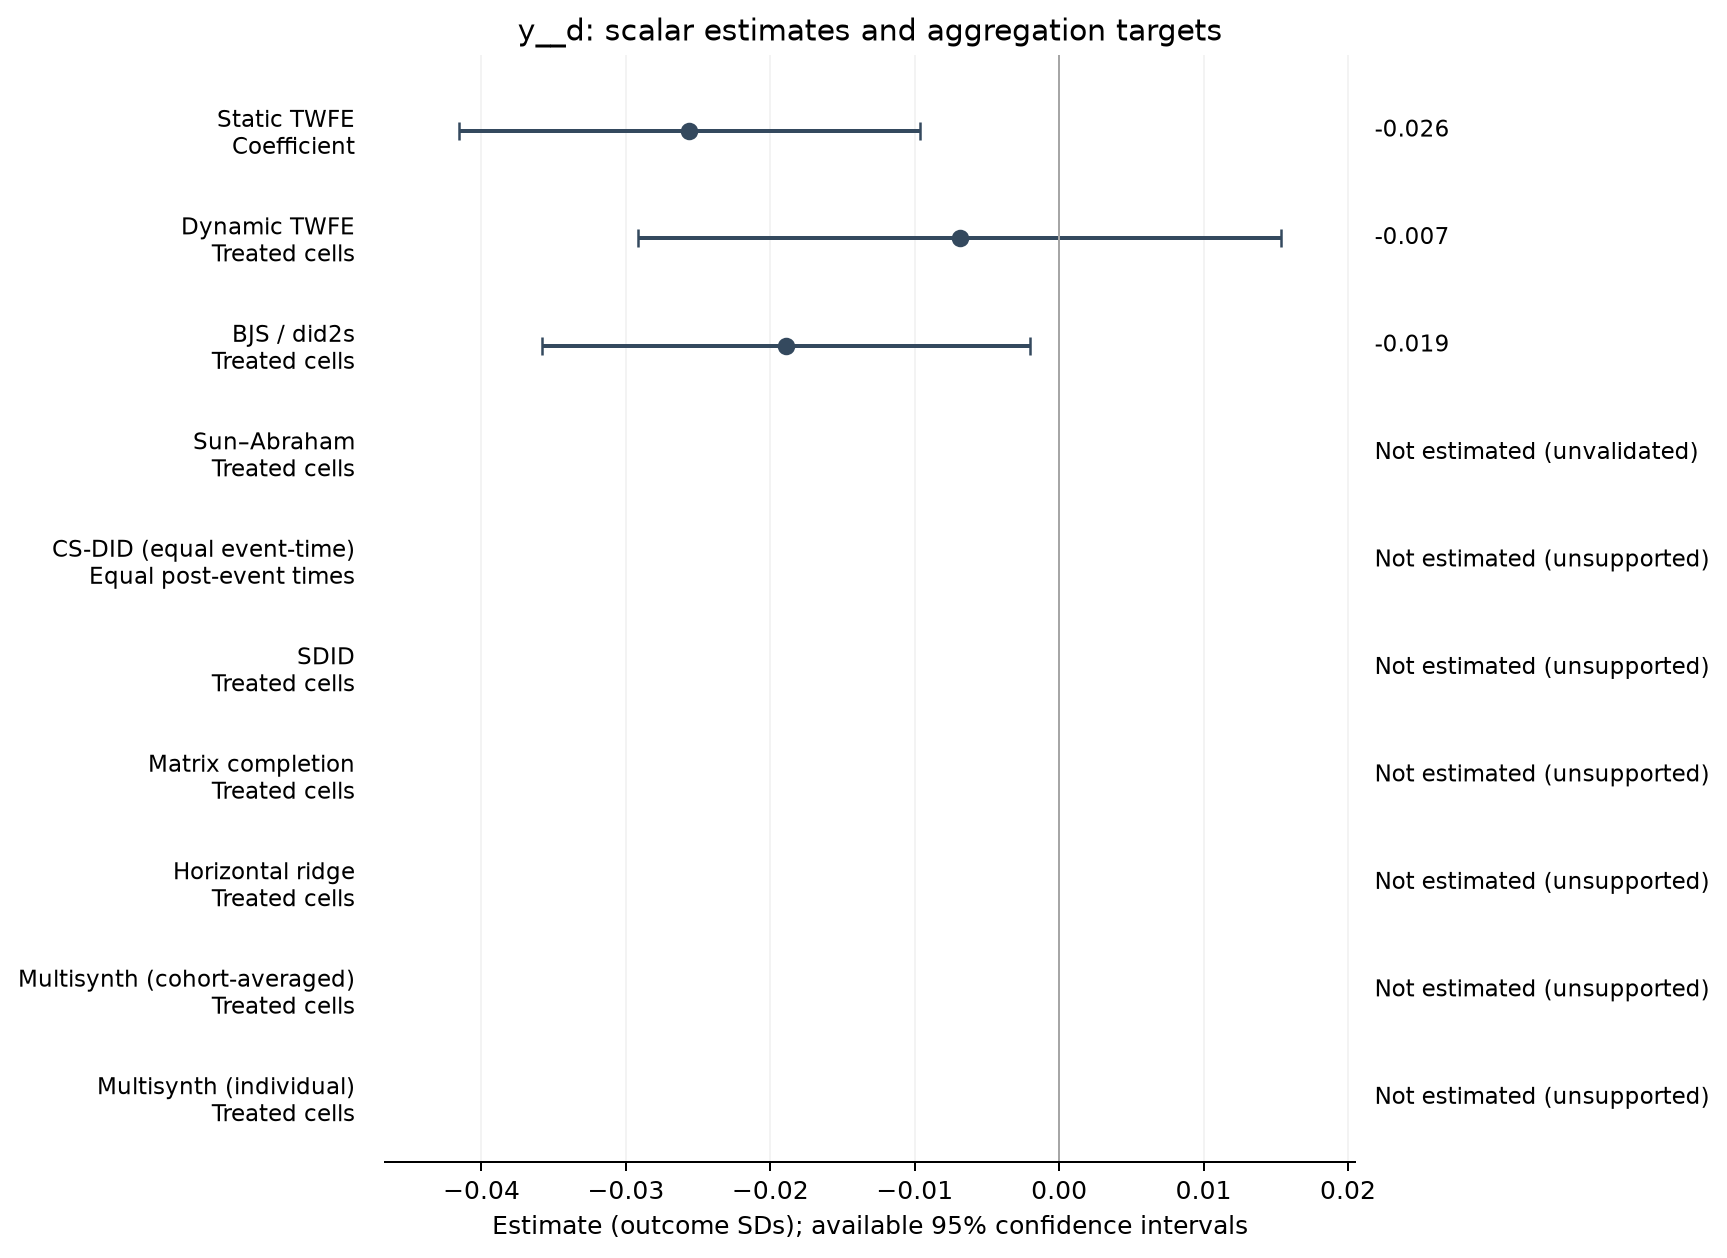
Estimate comparison
| Estimator | Estimate (SDs) | SE | 95% CI | Averaging |
|---|---|---|---|---|
| Static TWFE | -0.026 | 0.008 | [-0.042, -0.010] | Coefficient |
| Dynamic TWFE | -0.007 | 0.011 | [-0.029, 0.015] | Treated cells |
| BJS / did2s | -0.019 | 0.009 | [-0.036, -0.002] | Treated cells |
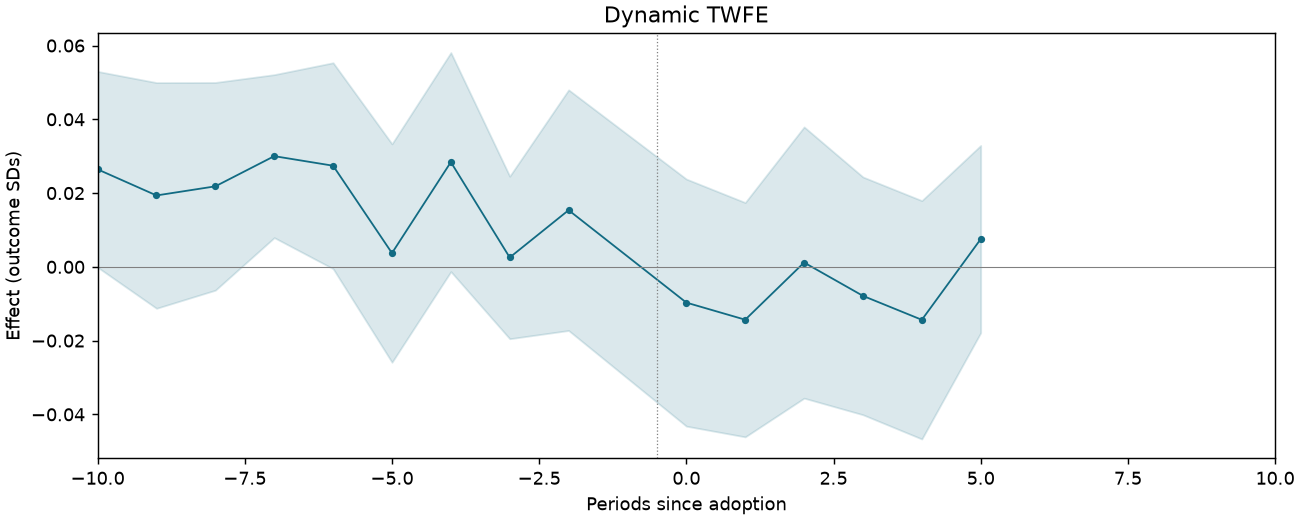
Event studies
Periods −10 to +10; pointwise 95% intervals where available.
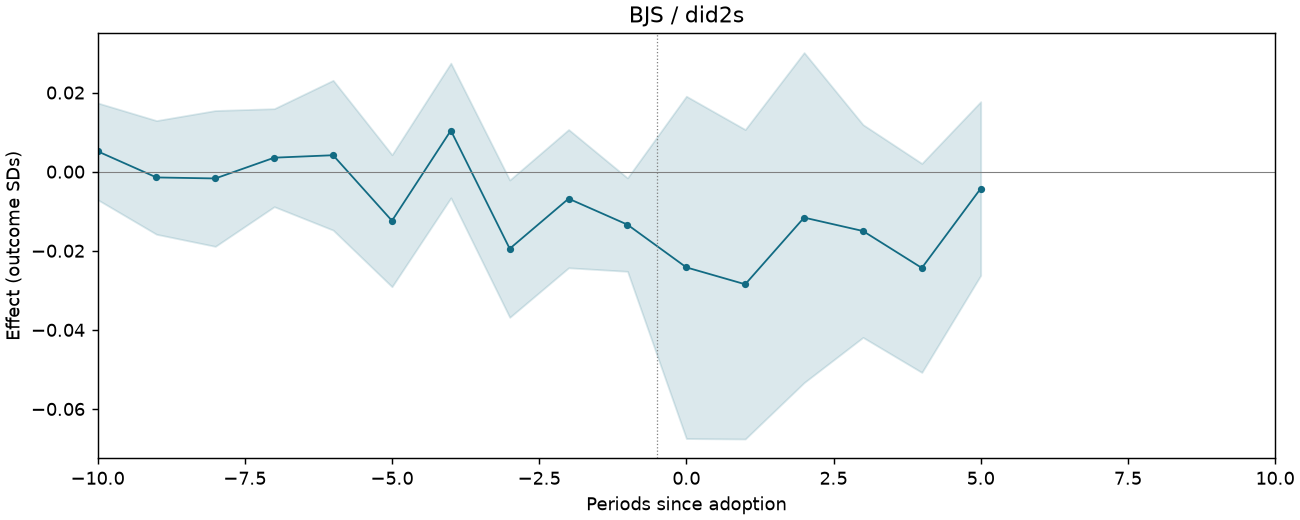
AM005-P2587-T3-R3-NOTEXAS
148,721 observations · 13,551 units · 49 clusters · 475 treated / 13,076 control units.
Estimate comparison
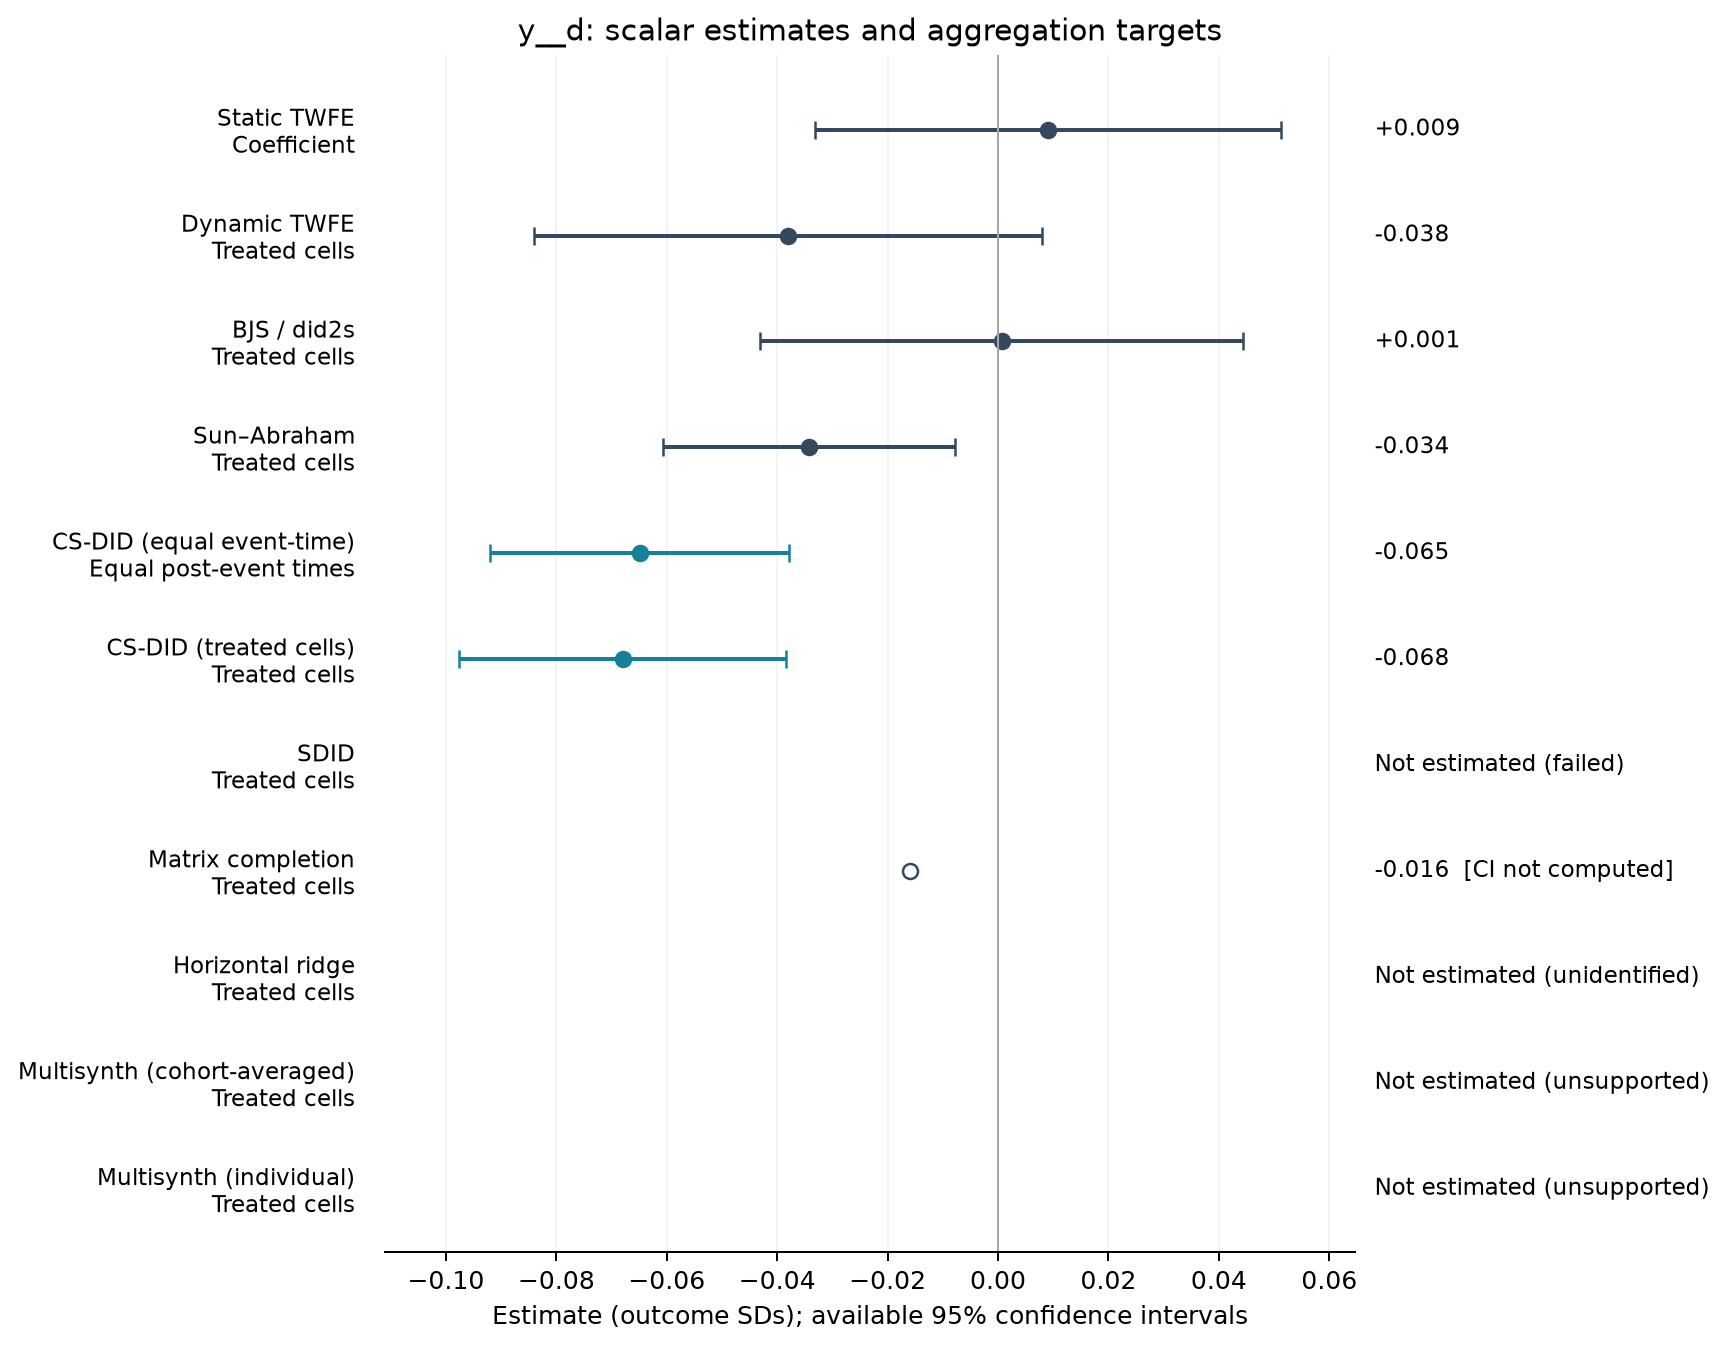
| Estimator | Estimate (SDs) | SE | 95% CI | Averaging |
|---|---|---|---|---|
| Static TWFE | 0.009 | 0.021 | [-0.033, 0.051] | Coefficient |
| Dynamic TWFE | -0.038 | 0.023 | [-0.084, 0.008] | Treated cells |
| BJS / did2s | 0.001 | 0.022 | [-0.043, 0.044] | Treated cells |
| Sun–Abraham | -0.034 | 0.013 | [-0.061, -0.008] | Treated cells |
| CS-DID (equal event-time) | -0.065 | 0.014 | [-0.092, -0.038] | Equal post-event times |
| CS-DID (treated cells) | -0.068 | 0.015 | [-0.098, -0.038] | Treated cells |
| Matrix completion | -0.016 | — | — | Treated cells |
Event studies
Periods −10 to +10; pointwise 95% intervals where available.