Corruption as a Local Advantage — expanded estimators
Archive index · Regression tests · Results & settings (JSON) · Methods & code
90 specifications. Effects are in outcome standard deviations; intervals are 95%.
Treatment adoption

S22-P026: seeded sample of 100 of 216 eligible units. Purple untreated; yellow treated; white unobserved.
REXER-F4-THEFT-CTRLFIELD-SHNONE-FELGA-TRDI-SFULL
Required field-characteristic controls numwells, first_year, onsh and analog_depth are absent from the supplied bundle.
REXER-F4-THEFT-CTRLFIELD-SHNONE-FELGA-TRDI-SONSHORE
Required field-characteristic controls numwells, first_year, onsh and analog_depth are absent from the supplied bundle.
REXER-F4-THEFT-CTRLFIELD-SHNONE-FELGA-TRDINNPC-SFULL
Required field-characteristic controls numwells, first_year, onsh and analog_depth are absent from the supplied bundle.
REXER-F4-THEFT-CTRLFIELD-SHNONE-FELGA-TRDINNPC-SONSHORE
Required field-characteristic controls numwells, first_year, onsh and analog_depth are absent from the supplied bundle.
REXER-F4-THEFT-CTRLFIELD-SHNONE-FELGA-TRNNPC-SFULL
Required field-characteristic controls numwells, first_year, onsh and analog_depth are absent from the supplied bundle.
REXER-F4-THEFT-CTRLFIELD-SHNONE-FELGA-TRNNPC-SONSHORE
Required field-characteristic controls numwells, first_year, onsh and analog_depth are absent from the supplied bundle.
REXER-F4-THEFT-CTRLFIELD-SHNONE-FENONE-TRDI-SFULL
Required field-characteristic controls numwells, first_year, onsh and analog_depth are absent from the supplied bundle.
REXER-F4-THEFT-CTRLFIELD-SHNONE-FENONE-TRDI-SONSHORE
Required field-characteristic controls numwells, first_year, onsh and analog_depth are absent from the supplied bundle.
REXER-F4-THEFT-CTRLFIELD-SHNONE-FENONE-TRDINNPC-SFULL
Required field-characteristic controls numwells, first_year, onsh and analog_depth are absent from the supplied bundle.
REXER-F4-THEFT-CTRLFIELD-SHNONE-FENONE-TRDINNPC-SONSHORE
Required field-characteristic controls numwells, first_year, onsh and analog_depth are absent from the supplied bundle.
REXER-F4-THEFT-CTRLFIELD-SHNONE-FENONE-TRNNPC-SFULL
Required field-characteristic controls numwells, first_year, onsh and analog_depth are absent from the supplied bundle.
REXER-F4-THEFT-CTRLFIELD-SHNONE-FENONE-TRNNPC-SONSHORE
Required field-characteristic controls numwells, first_year, onsh and analog_depth are absent from the supplied bundle.
REXER-F4-THEFT-CTRLFIELD-SHNONE-FESTATE-TRDI-SFULL
Required field-characteristic controls numwells, first_year, onsh and analog_depth are absent from the supplied bundle.
REXER-F4-THEFT-CTRLFIELD-SHNONE-FESTATE-TRDI-SONSHORE
Required field-characteristic controls numwells, first_year, onsh and analog_depth are absent from the supplied bundle.
REXER-F4-THEFT-CTRLFIELD-SHNONE-FESTATE-TRDINNPC-SFULL
Required field-characteristic controls numwells, first_year, onsh and analog_depth are absent from the supplied bundle.
REXER-F4-THEFT-CTRLFIELD-SHNONE-FESTATE-TRDINNPC-SONSHORE
Required field-characteristic controls numwells, first_year, onsh and analog_depth are absent from the supplied bundle.
REXER-F4-THEFT-CTRLFIELD-SHNONE-FESTATE-TRNNPC-SFULL
Required field-characteristic controls numwells, first_year, onsh and analog_depth are absent from the supplied bundle.
REXER-F4-THEFT-CTRLFIELD-SHNONE-FESTATE-TRNNPC-SONSHORE
Required field-characteristic controls numwells, first_year, onsh and analog_depth are absent from the supplied bundle.
Oil theft: count of sabotage spills within 15 km of the field
2,893 observations · 279 units · 279 clusters · 41 treated / 238 control units.
Estimate comparison
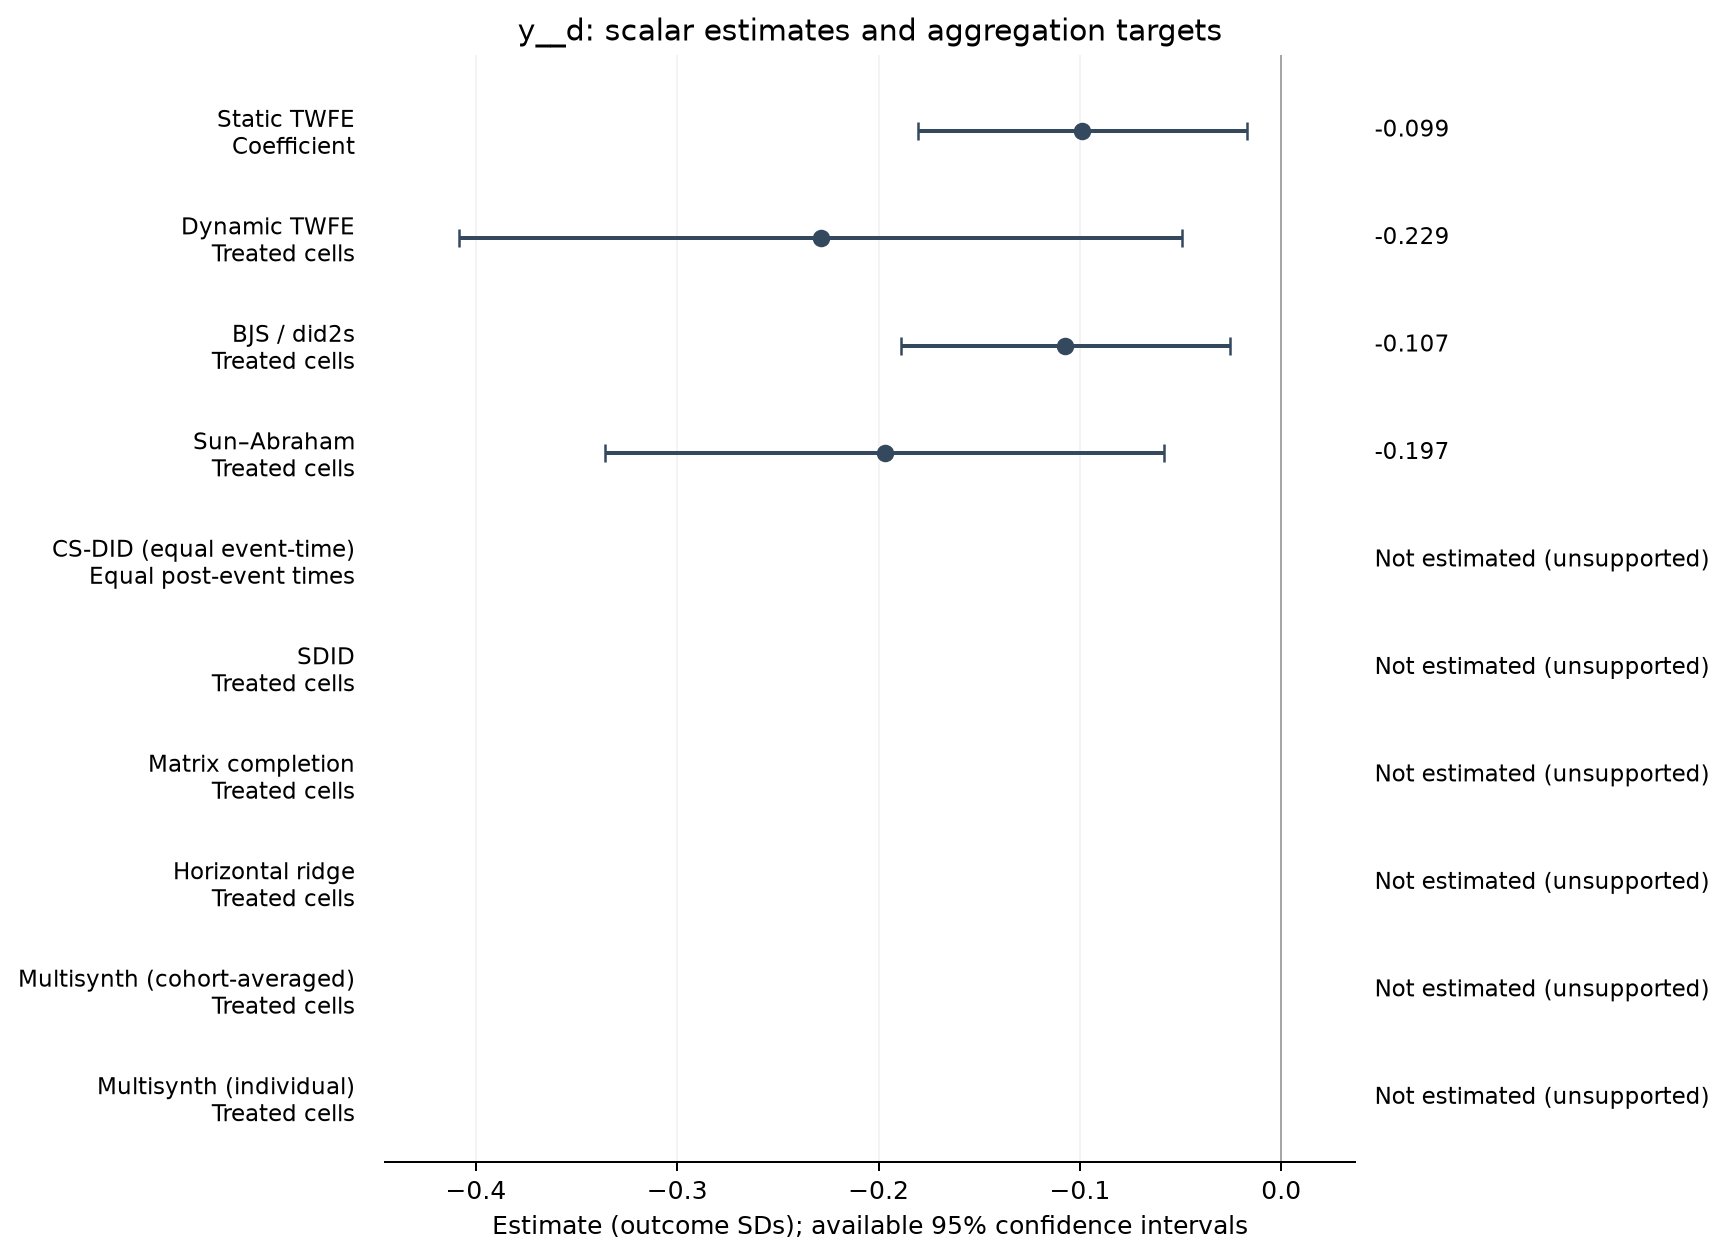
| Estimator | Estimate (SDs) | SE | 95% CI | Averaging |
|---|---|---|---|---|
| Static TWFE | -0.099 | 0.042 | [-0.181, -0.017] | Coefficient |
| Dynamic TWFE | -0.229 | 0.091 | [-0.408, -0.049] | Treated cells |
| BJS / did2s | -0.107 | 0.041 | [-0.189, -0.026] | Treated cells |
| Sun–Abraham | -0.197 | 0.071 | [-0.336, -0.058] | Treated cells |
Event studies
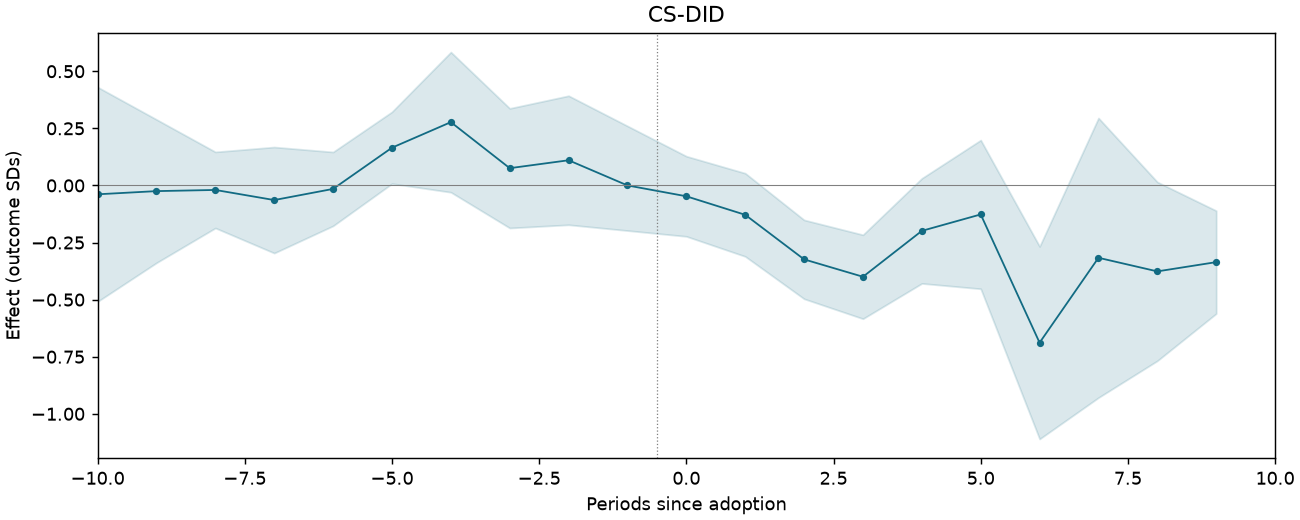
Periods −10 to +10; pointwise 95% intervals where available.
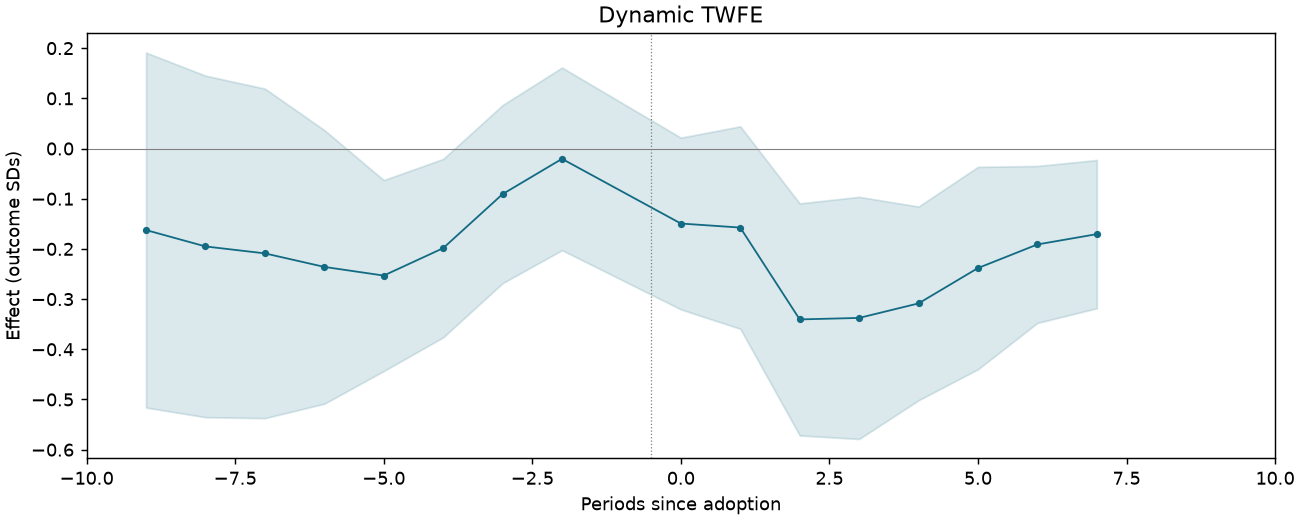
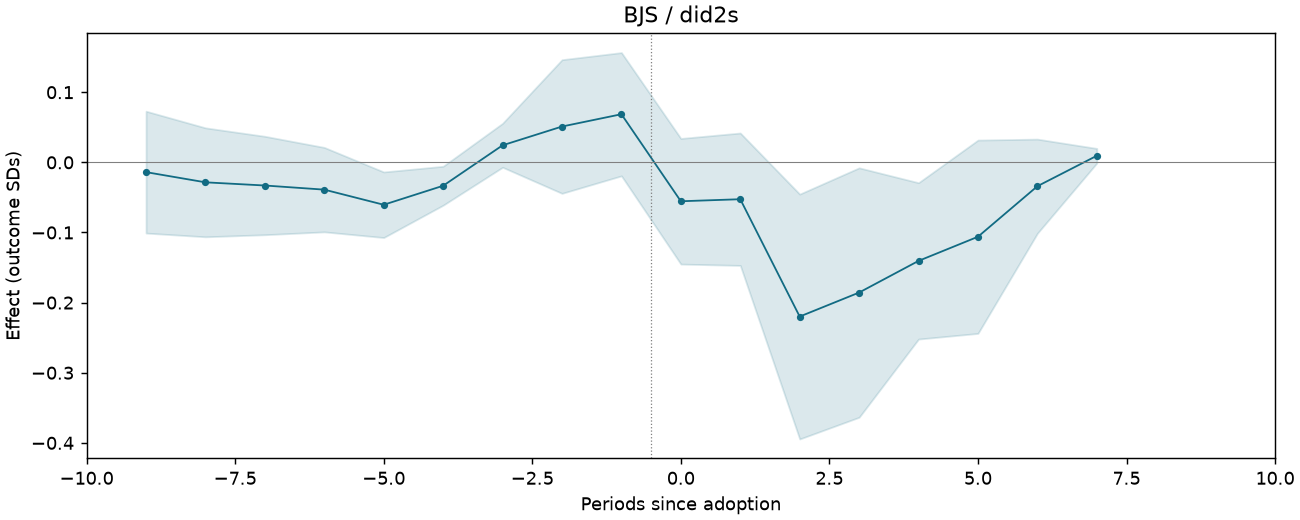
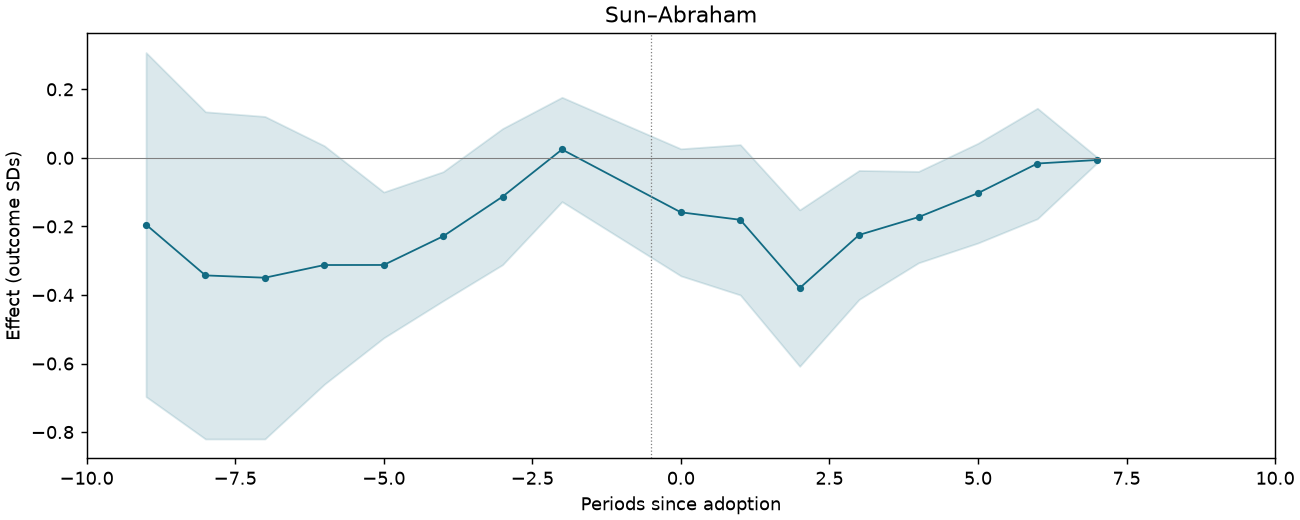
Oil theft: count of sabotage spills within 15 km of the field
1,913 observations · 180 units · 180 clusters · 29 treated / 151 control units.
Estimate comparison
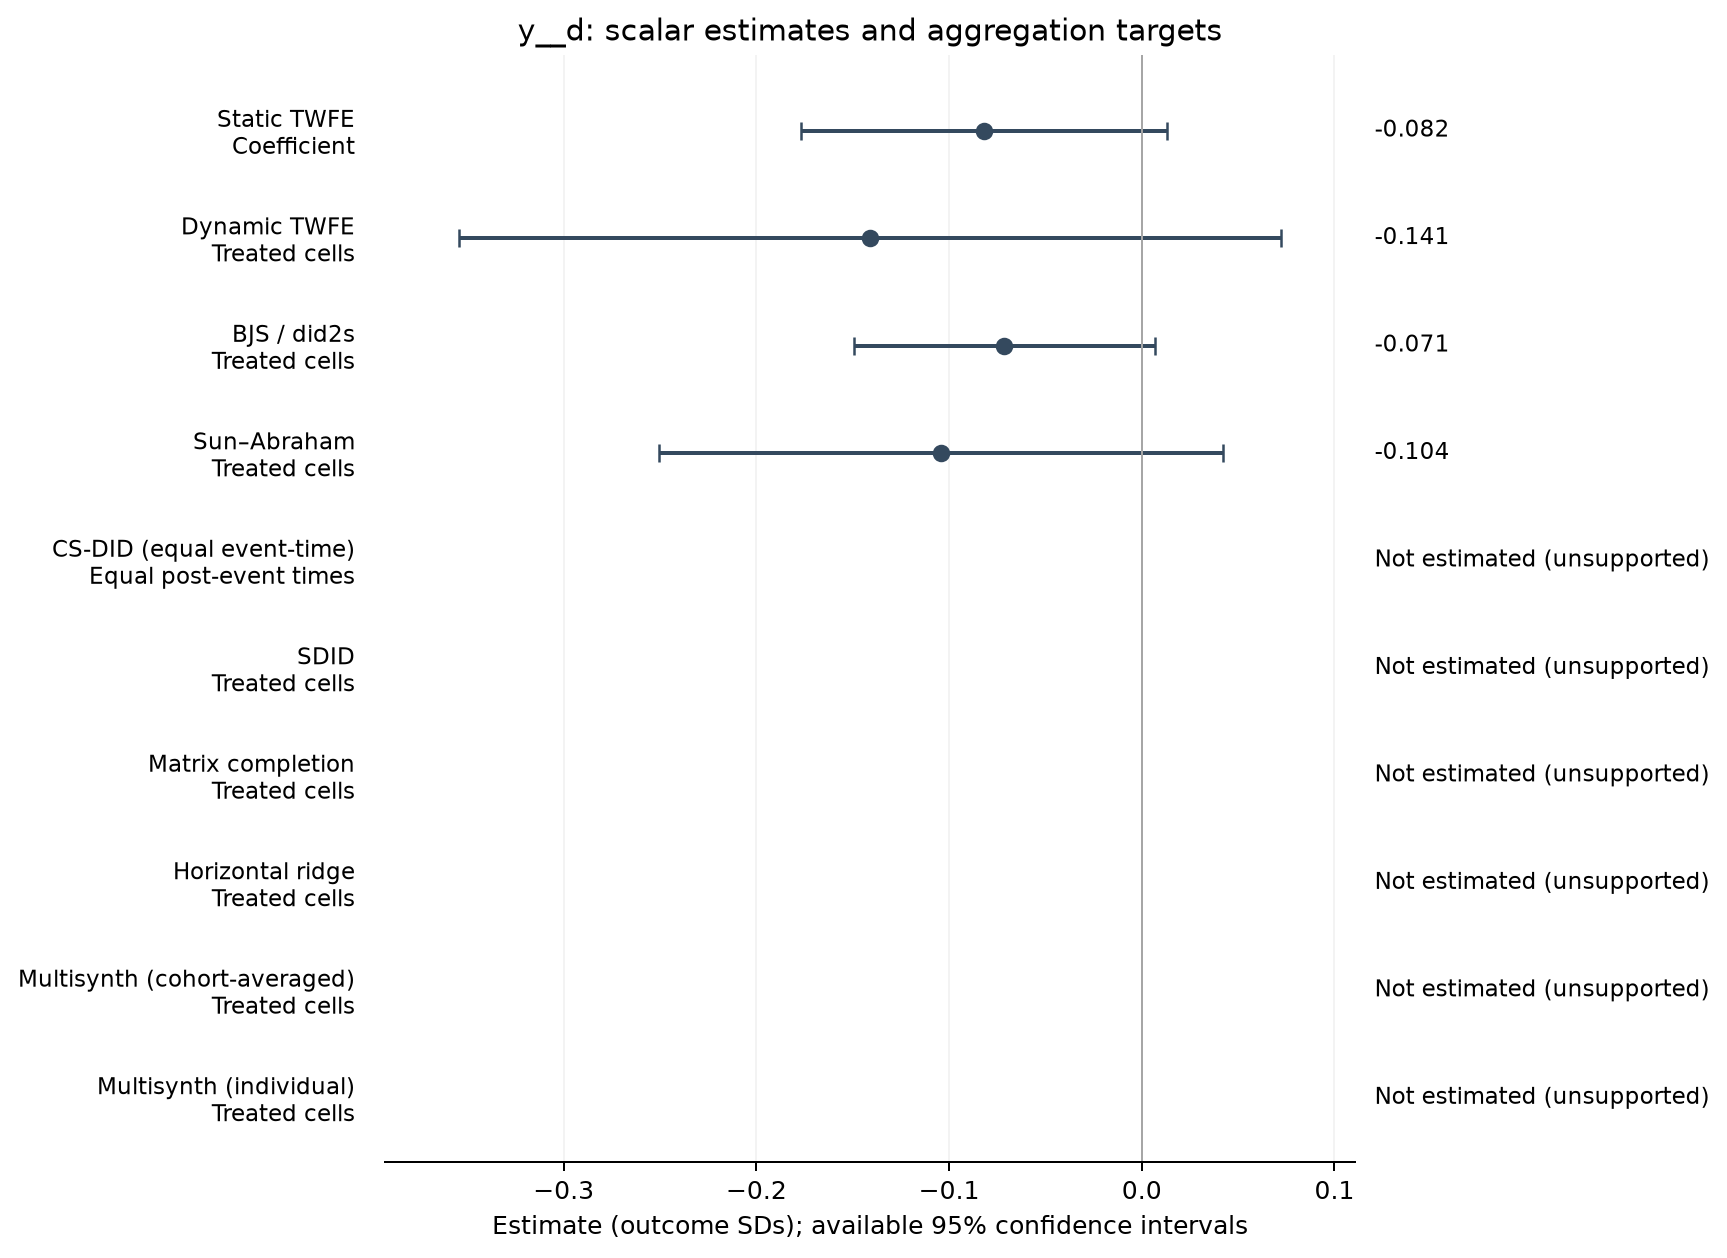
| Estimator | Estimate (SDs) | SE | 95% CI | Averaging |
|---|---|---|---|---|
| Static TWFE | -0.082 | 0.048 | [-0.177, 0.013] | Coefficient |
| Dynamic TWFE | -0.141 | 0.108 | [-0.354, 0.072] | Treated cells |
| BJS / did2s | -0.071 | 0.040 | [-0.150, 0.007] | Treated cells |
| Sun–Abraham | -0.104 | 0.074 | [-0.251, 0.042] | Treated cells |
Event studies
Periods −10 to +10; pointwise 95% intervals where available.
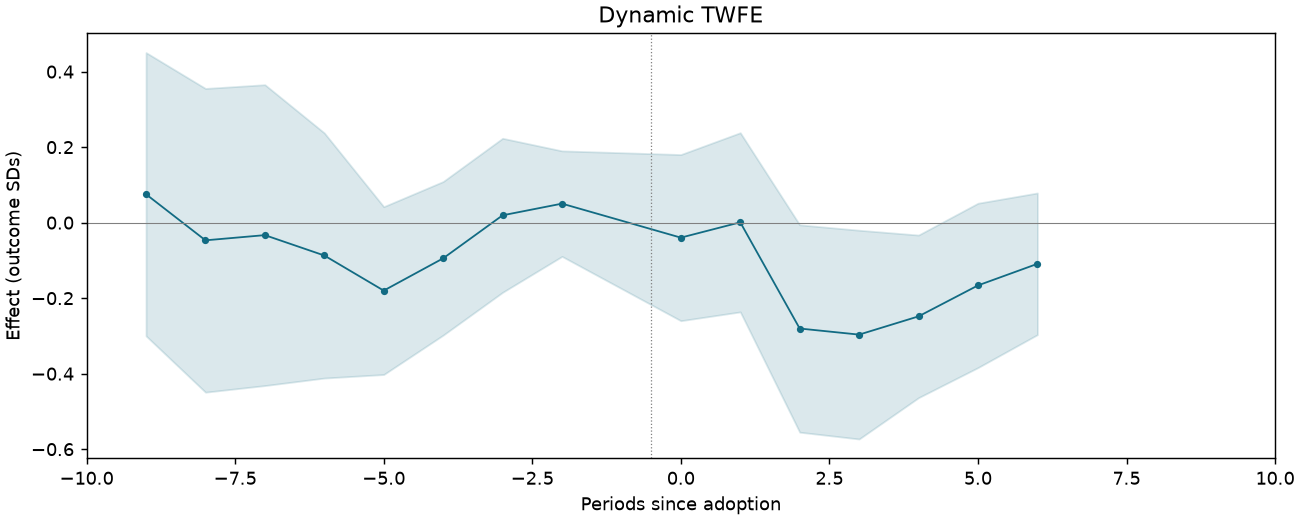
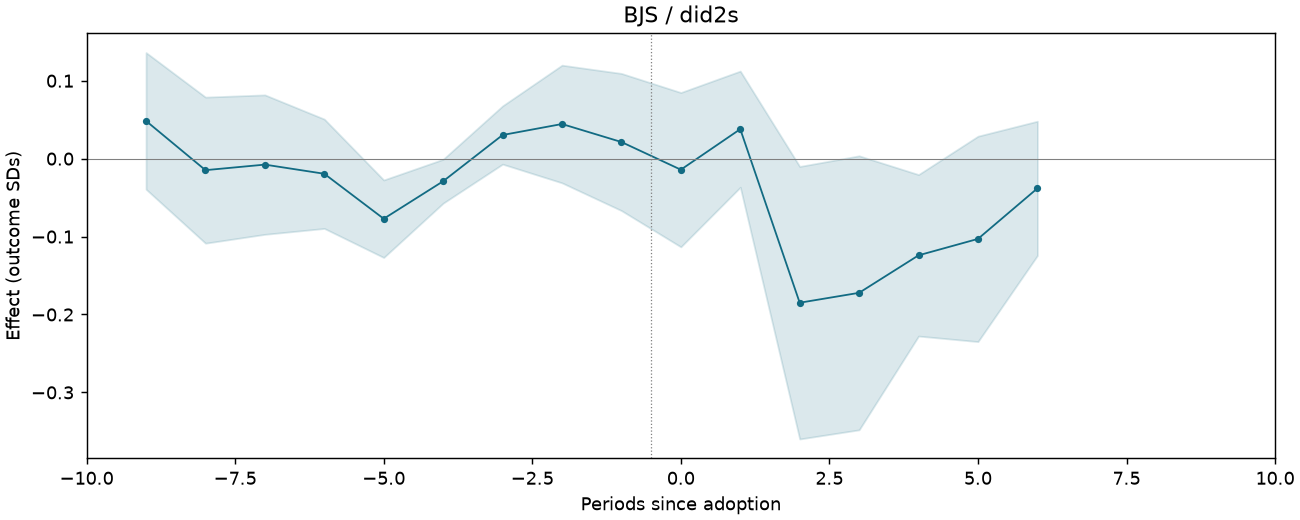
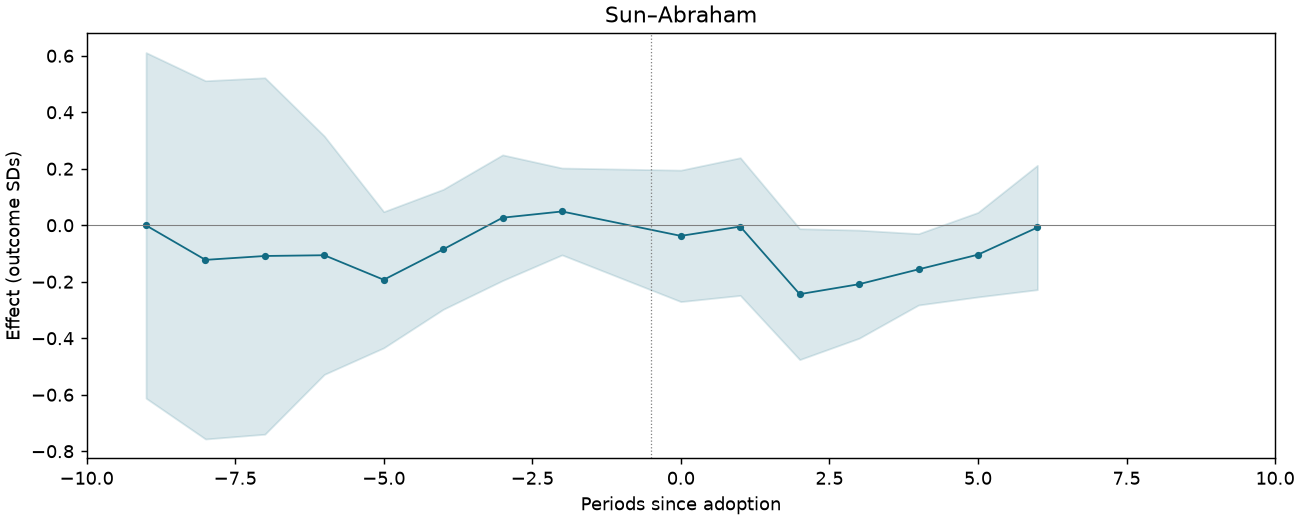
Oil theft: count of sabotage spills within 15 km of the field
The archive supplies frozen estimates but not this specification’s input sample or required outcome/controls.
Oil theft: count of sabotage spills within 15 km of the field
1,762 observations · 161 units · 161 clusters · 31 treated / 130 control units.
Estimate comparison
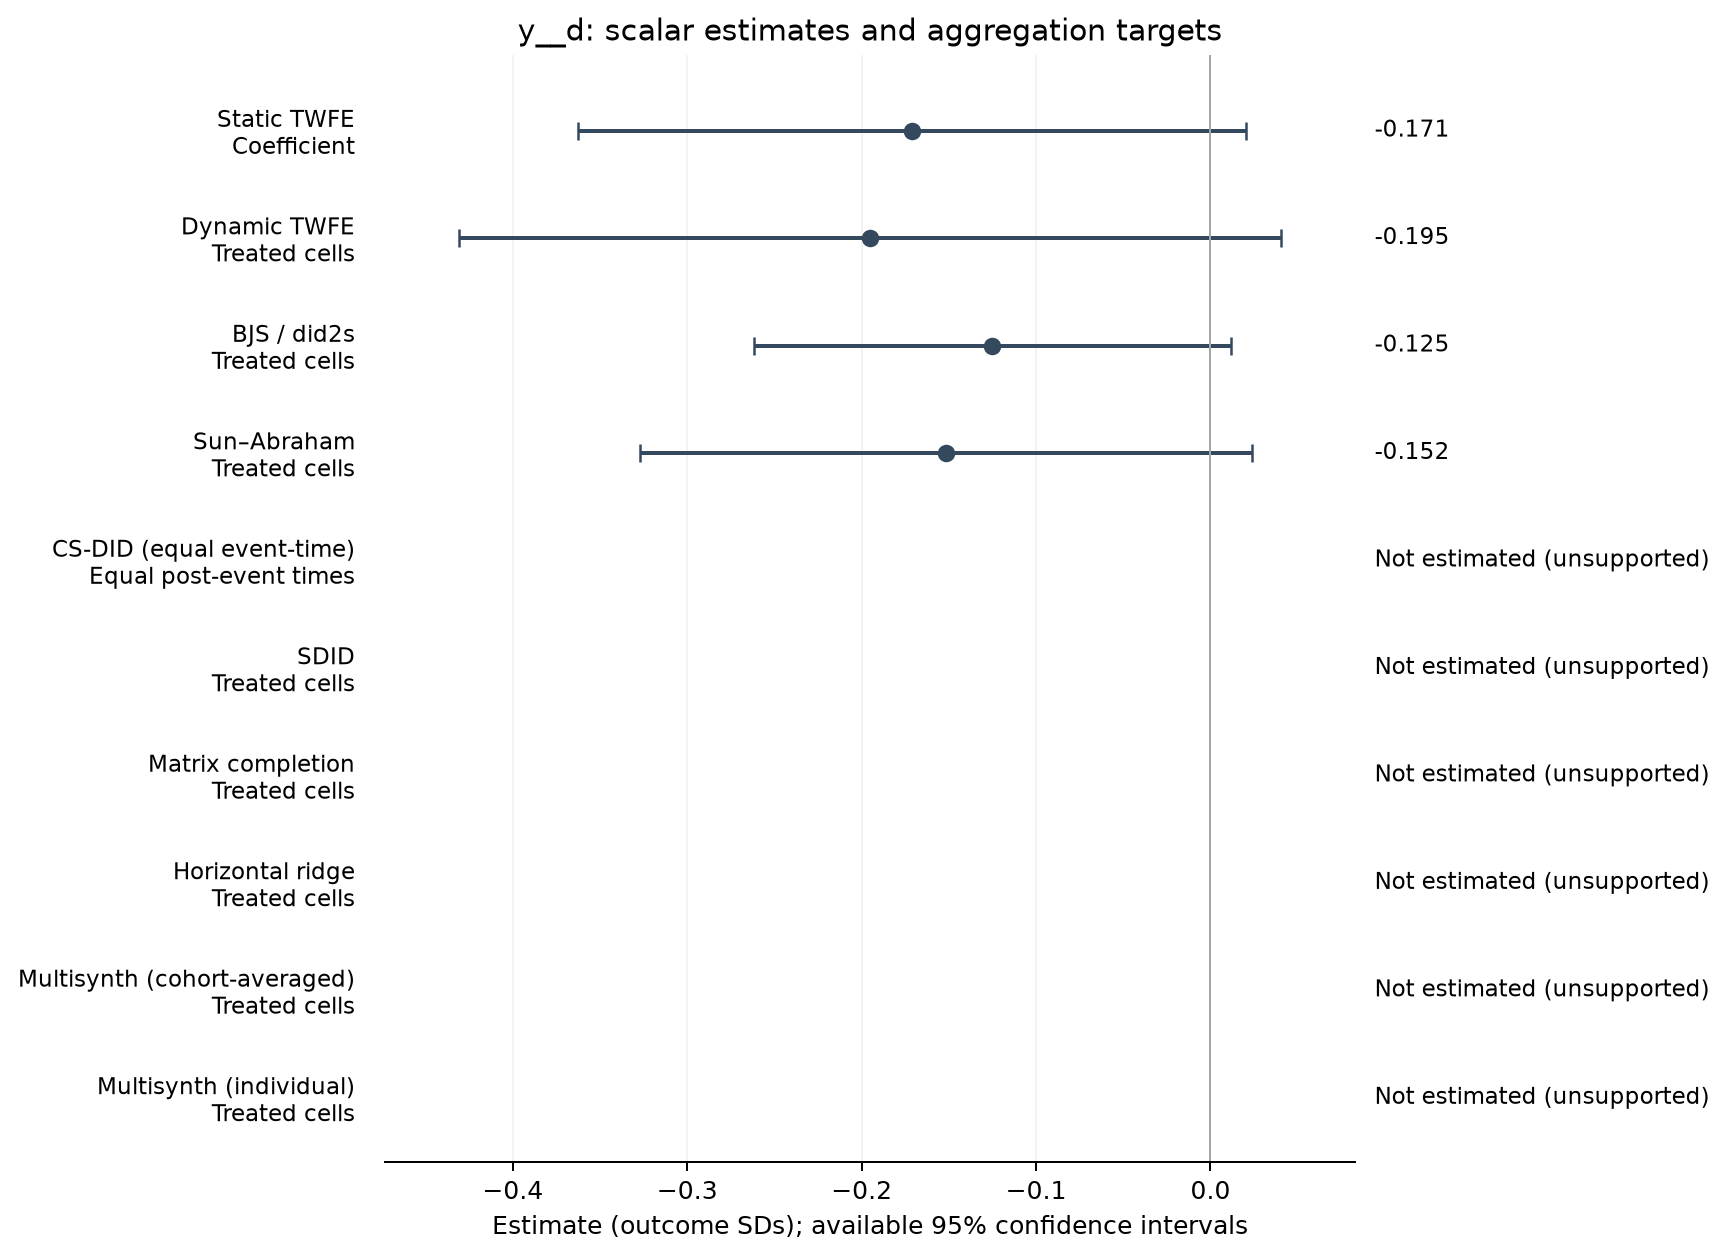
| Estimator | Estimate (SDs) | SE | 95% CI | Averaging |
|---|---|---|---|---|
| Static TWFE | -0.171 | 0.097 | [-0.363, 0.021] | Coefficient |
| Dynamic TWFE | -0.195 | 0.119 | [-0.431, 0.041] | Treated cells |
| BJS / did2s | -0.125 | 0.069 | [-0.262, 0.012] | Treated cells |
| Sun–Abraham | -0.152 | 0.089 | [-0.327, 0.024] | Treated cells |
Event studies
Periods −10 to +10; pointwise 95% intervals where available.
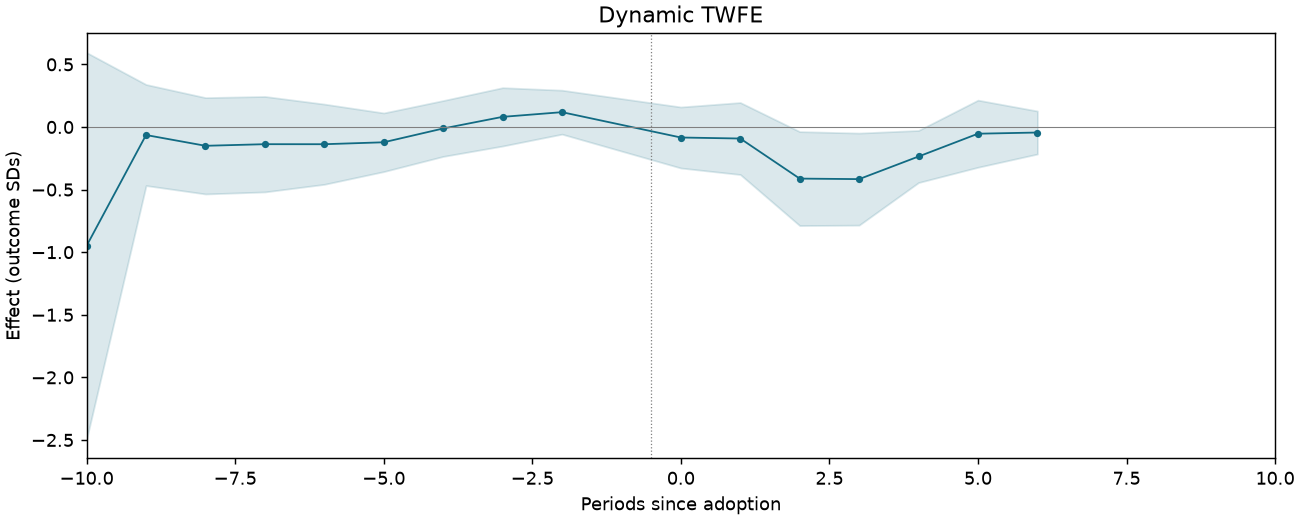
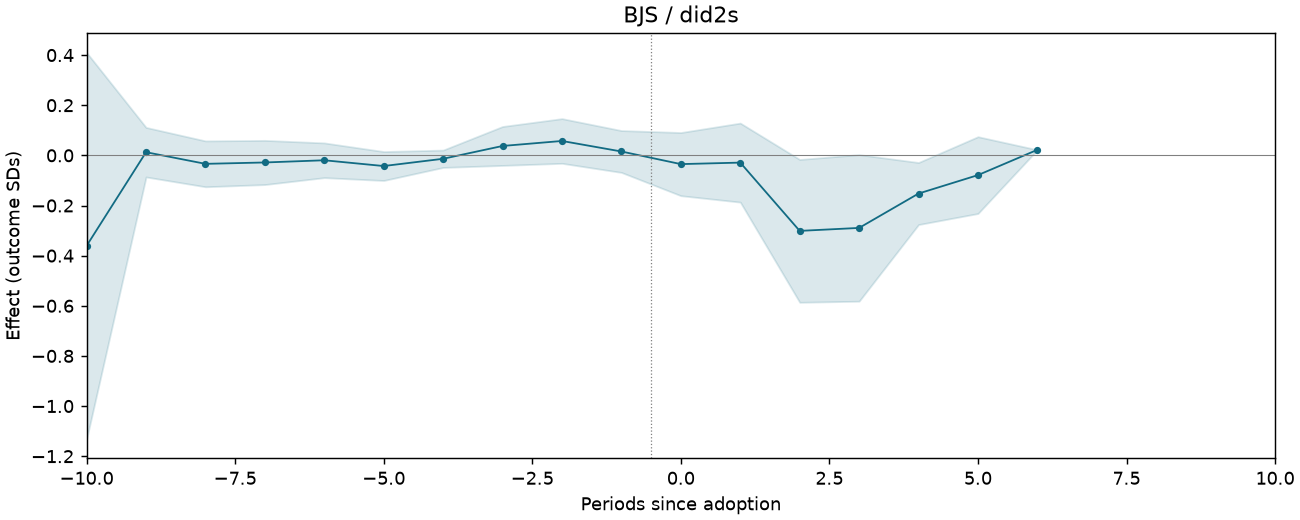
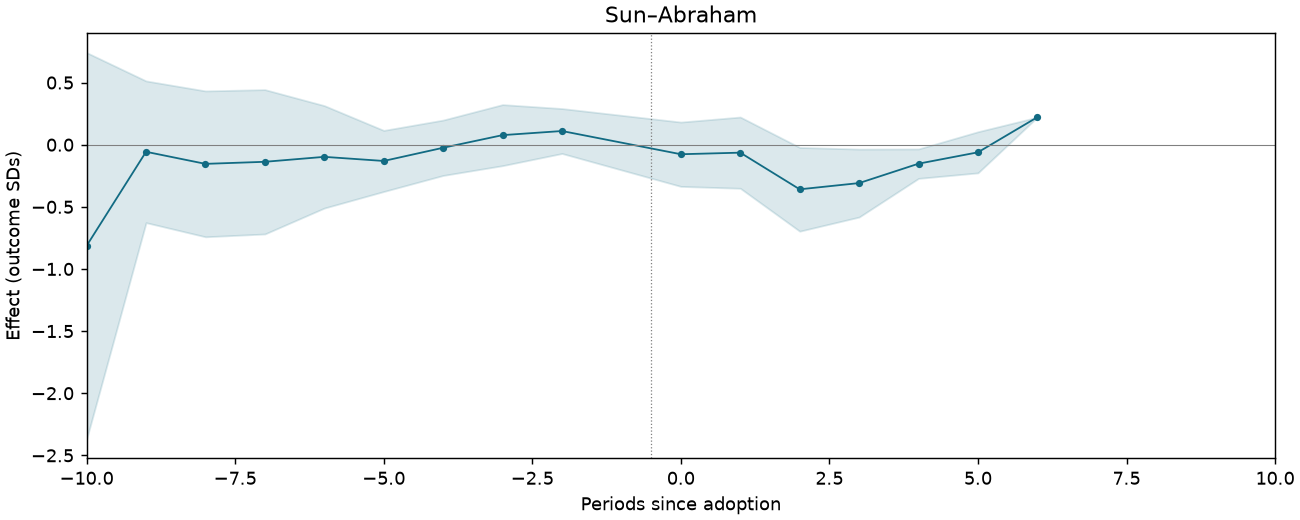
Oil theft: count of sabotage spills within 15 km of the field
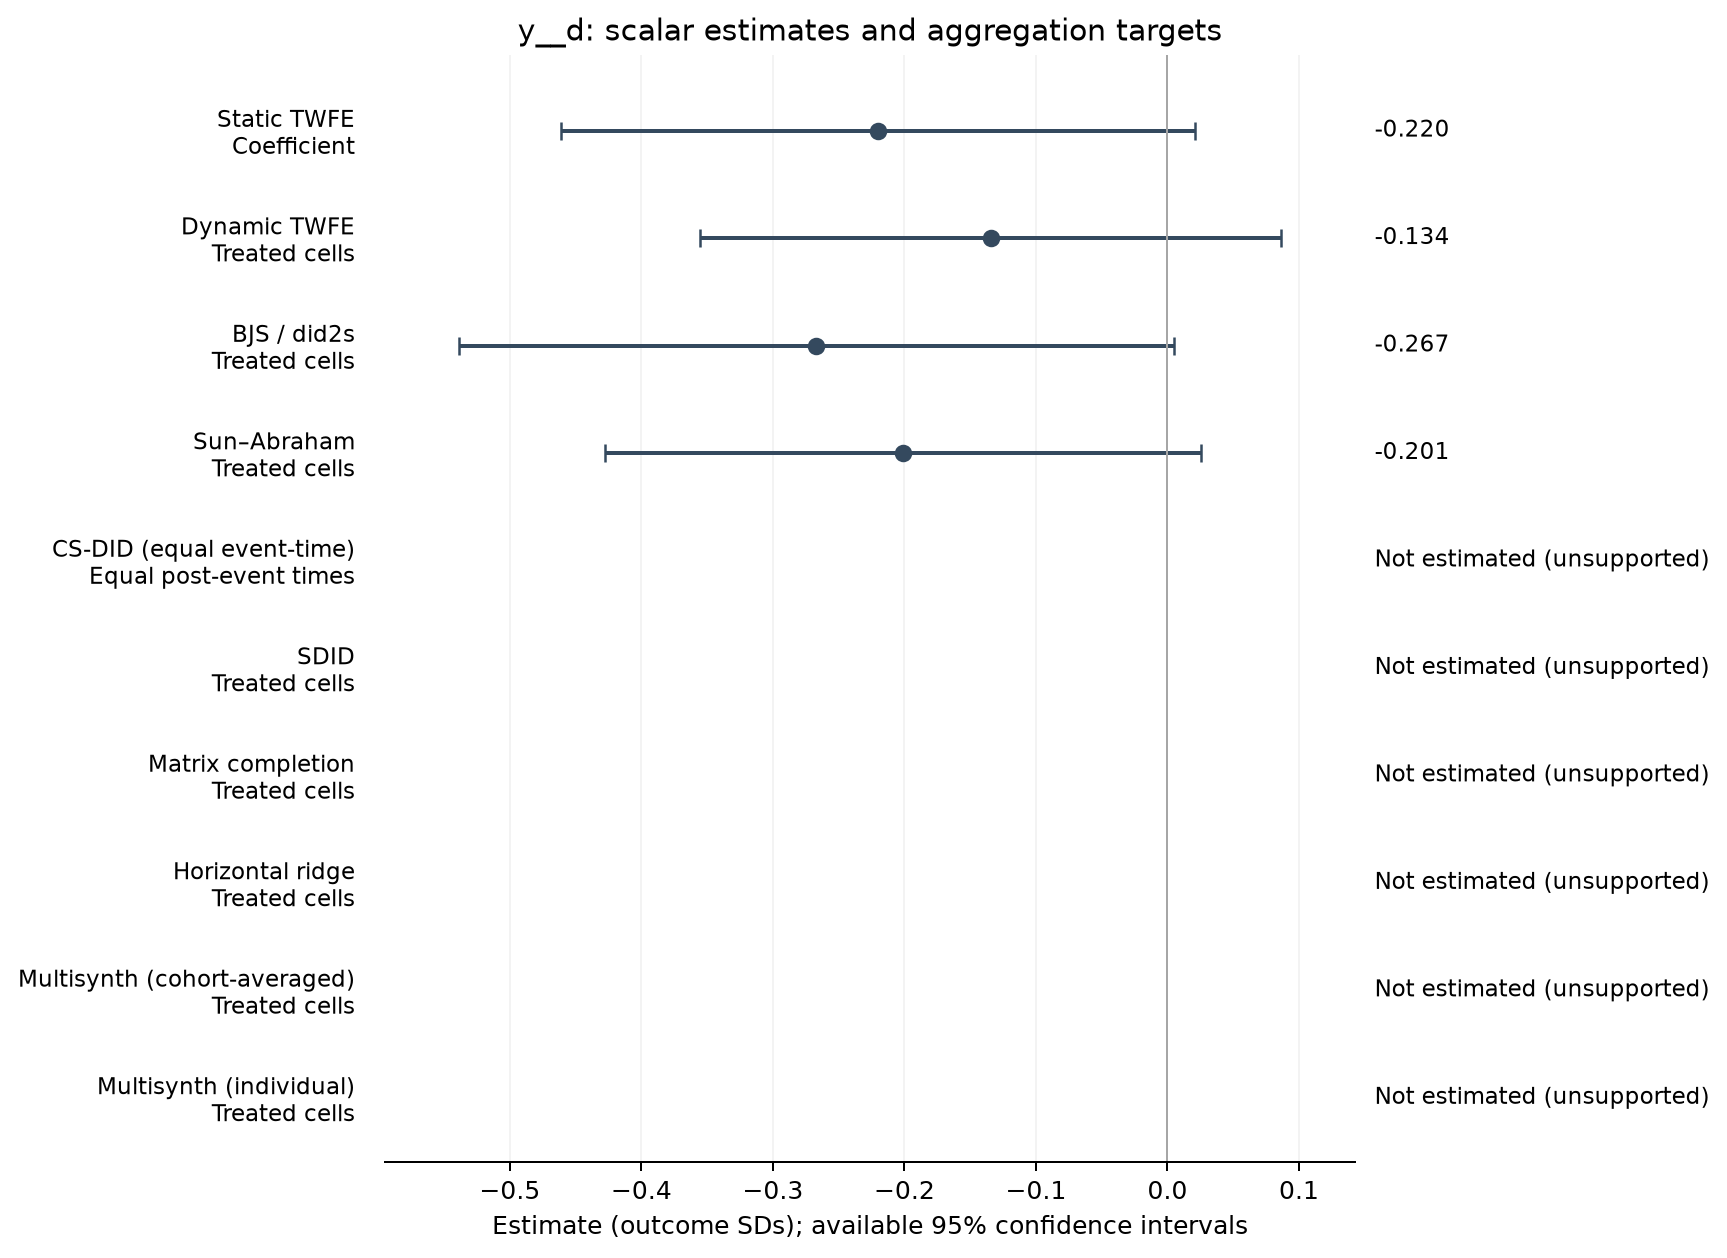
2,750 observations · 257 units · 257 clusters · 28 treated / 229 control units.
Estimate comparison
| Estimator | Estimate (SDs) | SE | 95% CI | Averaging |
|---|---|---|---|---|
| Static TWFE | -0.220 | 0.122 | [-0.461, 0.021] | Coefficient |
| Dynamic TWFE | -0.134 | 0.112 | [-0.355, 0.086] | Treated cells |
| BJS / did2s | -0.267 | 0.138 | [-0.539, 0.005] | Treated cells |
| Sun–Abraham | -0.201 | 0.115 | [-0.428, 0.026] | Treated cells |
Event studies
Periods −10 to +10; pointwise 95% intervals where available.
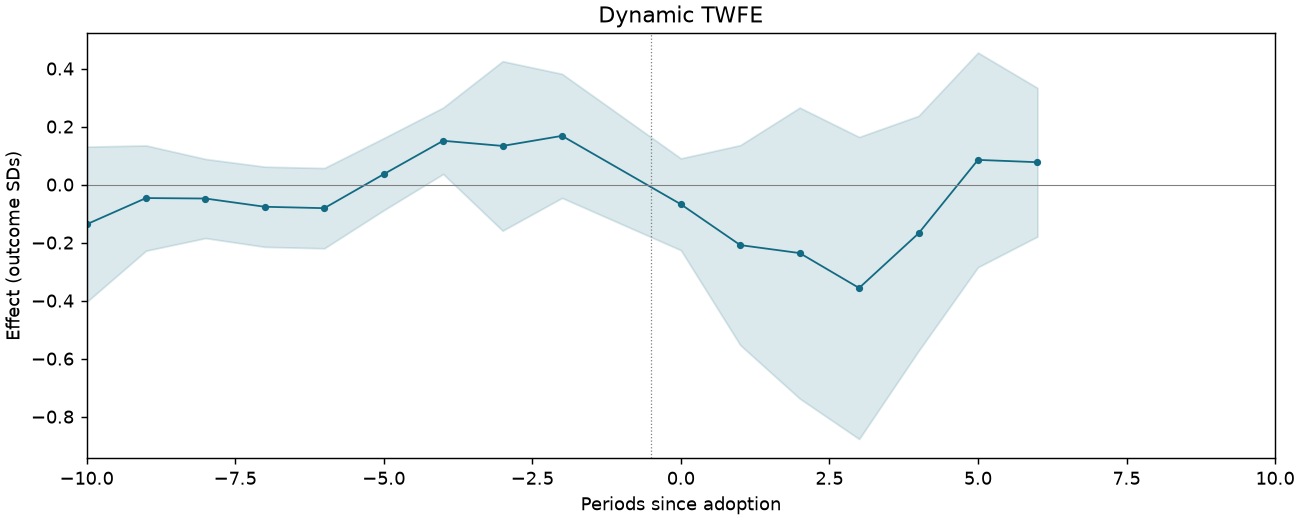
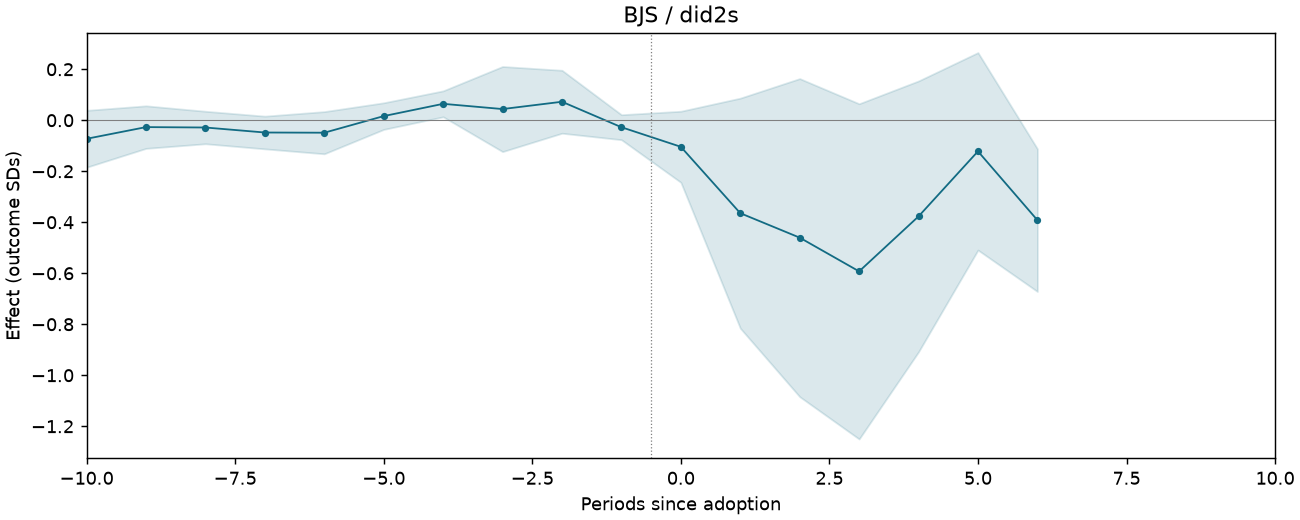
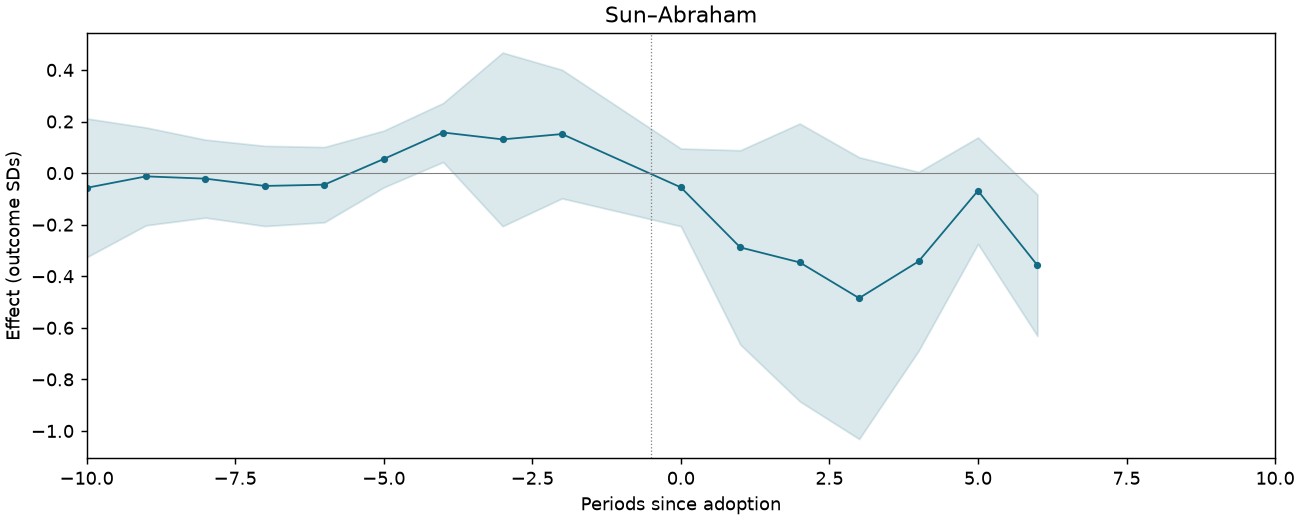
Oil theft: count of sabotage spills within 15 km of the field
1,916 observations · 175 units · 175 clusters · 24 treated / 151 control units.
Estimate comparison
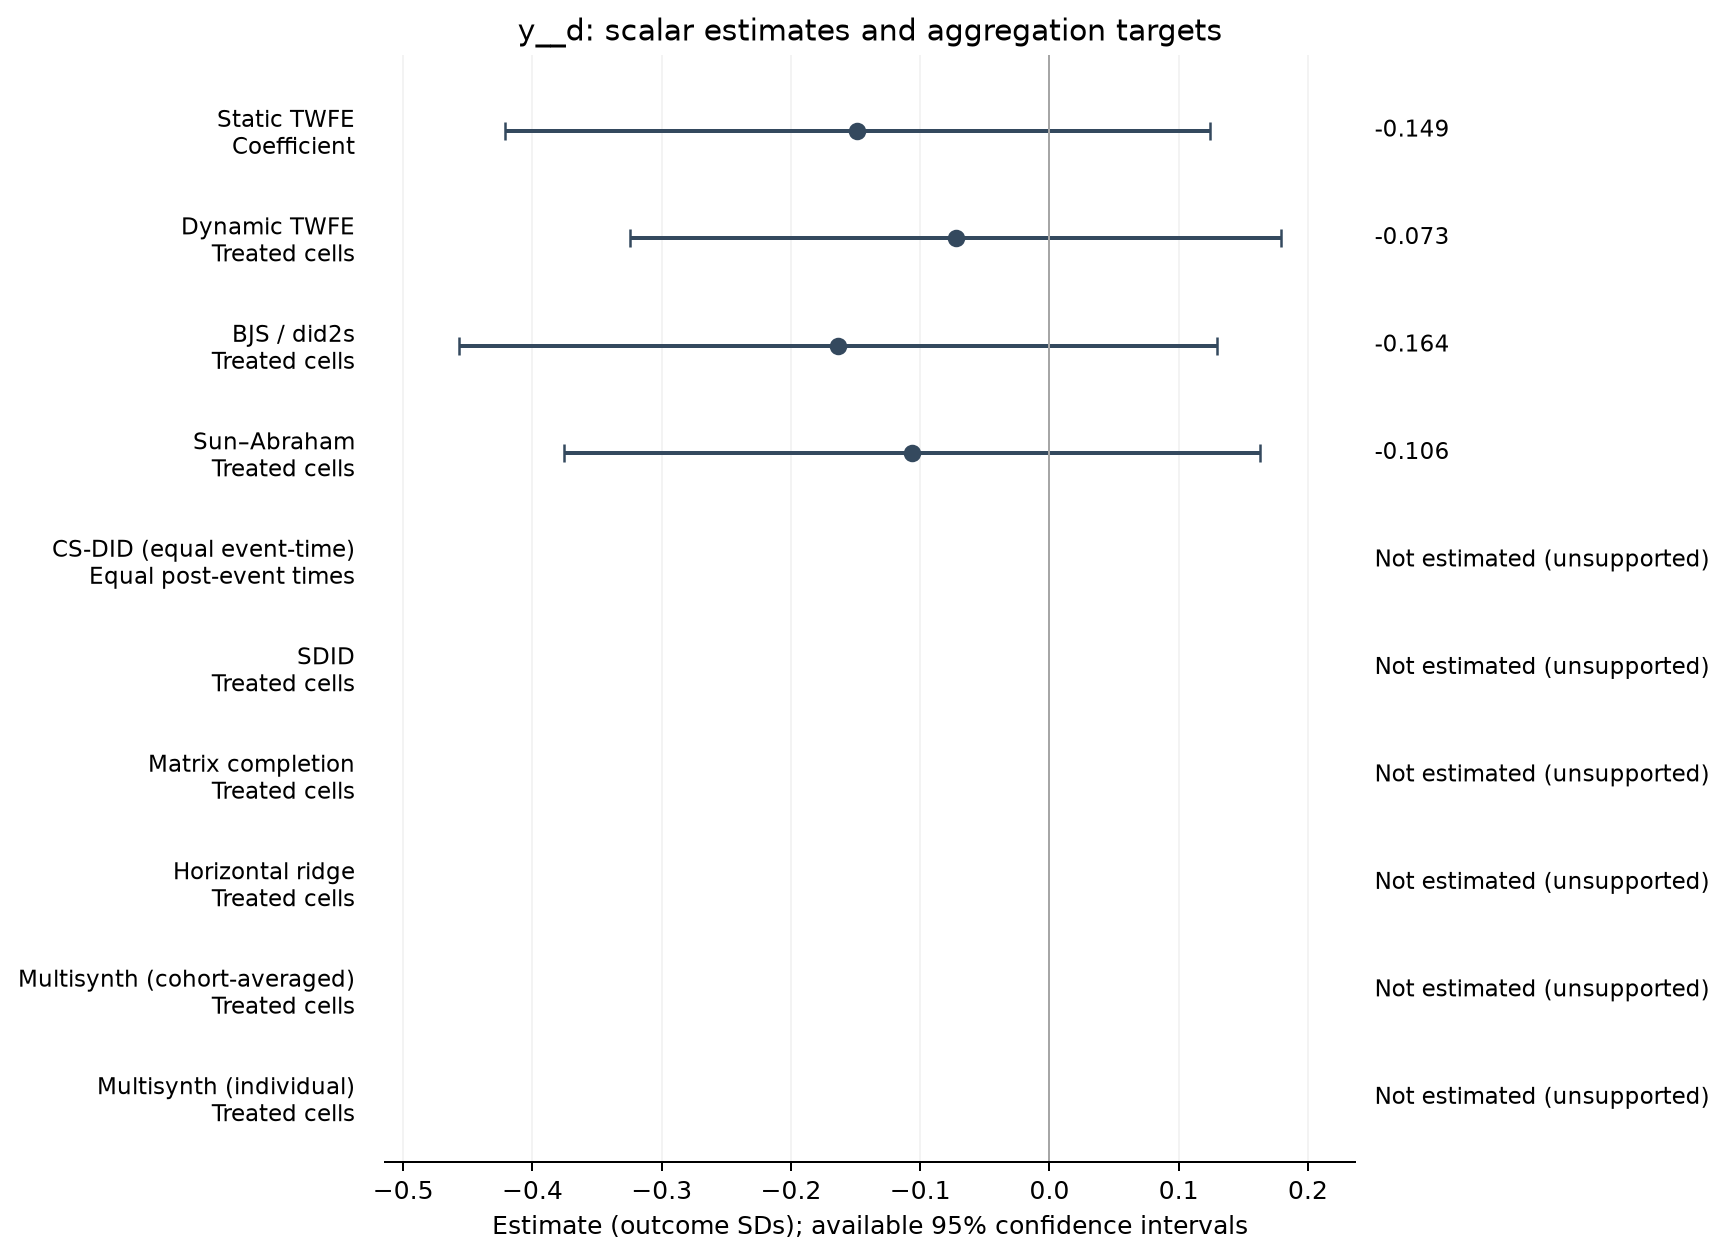
| Estimator | Estimate (SDs) | SE | 95% CI | Averaging |
|---|---|---|---|---|
| Static TWFE | -0.149 | 0.138 | [-0.422, 0.124] | Coefficient |
| Dynamic TWFE | -0.073 | 0.128 | [-0.325, 0.179] | Treated cells |
| BJS / did2s | -0.164 | 0.149 | [-0.457, 0.130] | Treated cells |
| Sun–Abraham | -0.106 | 0.136 | [-0.376, 0.163] | Treated cells |
Event studies
Periods −10 to +10; pointwise 95% intervals where available.
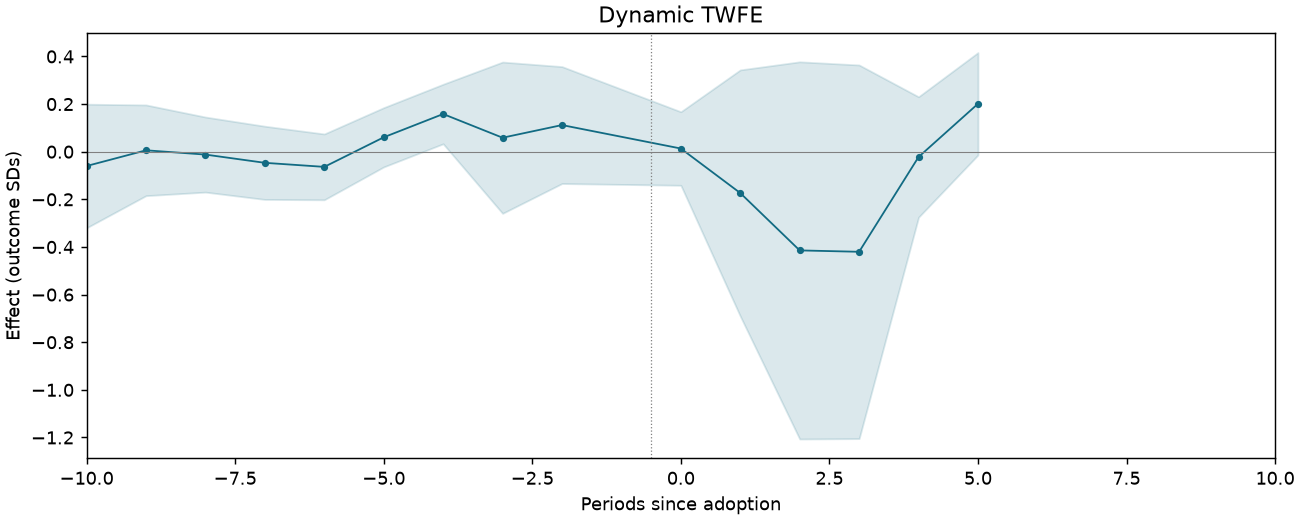
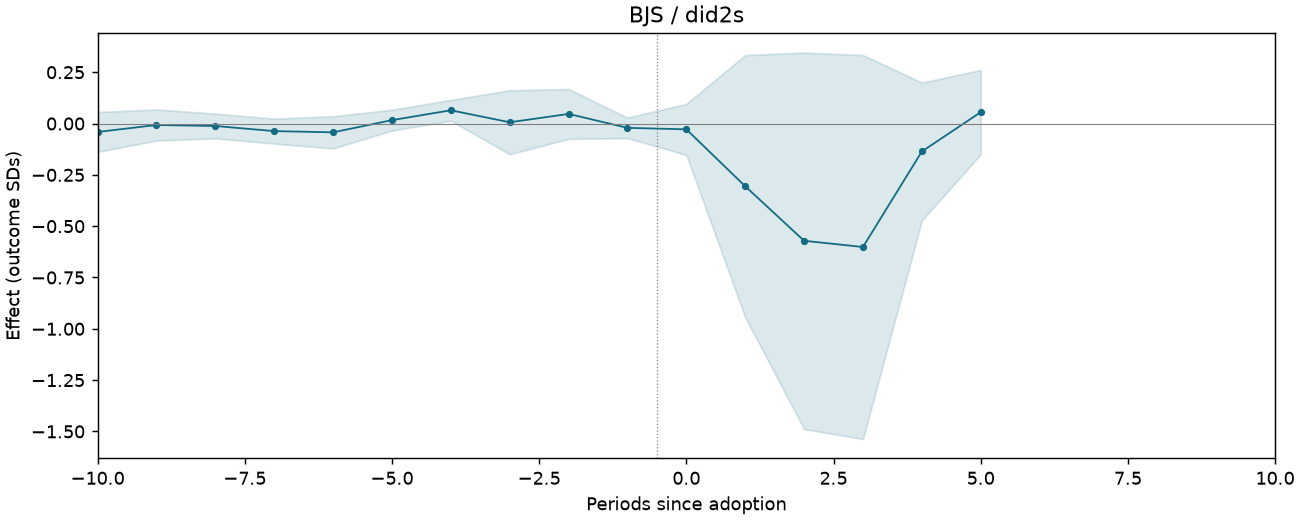
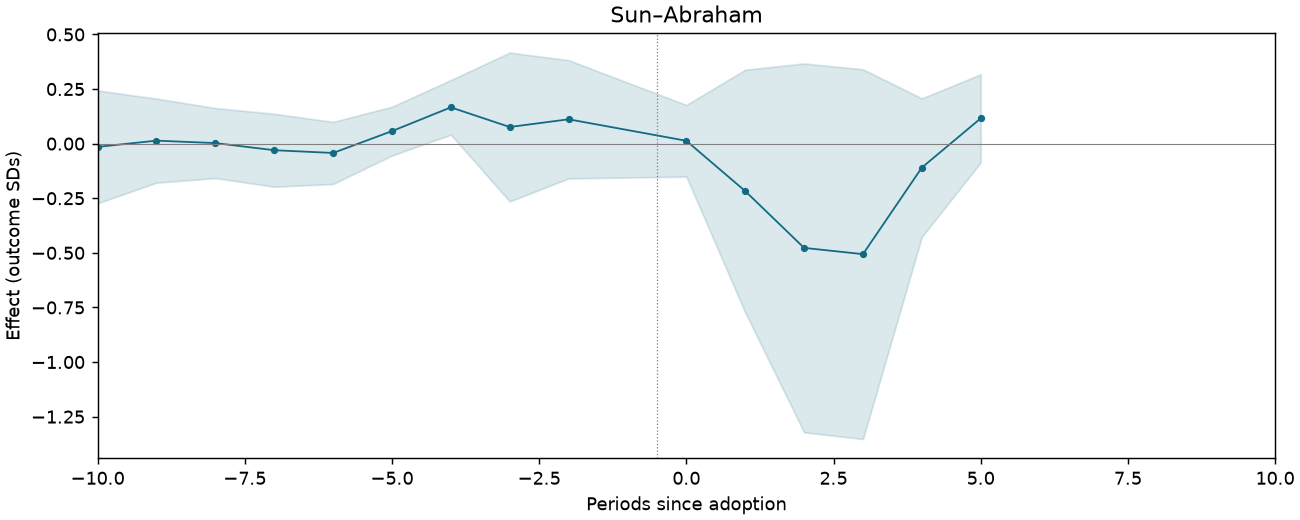
Oil theft: count of sabotage spills within 15 km of the field
3,167 observations · 303 units · 303 clusters · 52 treated / 251 control units.
Estimate comparison
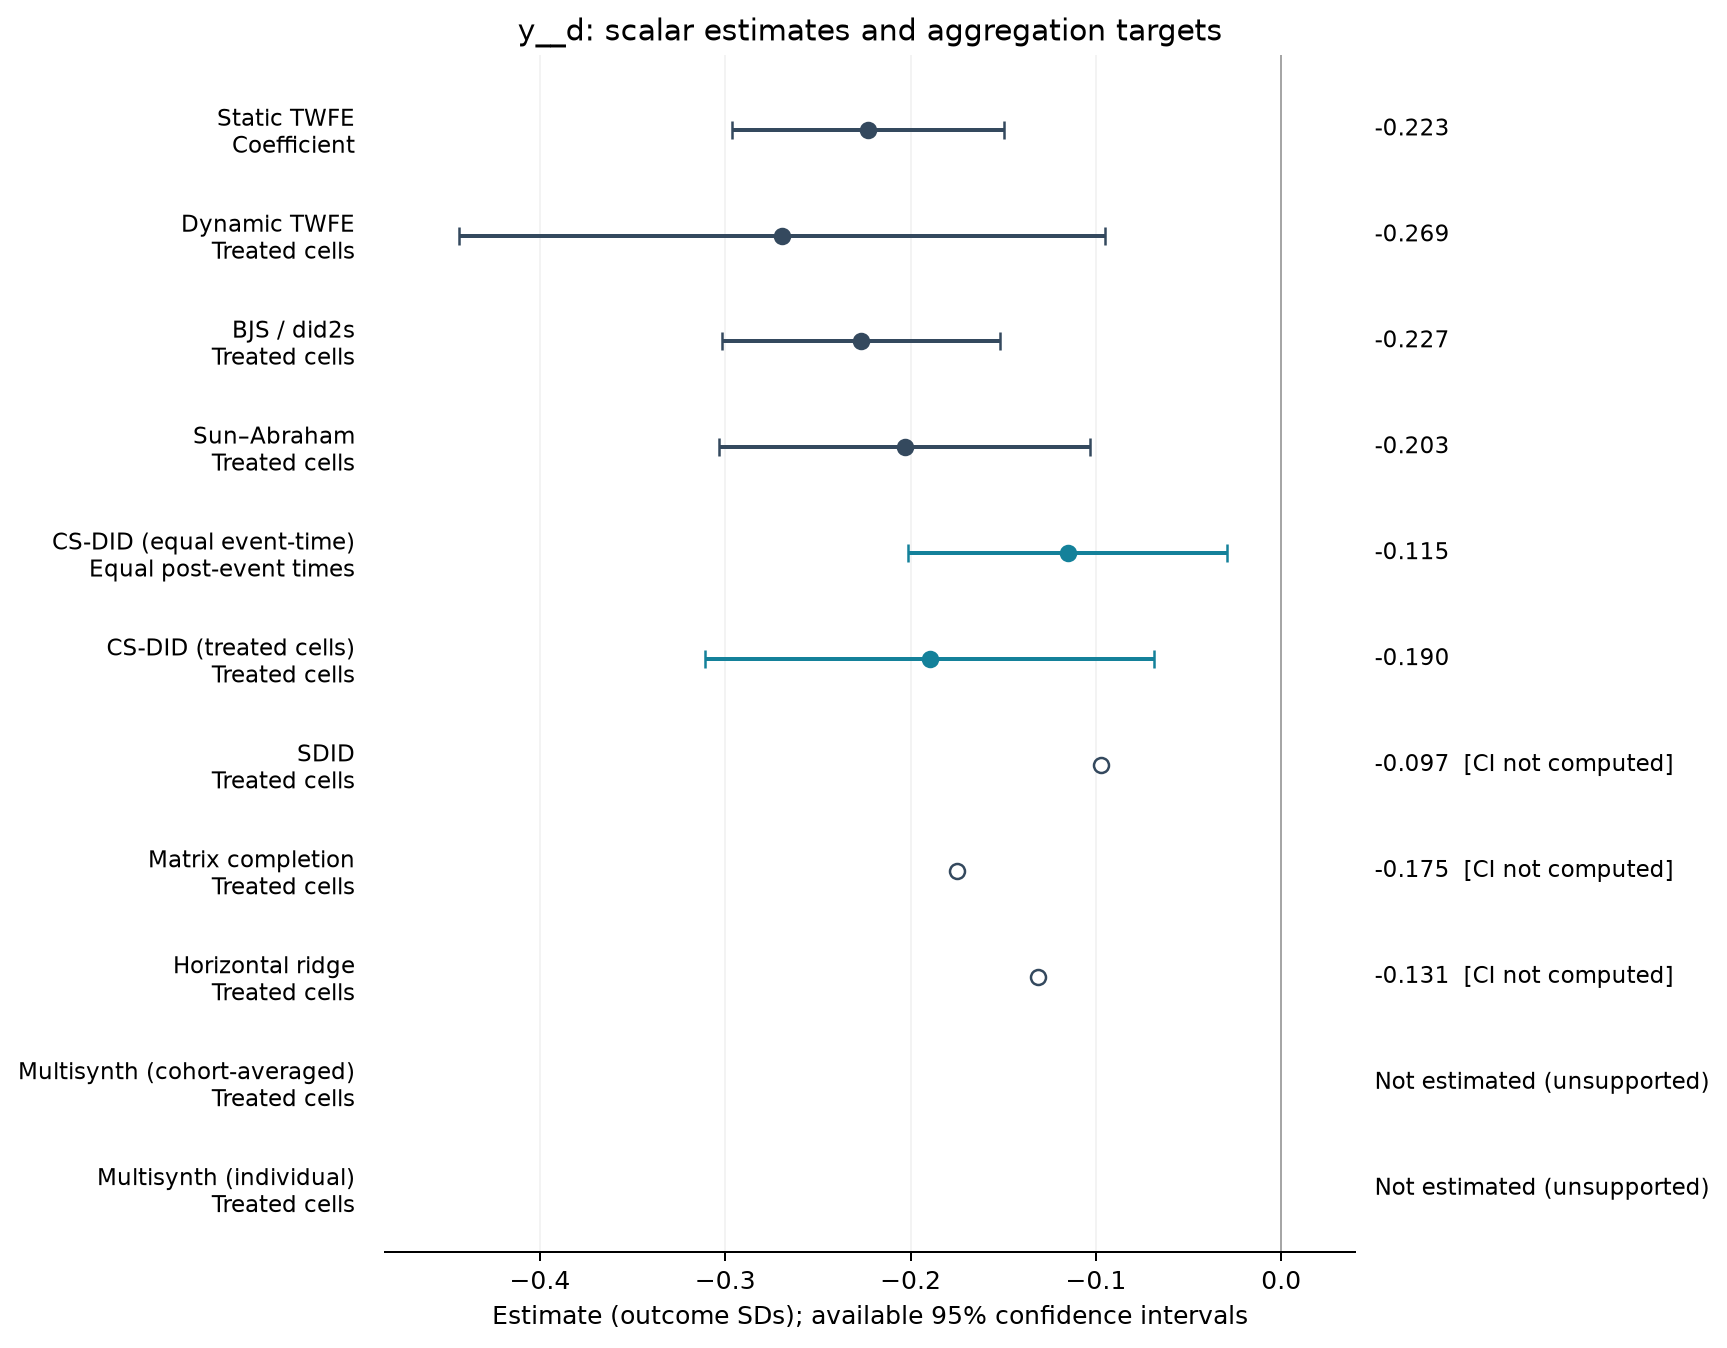
| Estimator | Estimate (SDs) | SE | 95% CI | Averaging |
|---|---|---|---|---|
| Static TWFE | -0.223 | 0.037 | [-0.296, -0.150] | Coefficient |
| Dynamic TWFE | -0.269 | 0.089 | [-0.444, -0.095] | Treated cells |
| BJS / did2s | -0.227 | 0.038 | [-0.302, -0.152] | Treated cells |
| Sun–Abraham | -0.203 | 0.051 | [-0.303, -0.103] | Treated cells |
| CS-DID (equal event-time) | -0.115 | 0.044 | [-0.201, -0.029] | Equal post-event times |
| CS-DID (treated cells) | -0.190 | 0.062 | [-0.311, -0.069] | Treated cells |
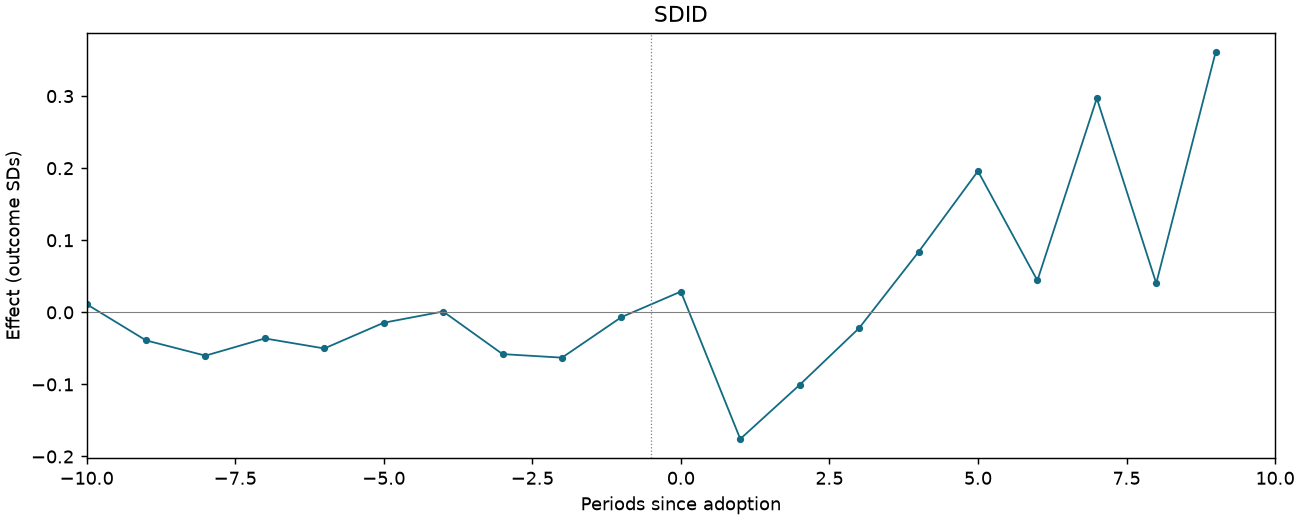
| SDID | -0.097 | — | — | Treated cells |
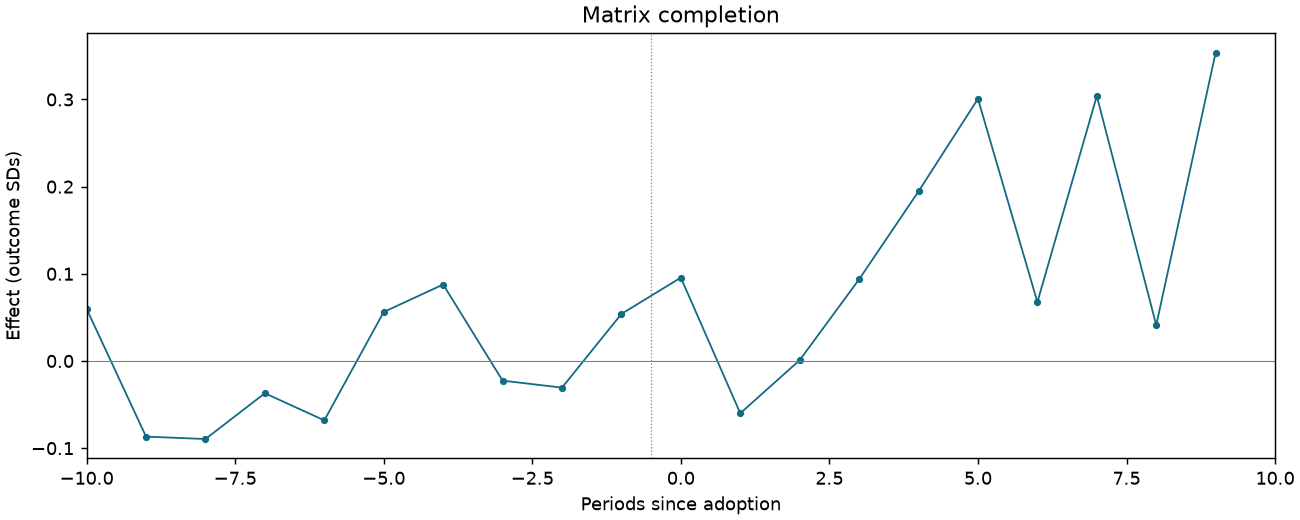
| Matrix completion | -0.175 | — | — | Treated cells |
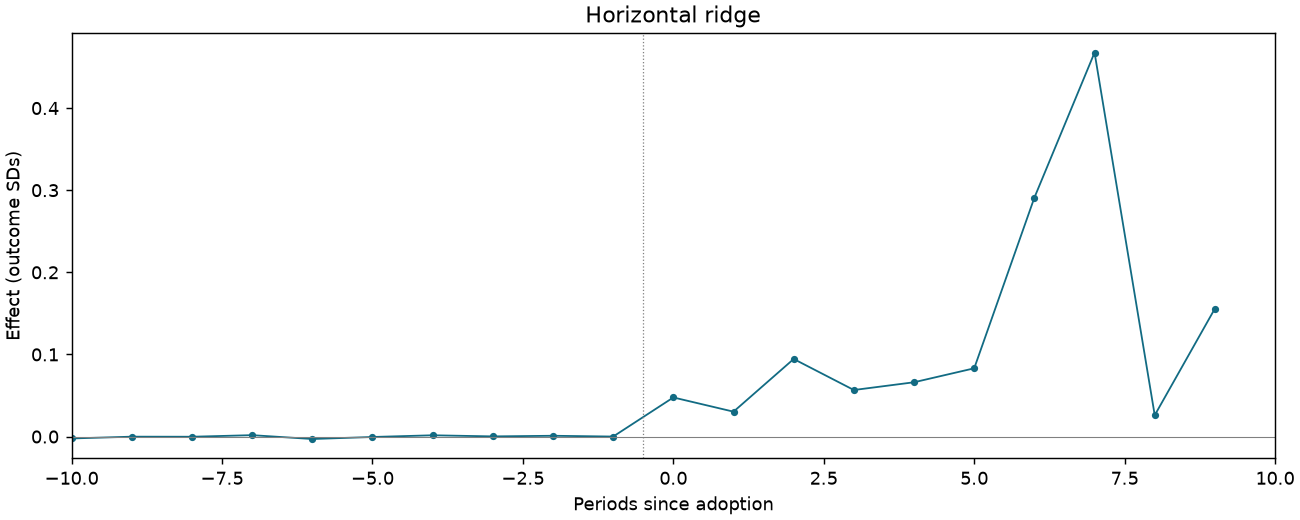
| Horizontal ridge | -0.131 | — | — | Treated cells |
Event studies
Periods −10 to +10; pointwise 95% intervals where available.
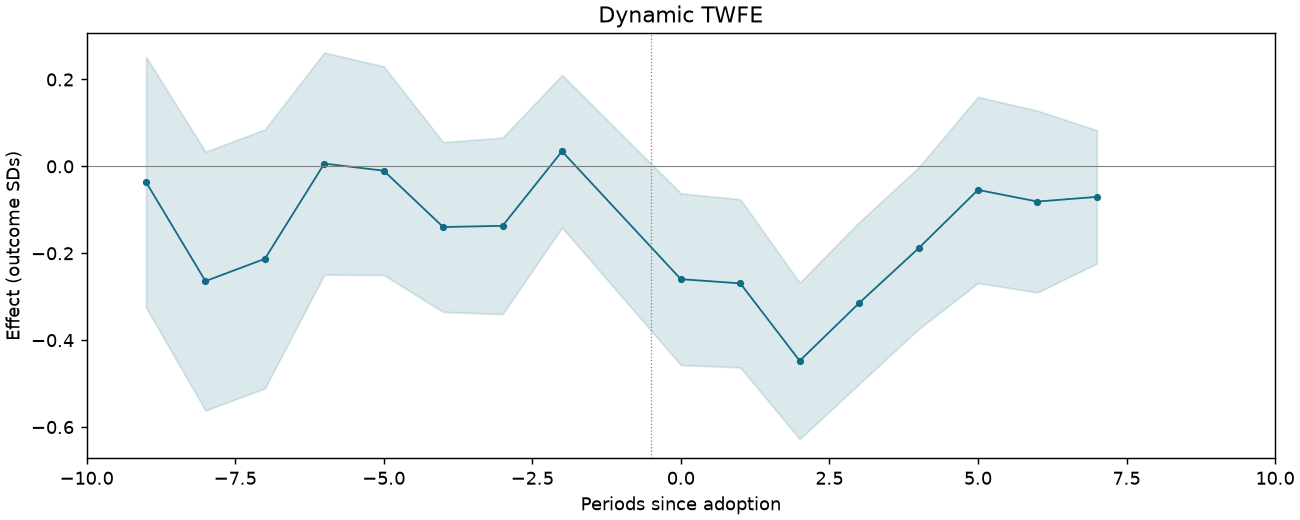
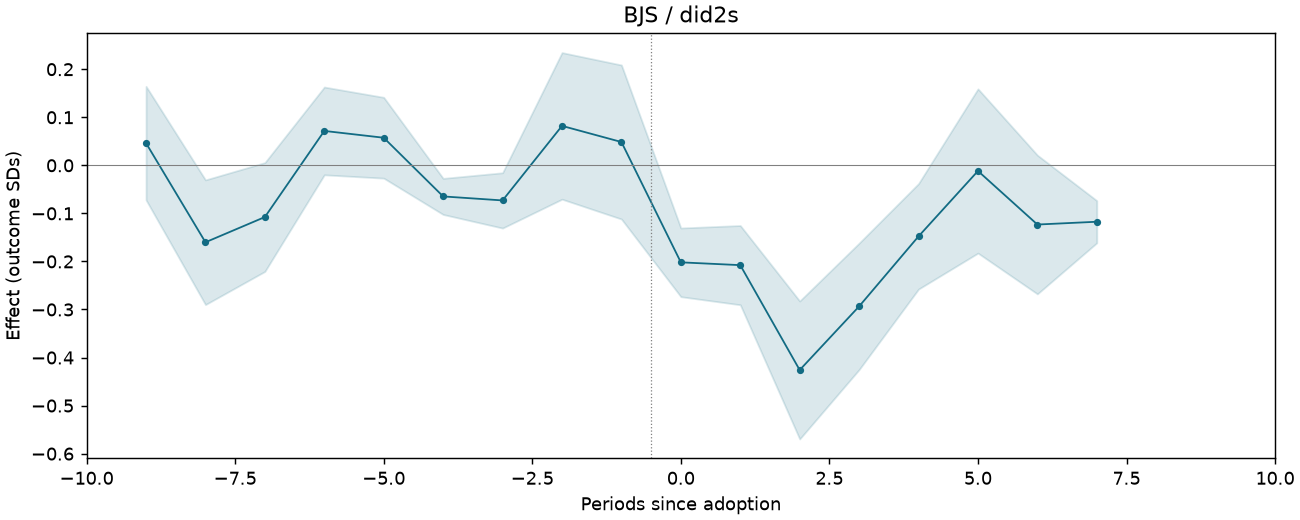
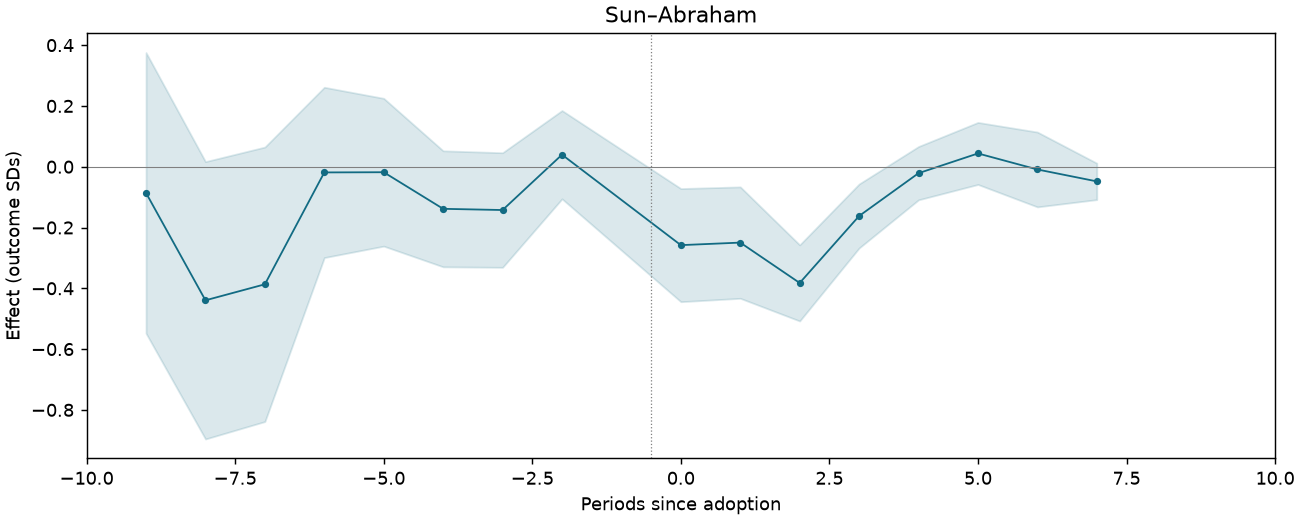
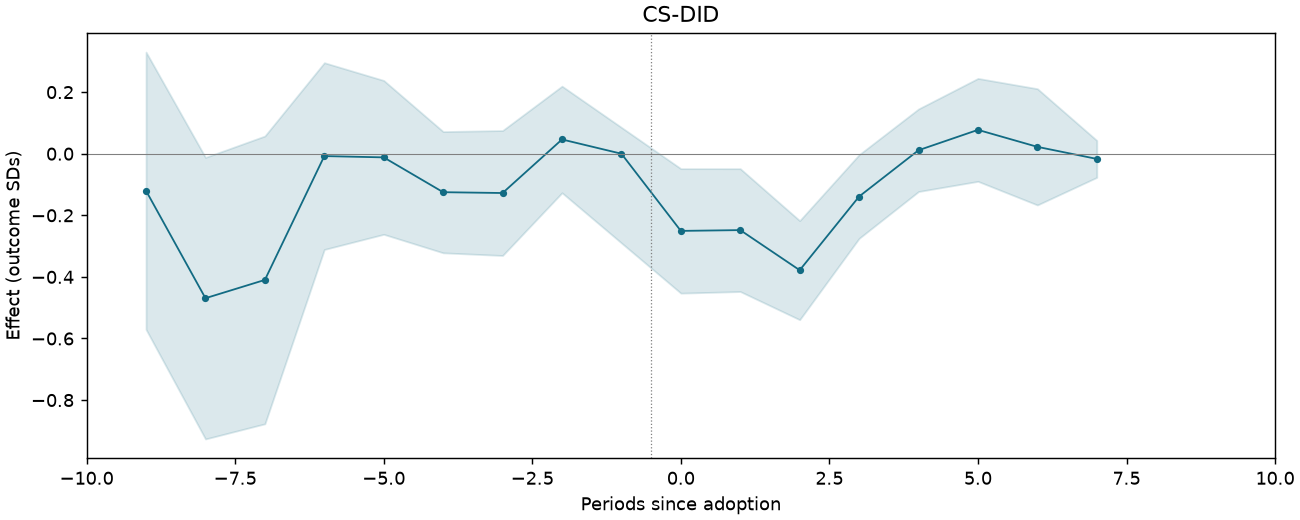
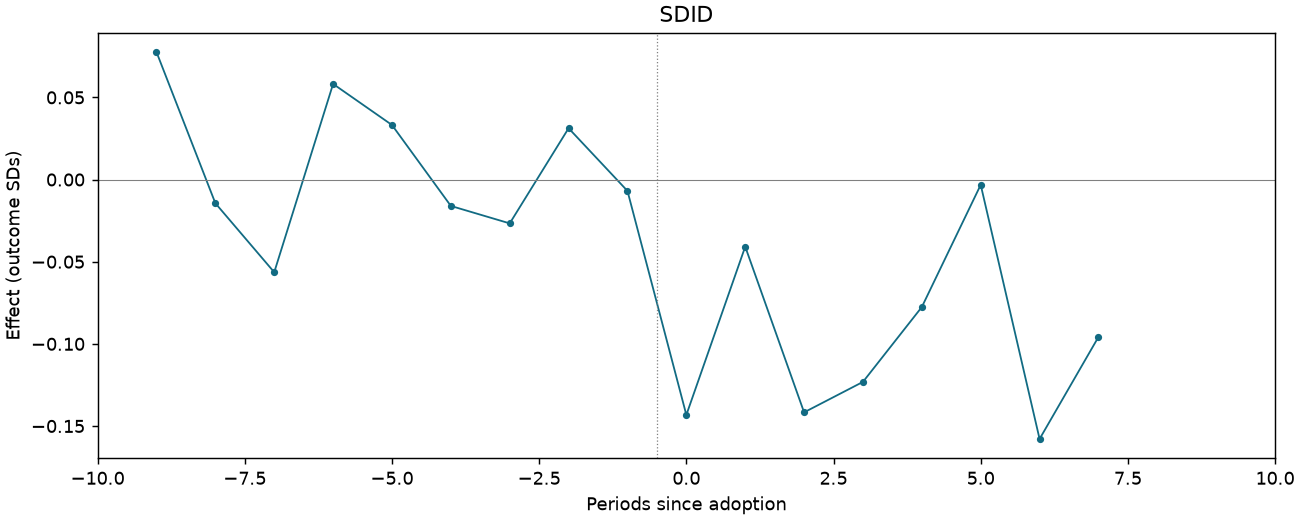
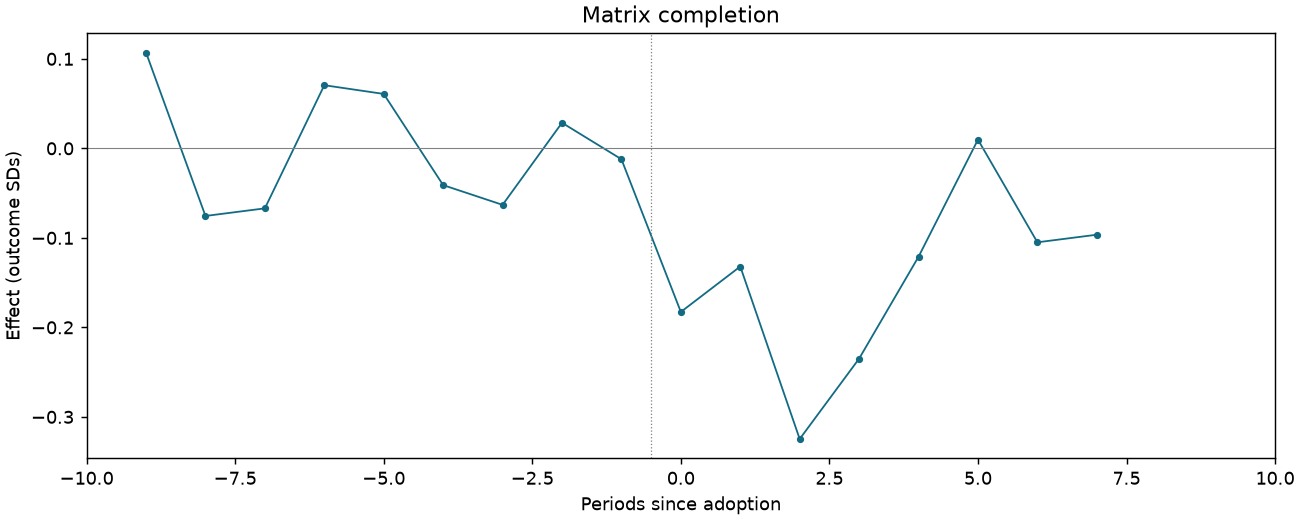
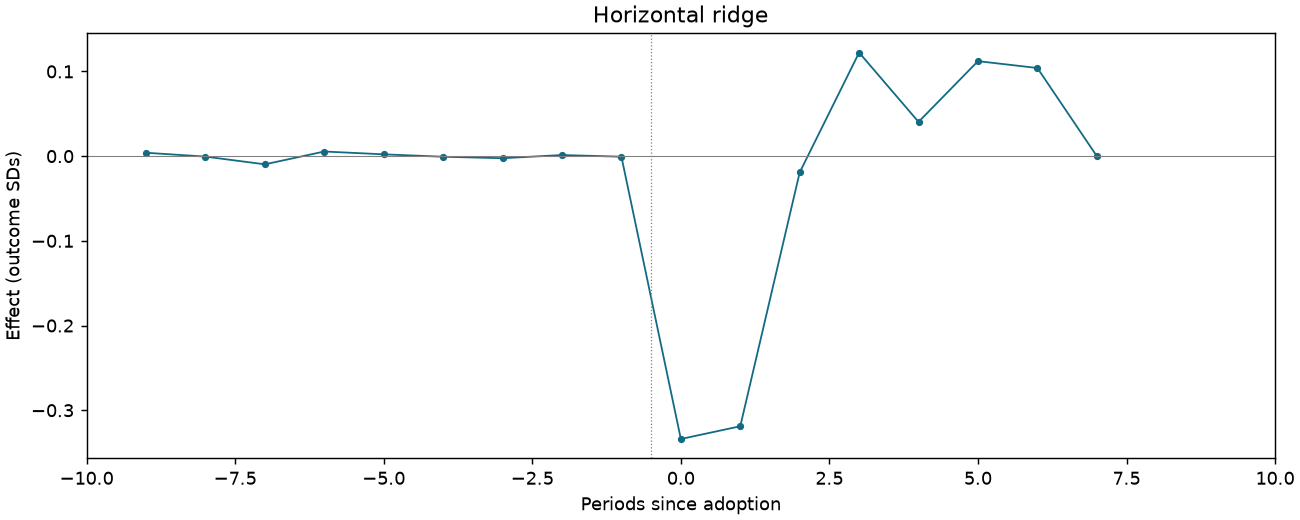
Oil theft: count of sabotage spills within 15 km of the field
2,285 observations · 216 units · 216 clusters · 49 treated / 167 control units.
Estimate comparison
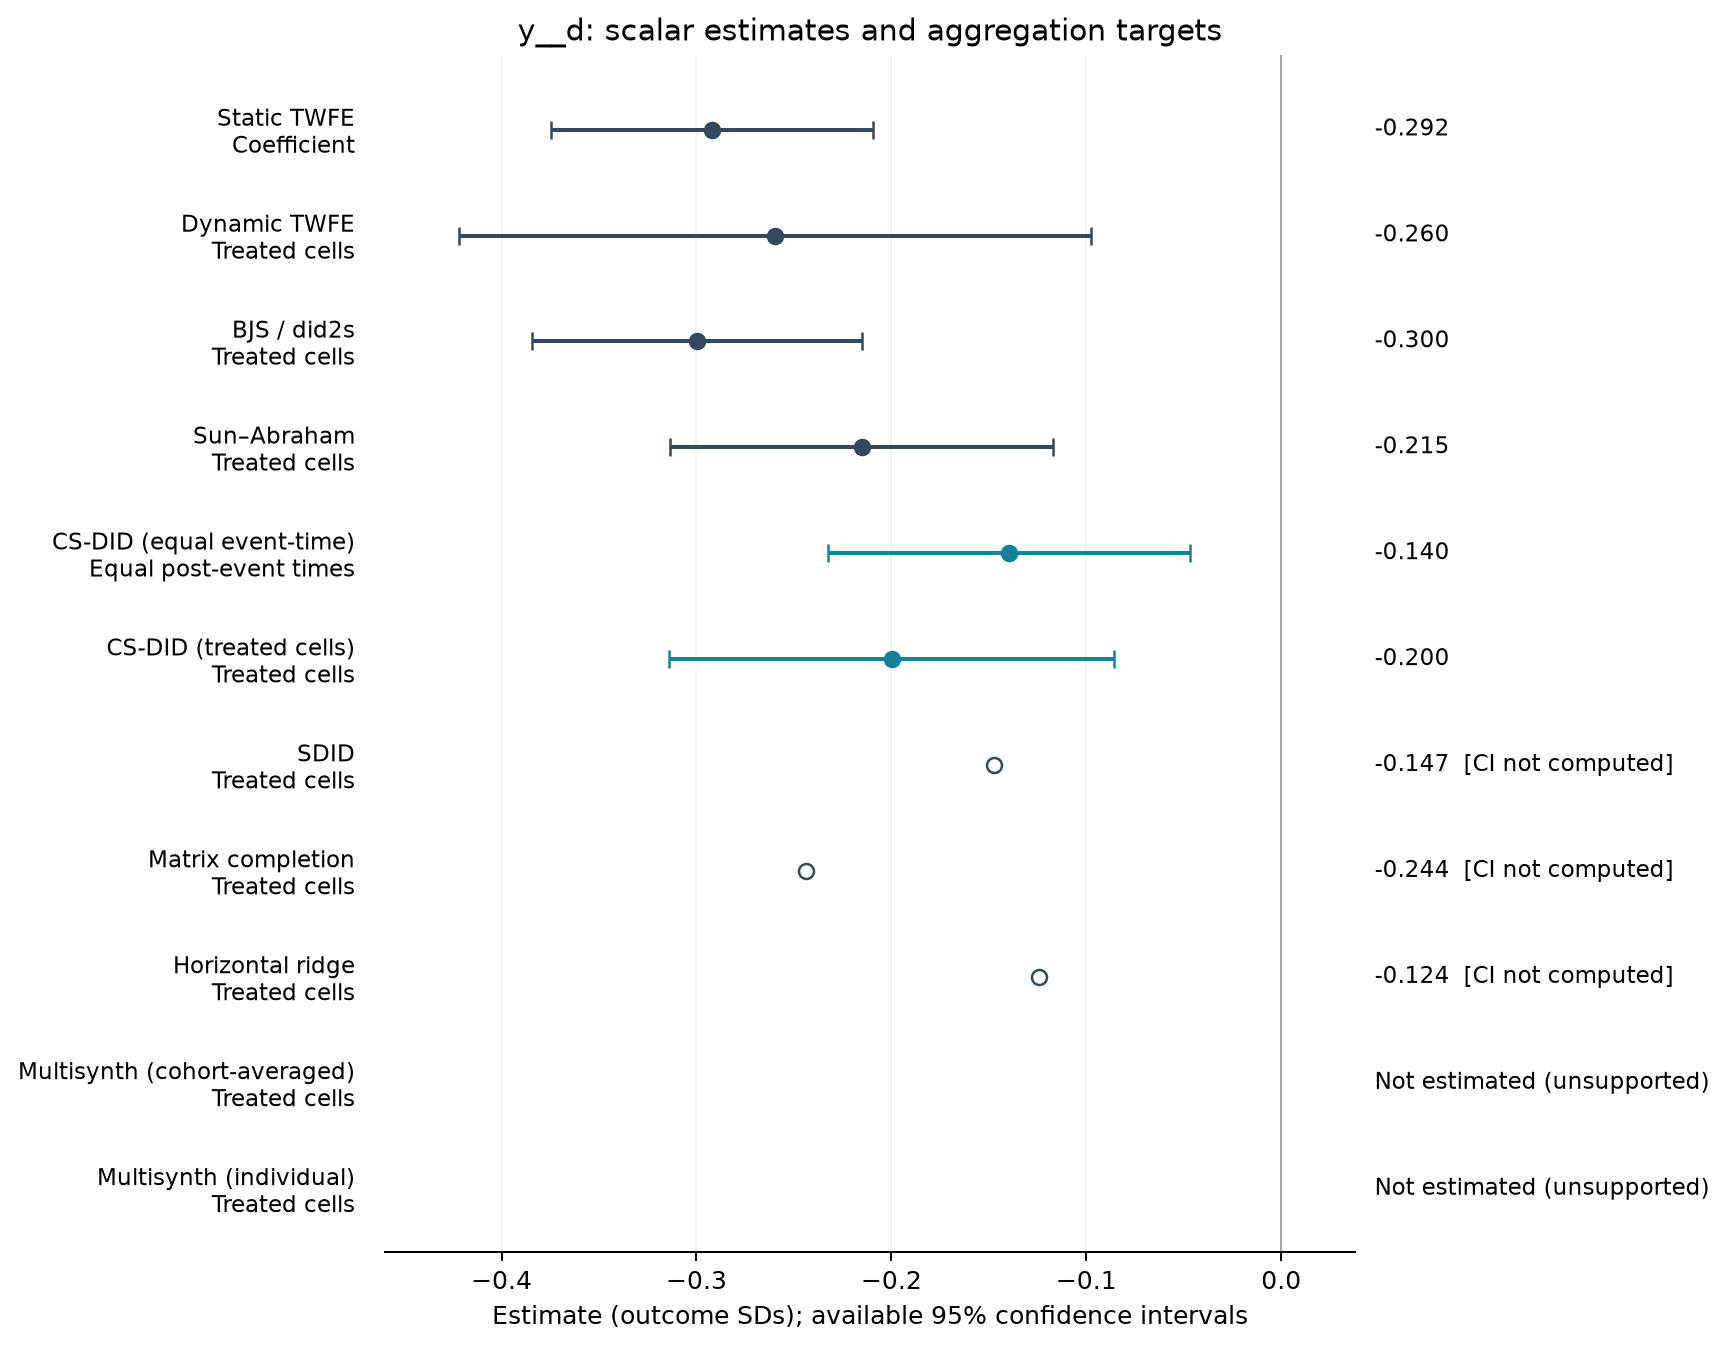
| Estimator | Estimate (SDs) | SE | 95% CI | Averaging |
|---|---|---|---|---|
| Static TWFE | -0.292 | 0.042 | [-0.374, -0.209] | Coefficient |
| Dynamic TWFE | -0.260 | 0.082 | [-0.422, -0.098] | Treated cells |
| BJS / did2s | -0.300 | 0.043 | [-0.384, -0.215] | Treated cells |
| Sun–Abraham | -0.215 | 0.050 | [-0.313, -0.117] | Treated cells |
| CS-DID (equal event-time) | -0.140 | 0.047 | [-0.232, -0.047] | Equal post-event times |
| CS-DID (treated cells) | -0.200 | 0.058 | [-0.314, -0.086] | Treated cells |
| SDID | -0.147 | — | — | Treated cells |
| Matrix completion | -0.244 | — | — | Treated cells |
| Horizontal ridge | -0.124 | — | — | Treated cells |
Event studies
Periods −10 to +10; pointwise 95% intervals where available.
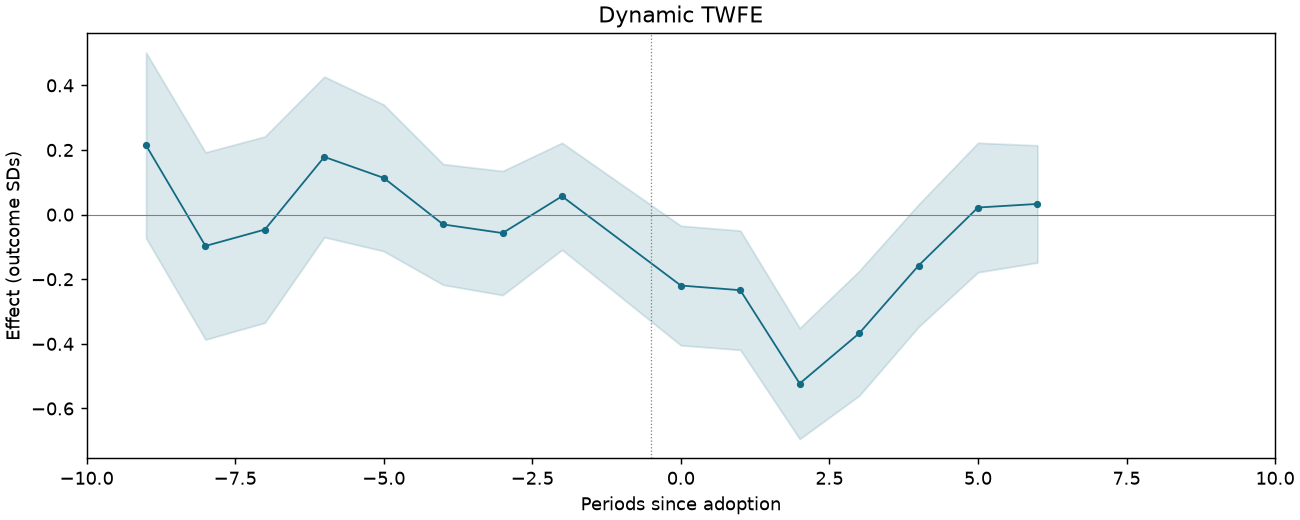
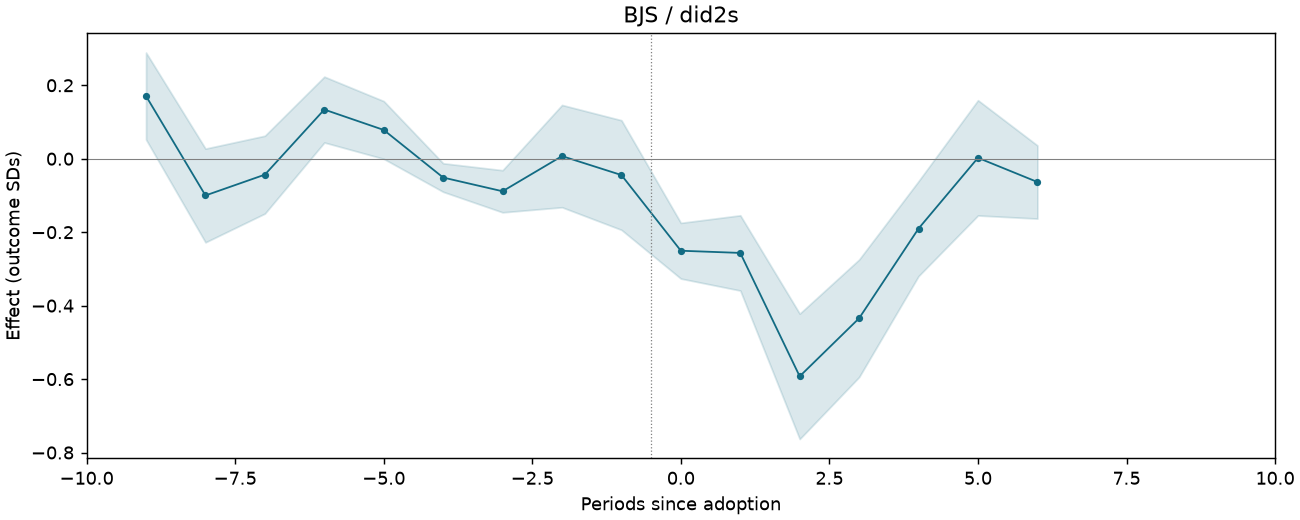
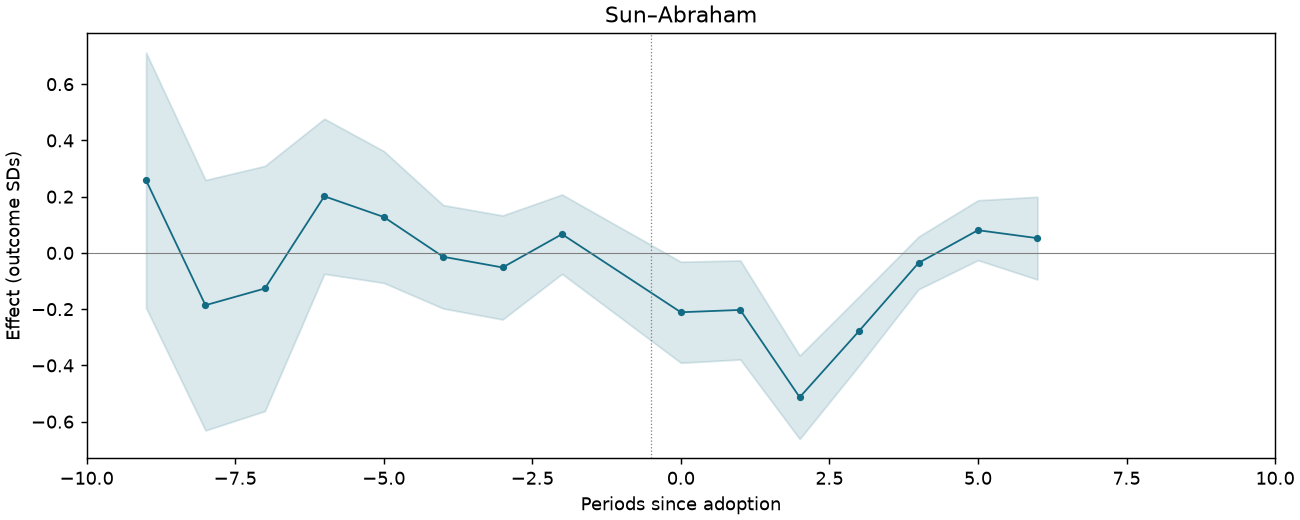
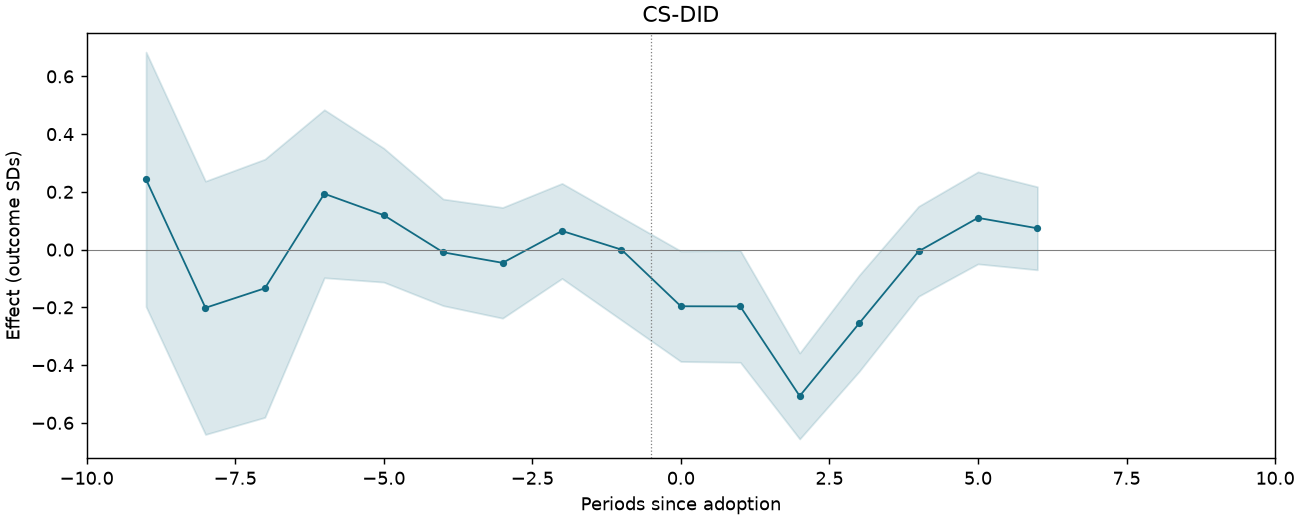
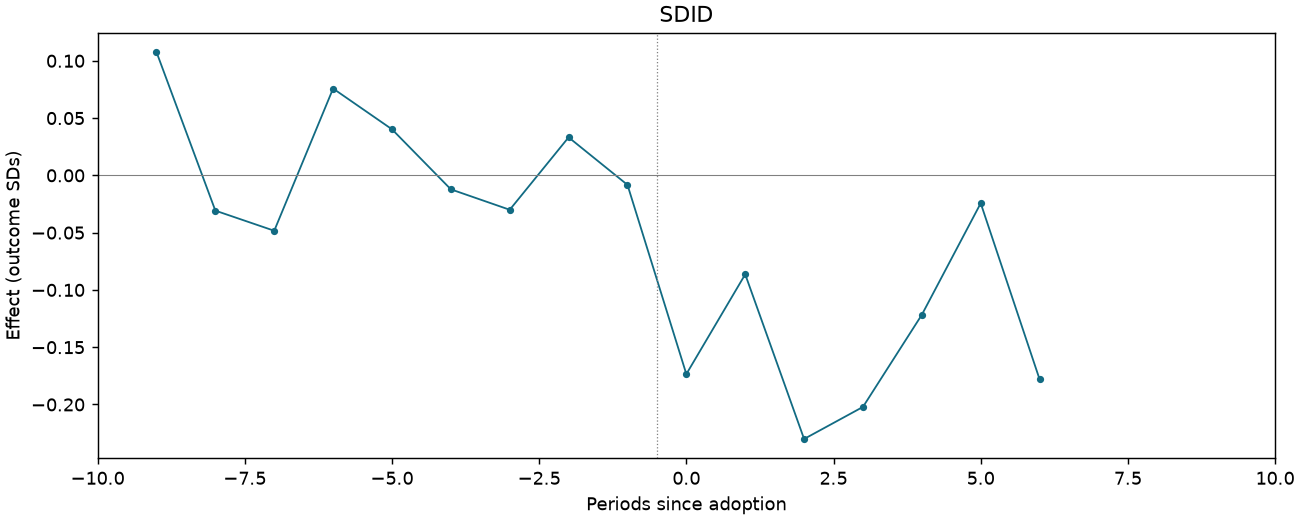
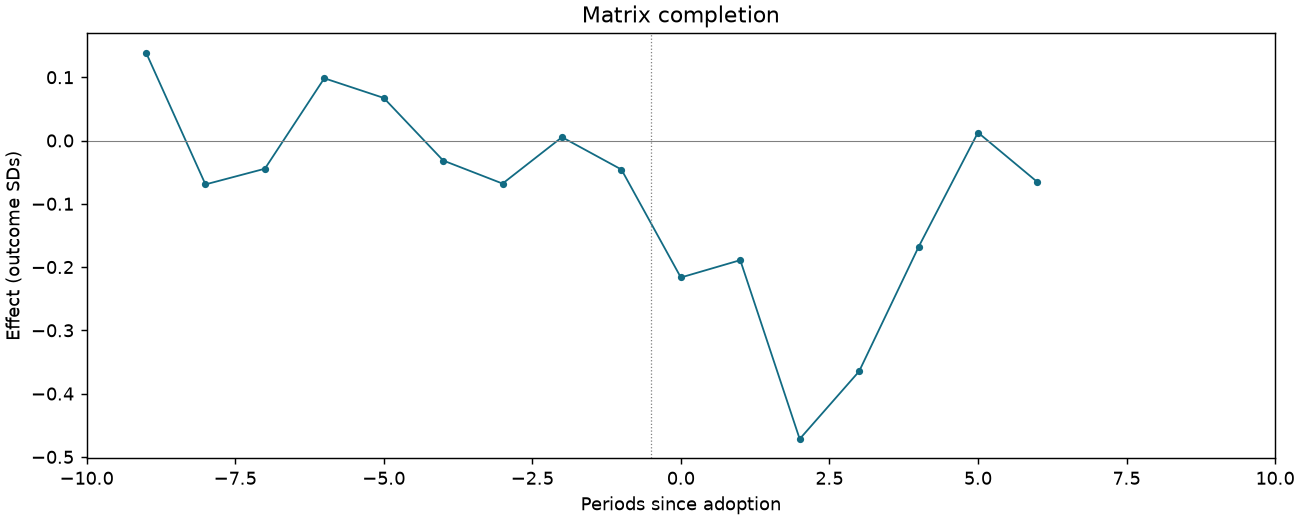
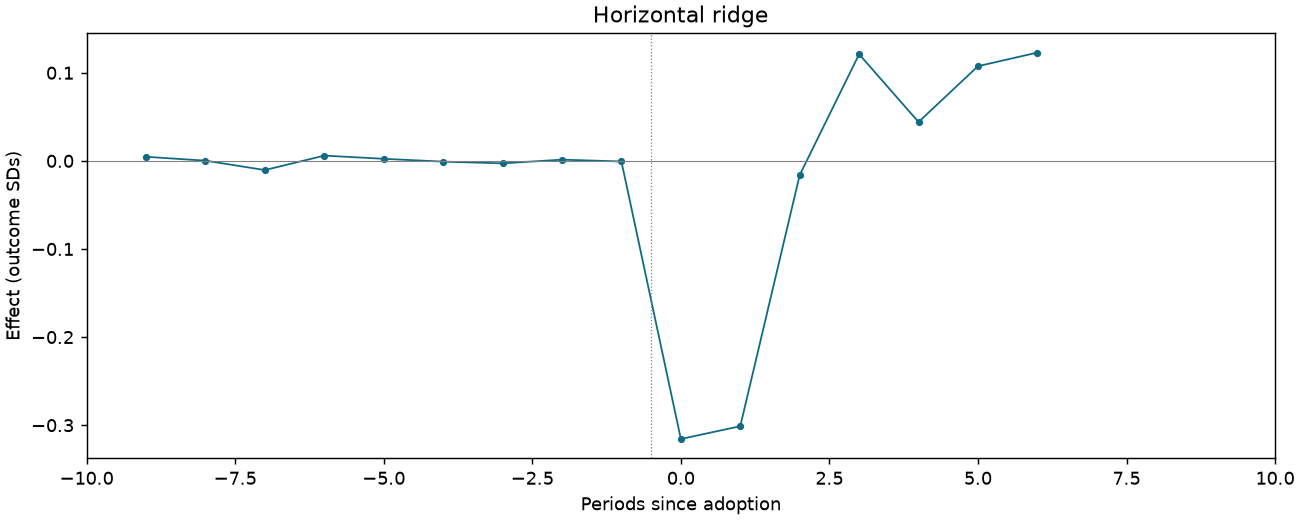
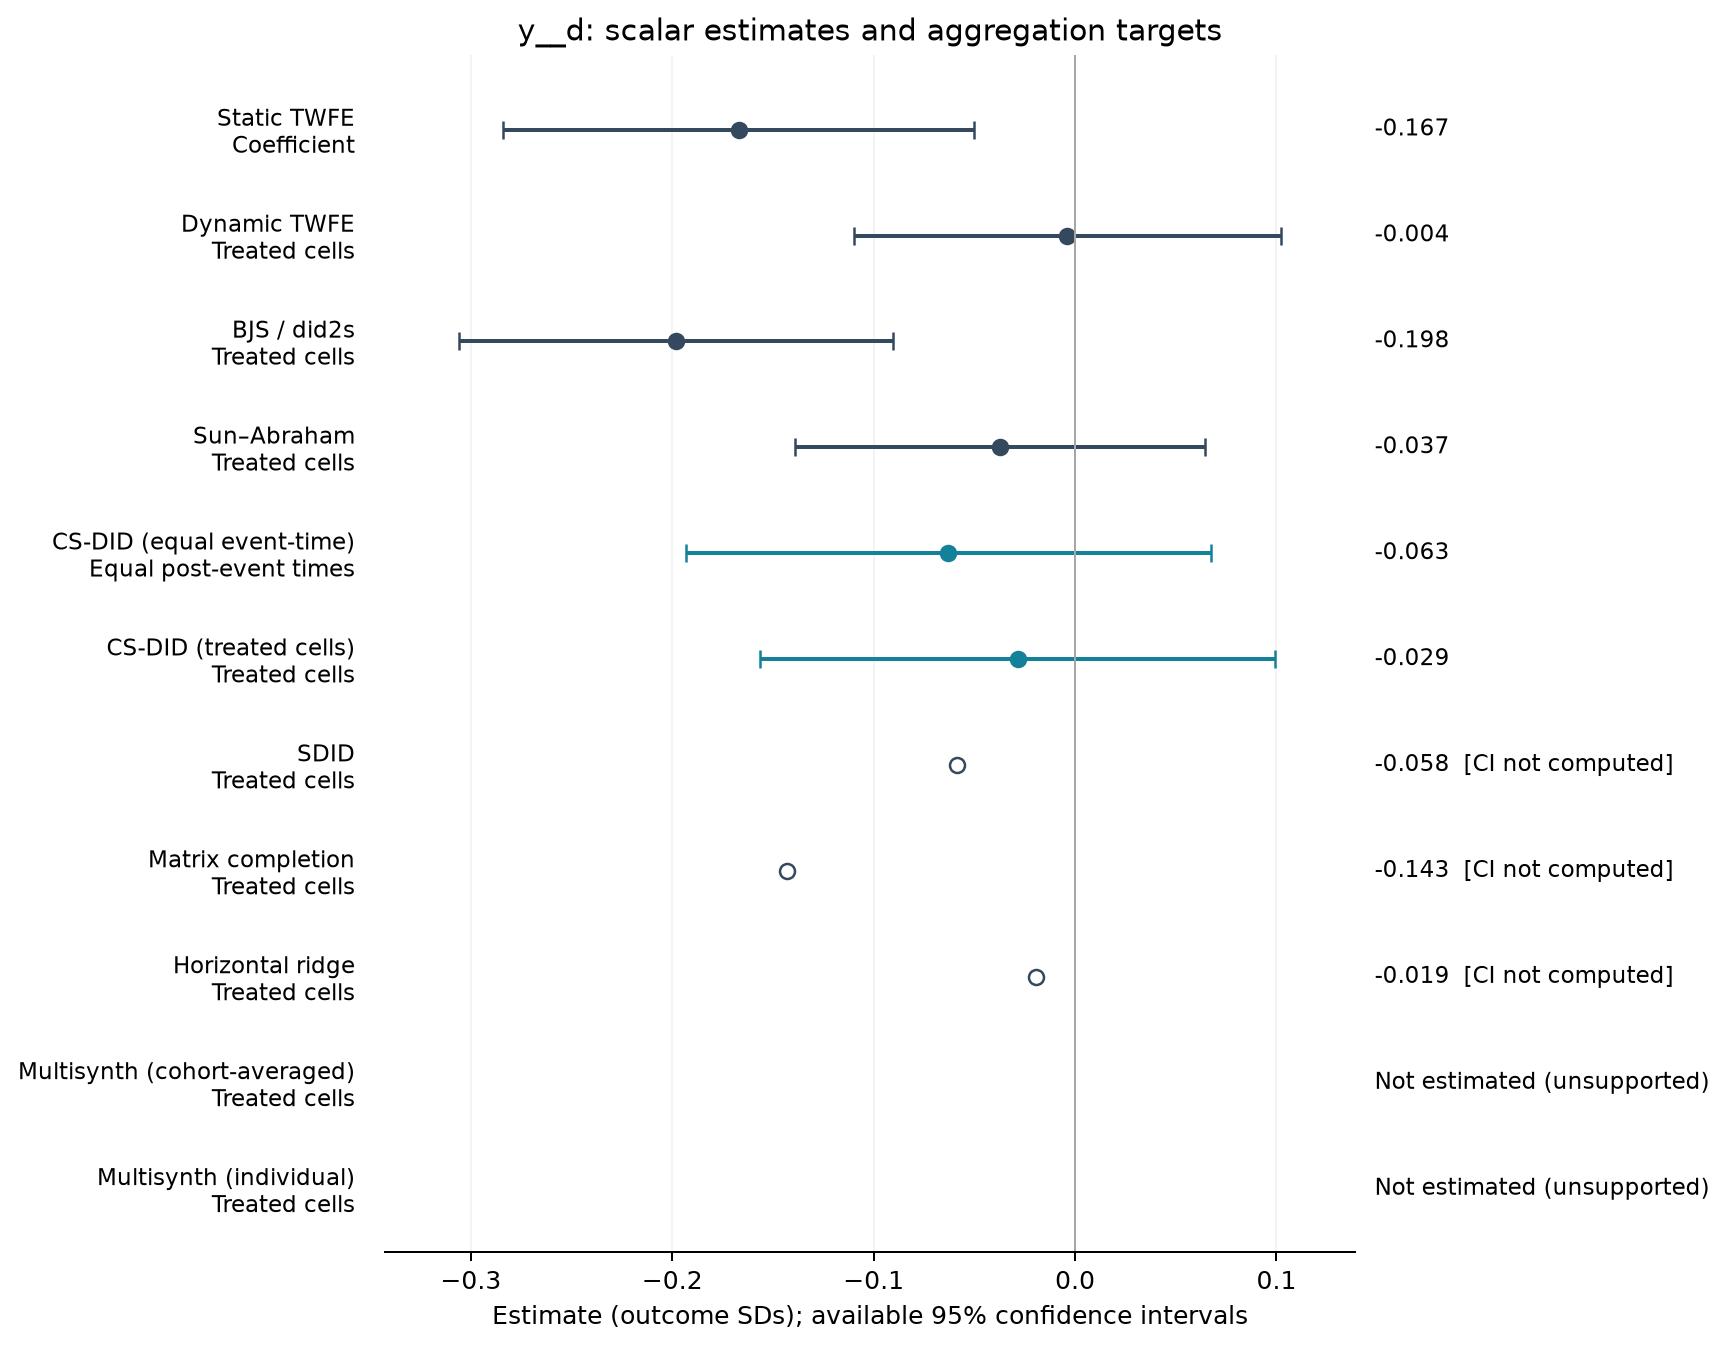
Oil theft: count of sabotage spills within 15 km of the field
2,906 observations · 272 units · 272 clusters · 33 treated / 239 control units.
Estimate comparison
| Estimator | Estimate (SDs) | SE | 95% CI | Averaging |
|---|---|---|---|---|
| Static TWFE | -0.167 | 0.059 | [-0.284, -0.050] | Coefficient |
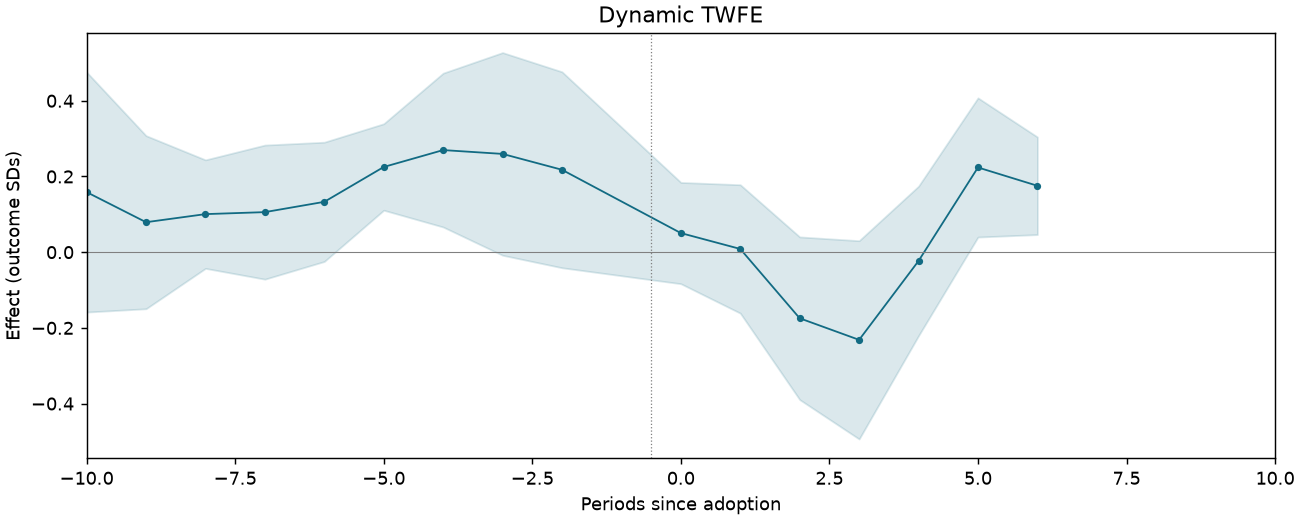
| Dynamic TWFE | -0.004 | 0.054 | [-0.110, 0.102] | Treated cells |
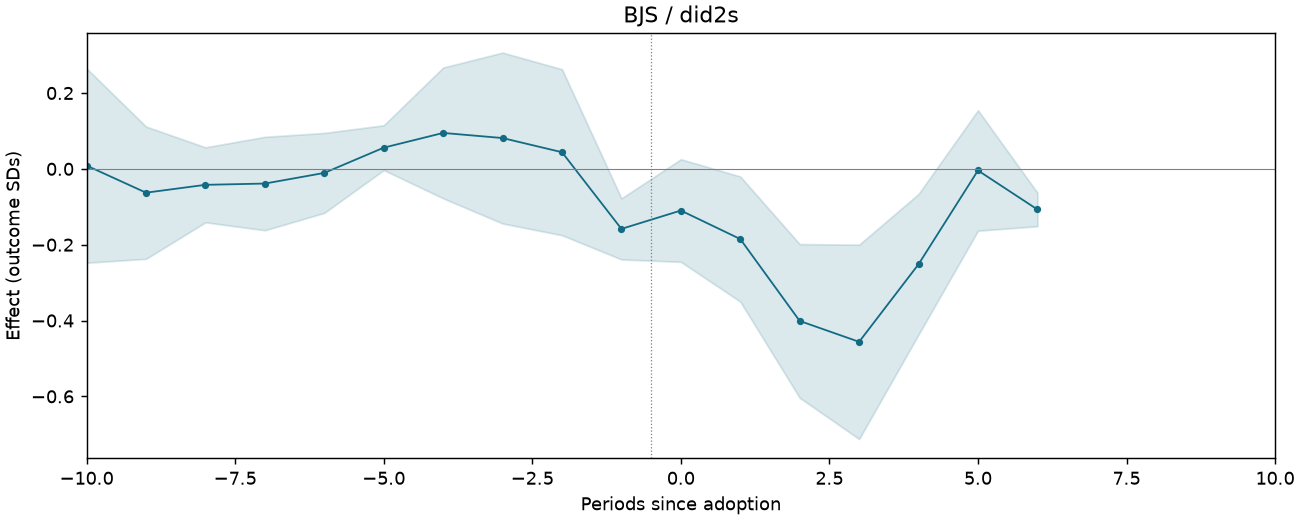
| BJS / did2s | -0.198 | 0.055 | [-0.306, -0.090] | Treated cells |
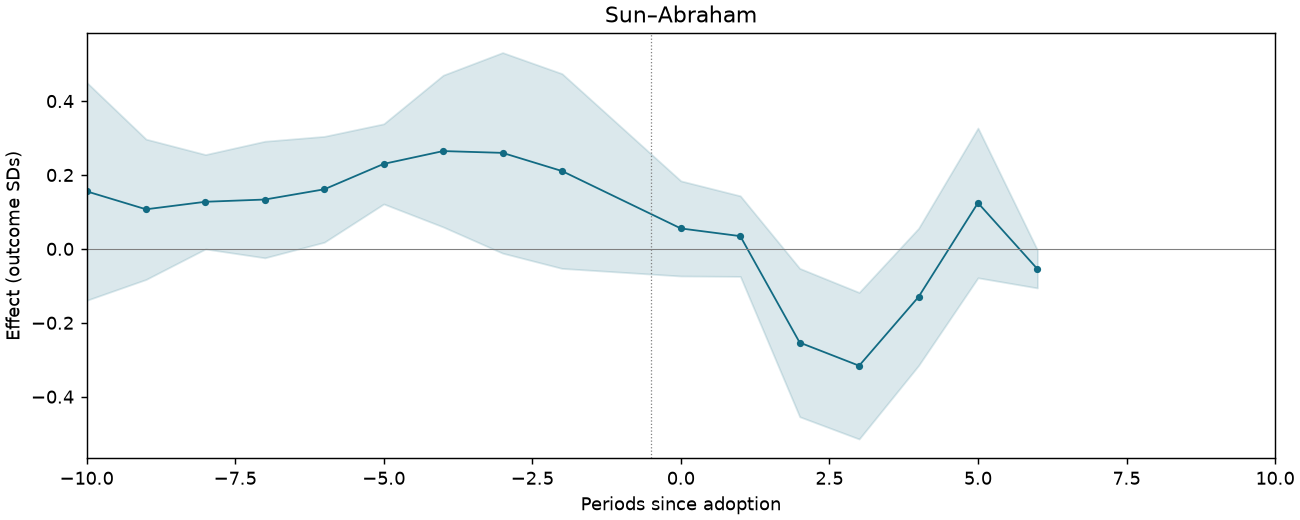
| Sun–Abraham | -0.037 | 0.052 | [-0.139, 0.065] | Treated cells |
| CS-DID (equal event-time) | -0.063 | 0.066 | [-0.193, 0.067] | Equal post-event times |
| CS-DID (treated cells) | -0.029 | 0.065 | [-0.156, 0.099] | Treated cells |
| SDID | -0.058 | — | — | Treated cells |
| Matrix completion | -0.143 | — | — | Treated cells |
| Horizontal ridge | -0.019 | — | — | Treated cells |
Event studies
Periods −10 to +10; pointwise 95% intervals where available.
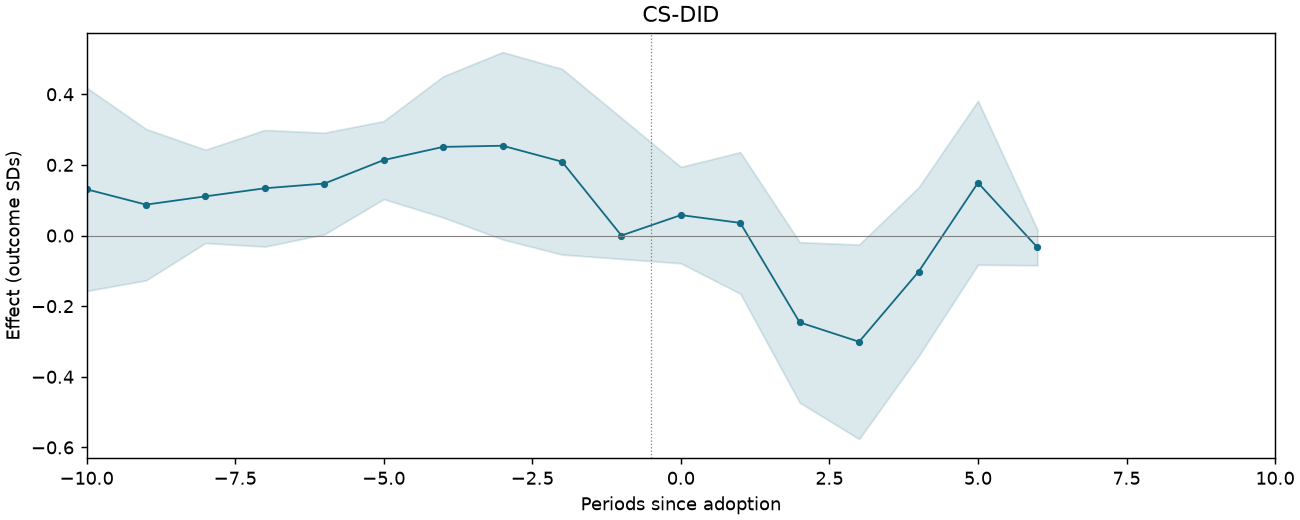
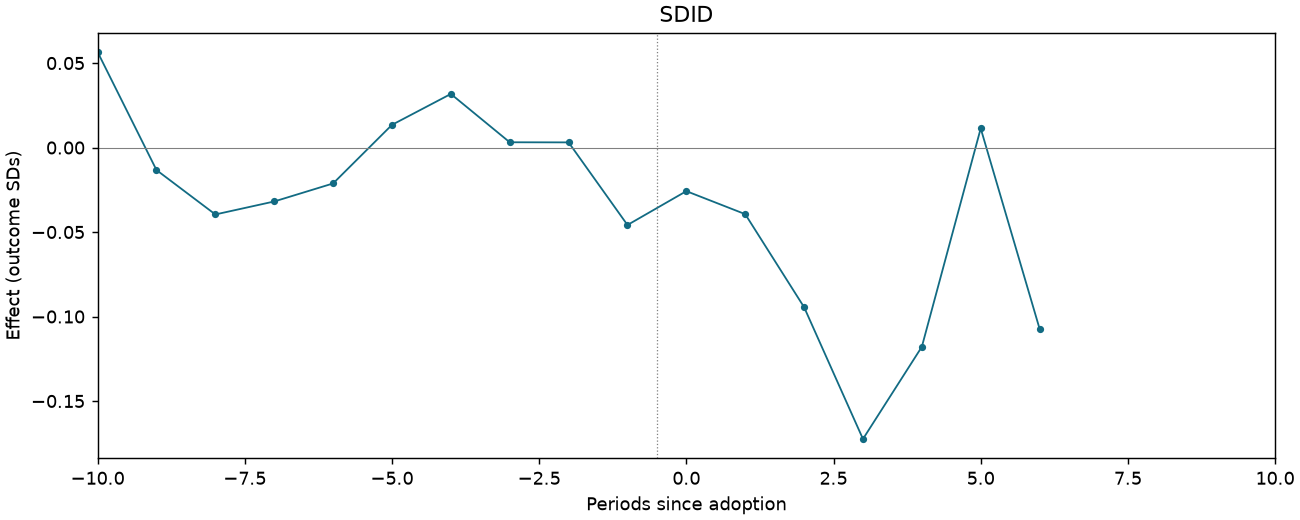
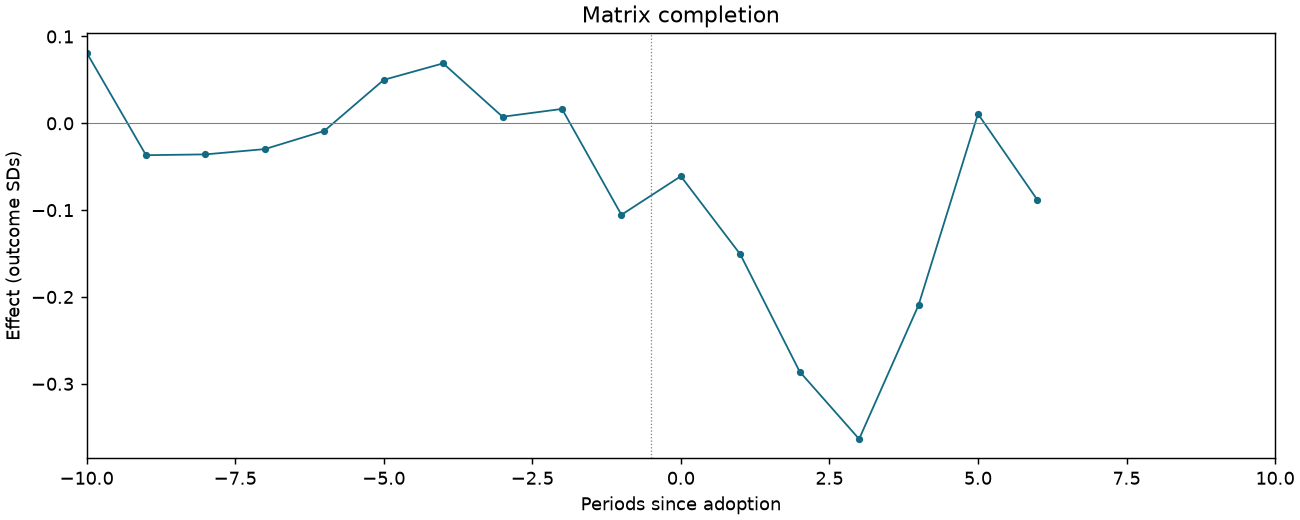
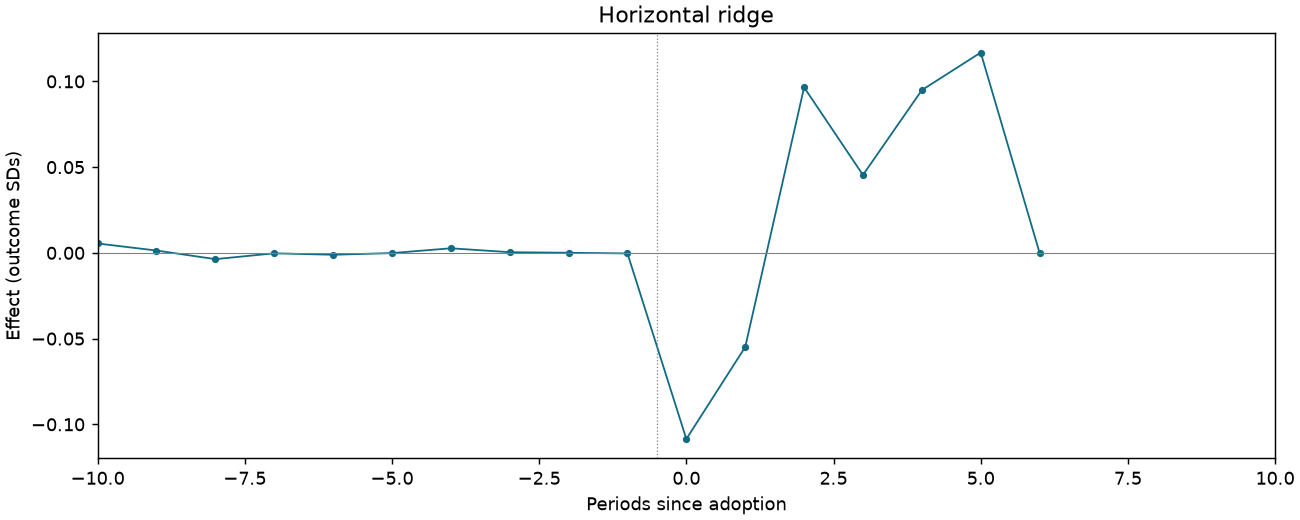
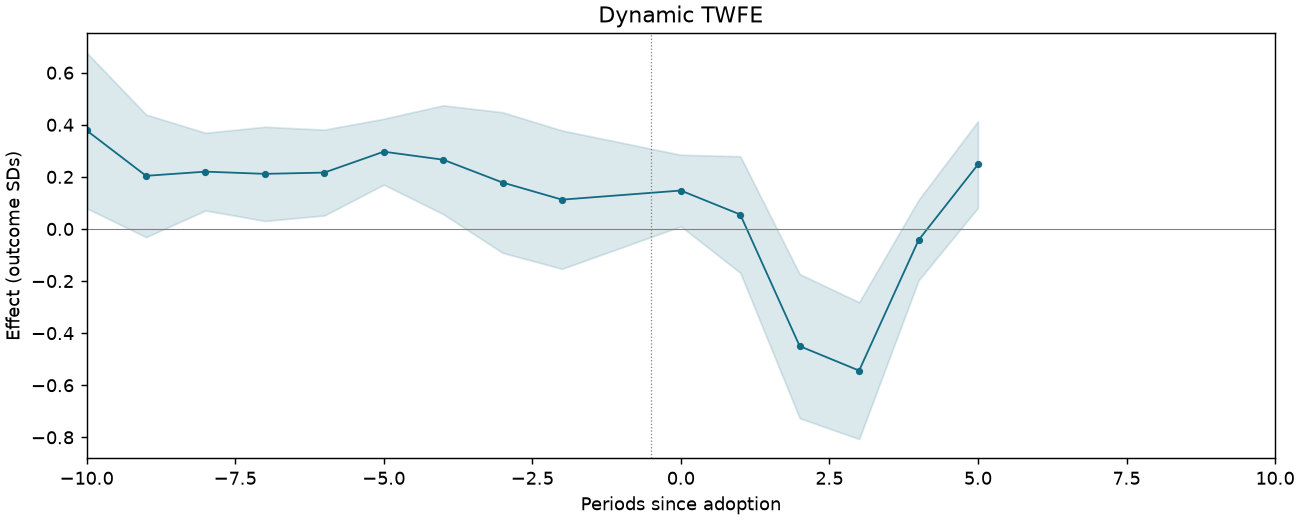
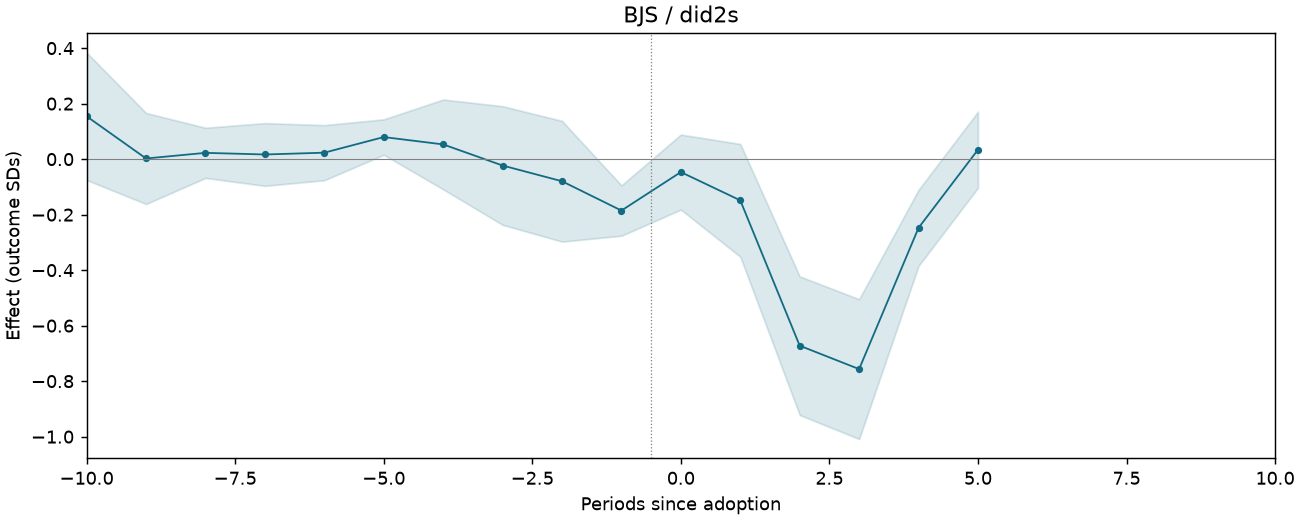
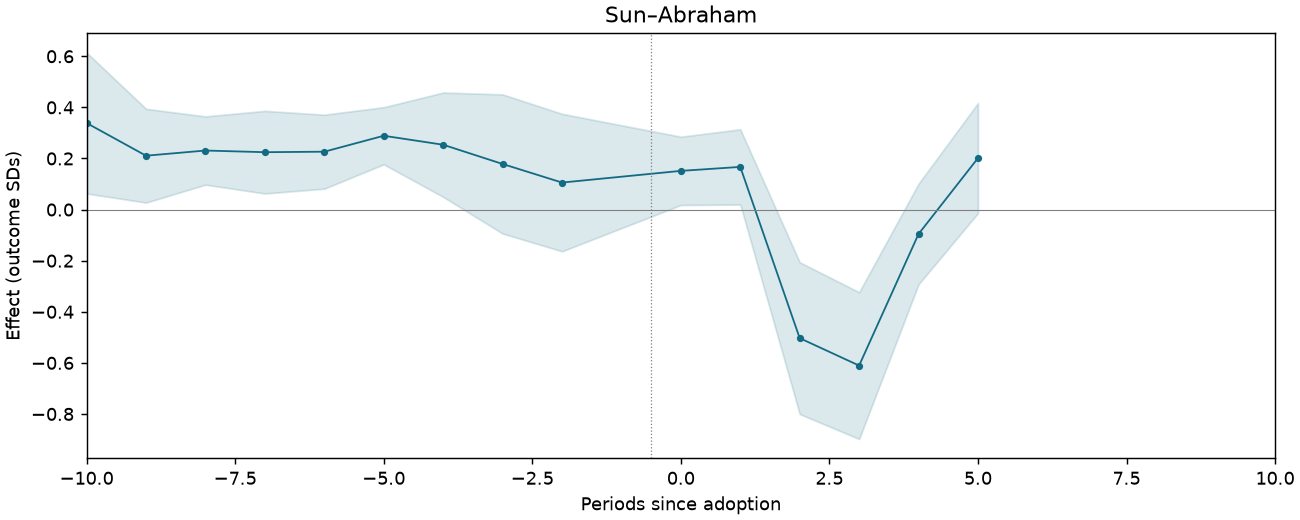
Oil theft: count of sabotage spills within 15 km of the field
2,096 observations · 193 units · 193 clusters · 30 treated / 163 control units.
Estimate comparison
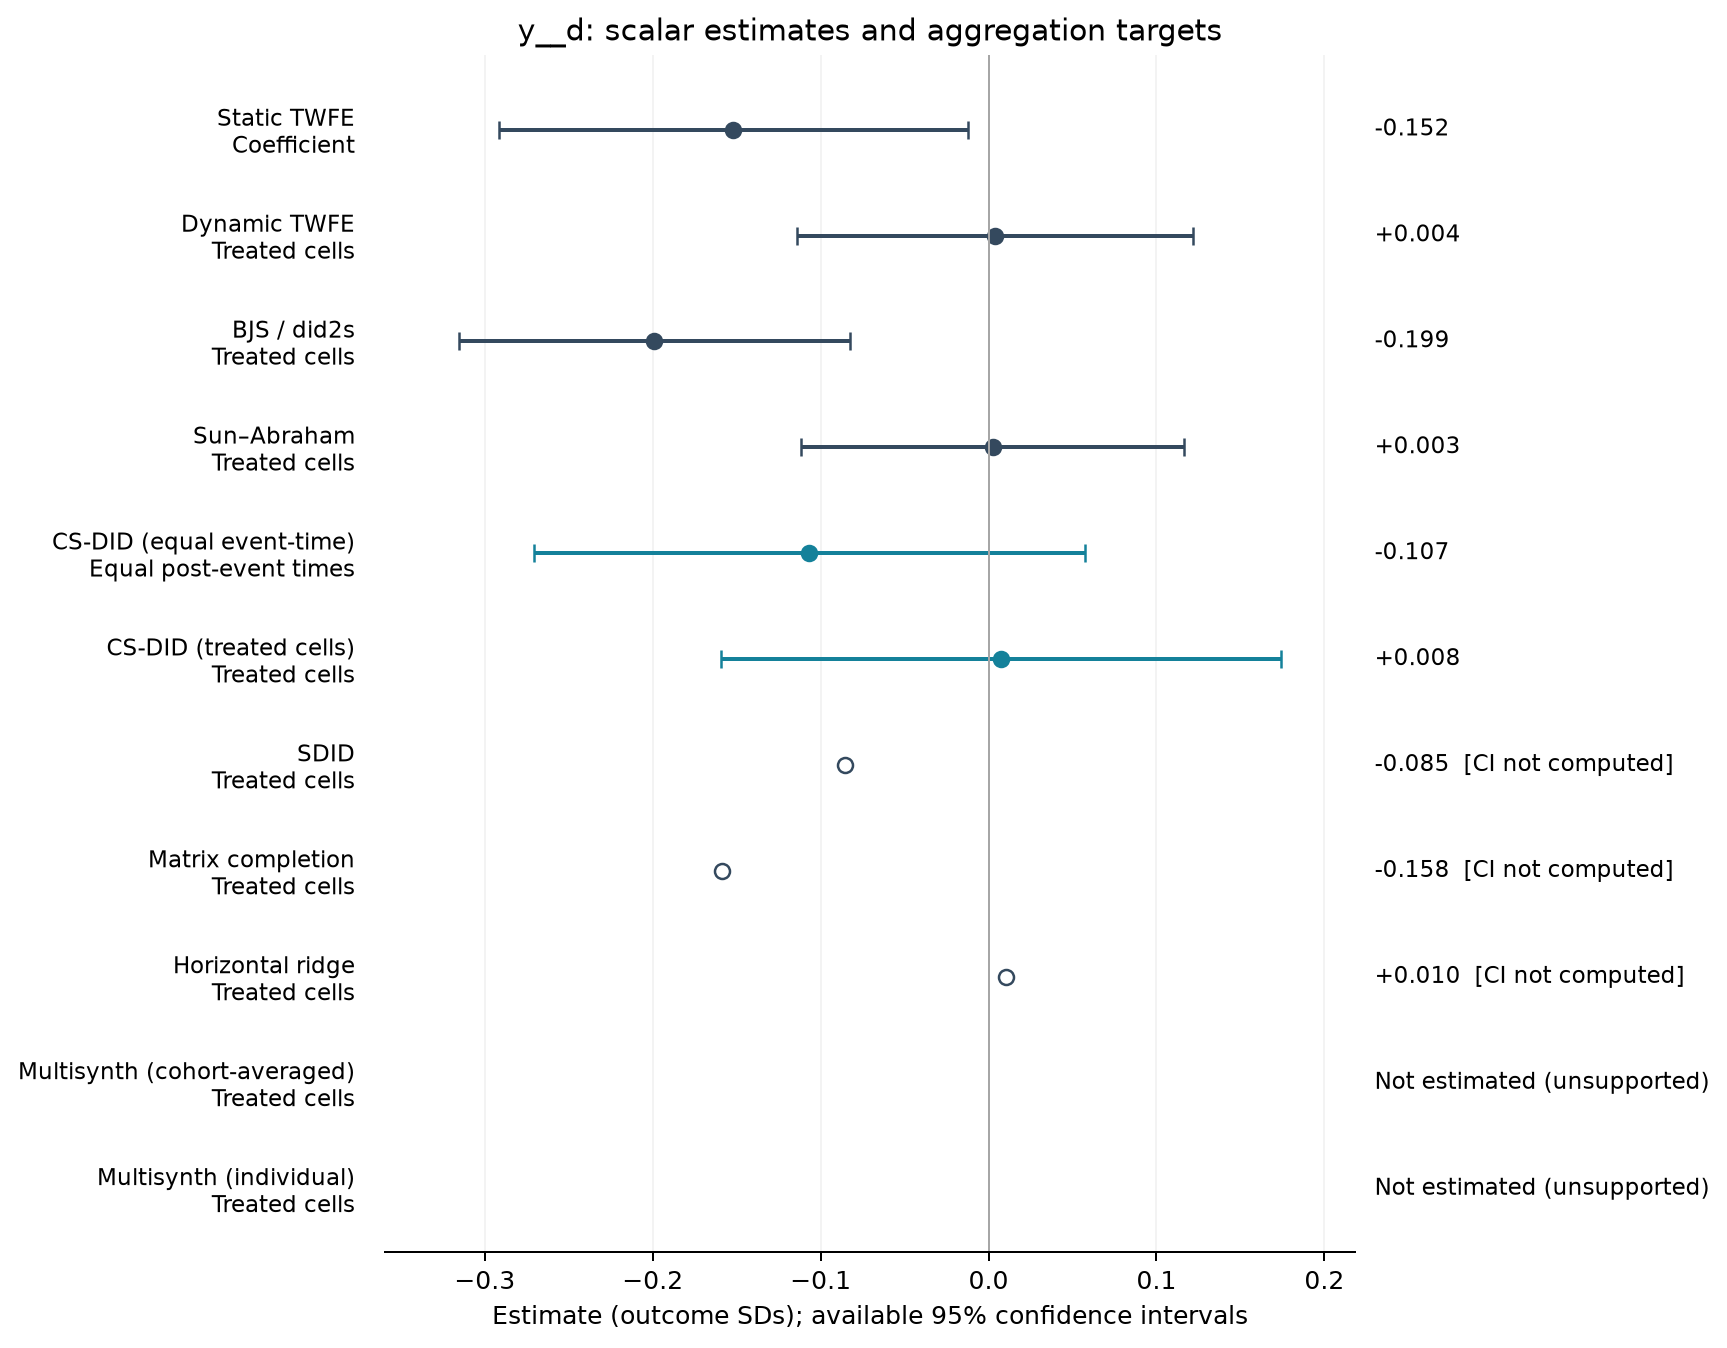
| Estimator | Estimate (SDs) | SE | 95% CI | Averaging |
|---|---|---|---|---|
| Static TWFE | -0.152 | 0.071 | [-0.292, -0.012] | Coefficient |
| Dynamic TWFE | 0.004 | 0.060 | [-0.114, 0.122] | Treated cells |
| BJS / did2s | -0.199 | 0.059 | [-0.315, -0.083] | Treated cells |
| Sun–Abraham | 0.003 | 0.058 | [-0.111, 0.117] | Treated cells |
| CS-DID (equal event-time) | -0.107 | 0.084 | [-0.271, 0.057] | Equal post-event times |
| CS-DID (treated cells) | 0.008 | 0.085 | [-0.159, 0.174] | Treated cells |
| SDID | -0.085 | — | — | Treated cells |
| Matrix completion | -0.158 | — | — | Treated cells |
| Horizontal ridge | 0.010 | — | — | Treated cells |
Event studies
Periods −10 to +10; pointwise 95% intervals where available.
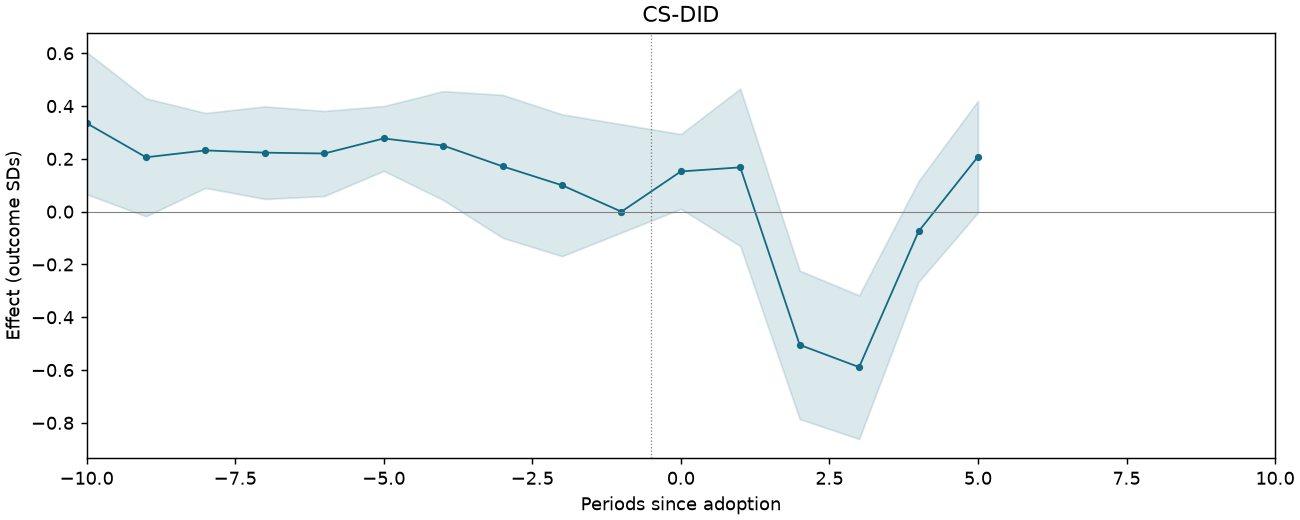
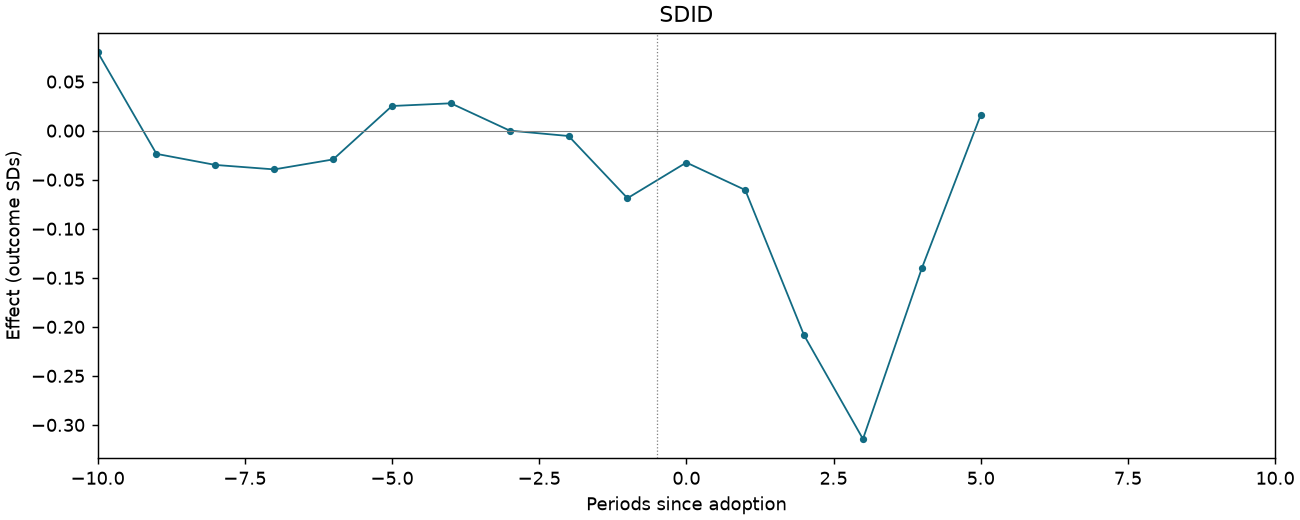
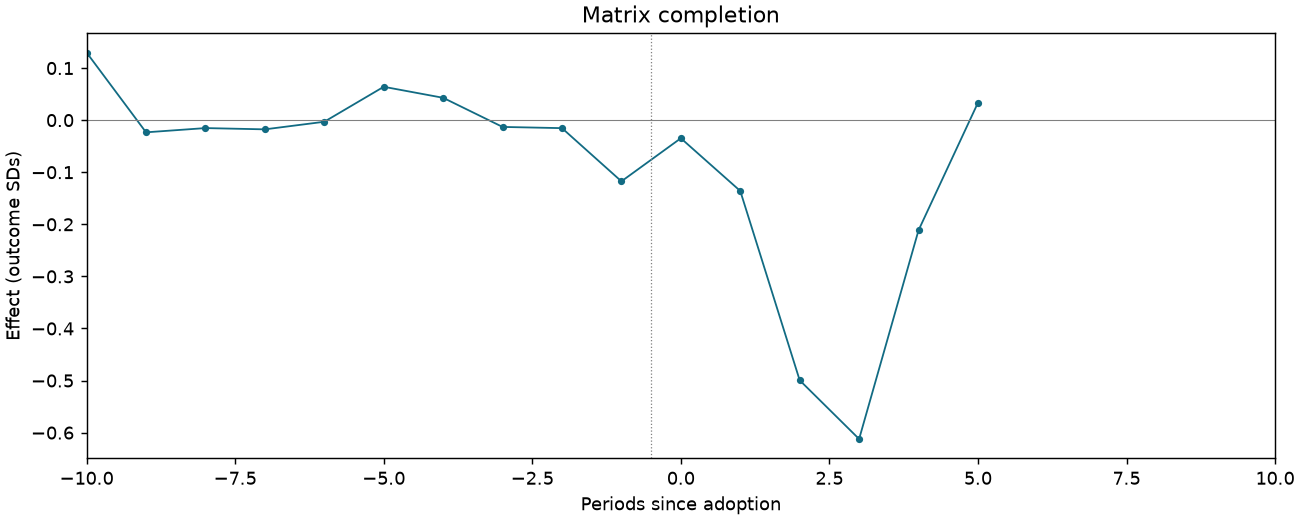
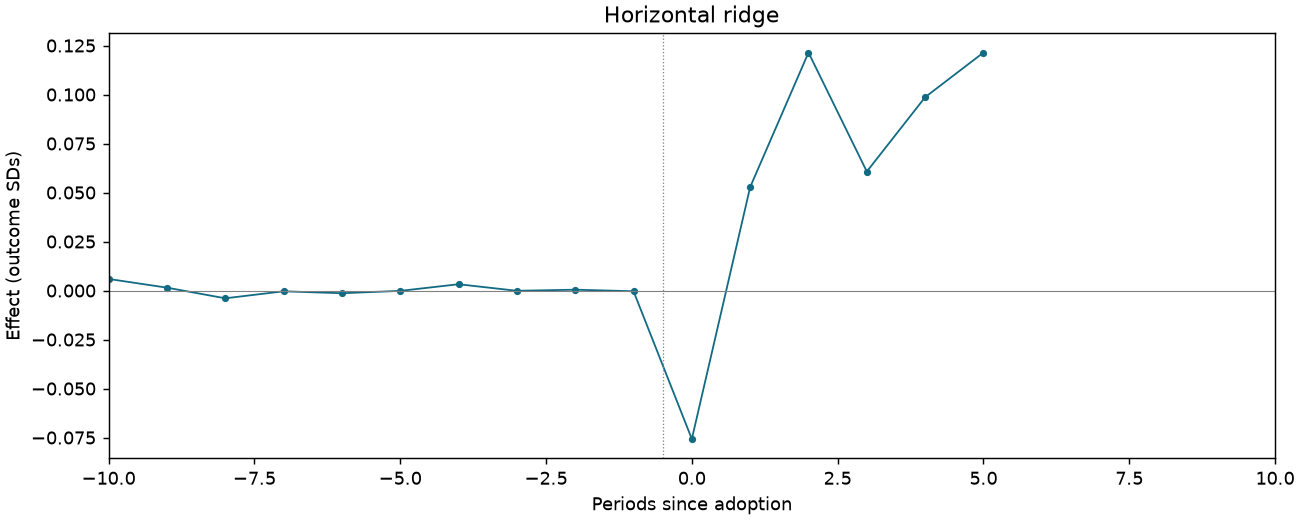
Oil theft: count of sabotage spills within 15 km of the field
3,167 observations · 303 units · 303 clusters · 52 treated / 251 control units.
Estimate comparison
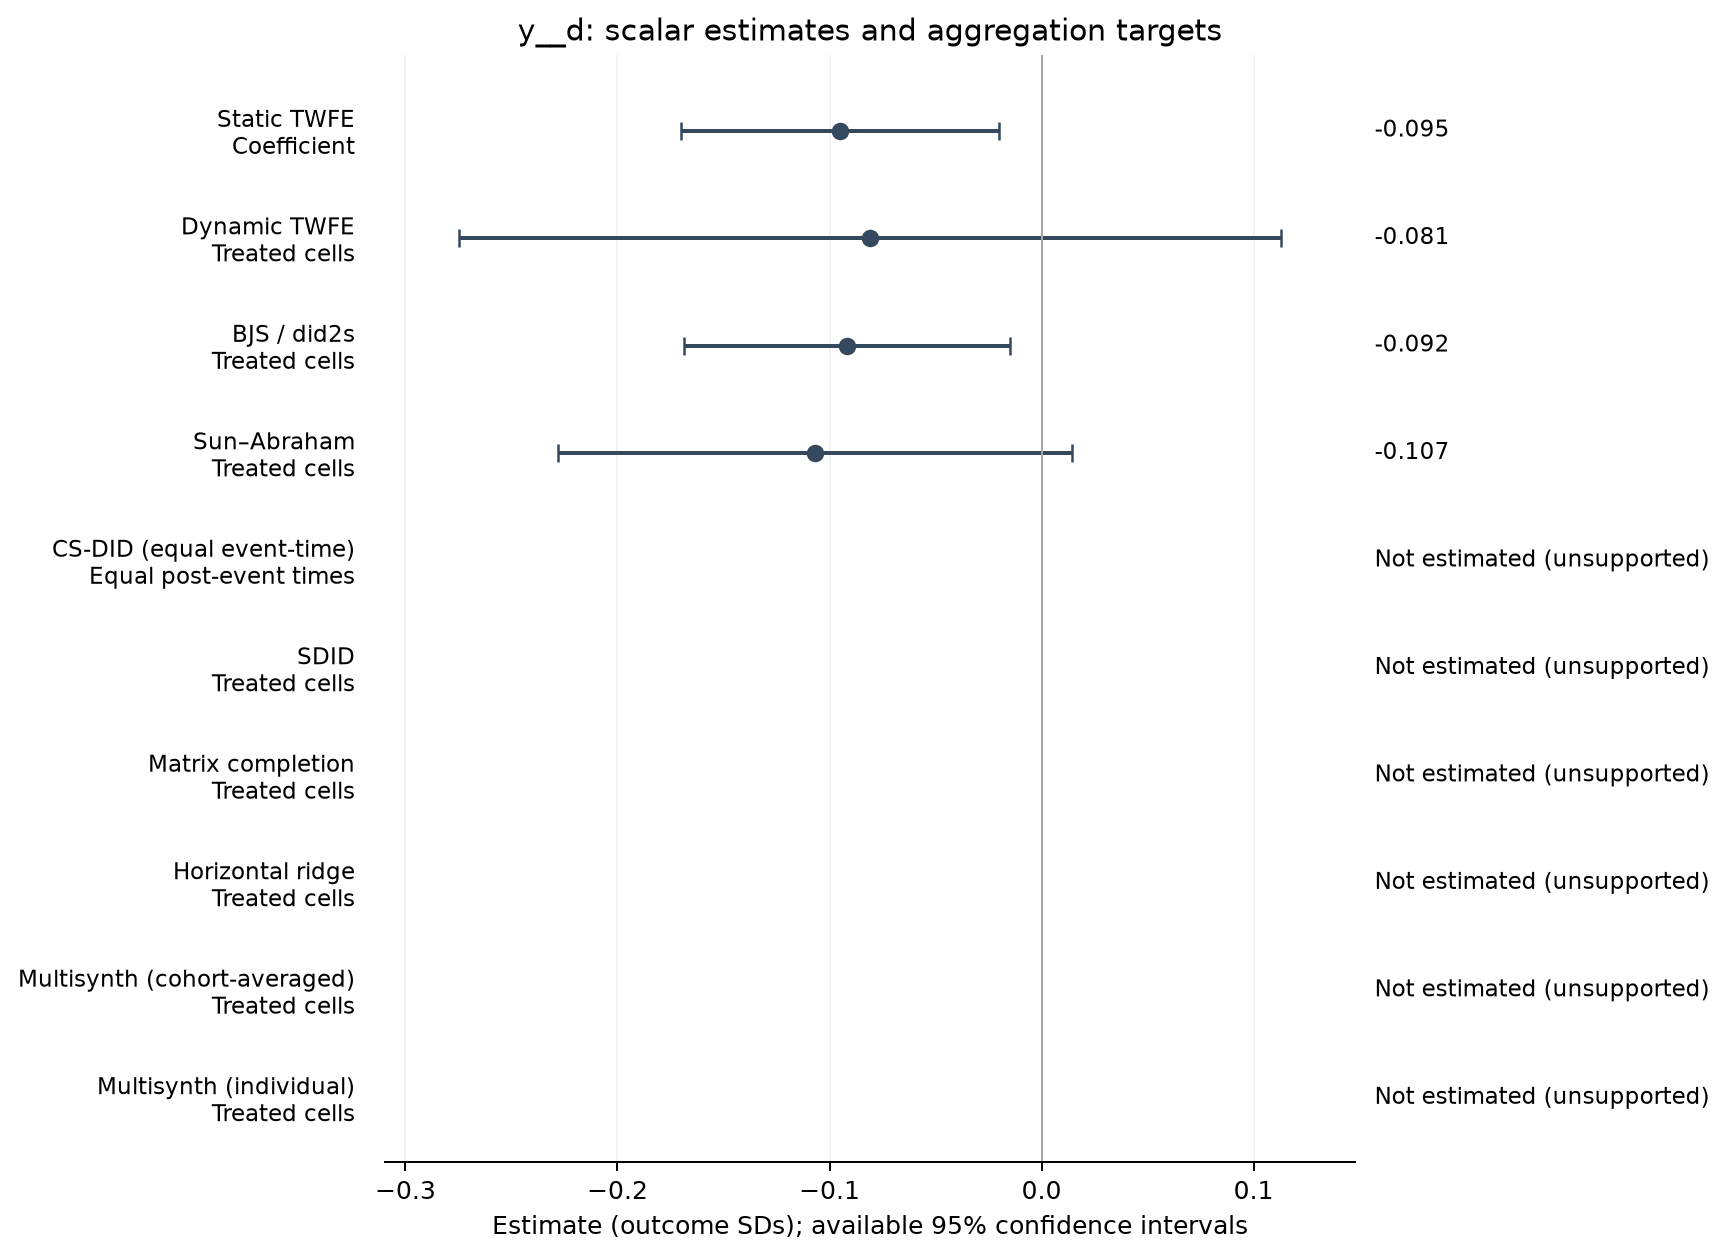
| Estimator | Estimate (SDs) | SE | 95% CI | Averaging |
|---|---|---|---|---|
| Static TWFE | -0.095 | 0.038 | [-0.170, -0.020] | Coefficient |
| Dynamic TWFE | -0.081 | 0.099 | [-0.275, 0.113] | Treated cells |
| BJS / did2s | -0.092 | 0.039 | [-0.169, -0.015] | Treated cells |
| Sun–Abraham | -0.107 | 0.062 | [-0.228, 0.014] | Treated cells |
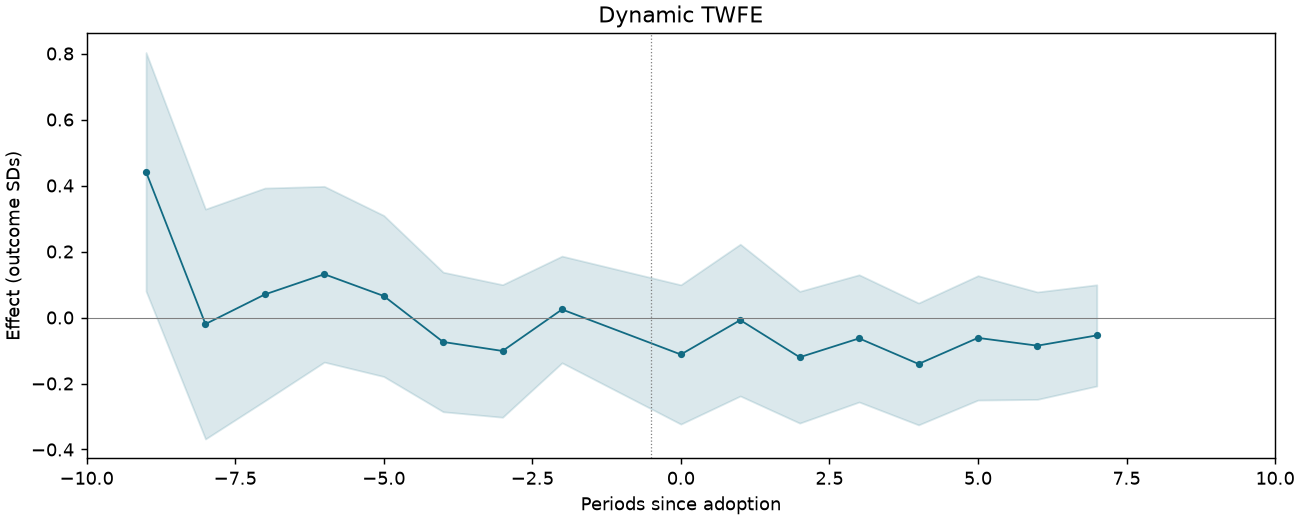
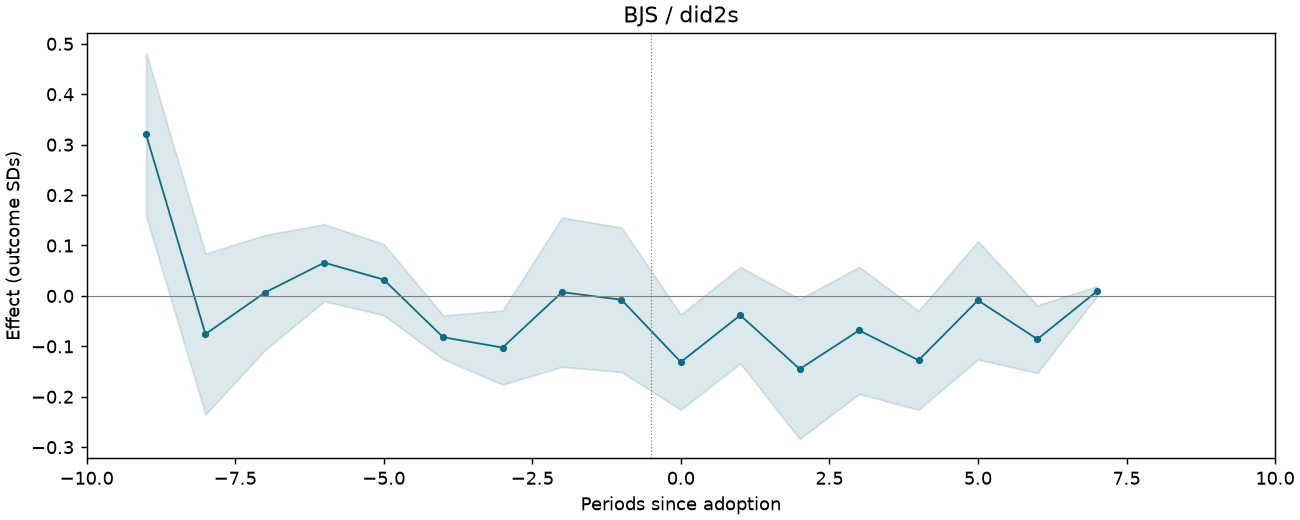
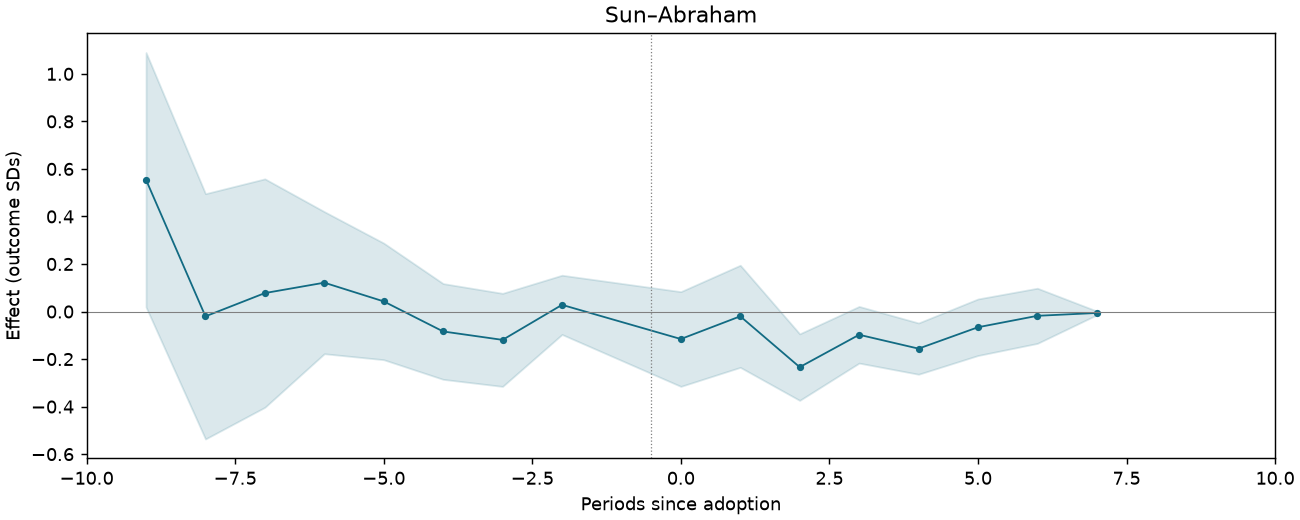
Event studies
Periods −10 to +10; pointwise 95% intervals where available.
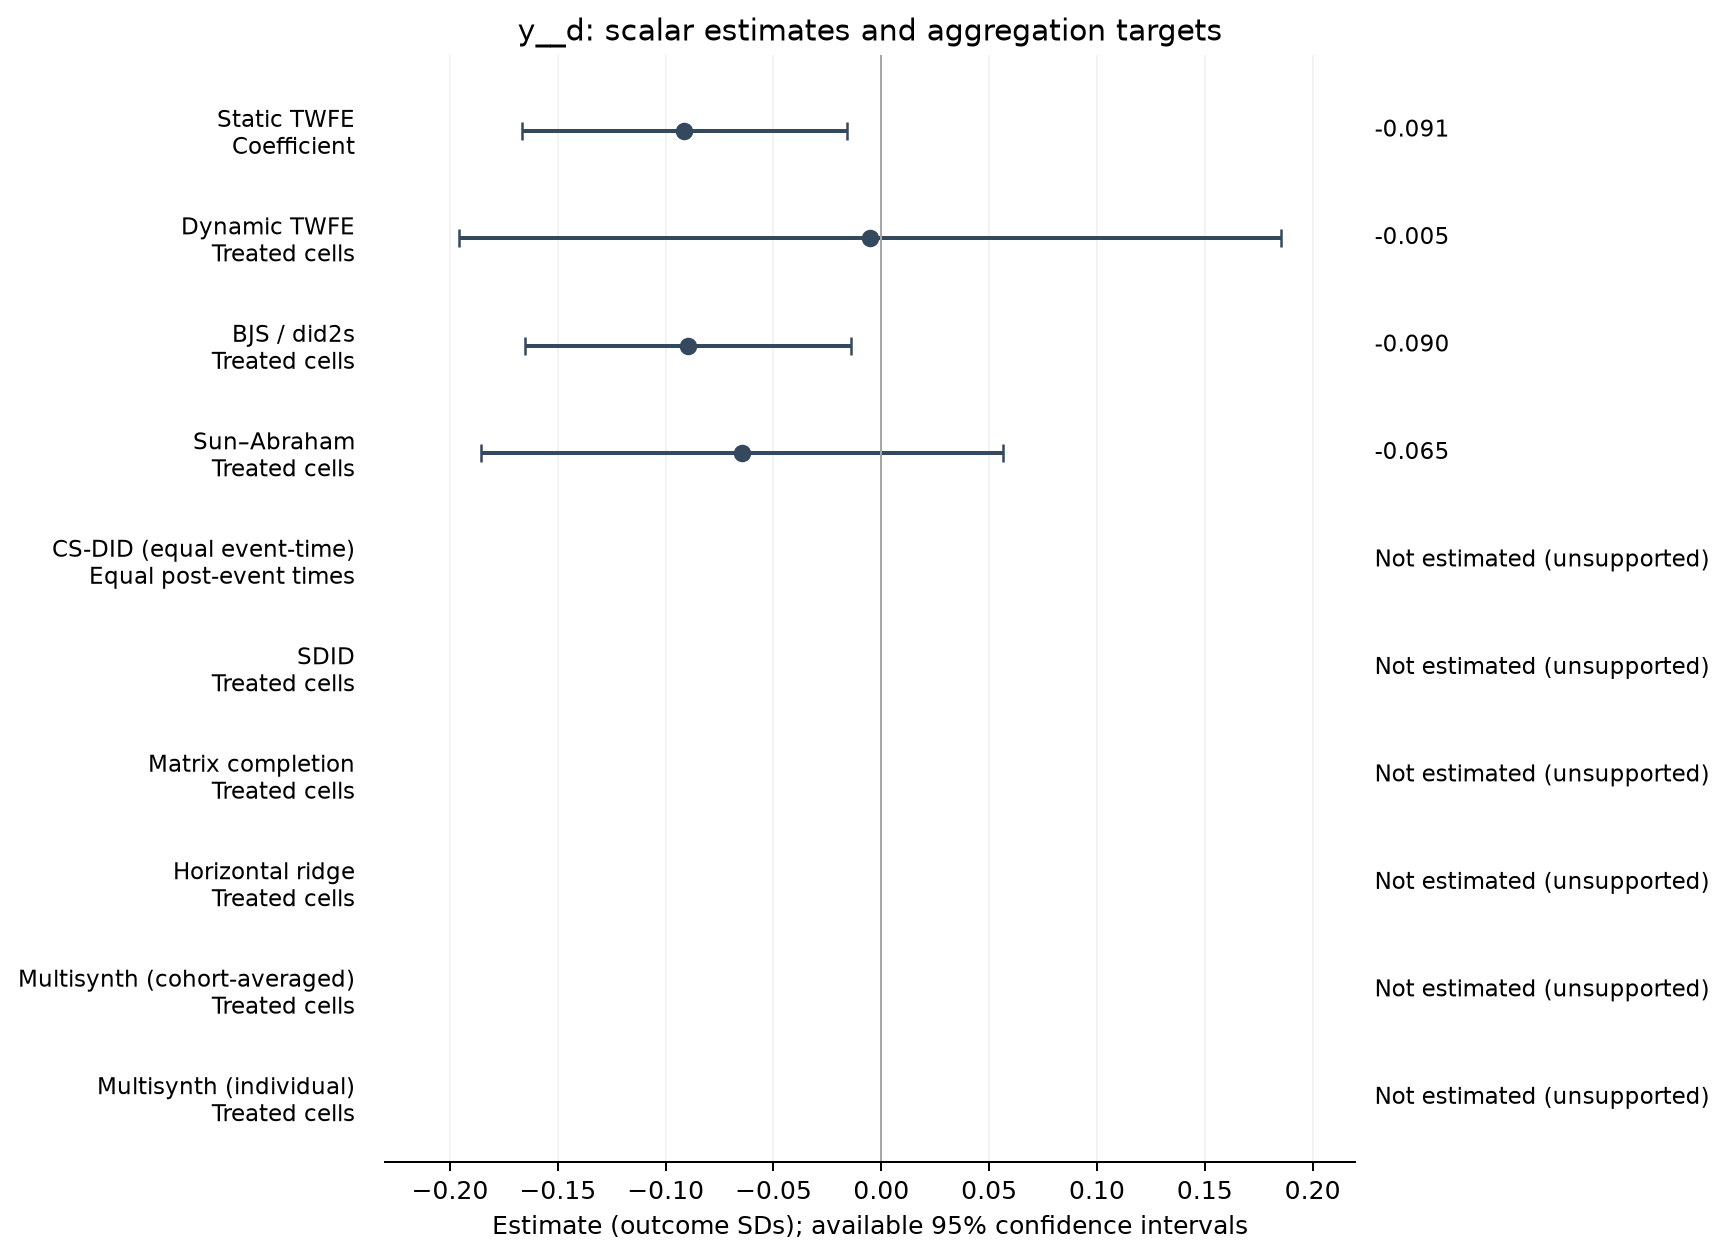
Oil theft: count of sabotage spills within 15 km of the field
2,285 observations · 216 units · 216 clusters · 49 treated / 167 control units.
Estimate comparison
| Estimator | Estimate (SDs) | SE | 95% CI | Averaging |
|---|---|---|---|---|
| Static TWFE | -0.091 | 0.038 | [-0.167, -0.016] | Coefficient |
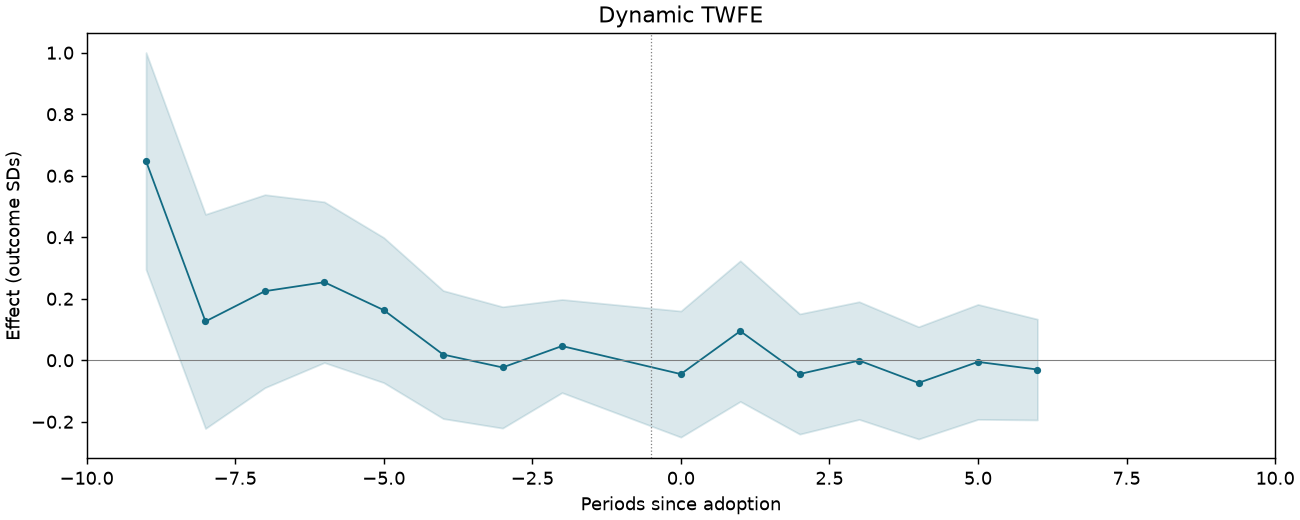
| Dynamic TWFE | -0.005 | 0.097 | [-0.196, 0.185] | Treated cells |
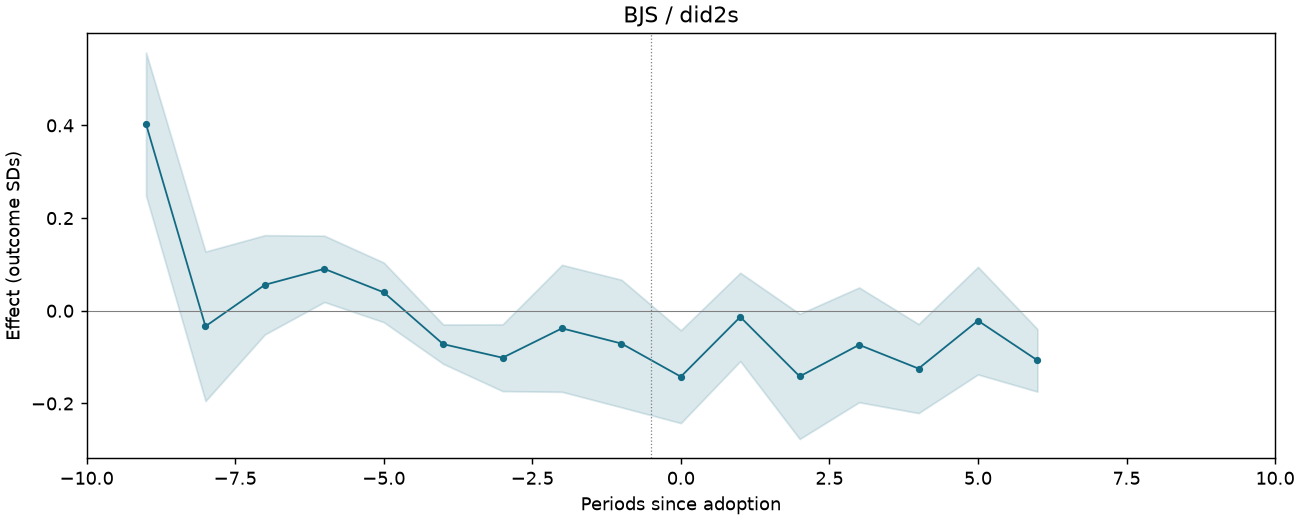
| BJS / did2s | -0.090 | 0.038 | [-0.165, -0.014] | Treated cells |
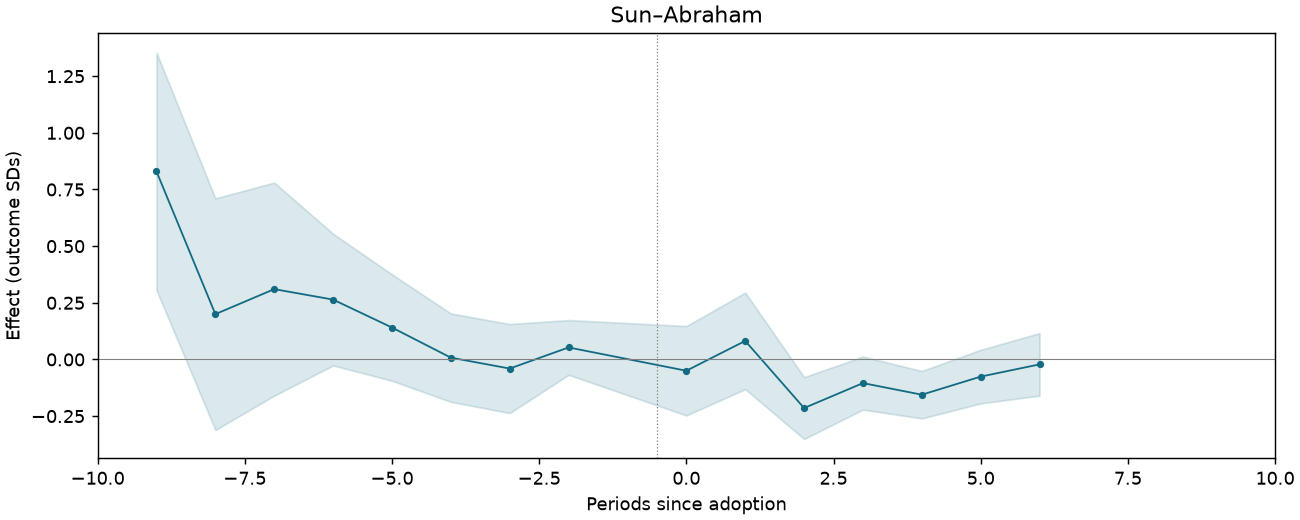
| Sun–Abraham | -0.065 | 0.061 | [-0.186, 0.056] | Treated cells |
Event studies
Periods −10 to +10; pointwise 95% intervals where available.
Oil theft: count of sabotage spills within 15 km of the field
The archive supplies frozen estimates but not this specification’s input sample or required outcome/controls.
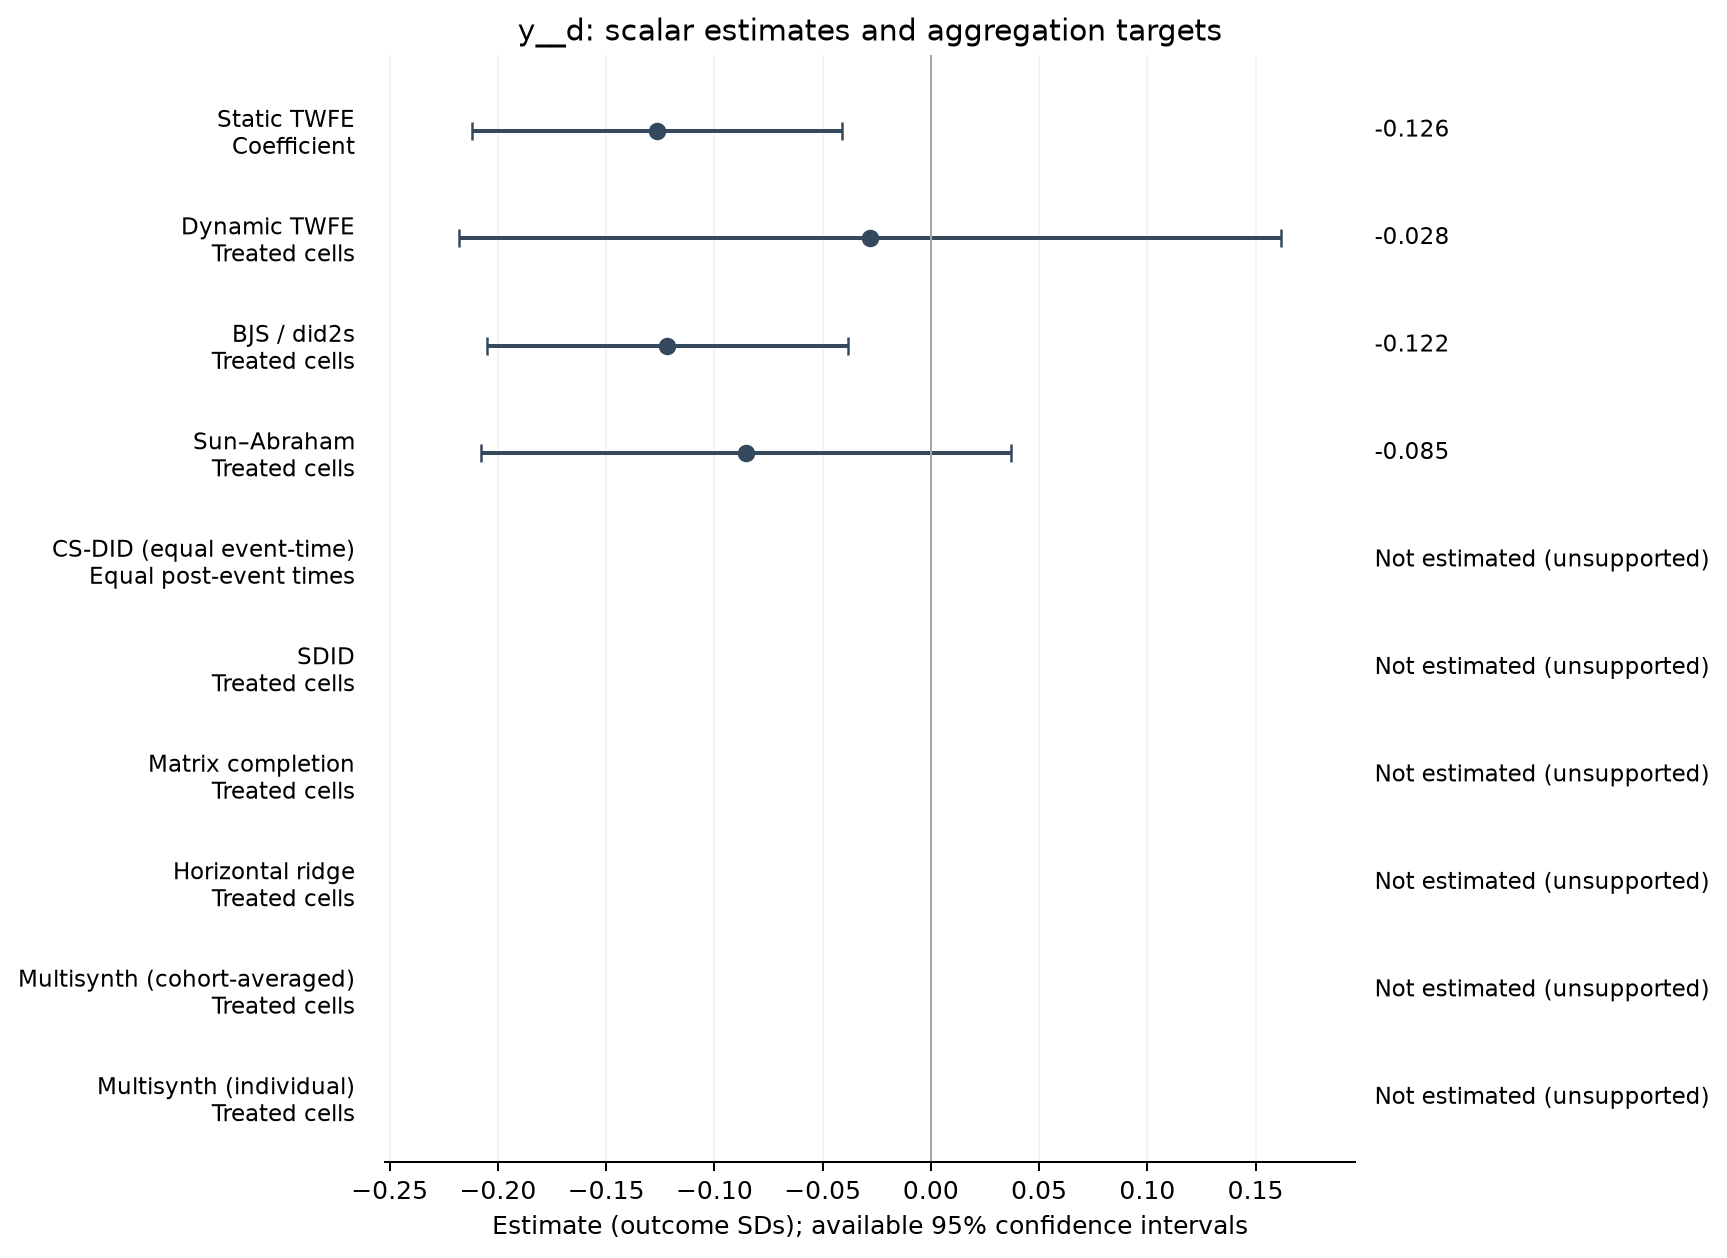
Oil theft: count of sabotage spills within 15 km of the field
2,085 observations · 192 units · 192 clusters · 51 treated / 141 control units.
Estimate comparison
| Estimator | Estimate (SDs) | SE | 95% CI | Averaging |
|---|---|---|---|---|
| Static TWFE | -0.126 | 0.043 | [-0.212, -0.041] | Coefficient |
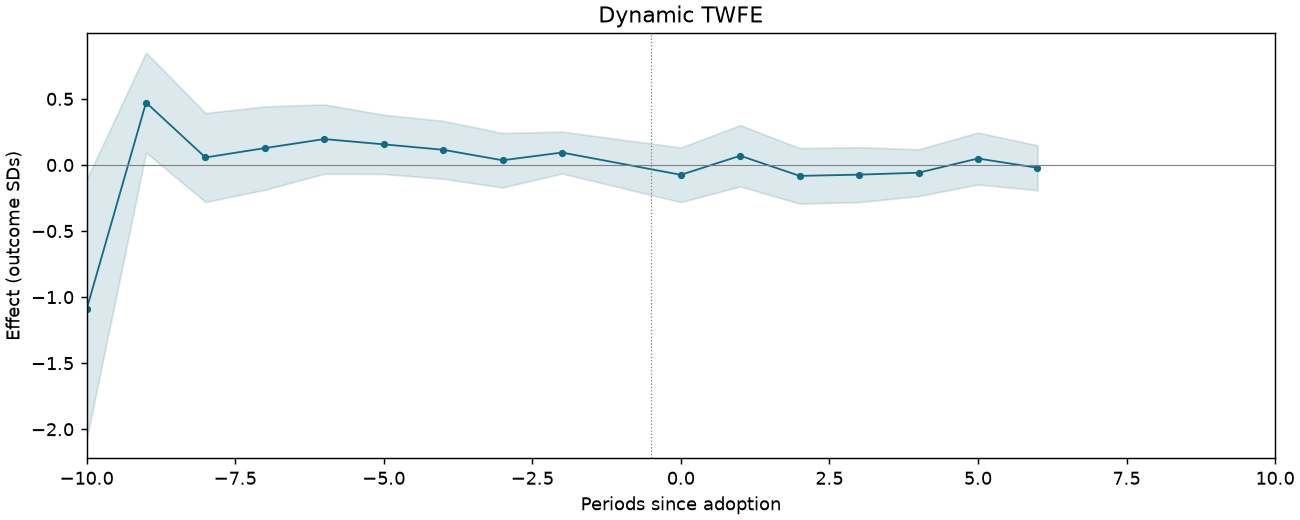
| Dynamic TWFE | -0.028 | 0.096 | [-0.218, 0.162] | Treated cells |
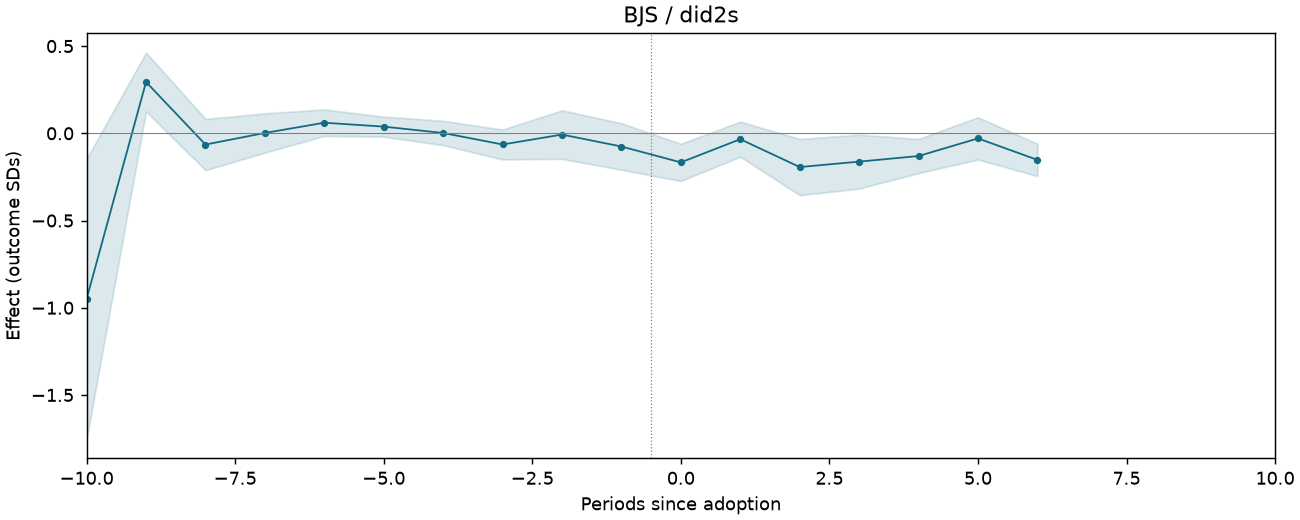
| BJS / did2s | -0.122 | 0.042 | [-0.205, -0.038] | Treated cells |
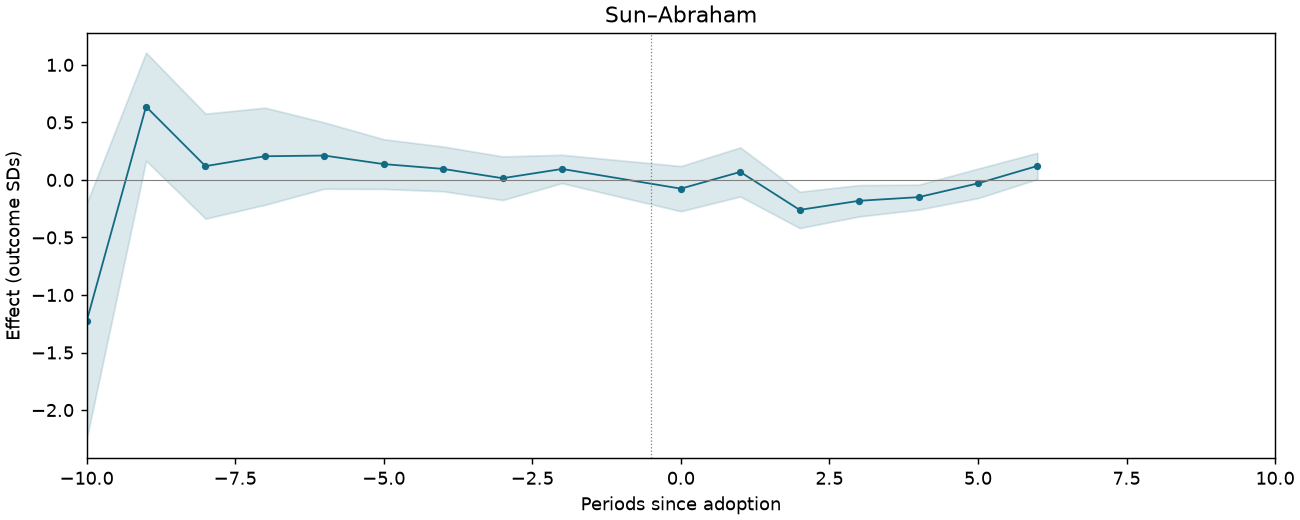
| Sun–Abraham | -0.085 | 0.062 | [-0.208, 0.037] | Treated cells |
Event studies
Periods −10 to +10; pointwise 95% intervals where available.
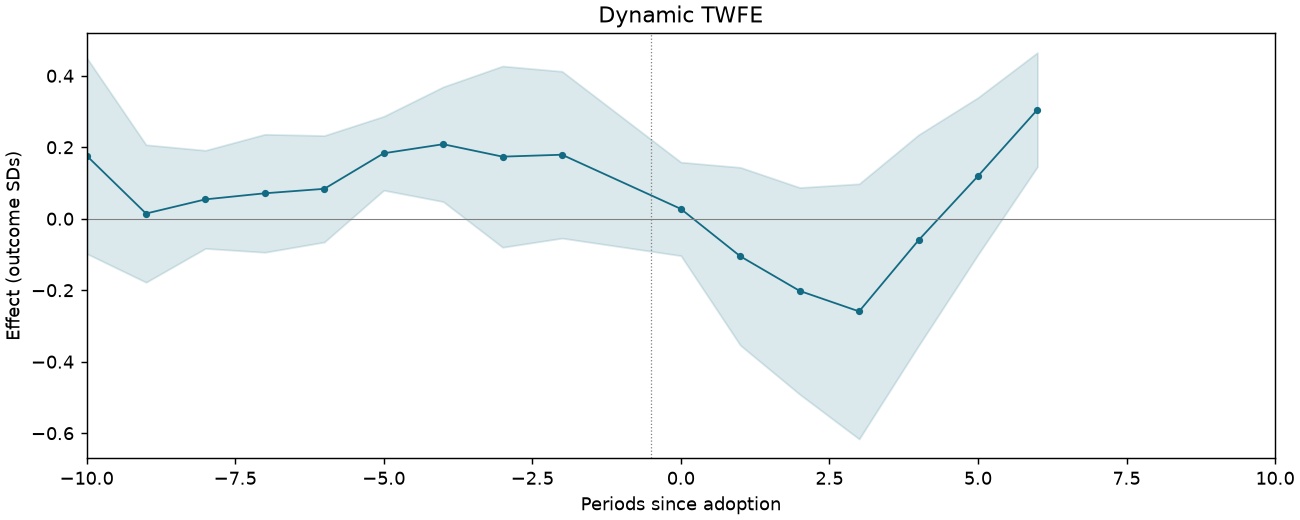
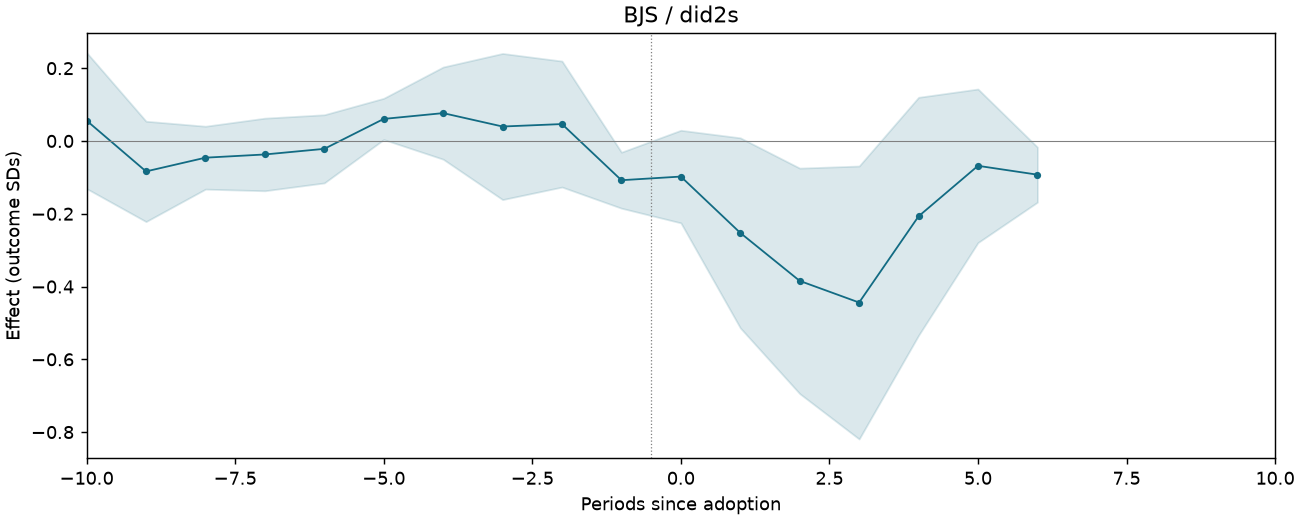
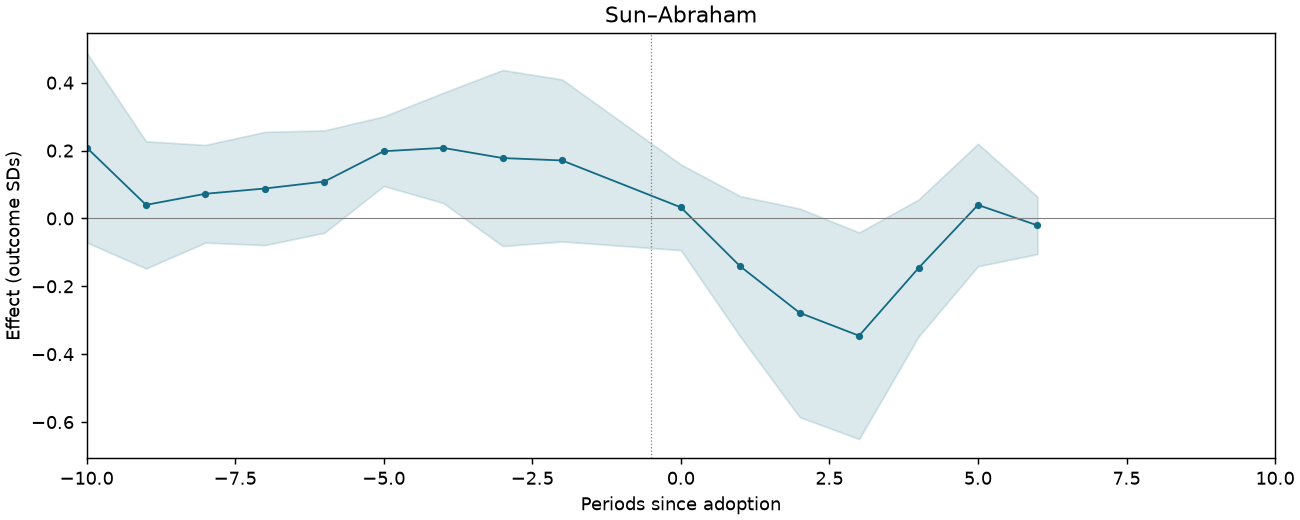
Oil theft: count of sabotage spills within 15 km of the field
2,895 observations · 271 units · 271 clusters · 32 treated / 239 control units.
Estimate comparison
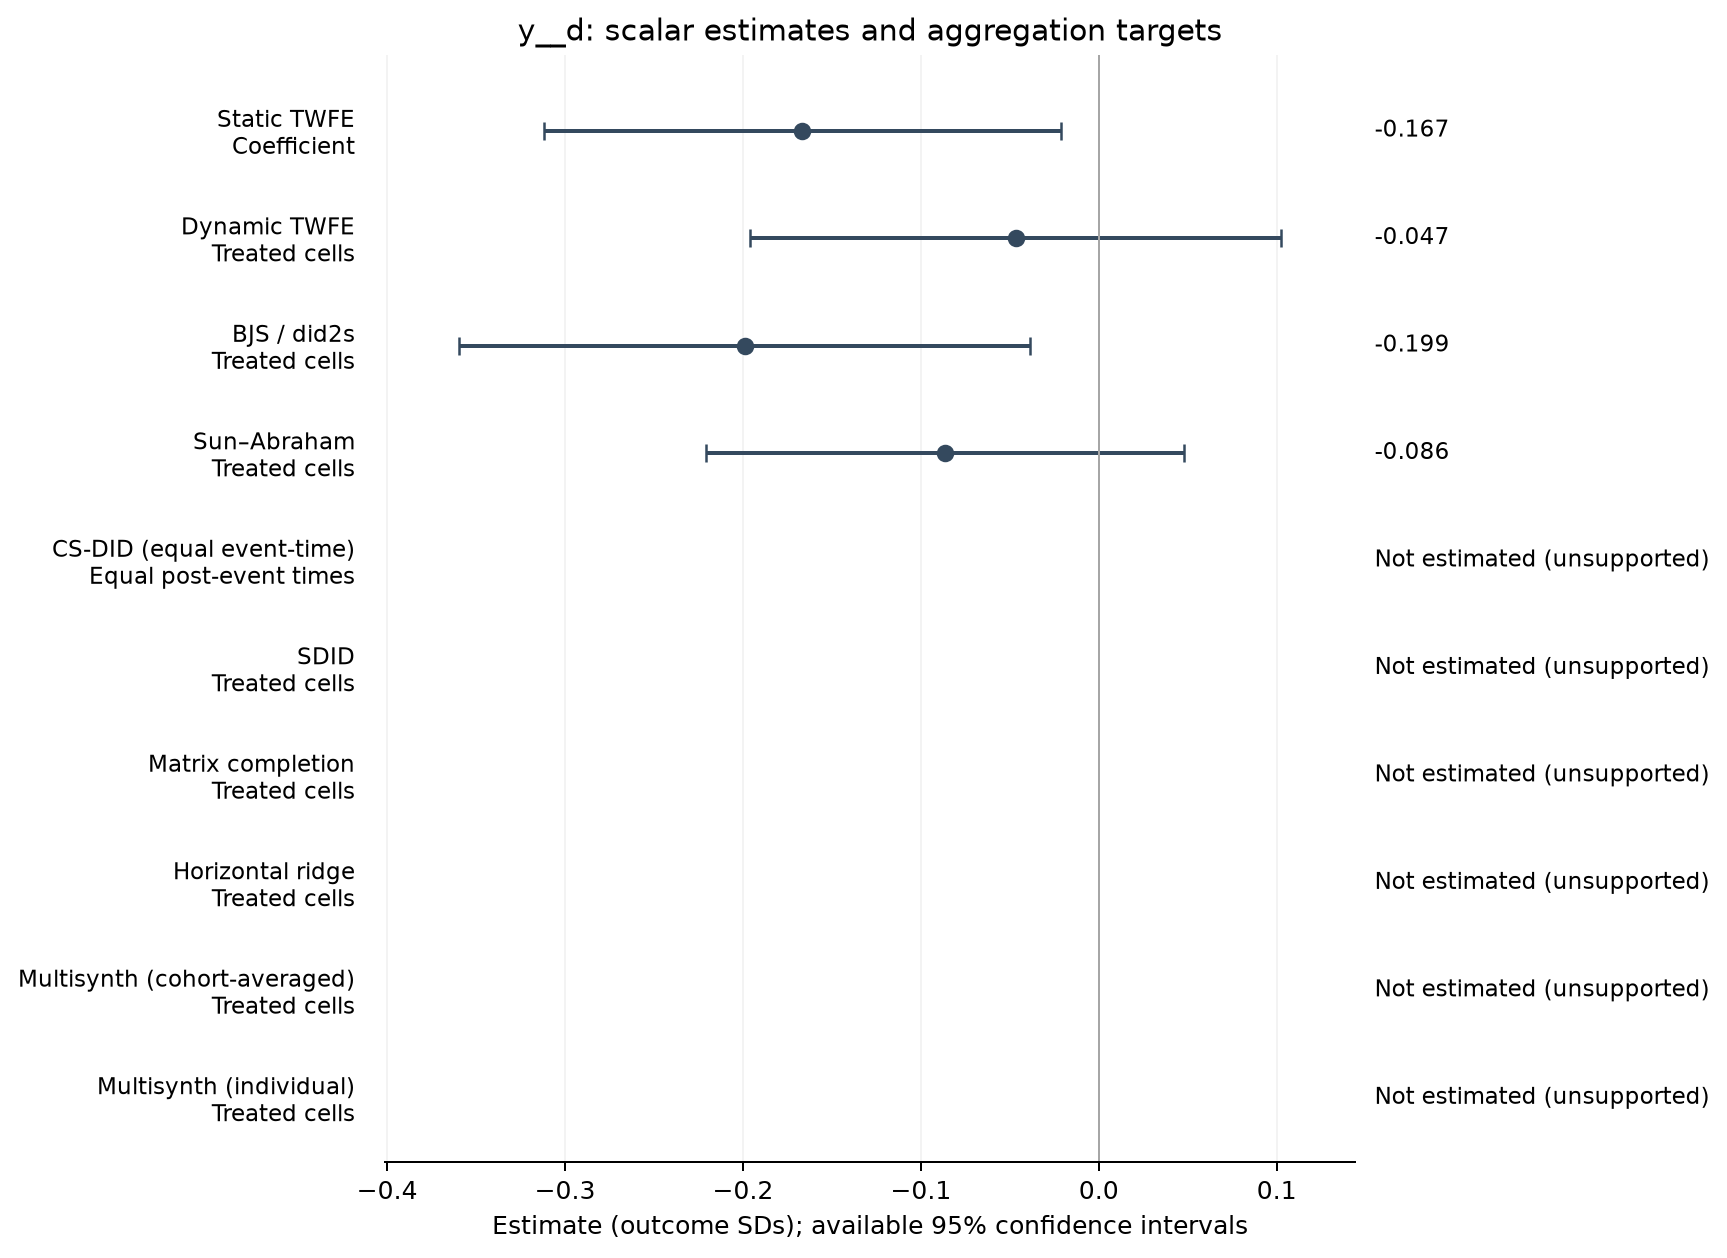
| Estimator | Estimate (SDs) | SE | 95% CI | Averaging |
|---|---|---|---|---|
| Static TWFE | -0.167 | 0.074 | [-0.312, -0.021] | Coefficient |
| Dynamic TWFE | -0.047 | 0.076 | [-0.196, 0.103] | Treated cells |
| BJS / did2s | -0.199 | 0.082 | [-0.360, -0.039] | Treated cells |
| Sun–Abraham | -0.086 | 0.068 | [-0.221, 0.048] | Treated cells |
Event studies
Periods −10 to +10; pointwise 95% intervals where available.
Oil theft: count of sabotage spills within 15 km of the field
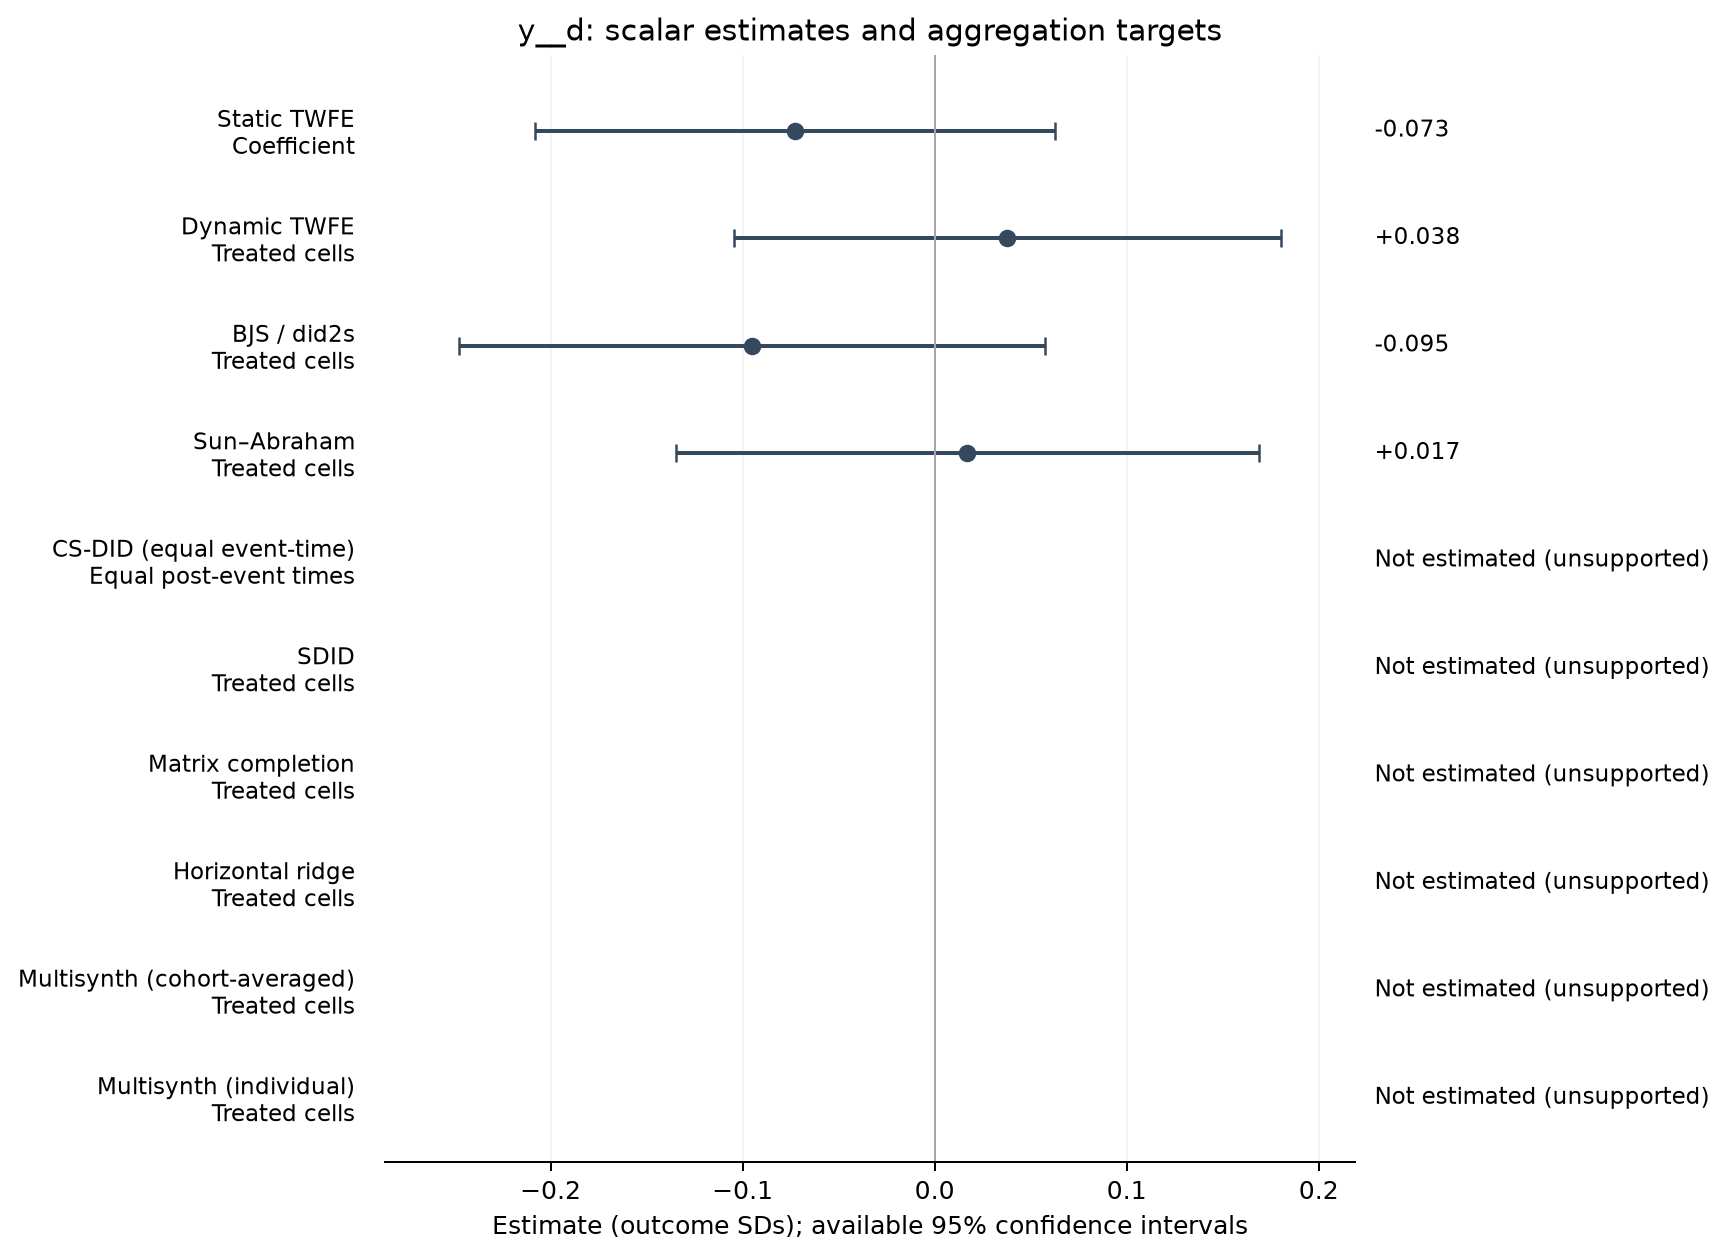
2,085 observations · 192 units · 192 clusters · 29 treated / 163 control units.
Estimate comparison
| Estimator | Estimate (SDs) | SE | 95% CI | Averaging |
|---|---|---|---|---|
| Static TWFE | -0.073 | 0.069 | [-0.208, 0.063] | Coefficient |
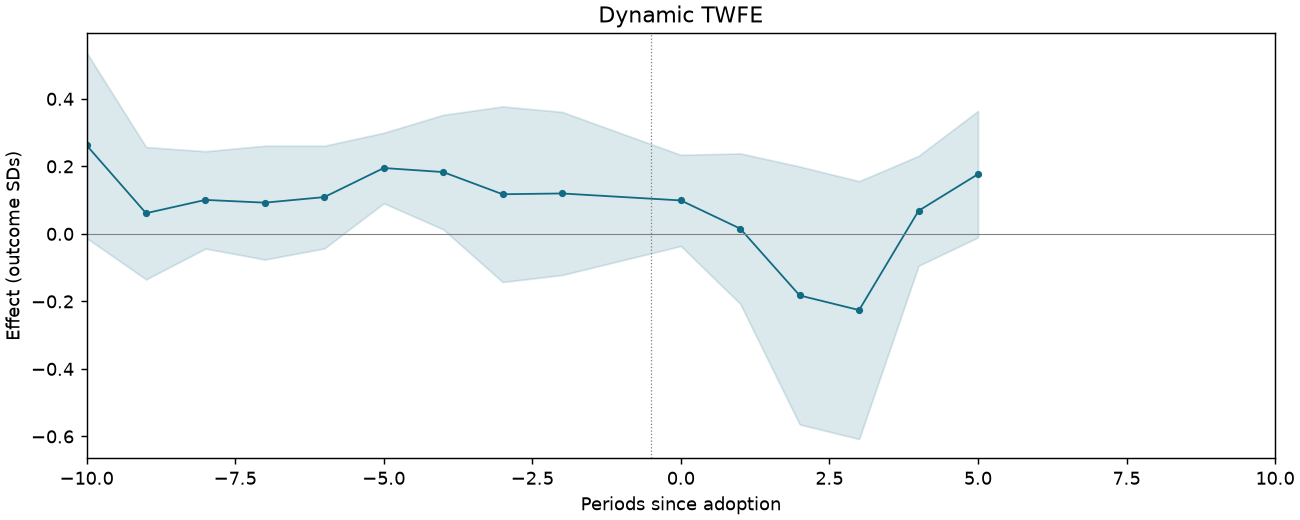
| Dynamic TWFE | 0.038 | 0.072 | [-0.105, 0.180] | Treated cells |
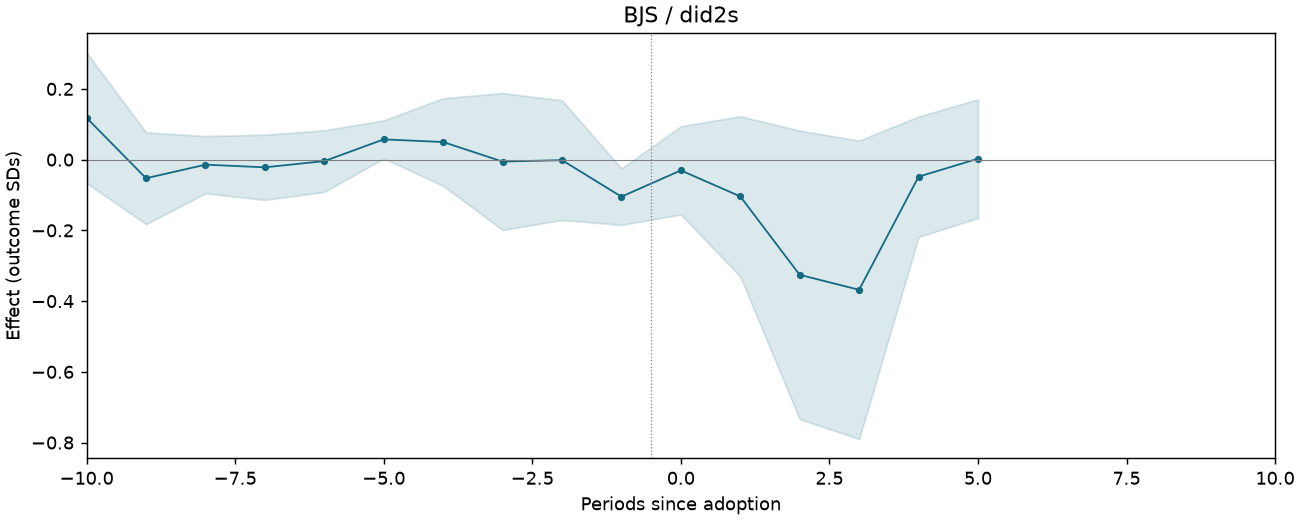
| BJS / did2s | -0.095 | 0.077 | [-0.248, 0.057] | Treated cells |
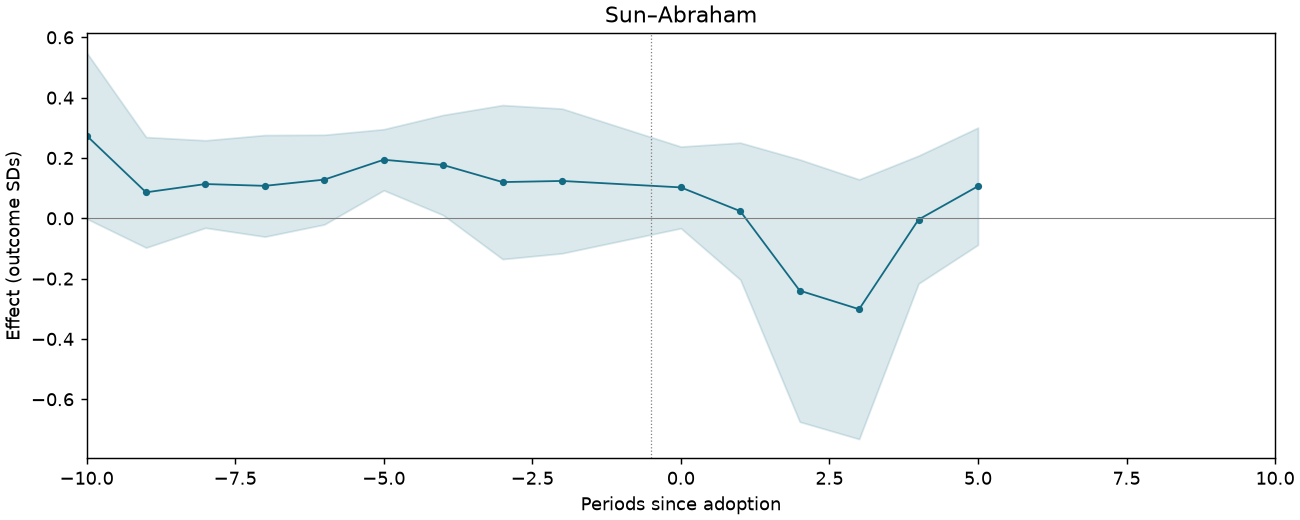
| Sun–Abraham | 0.017 | 0.077 | [-0.135, 0.169] | Treated cells |
Event studies
Periods −10 to +10; pointwise 95% intervals where available.
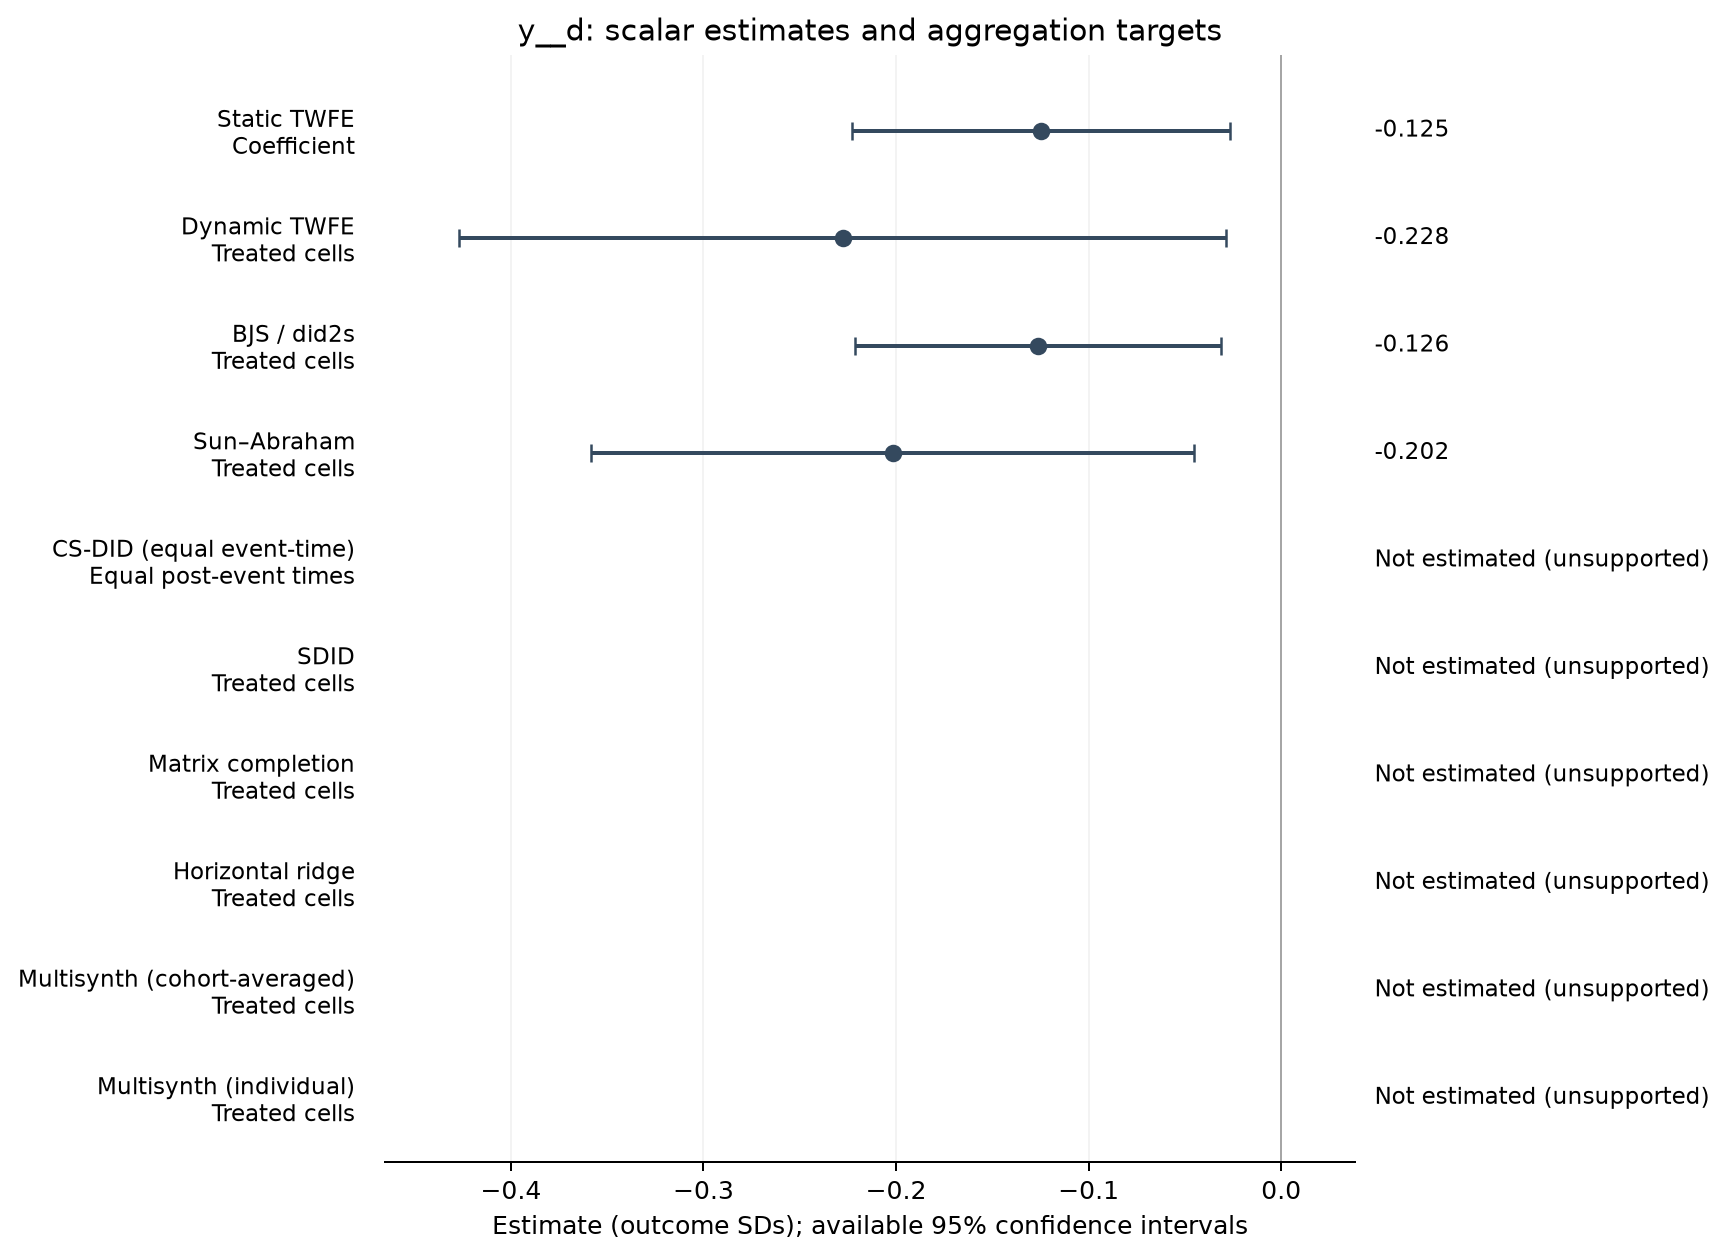
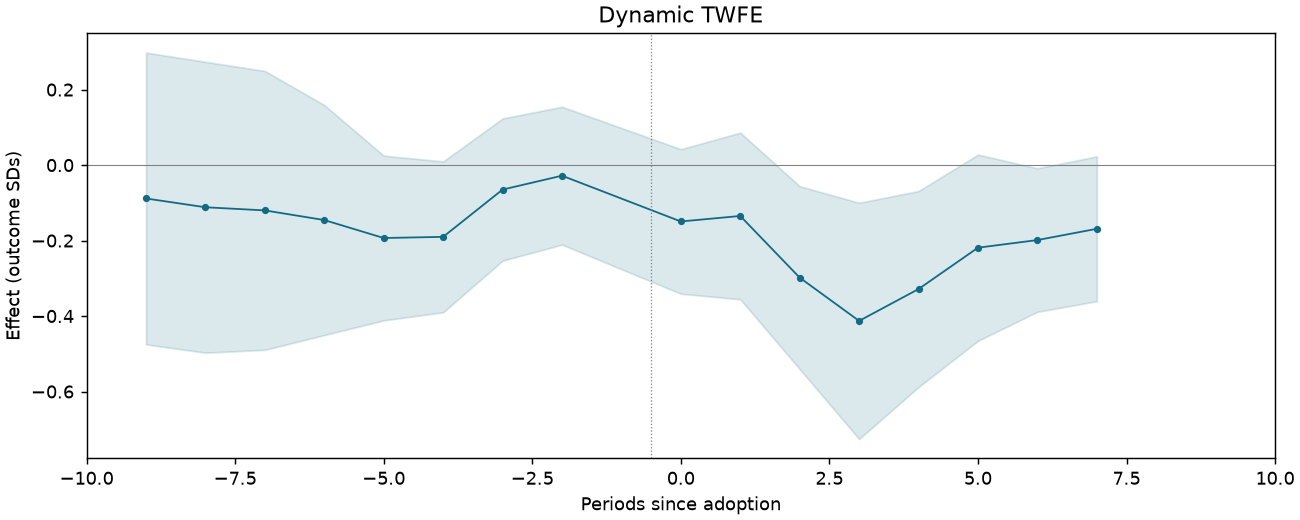
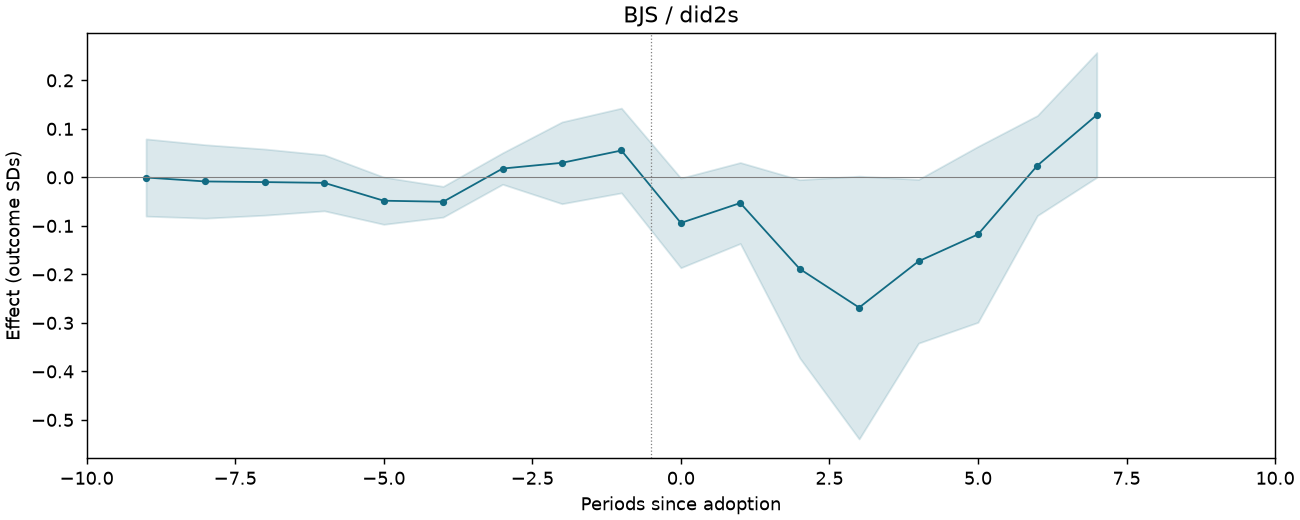
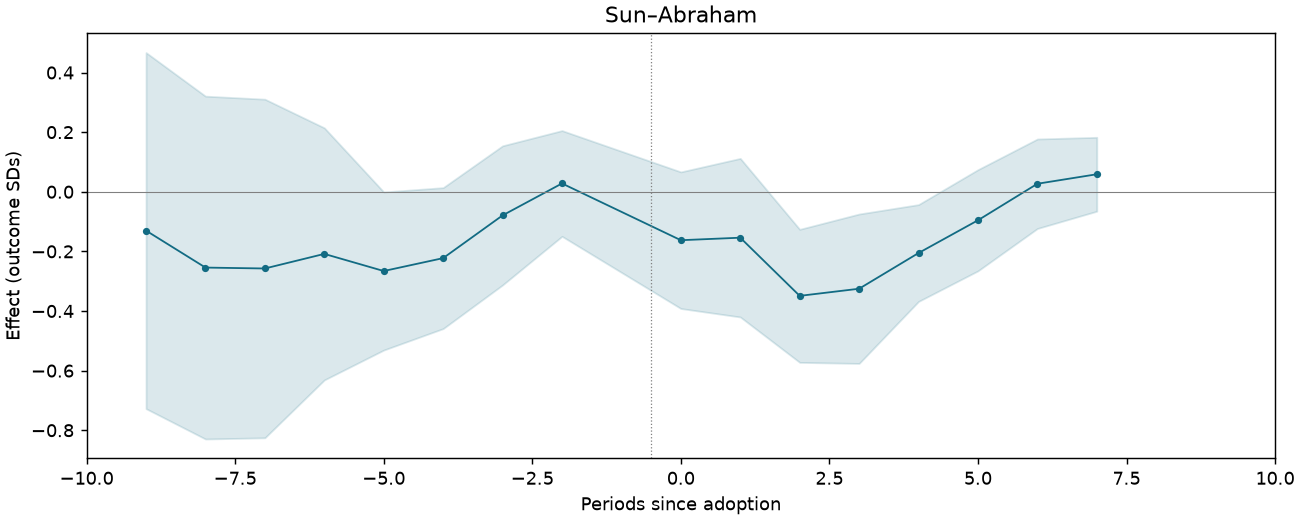
REXER-F4-THEFT-CTRLSPATIAL-SHNONE-FELGA-TRDI-SFULL
2,893 observations · 279 units · 279 clusters · 41 treated / 238 control units.
Estimate comparison
| Estimator | Estimate (SDs) | SE | 95% CI | Averaging |
|---|---|---|---|---|
| Static TWFE | -0.125 | 0.050 | [-0.223, -0.027] | Coefficient |
| Dynamic TWFE | -0.228 | 0.101 | [-0.427, -0.028] | Treated cells |
| BJS / did2s | -0.126 | 0.048 | [-0.222, -0.031] | Treated cells |
| Sun–Abraham | -0.202 | 0.079 | [-0.358, -0.045] | Treated cells |
Event studies
Periods −10 to +10; pointwise 95% intervals where available.
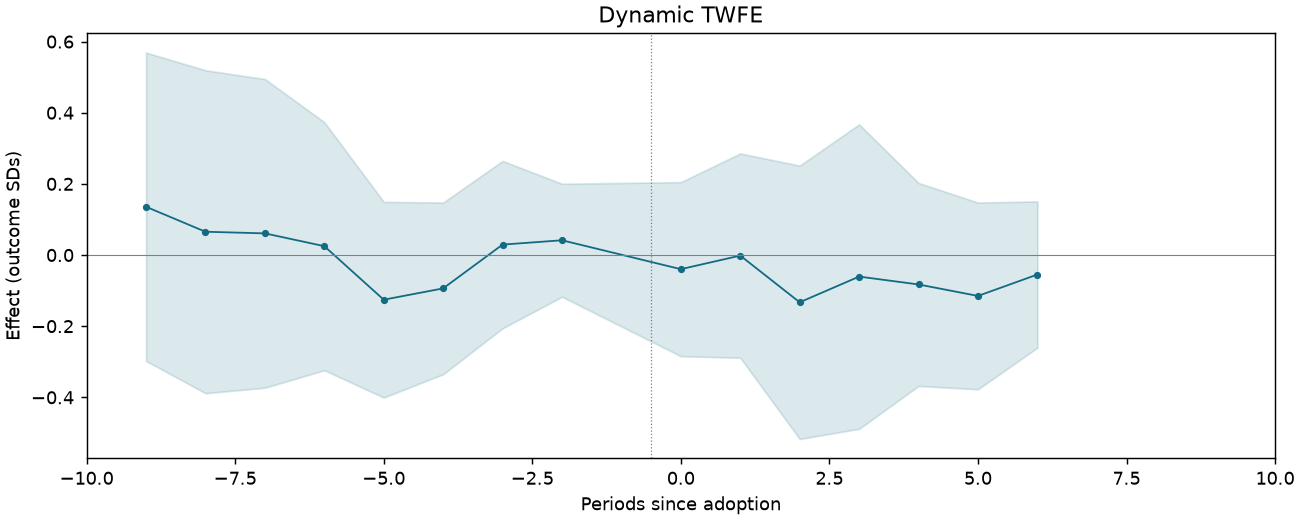
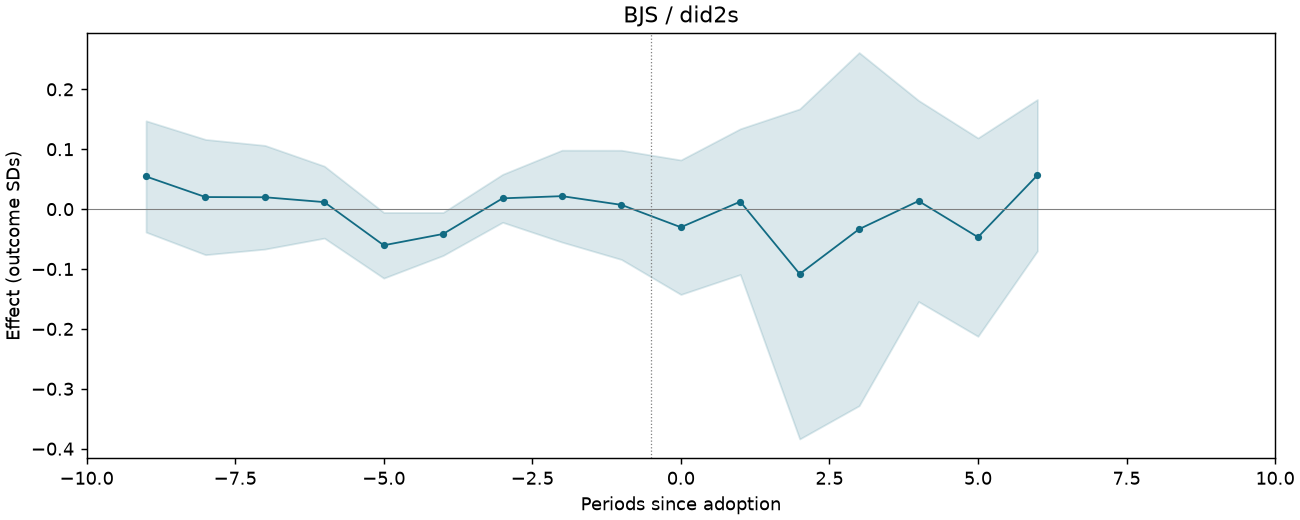
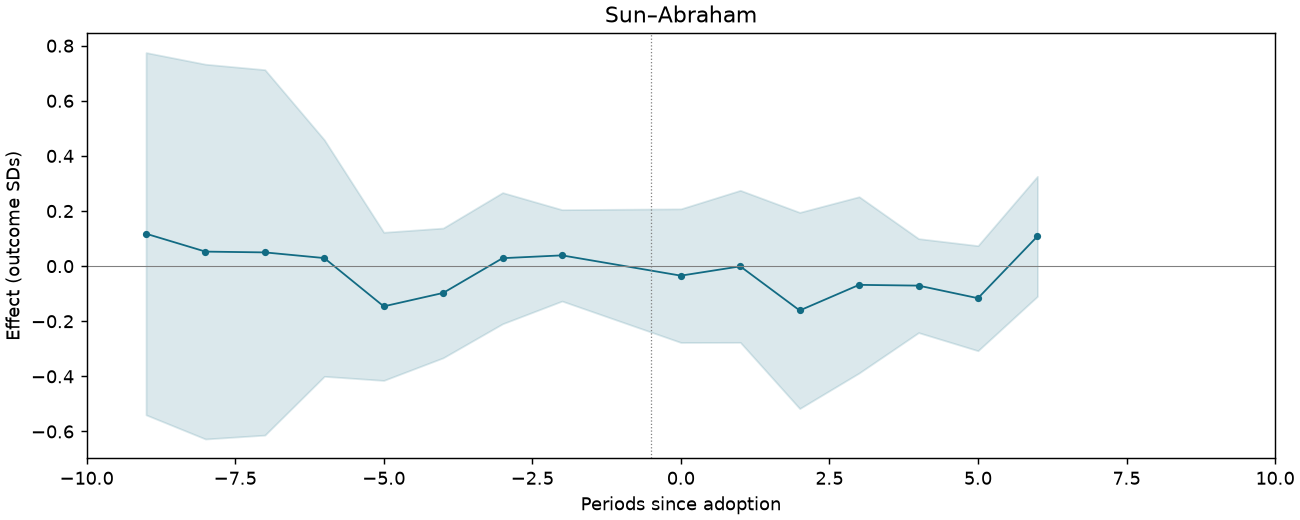
REXER-F4-THEFT-CTRLSPATIAL-SHNONE-FELGA-TRDI-SONSHORE
1,913 observations · 180 units · 180 clusters · 29 treated / 151 control units.
Estimate comparison
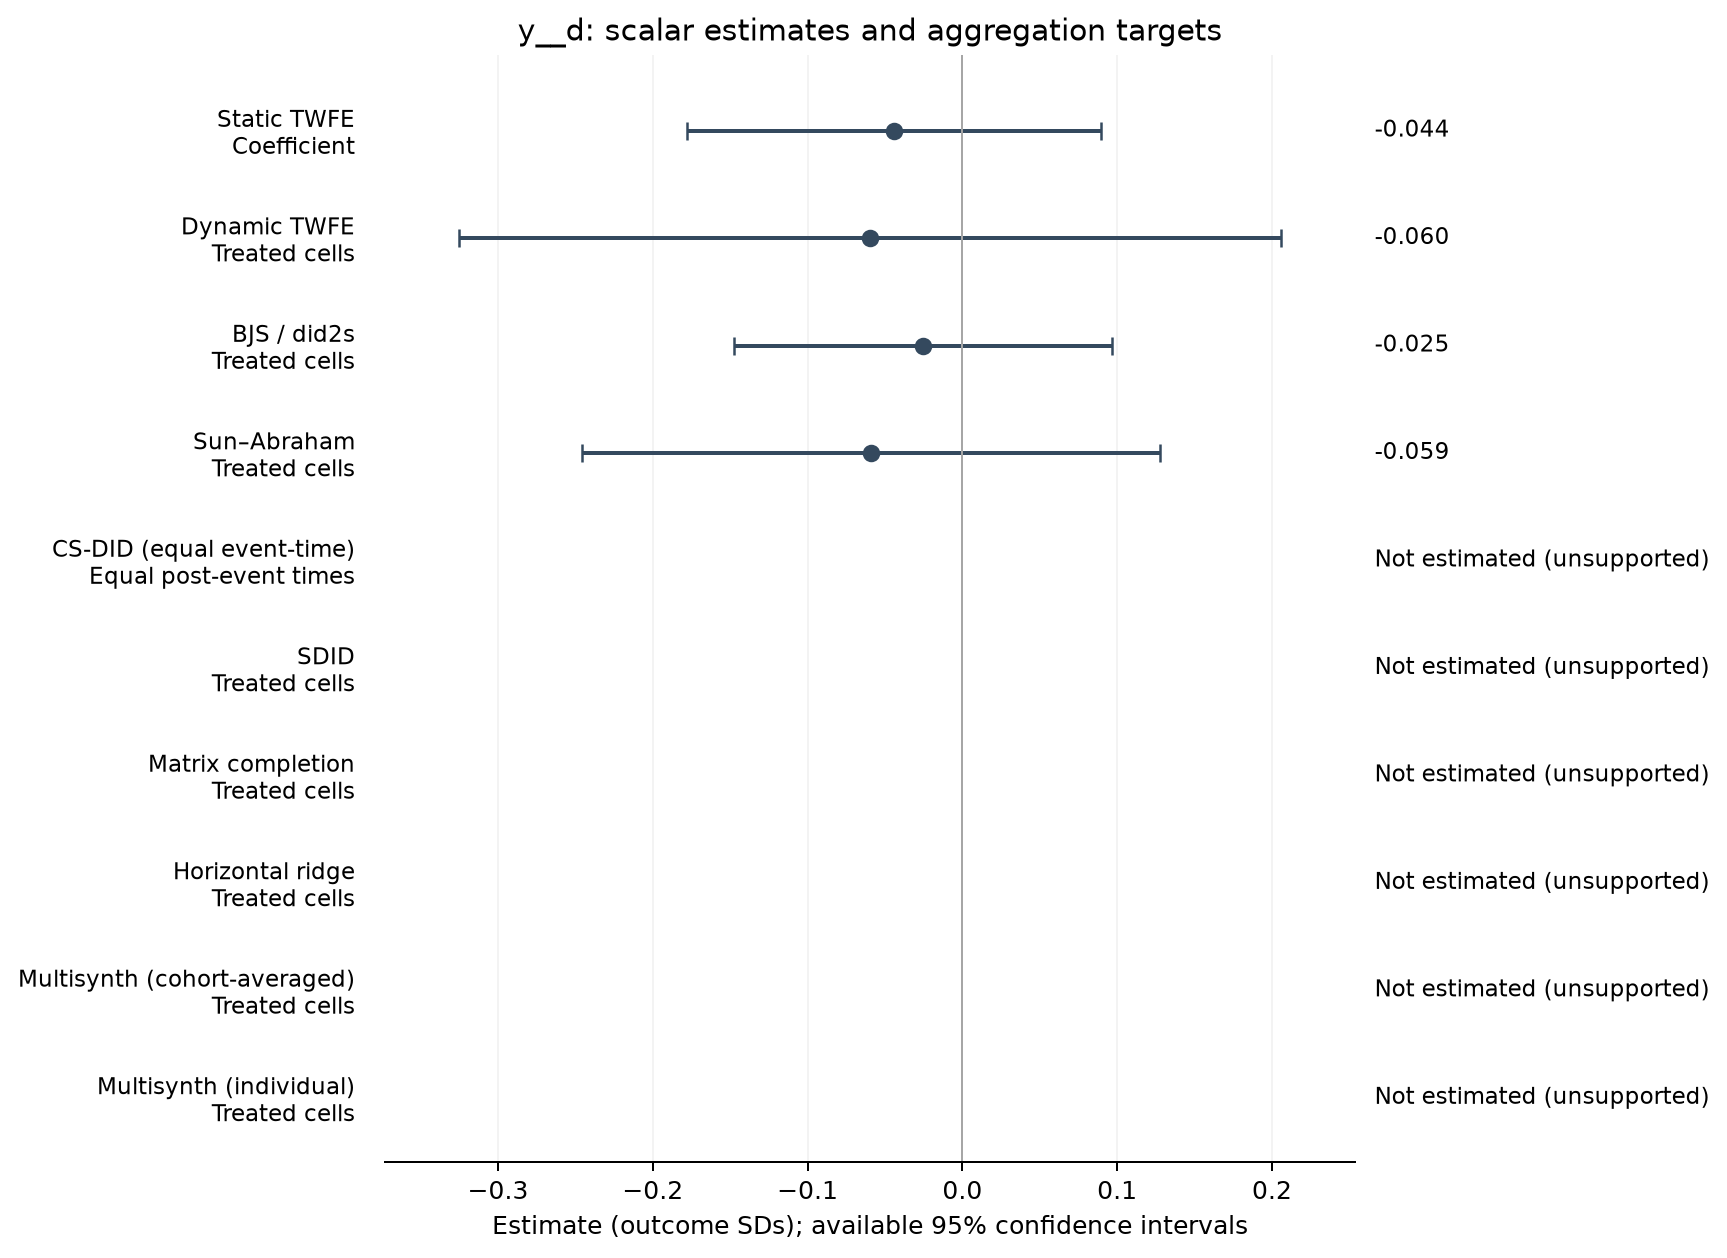
| Estimator | Estimate (SDs) | SE | 95% CI | Averaging |
|---|---|---|---|---|
| Static TWFE | -0.044 | 0.068 | [-0.178, 0.090] | Coefficient |
| Dynamic TWFE | -0.060 | 0.135 | [-0.325, 0.206] | Treated cells |
| BJS / did2s | -0.025 | 0.062 | [-0.147, 0.097] | Treated cells |
| Sun–Abraham | -0.059 | 0.095 | [-0.246, 0.128] | Treated cells |
Event studies
Periods −10 to +10; pointwise 95% intervals where available.
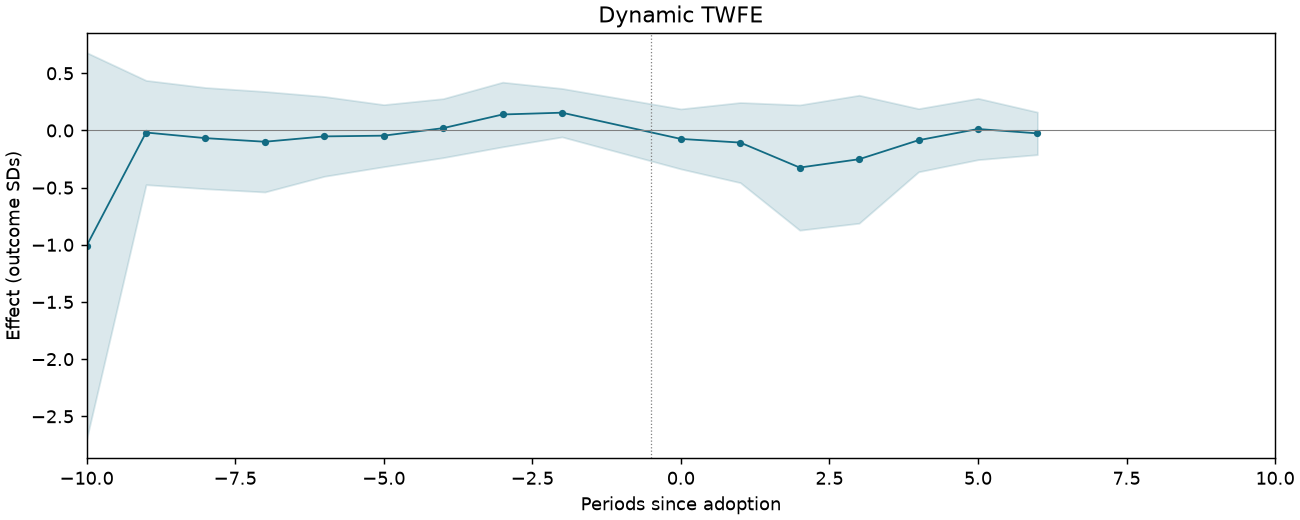
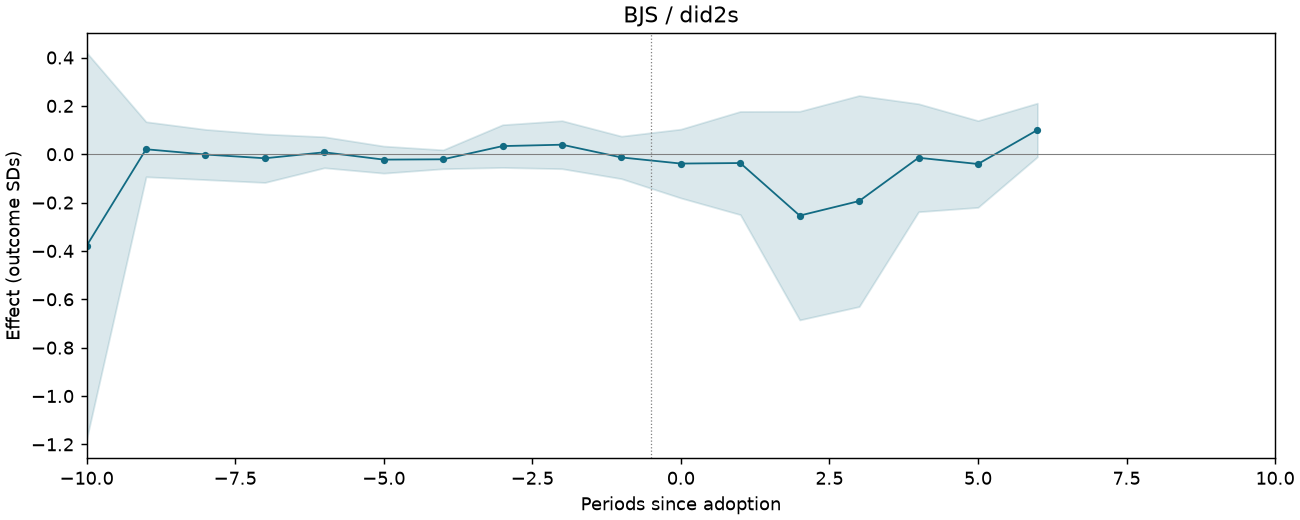
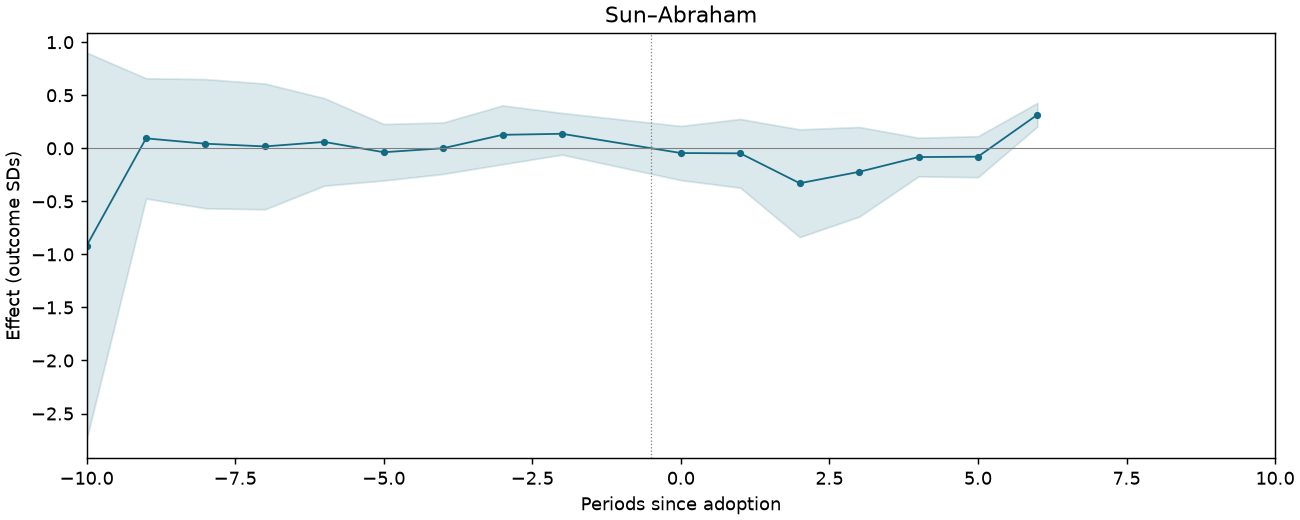
REXER-F4-THEFT-CTRLSPATIAL-SHNONE-FELGA-TRDINNPC-SONSHORE
1,762 observations · 161 units · 161 clusters · 31 treated / 130 control units.
Estimate comparison
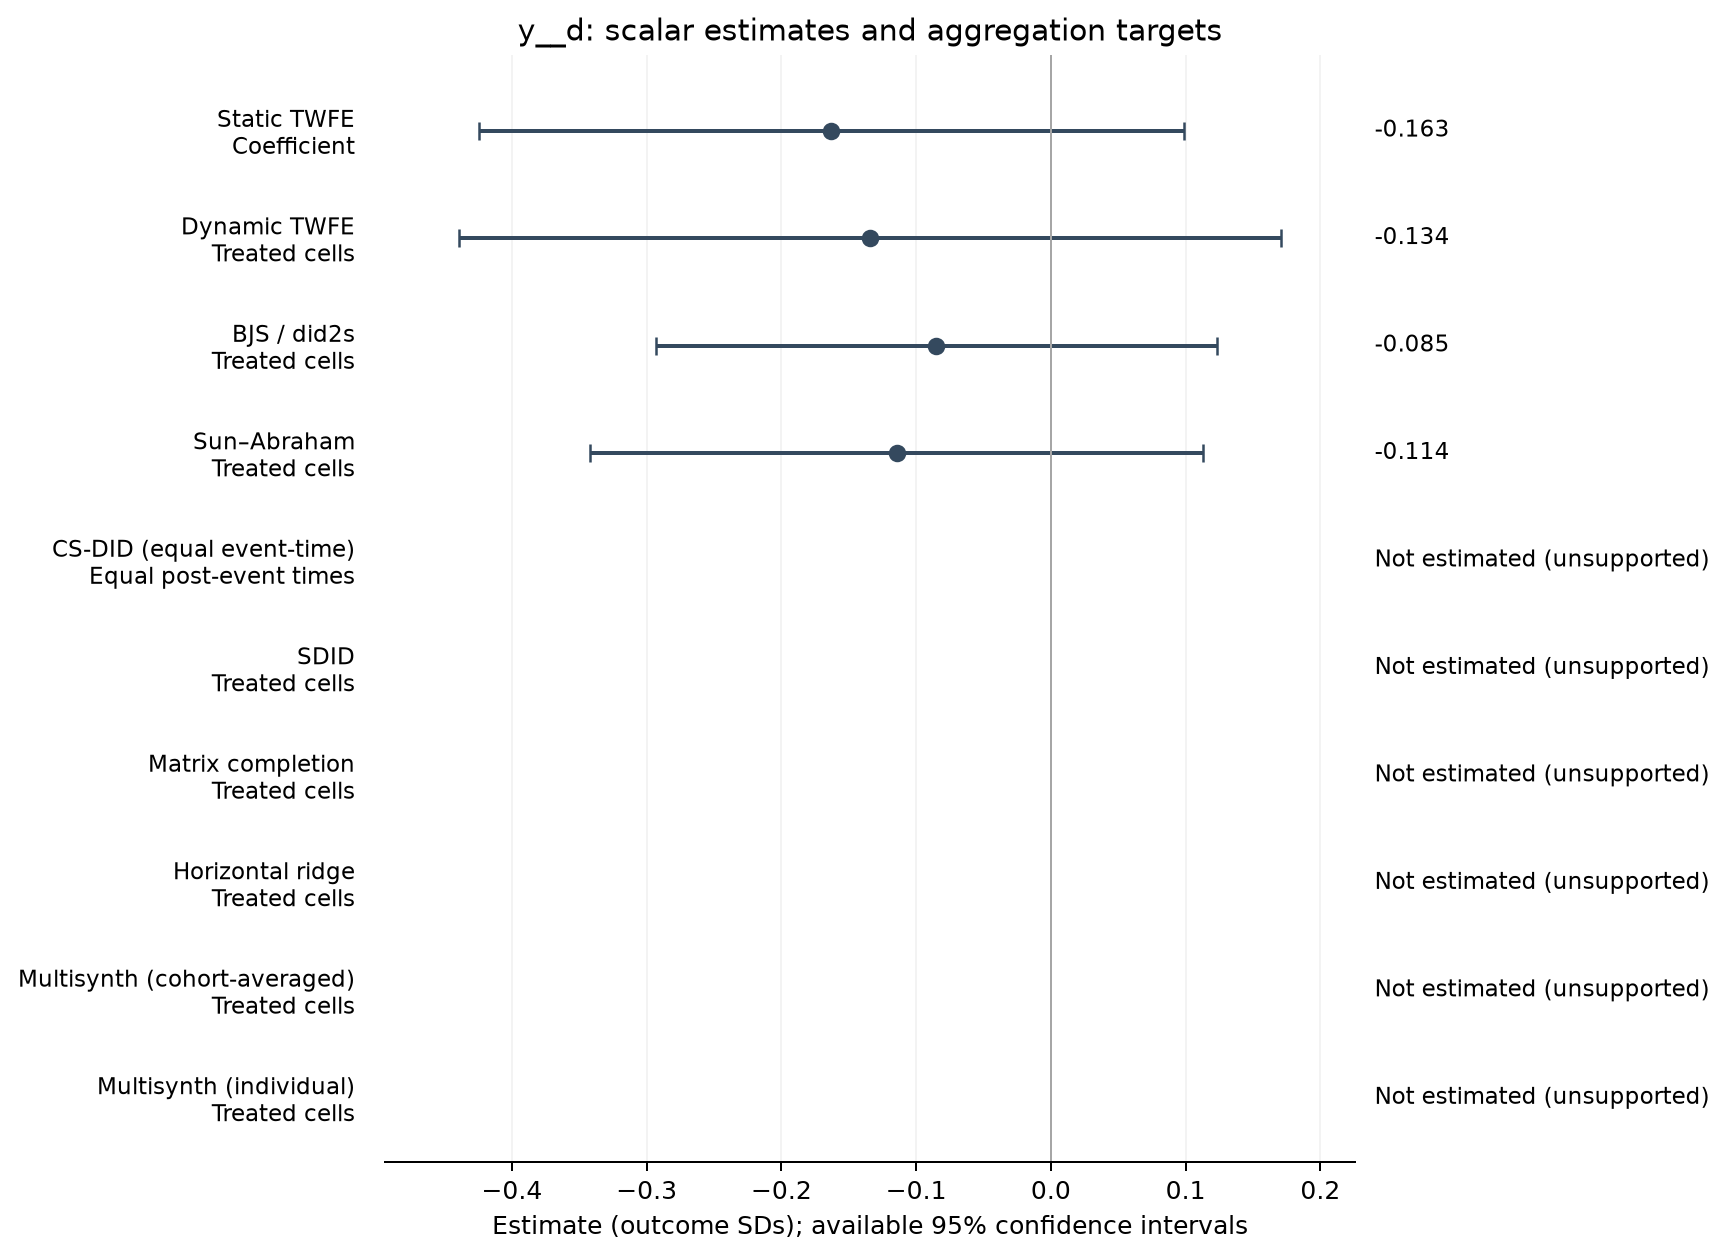
| Estimator | Estimate (SDs) | SE | 95% CI | Averaging |
|---|---|---|---|---|
| Static TWFE | -0.163 | 0.133 | [-0.425, 0.099] | Coefficient |
| Dynamic TWFE | -0.134 | 0.154 | [-0.439, 0.171] | Treated cells |
| BJS / did2s | -0.085 | 0.105 | [-0.293, 0.123] | Treated cells |
| Sun–Abraham | -0.114 | 0.115 | [-0.342, 0.113] | Treated cells |
Event studies
Periods −10 to +10; pointwise 95% intervals where available.
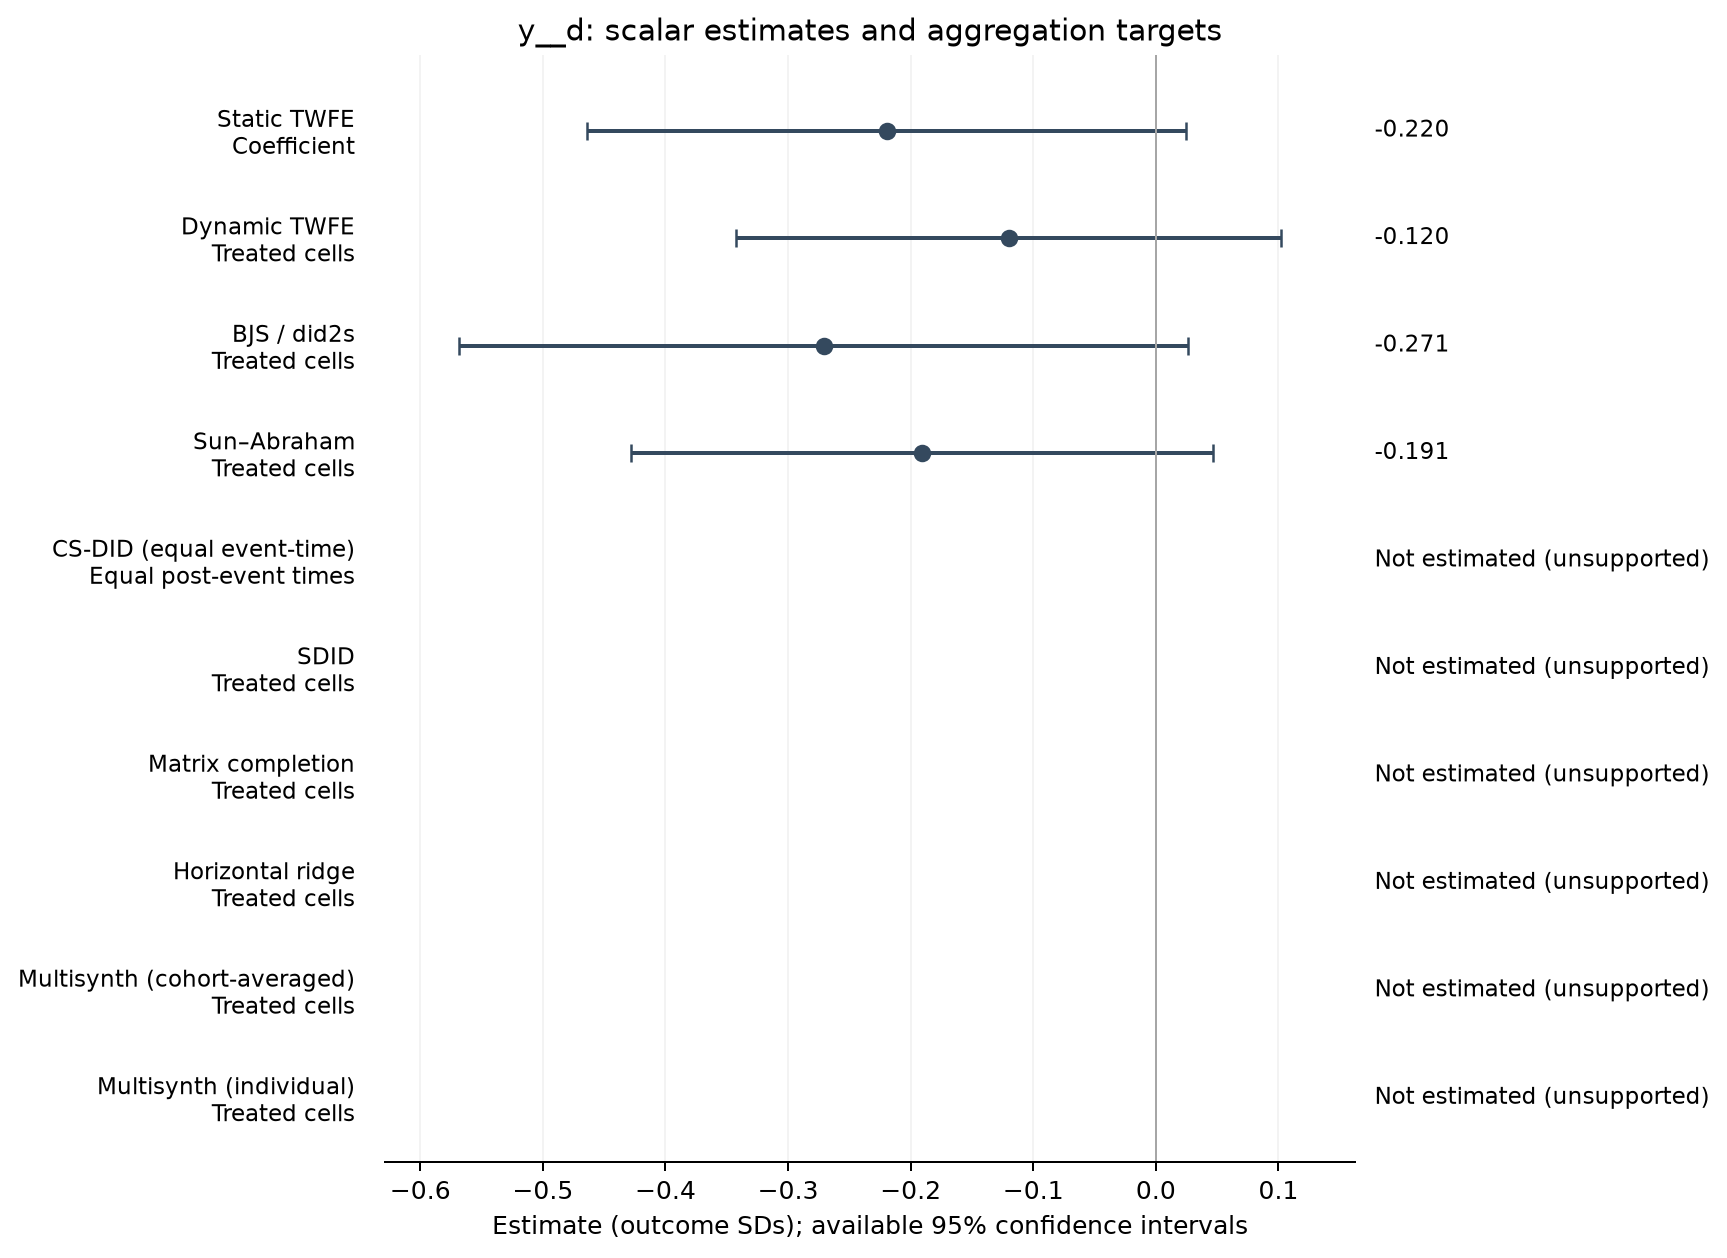
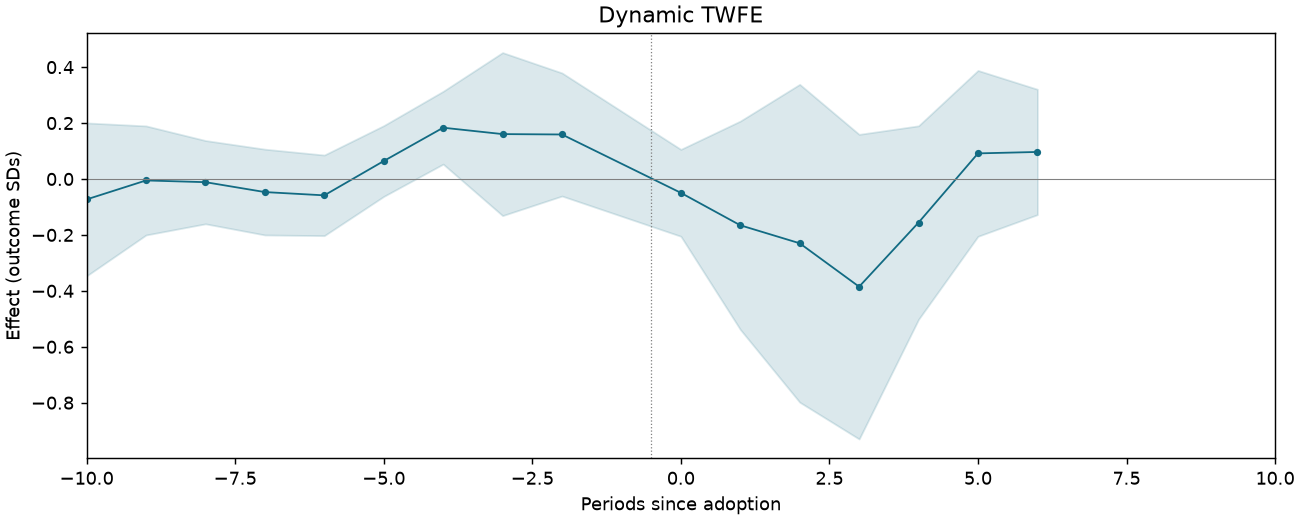
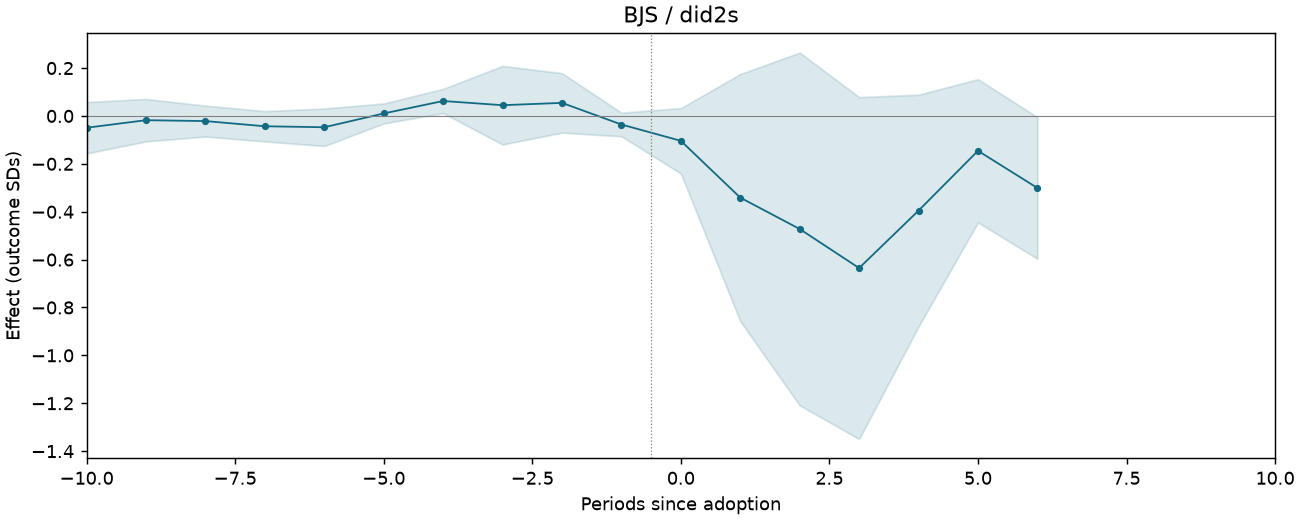
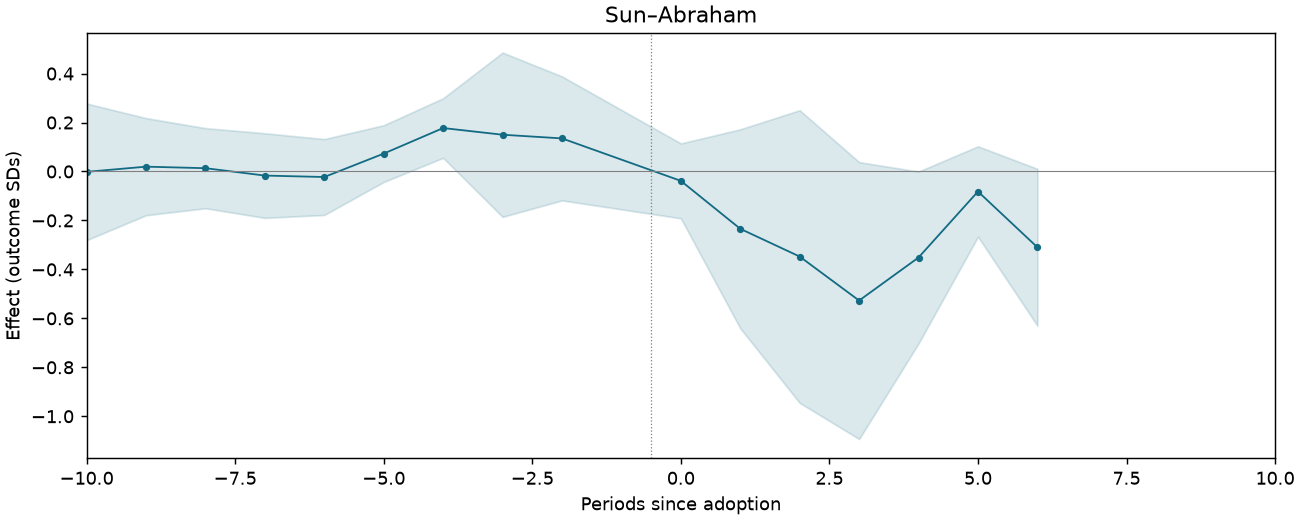
REXER-F4-THEFT-CTRLSPATIAL-SHNONE-FELGA-TRNNPC-SFULL
2,750 observations · 257 units · 257 clusters · 28 treated / 229 control units.
Estimate comparison
| Estimator | Estimate (SDs) | SE | 95% CI | Averaging |
|---|---|---|---|---|
| Static TWFE | -0.220 | 0.124 | [-0.464, 0.025] | Coefficient |
| Dynamic TWFE | -0.120 | 0.113 | [-0.343, 0.102] | Treated cells |
| BJS / did2s | -0.271 | 0.151 | [-0.568, 0.026] | Treated cells |
| Sun–Abraham | -0.191 | 0.120 | [-0.428, 0.047] | Treated cells |
Event studies
Periods −10 to +10; pointwise 95% intervals where available.
REXER-F4-THEFT-CTRLSPATIAL-SHNONE-FELGA-TRNNPC-SONSHORE
1,916 observations · 175 units · 175 clusters · 24 treated / 151 control units.
Estimate comparison
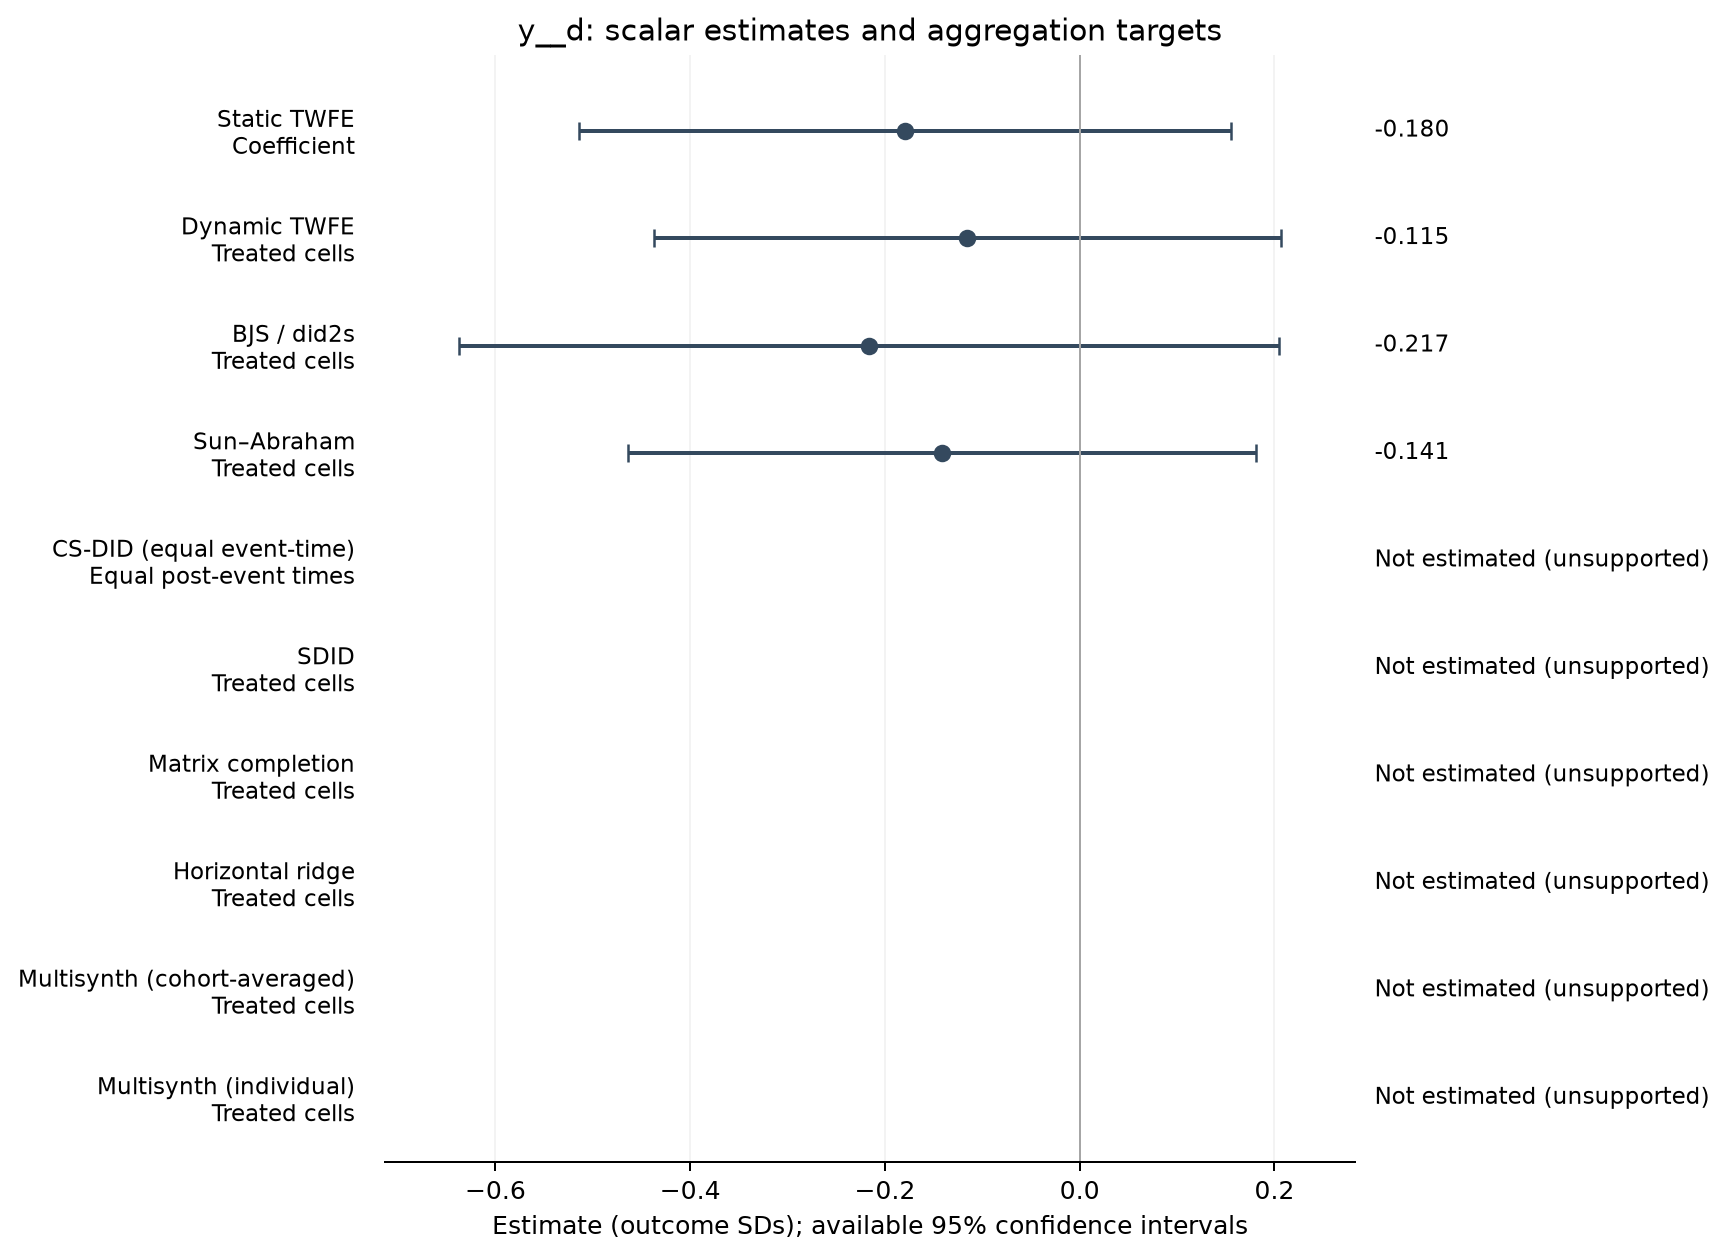
| Estimator | Estimate (SDs) | SE | 95% CI | Averaging |
|---|---|---|---|---|
| Static TWFE | -0.180 | 0.170 | [-0.514, 0.155] | Coefficient |
| Dynamic TWFE | -0.115 | 0.163 | [-0.438, 0.207] | Treated cells |
| BJS / did2s | -0.217 | 0.213 | [-0.637, 0.204] | Treated cells |
| Sun–Abraham | -0.141 | 0.164 | [-0.464, 0.181] | Treated cells |
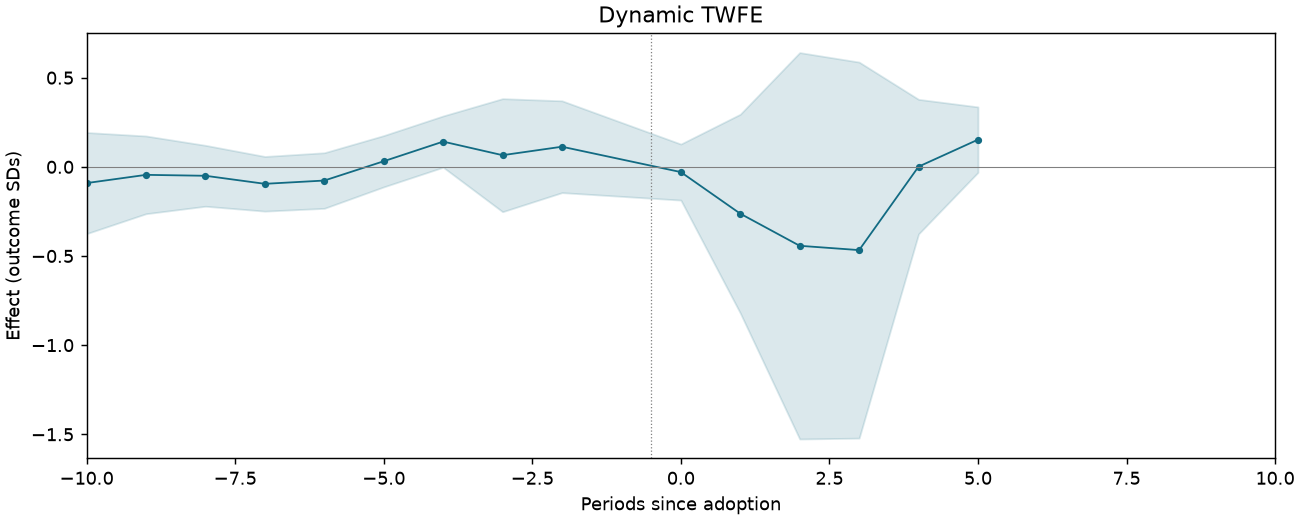
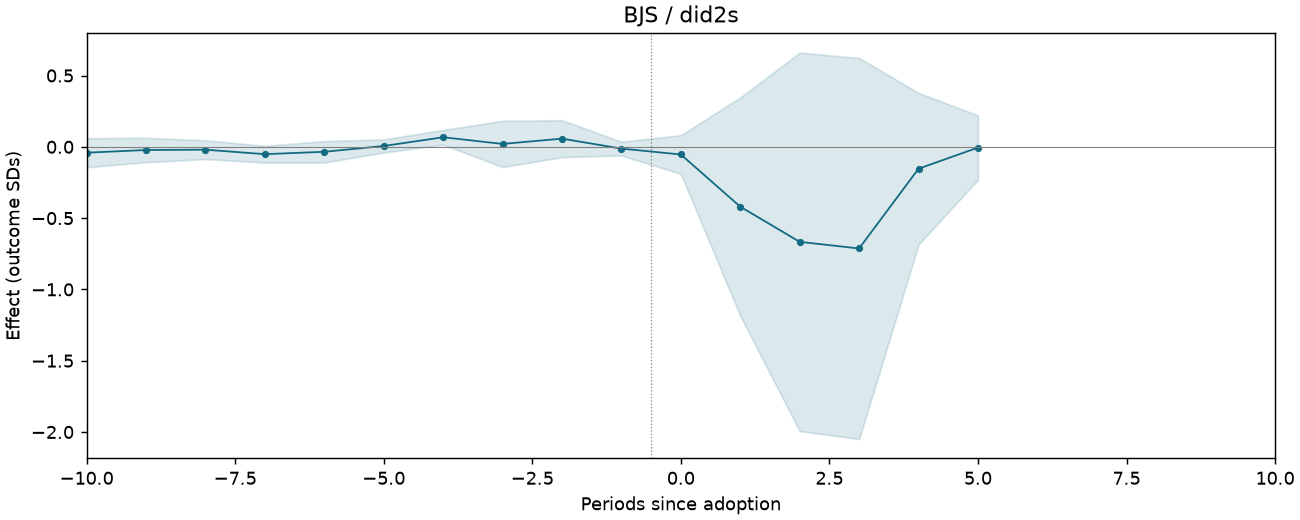
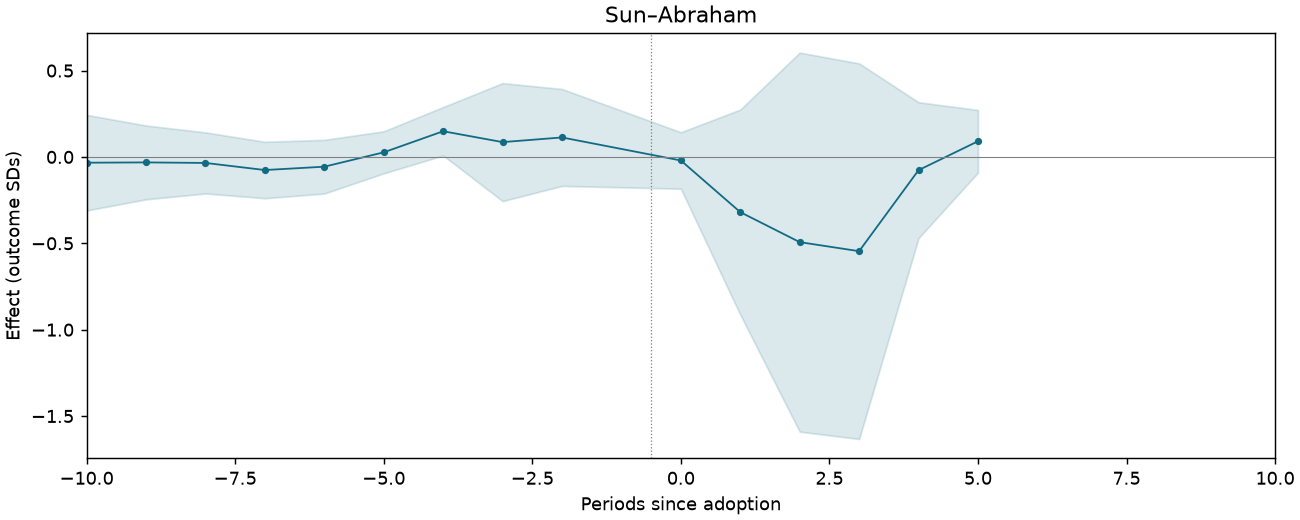
Event studies
Periods −10 to +10; pointwise 95% intervals where available.
REXER-F4-THEFT-CTRLSPATIAL-SHNONE-FENONE-TRDI-SFULL
3,167 observations · 303 units · 303 clusters · 52 treated / 251 control units.
Estimate comparison
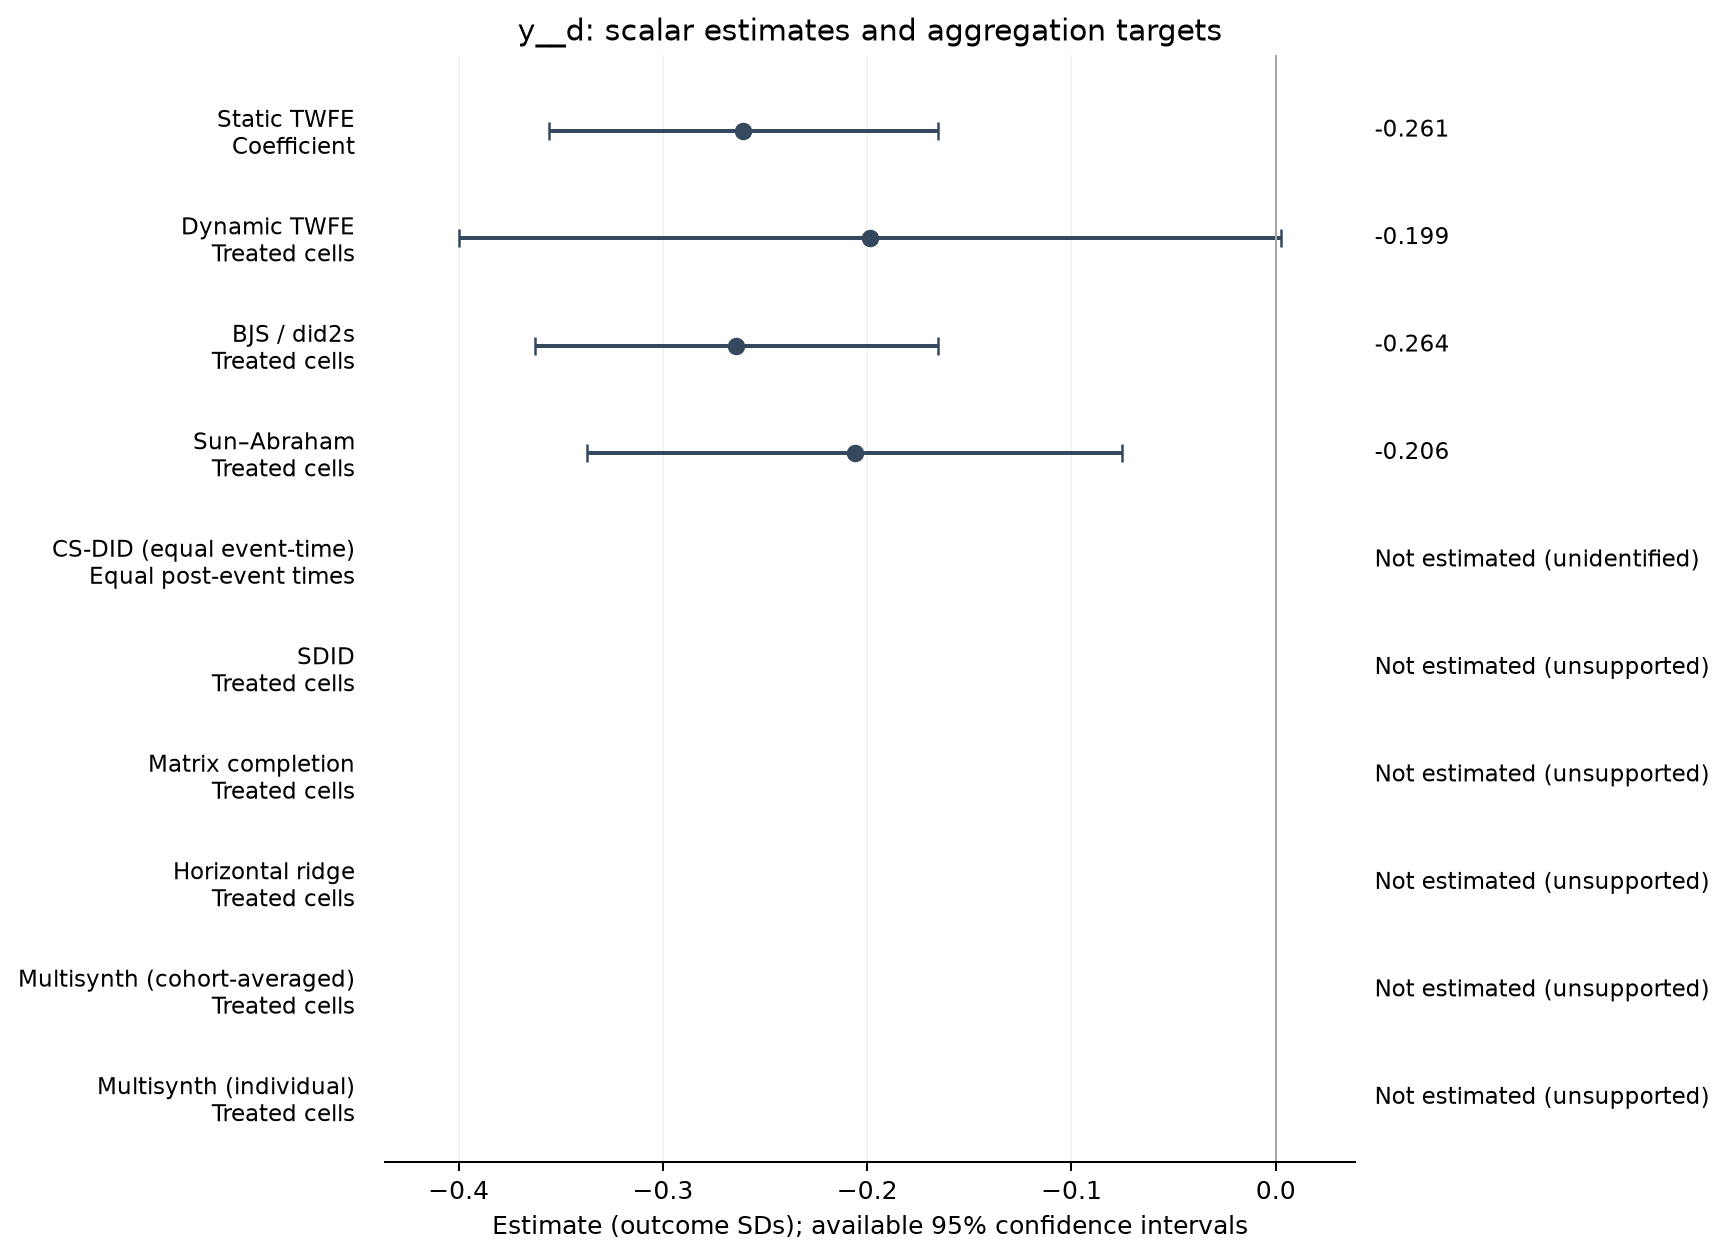
| Estimator | Estimate (SDs) | SE | 95% CI | Averaging |
|---|---|---|---|---|
| Static TWFE | -0.261 | 0.048 | [-0.356, -0.165] | Coefficient |
| Dynamic TWFE | -0.199 | 0.102 | [-0.400, 0.003] | Treated cells |
| BJS / did2s | -0.264 | 0.050 | [-0.363, -0.165] | Treated cells |
| Sun–Abraham | -0.206 | 0.067 | [-0.337, -0.075] | Treated cells |
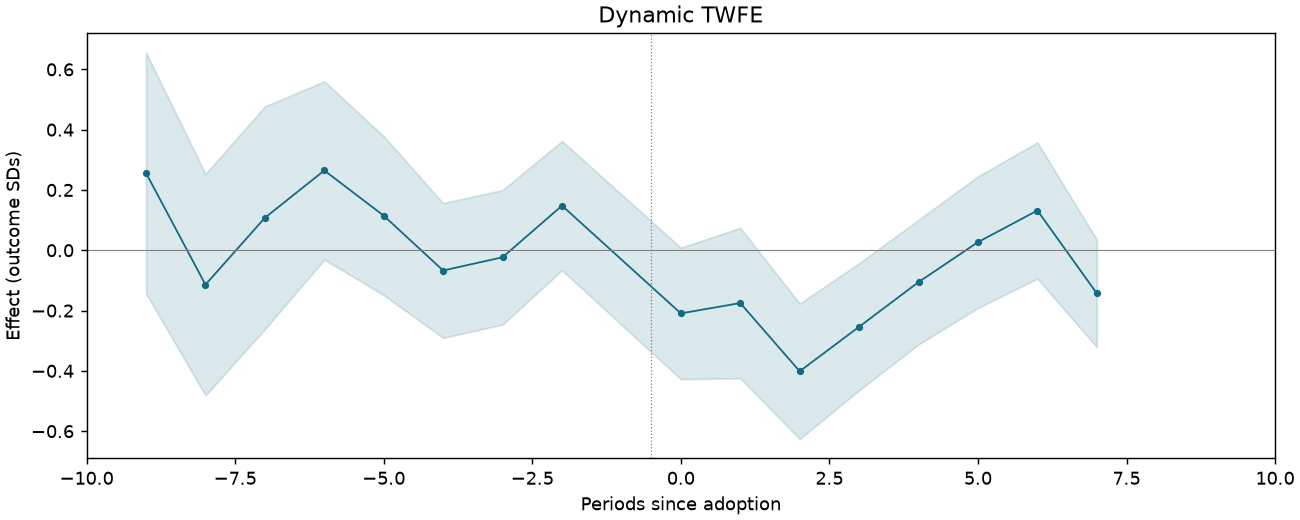
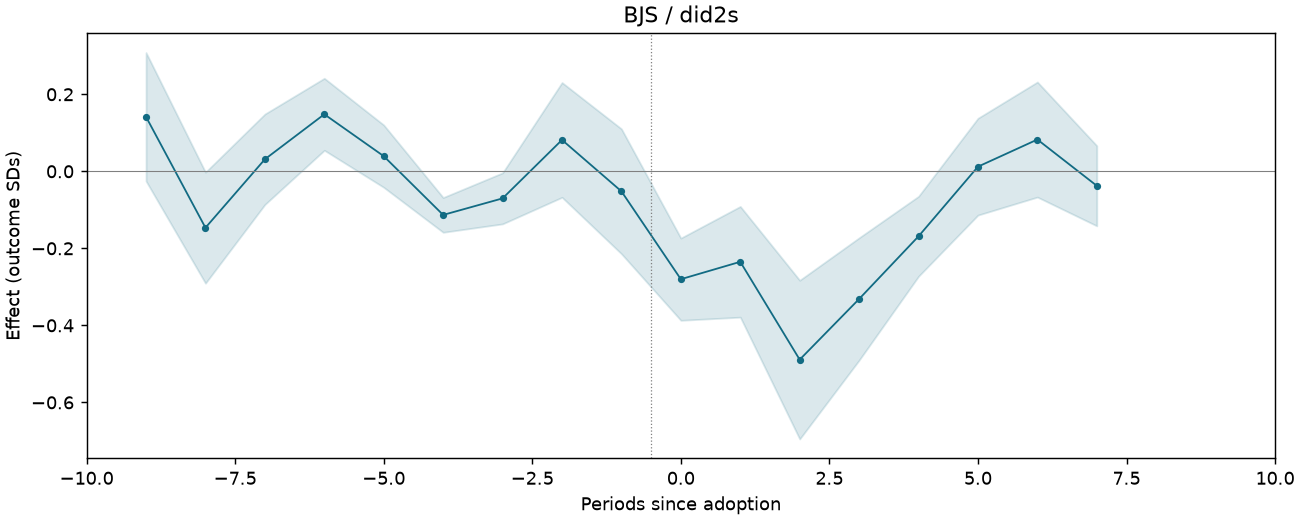
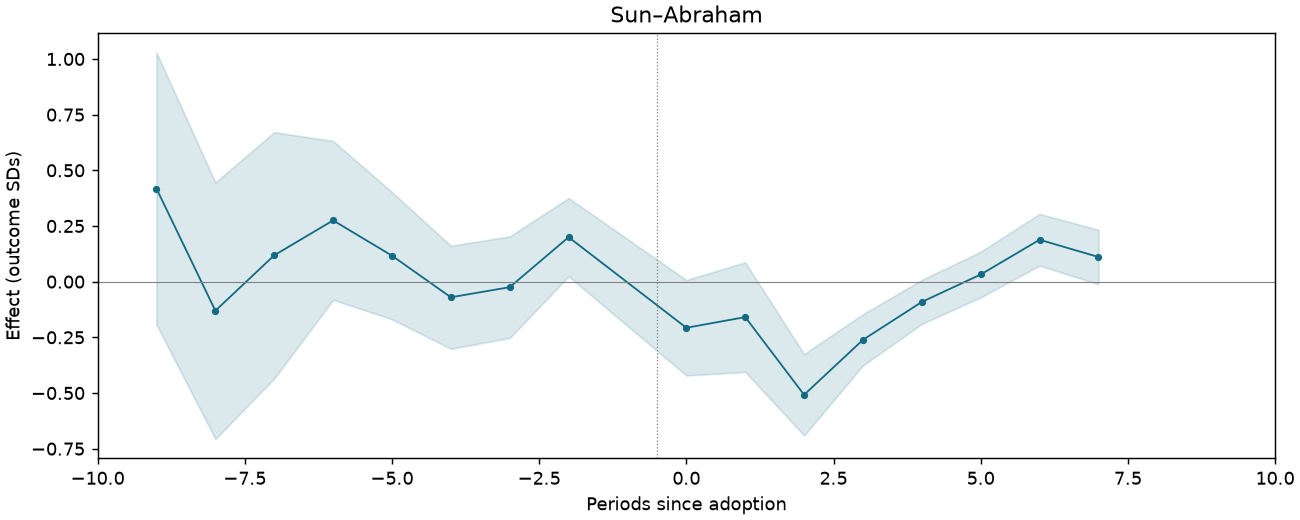
Event studies
Periods −10 to +10; pointwise 95% intervals where available.
REXER-F4-THEFT-CTRLSPATIAL-SHNONE-FENONE-TRDI-SONSHORE
2,285 observations · 216 units · 216 clusters · 49 treated / 167 control units.
Estimate comparison
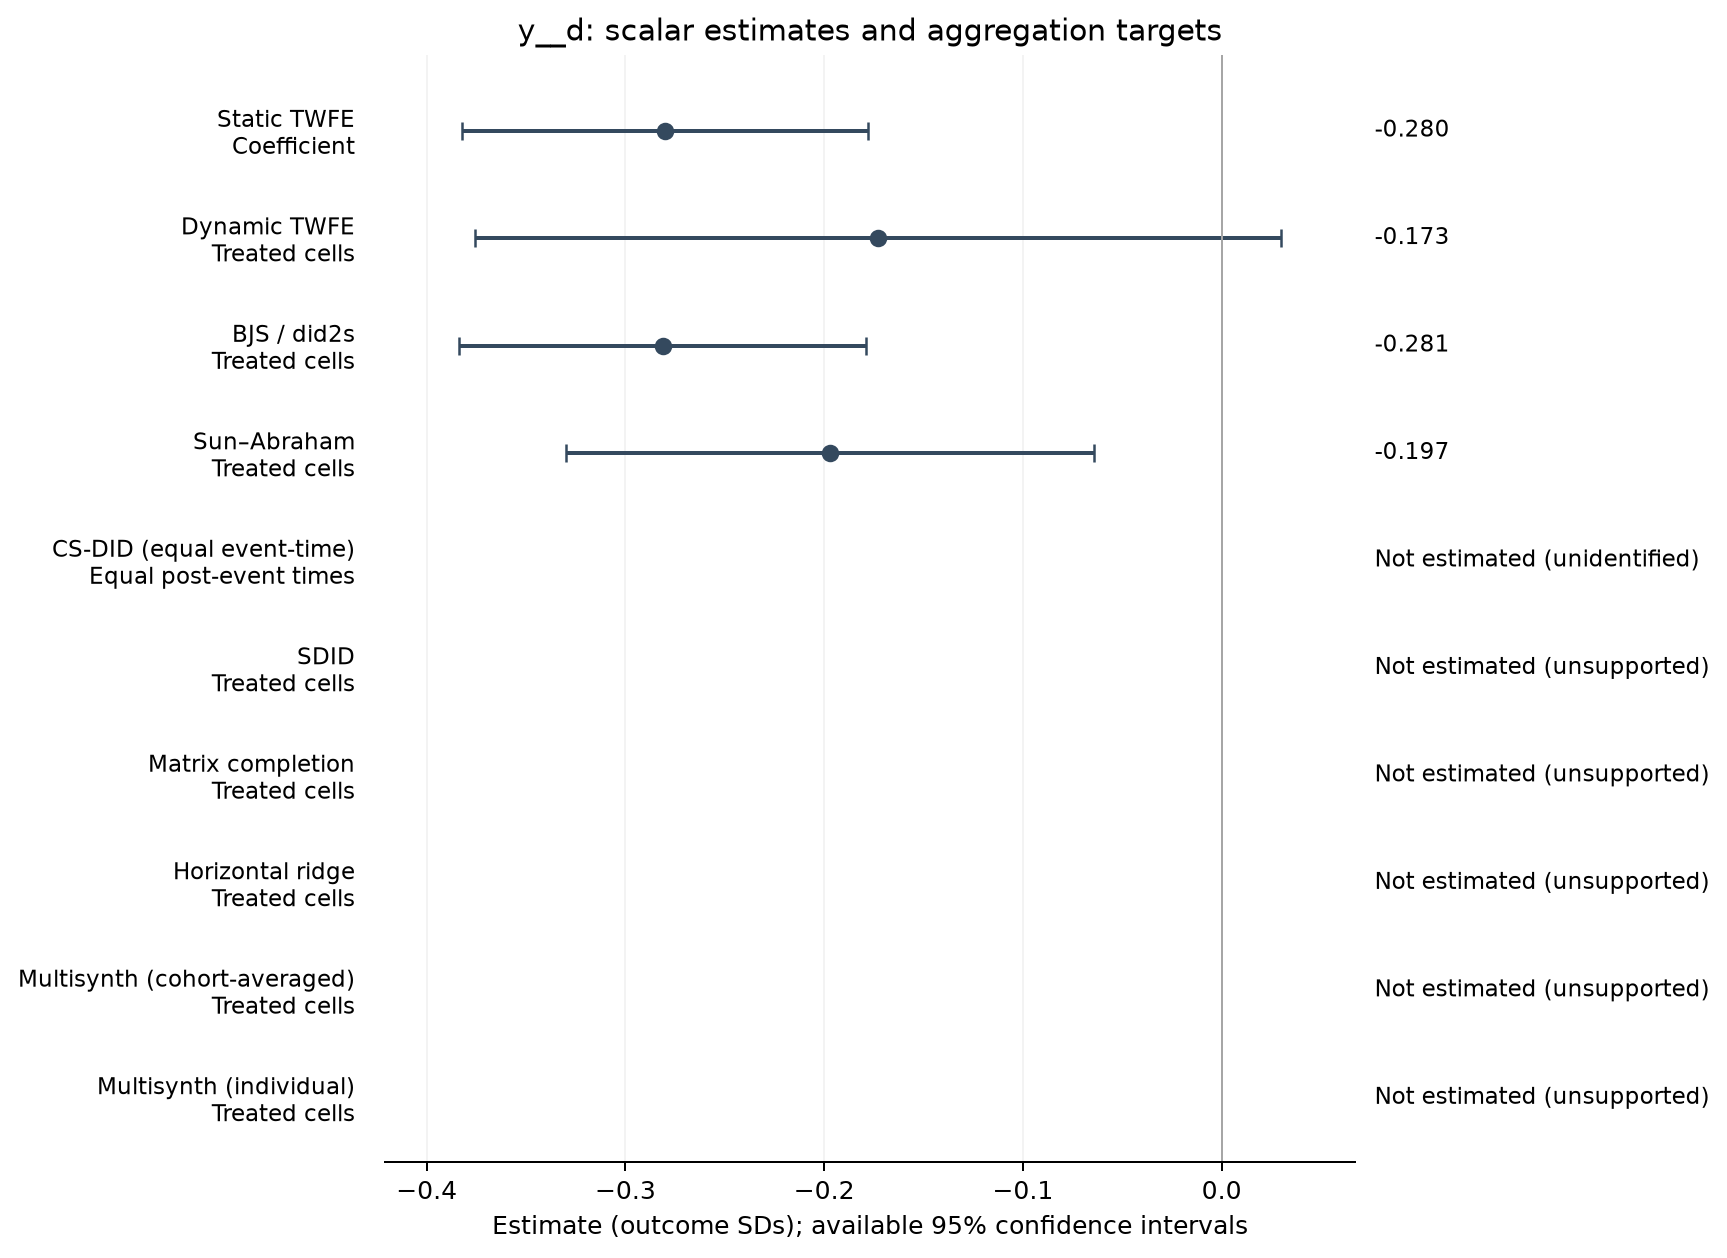
| Estimator | Estimate (SDs) | SE | 95% CI | Averaging |
|---|---|---|---|---|
| Static TWFE | -0.280 | 0.052 | [-0.382, -0.178] | Coefficient |
| Dynamic TWFE | -0.173 | 0.103 | [-0.376, 0.030] | Treated cells |
| BJS / did2s | -0.281 | 0.052 | [-0.384, -0.179] | Treated cells |
| Sun–Abraham | -0.197 | 0.067 | [-0.330, -0.064] | Treated cells |
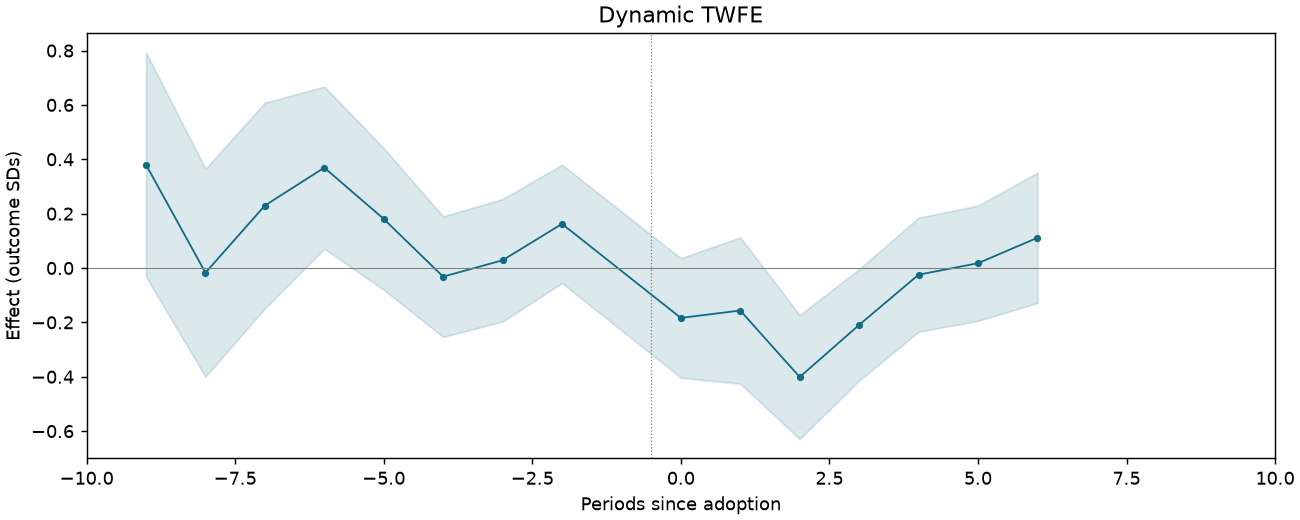
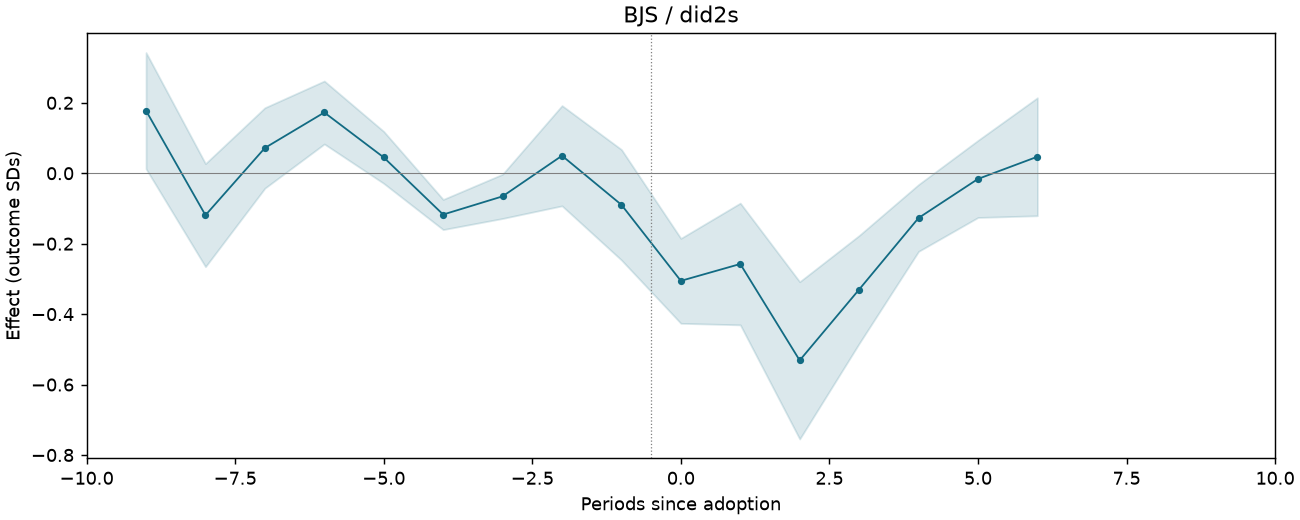
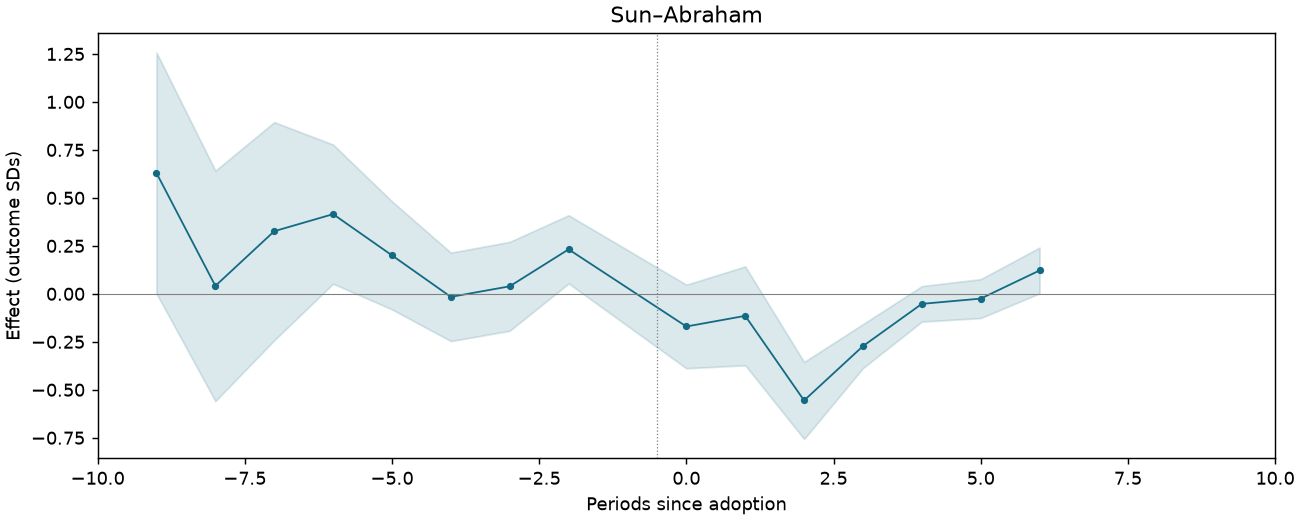
Event studies
Periods −10 to +10; pointwise 95% intervals where available.
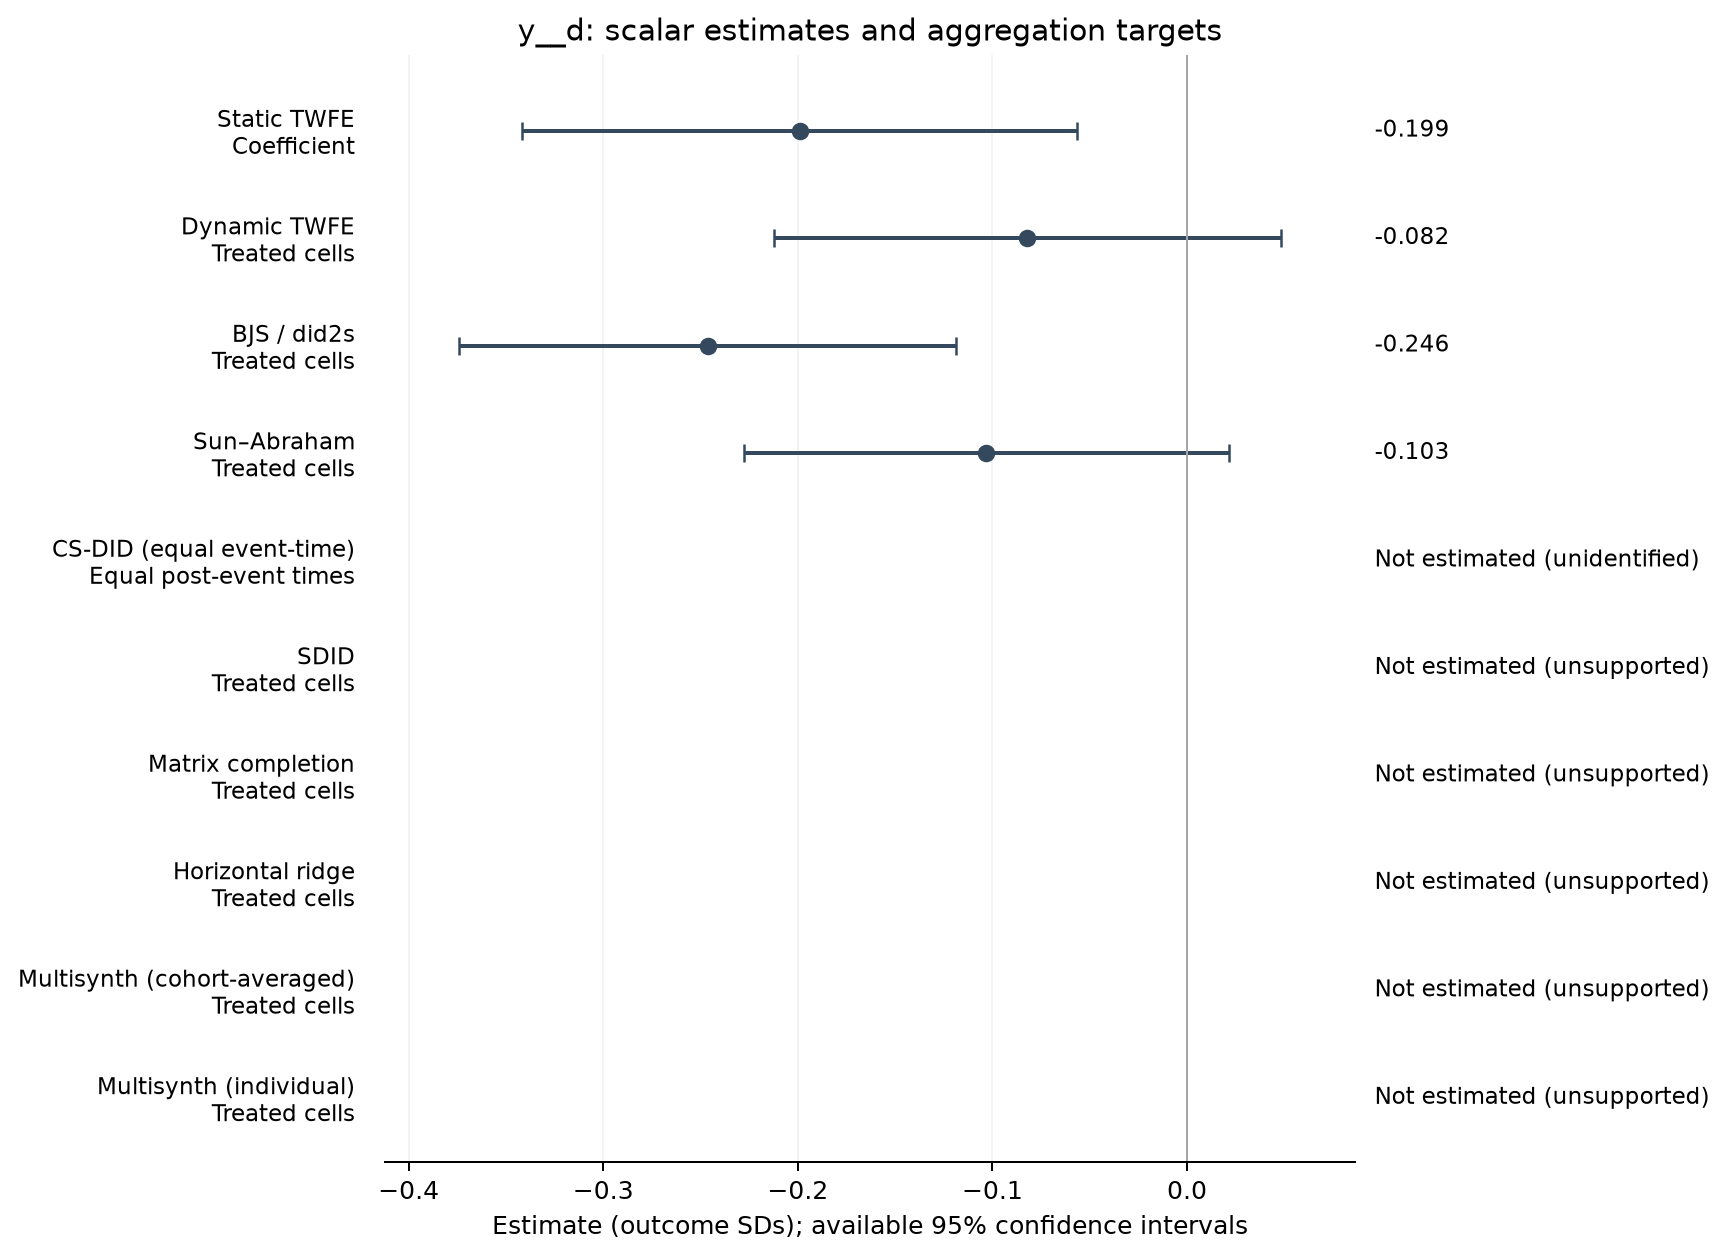
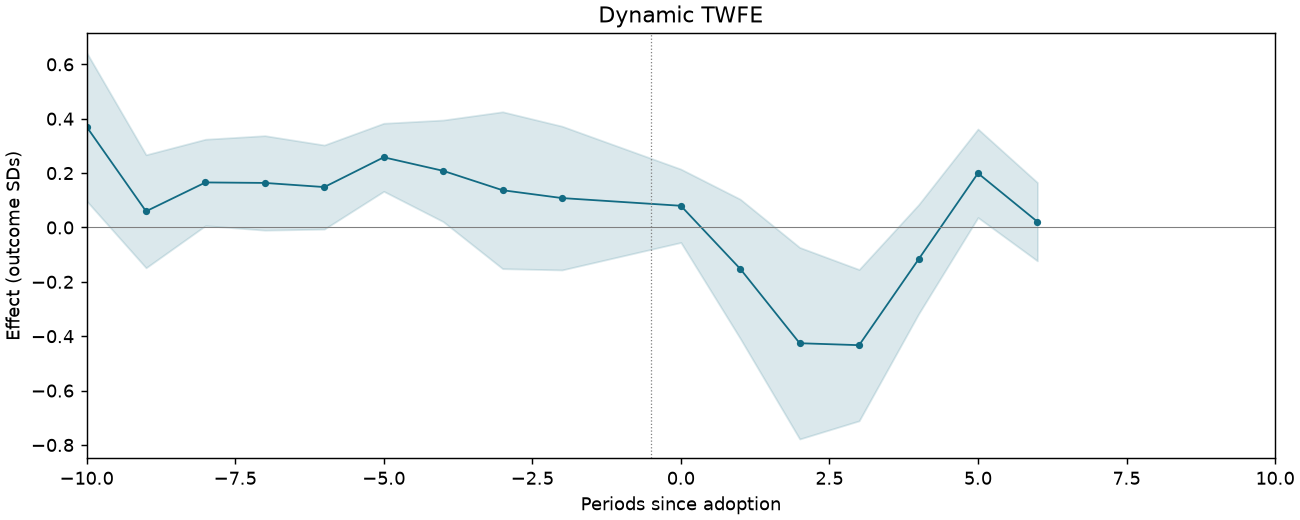
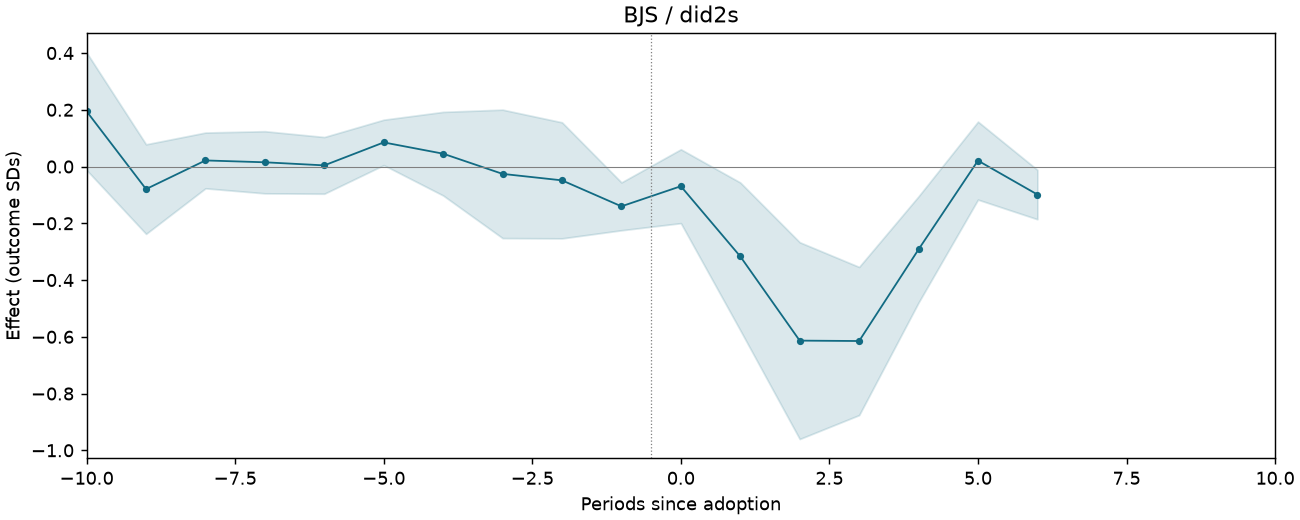
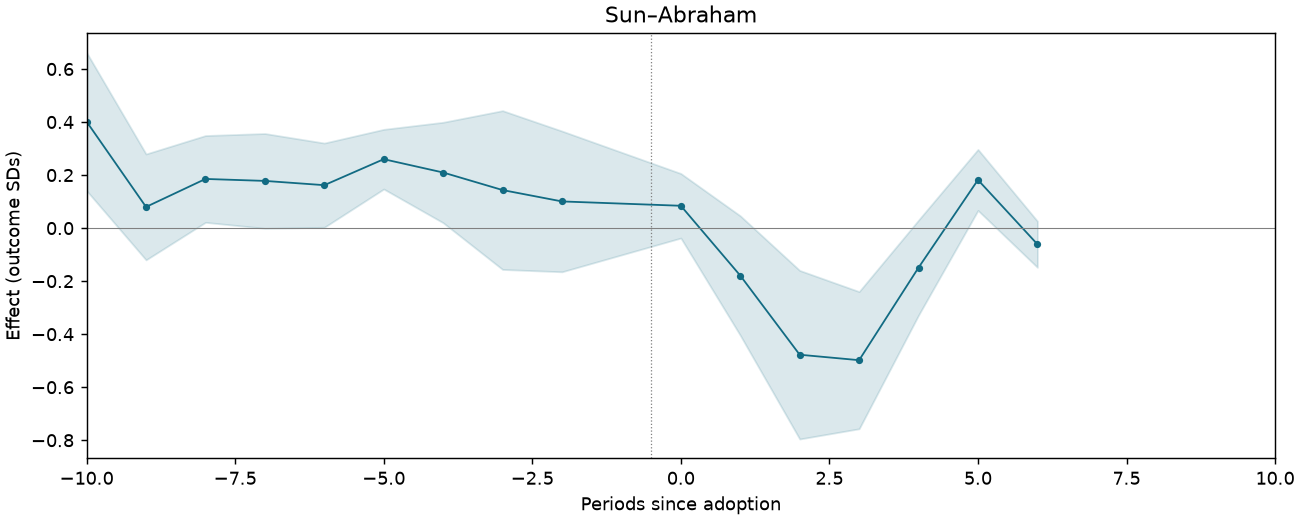
REXER-F4-THEFT-CTRLSPATIAL-SHNONE-FENONE-TRNNPC-SFULL
2,906 observations · 272 units · 272 clusters · 33 treated / 239 control units.
Estimate comparison
| Estimator | Estimate (SDs) | SE | 95% CI | Averaging |
|---|---|---|---|---|
| Static TWFE | -0.199 | 0.072 | [-0.342, -0.057] | Coefficient |
| Dynamic TWFE | -0.082 | 0.066 | [-0.212, 0.048] | Treated cells |
| BJS / did2s | -0.246 | 0.065 | [-0.374, -0.118] | Treated cells |
| Sun–Abraham | -0.103 | 0.063 | [-0.228, 0.021] | Treated cells |
Event studies
Periods −10 to +10; pointwise 95% intervals where available.
REXER-F4-THEFT-CTRLSPATIAL-SHNONE-FENONE-TRNNPC-SONSHORE
2,096 observations · 193 units · 193 clusters · 30 treated / 163 control units.
Estimate comparison
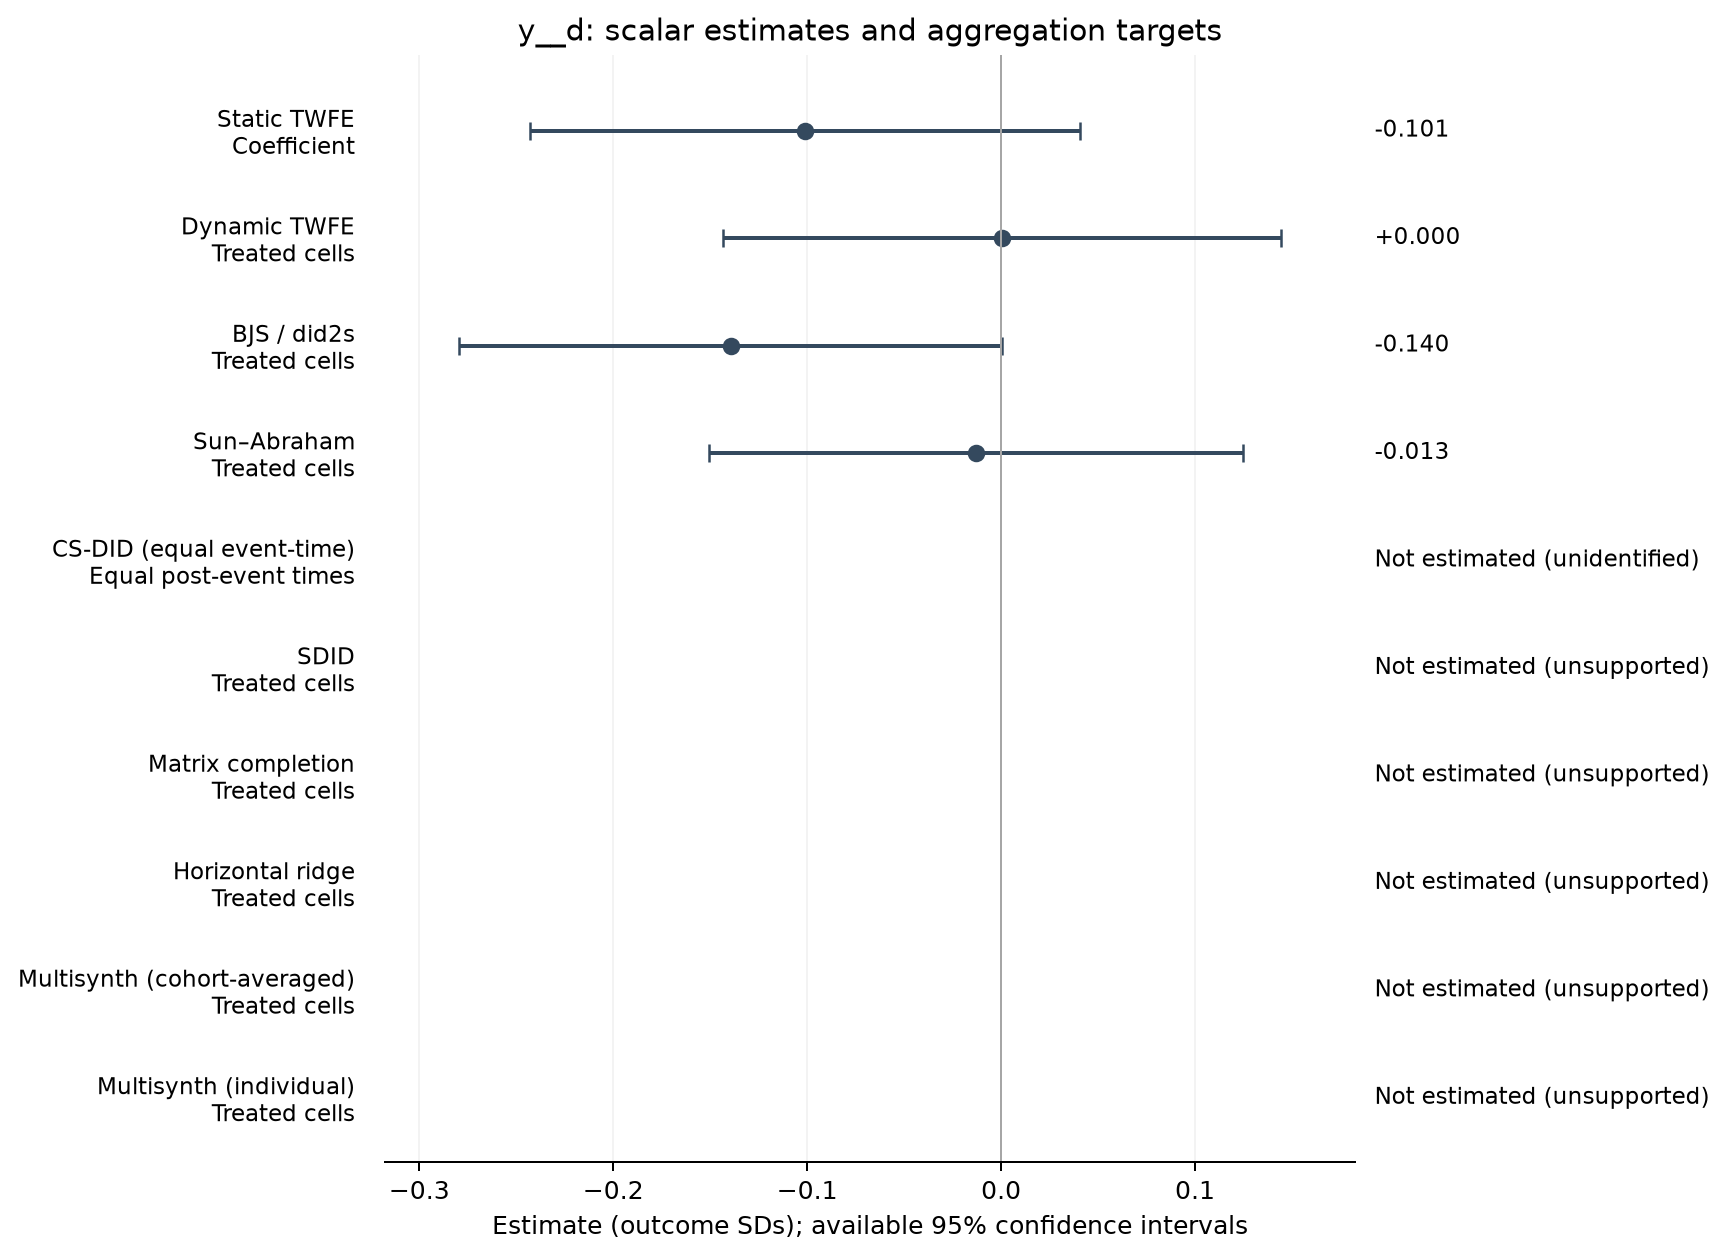
| Estimator | Estimate (SDs) | SE | 95% CI | Averaging |
|---|---|---|---|---|
| Static TWFE | -0.101 | 0.072 | [-0.243, 0.040] | Coefficient |
| Dynamic TWFE | 0.000 | 0.073 | [-0.144, 0.144] | Treated cells |
| BJS / did2s | -0.140 | 0.071 | [-0.280, 0.000] | Treated cells |
| Sun–Abraham | -0.013 | 0.070 | [-0.151, 0.125] | Treated cells |
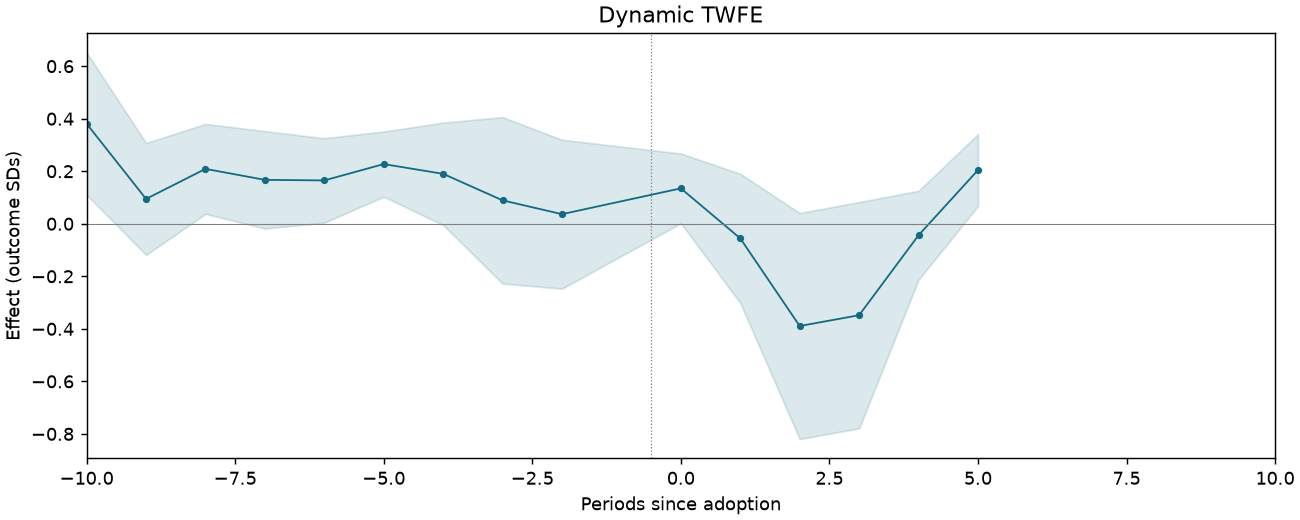
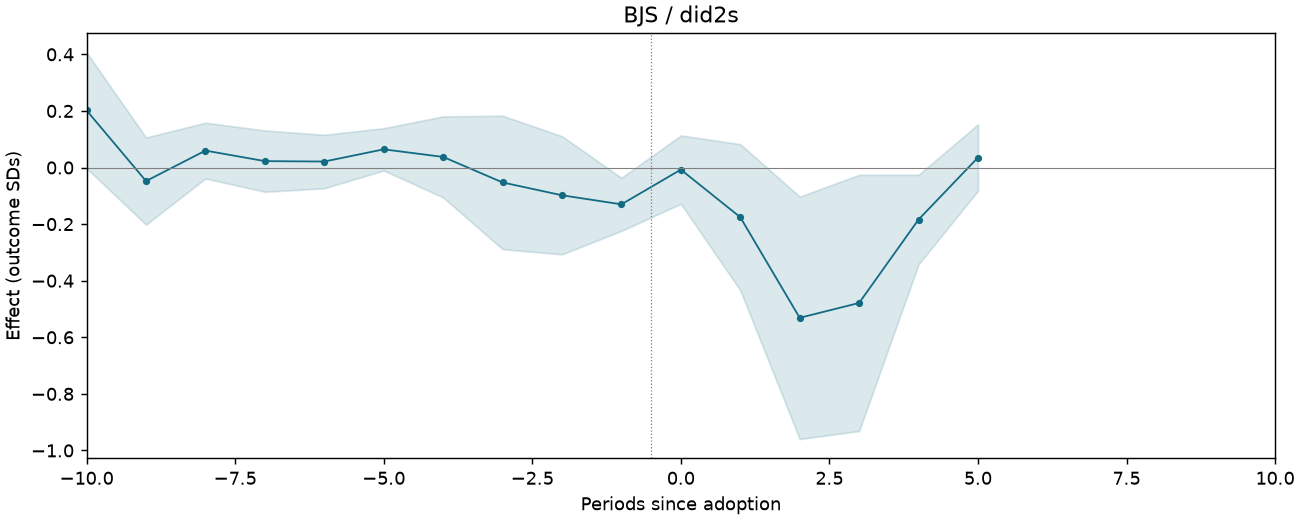
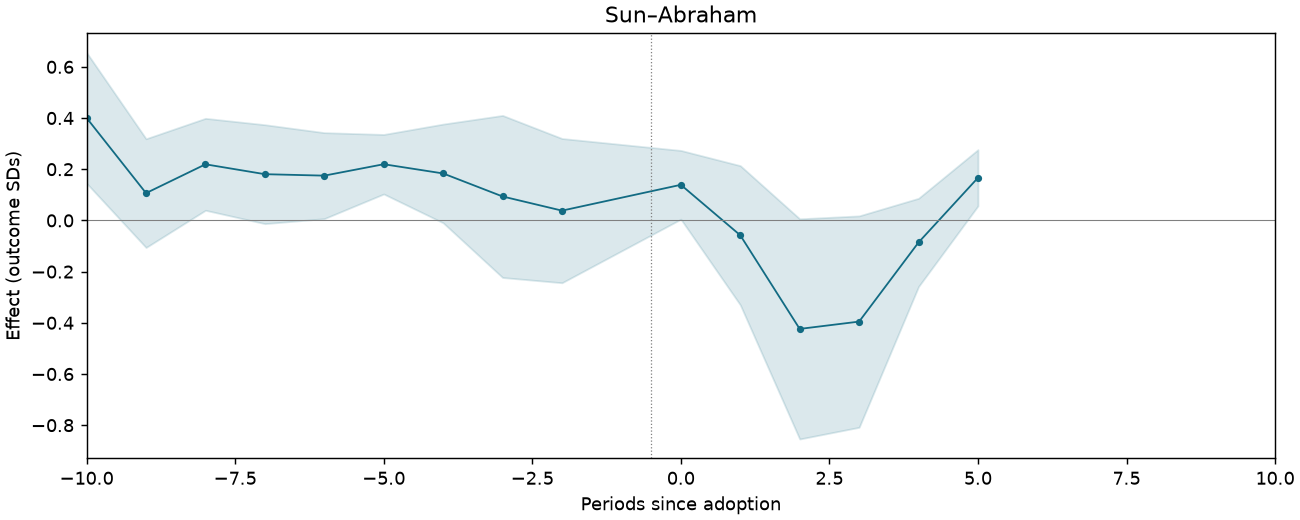
Event studies
Periods −10 to +10; pointwise 95% intervals where available.
REXER-F4-THEFT-CTRLSPATIAL-SHNONE-FESTATE-TRDI-SFULL
3,167 observations · 303 units · 303 clusters · 52 treated / 251 control units.
Estimate comparison
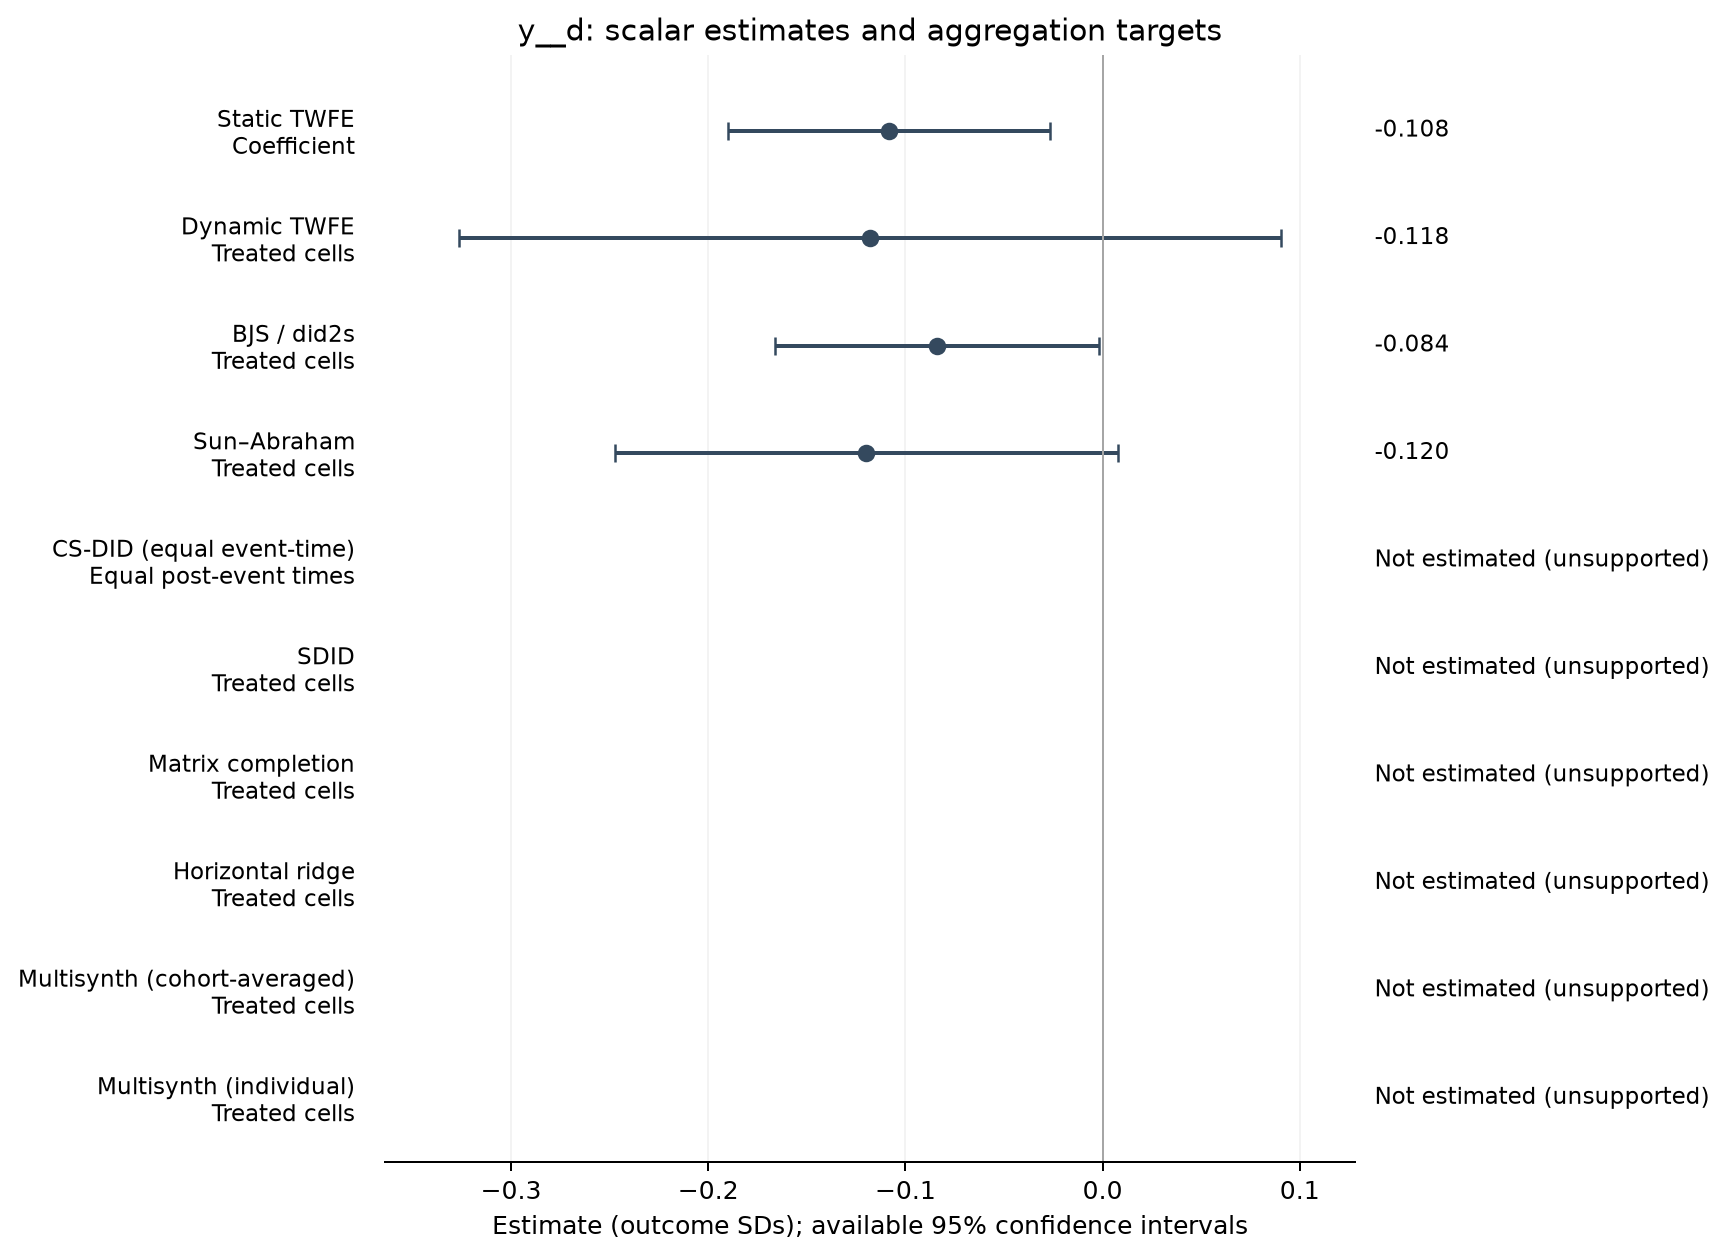
| Estimator | Estimate (SDs) | SE | 95% CI | Averaging |
|---|---|---|---|---|
| Static TWFE | -0.108 | 0.041 | [-0.190, -0.027] | Coefficient |
| Dynamic TWFE | -0.118 | 0.106 | [-0.326, 0.091] | Treated cells |
| BJS / did2s | -0.084 | 0.042 | [-0.166, -0.002] | Treated cells |
| Sun–Abraham | -0.120 | 0.065 | [-0.247, 0.008] | Treated cells |
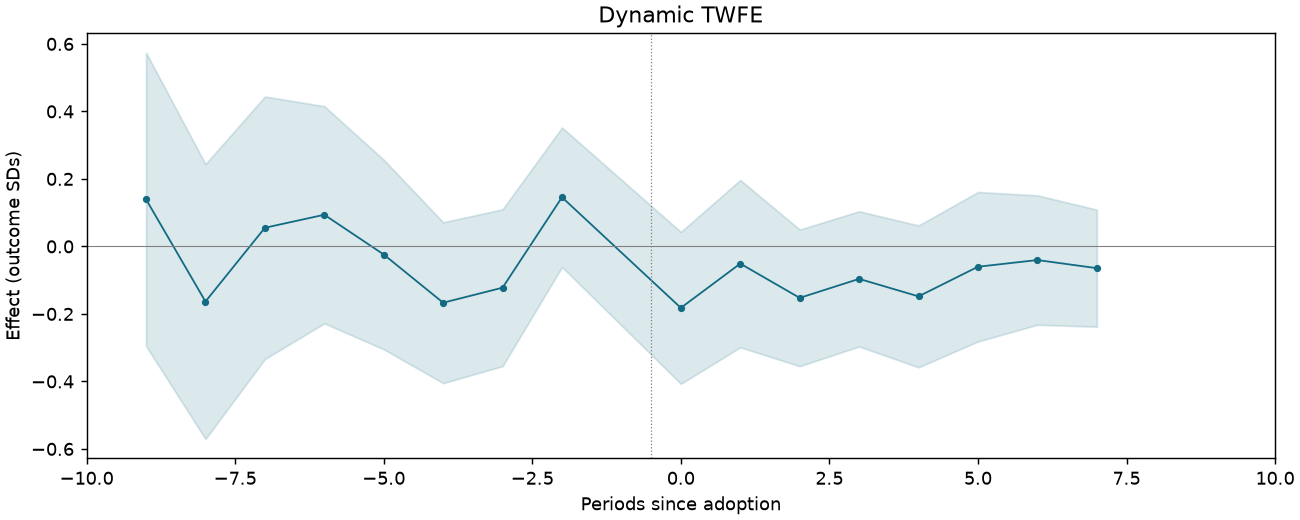
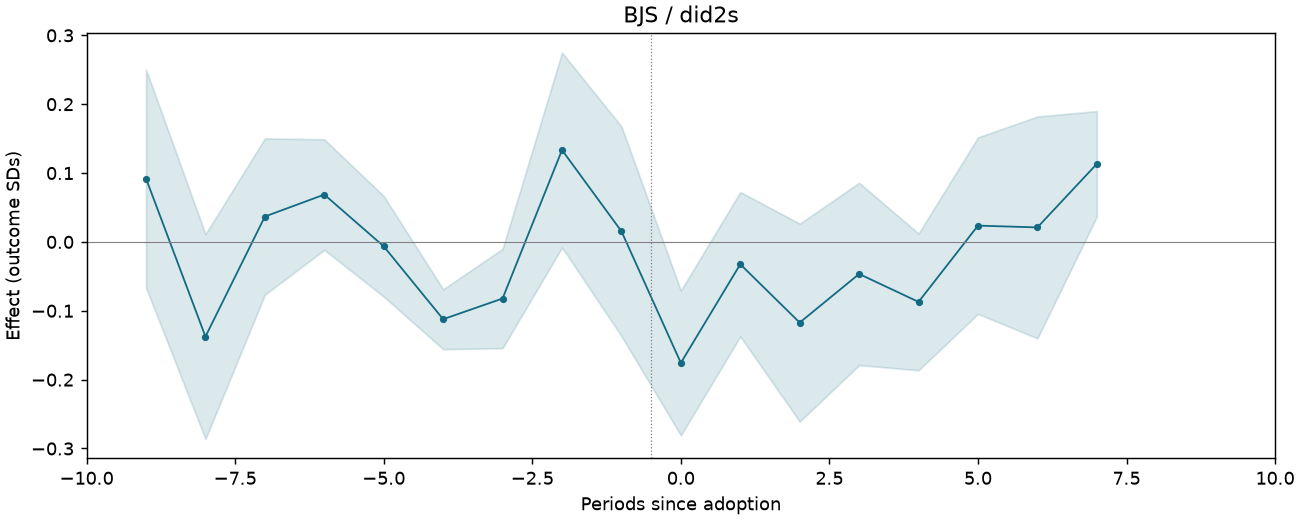
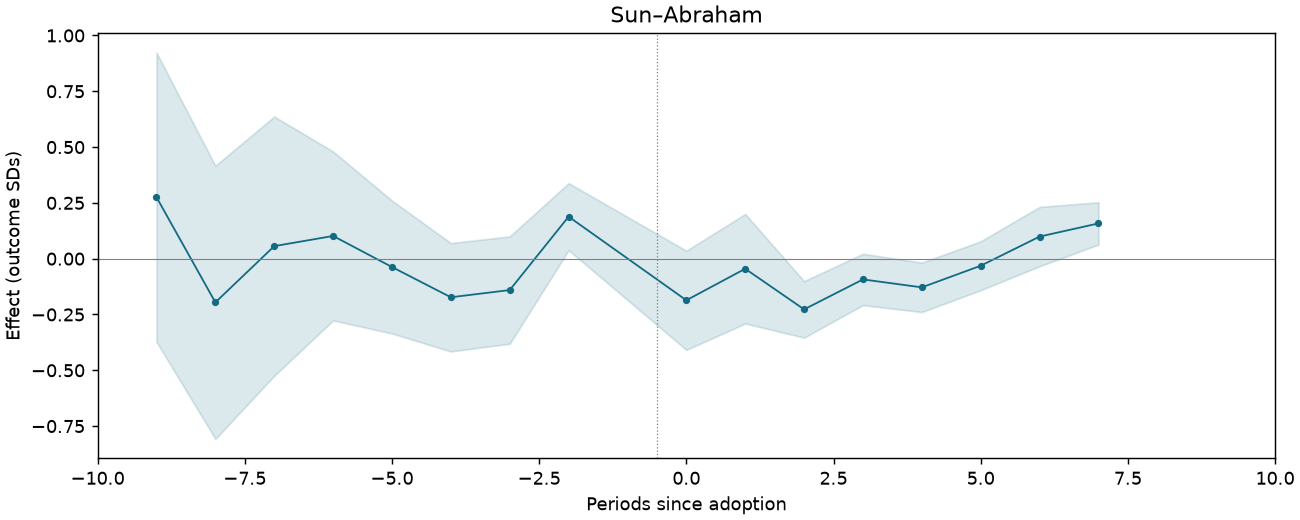
Event studies
Periods −10 to +10; pointwise 95% intervals where available.
REXER-F4-THEFT-CTRLSPATIAL-SHNONE-FESTATE-TRDI-SONSHORE
2,285 observations · 216 units · 216 clusters · 49 treated / 167 control units.
Estimate comparison
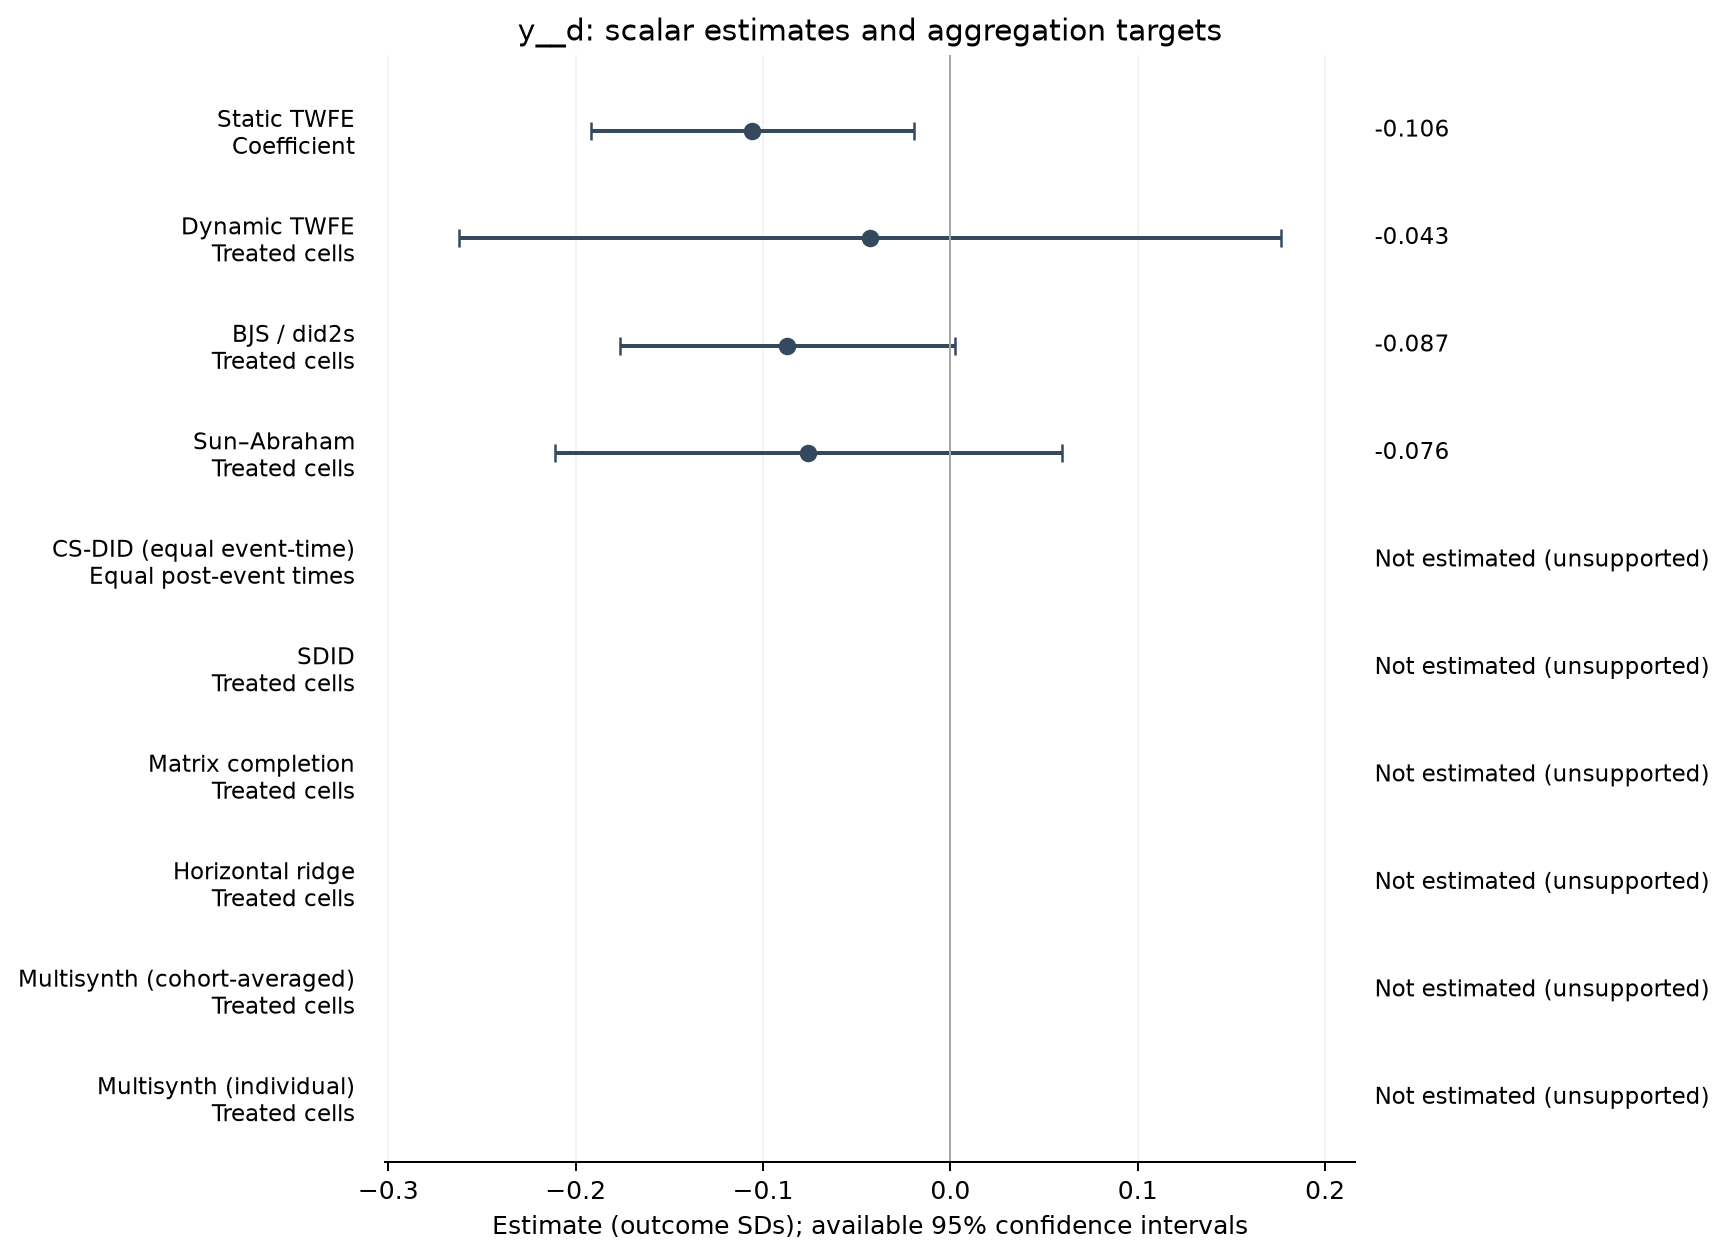
| Estimator | Estimate (SDs) | SE | 95% CI | Averaging |
|---|---|---|---|---|
| Static TWFE | -0.106 | 0.044 | [-0.192, -0.020] | Coefficient |
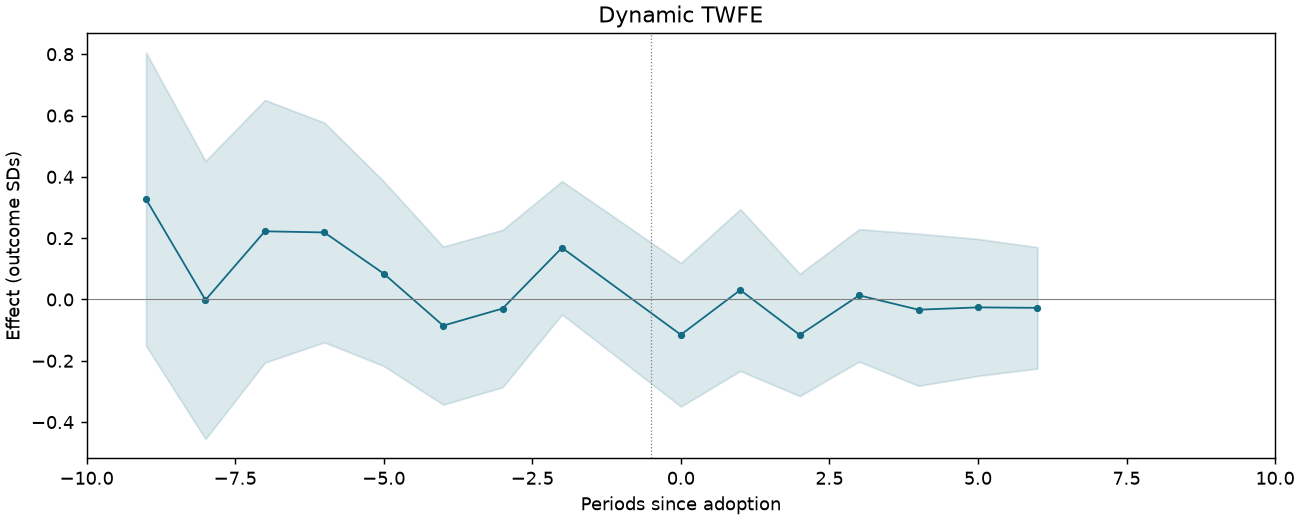
| Dynamic TWFE | -0.043 | 0.111 | [-0.262, 0.177] | Treated cells |
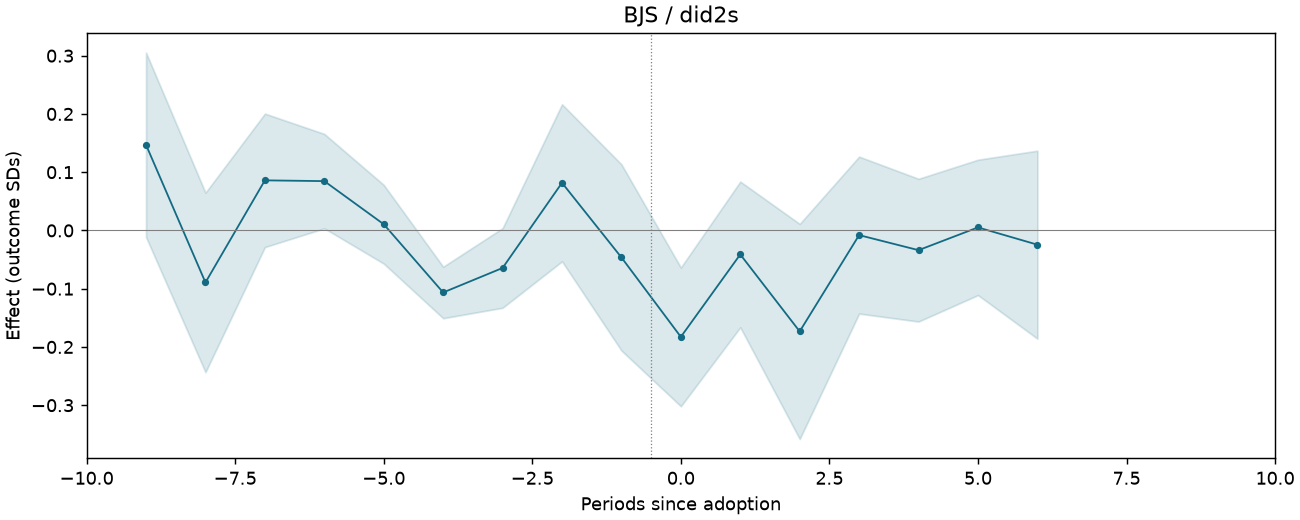
| BJS / did2s | -0.087 | 0.045 | [-0.176, 0.002] | Treated cells |
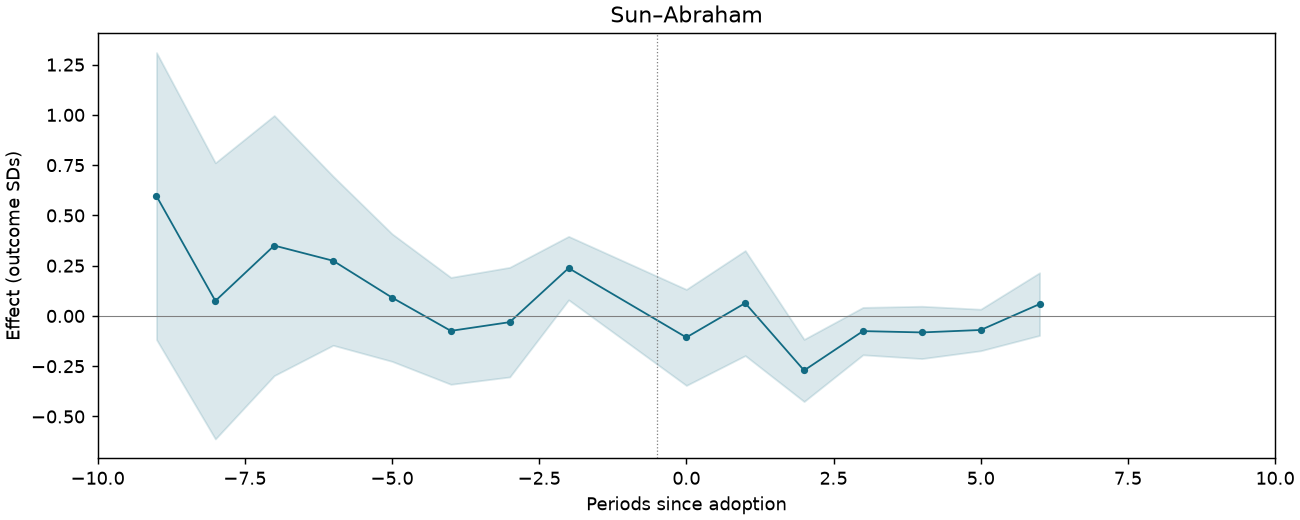
| Sun–Abraham | -0.076 | 0.069 | [-0.211, 0.060] | Treated cells |
Event studies
Periods −10 to +10; pointwise 95% intervals where available.
REXER-F4-THEFT-CTRLSPATIAL-SHNONE-FESTATE-TRDINNPC-SONSHORE
2,085 observations · 192 units · 192 clusters · 51 treated / 141 control units.
Estimate comparison
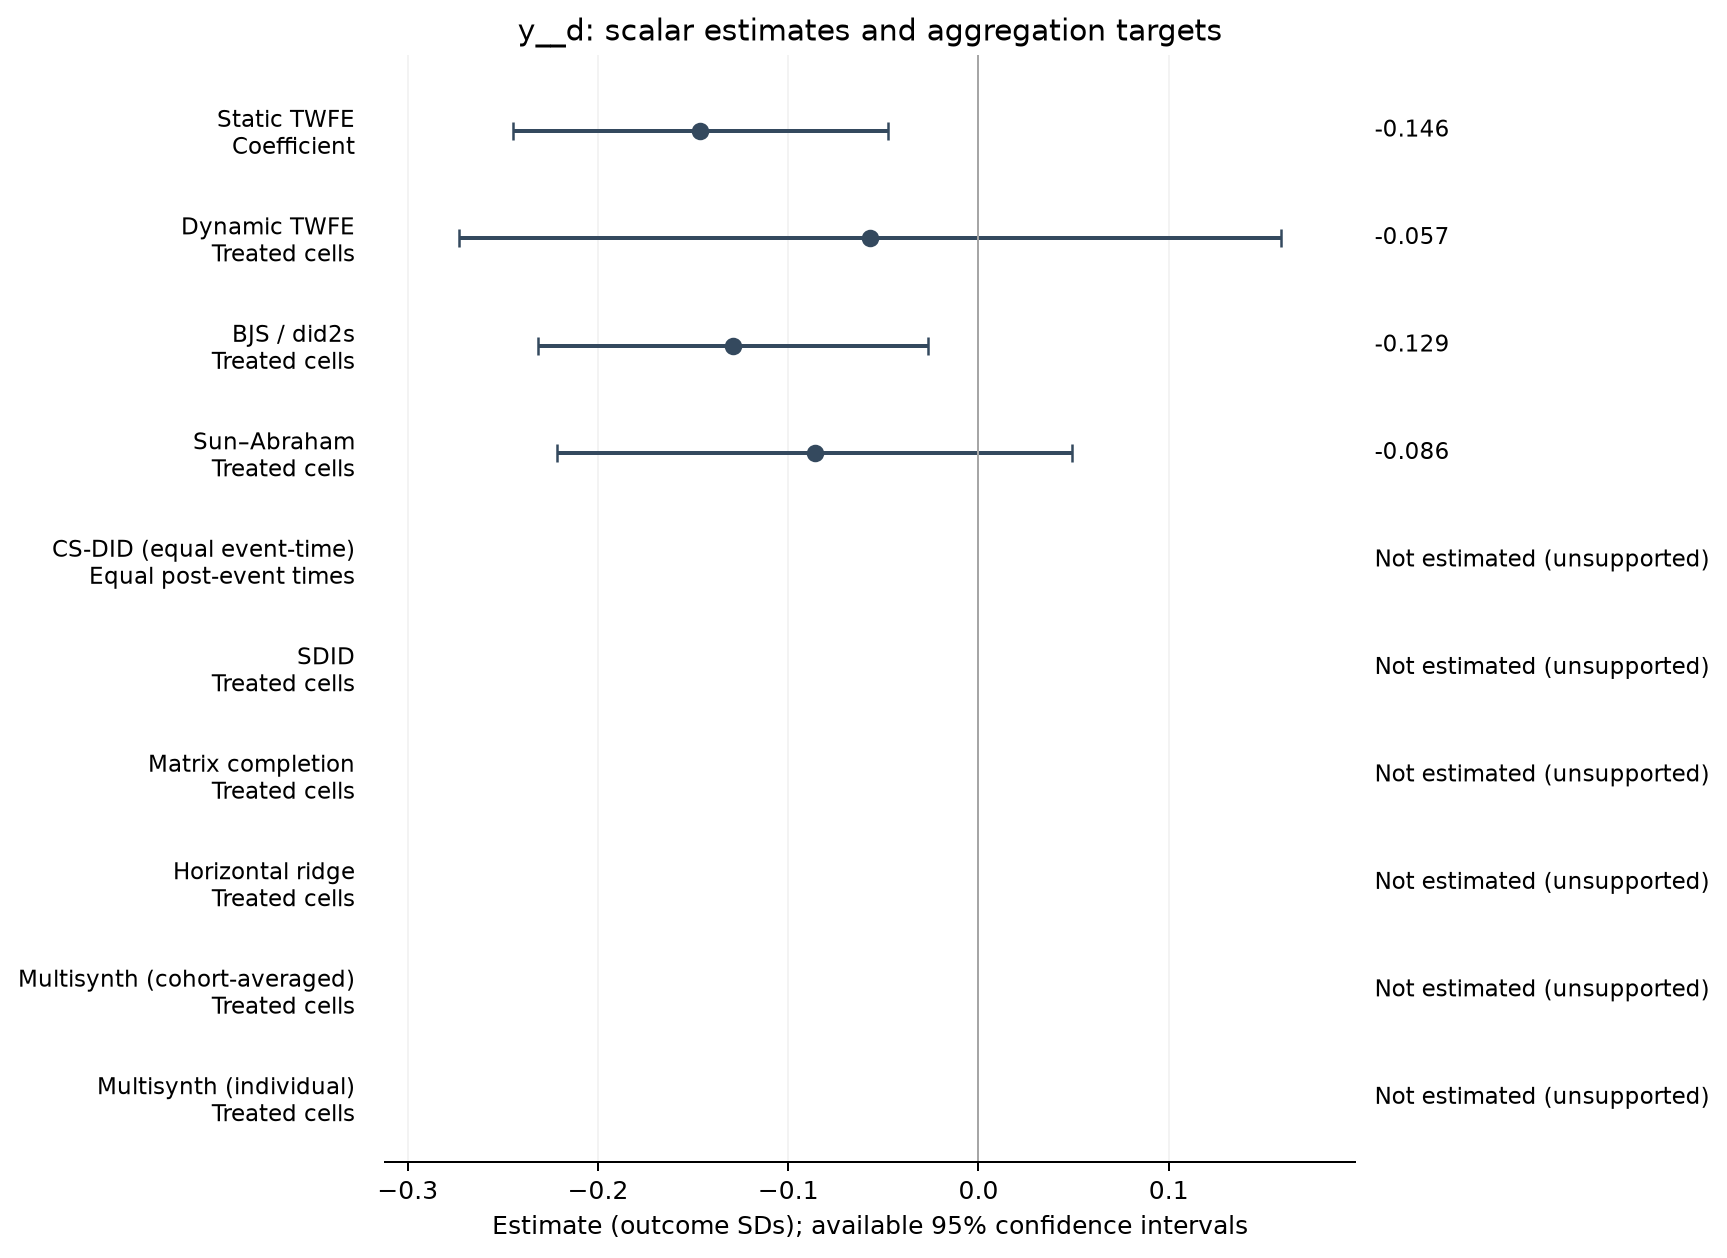
| Estimator | Estimate (SDs) | SE | 95% CI | Averaging |
|---|---|---|---|---|
| Static TWFE | -0.146 | 0.050 | [-0.245, -0.048] | Coefficient |
| Dynamic TWFE | -0.057 | 0.110 | [-0.273, 0.159] | Treated cells |
| BJS / did2s | -0.129 | 0.052 | [-0.231, -0.027] | Treated cells |
| Sun–Abraham | -0.086 | 0.069 | [-0.222, 0.049] | Treated cells |
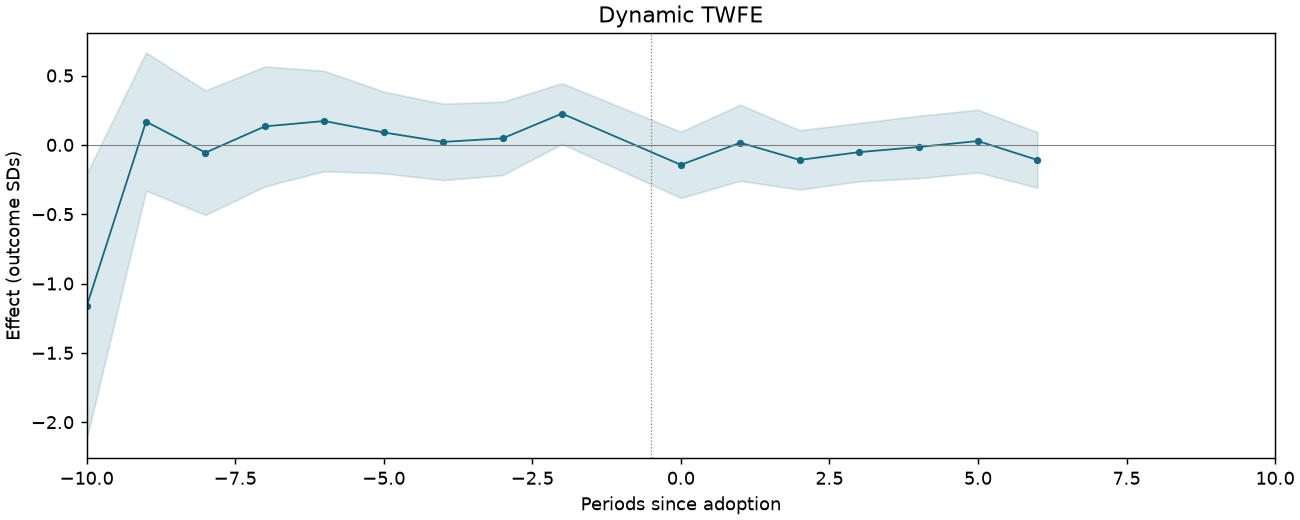
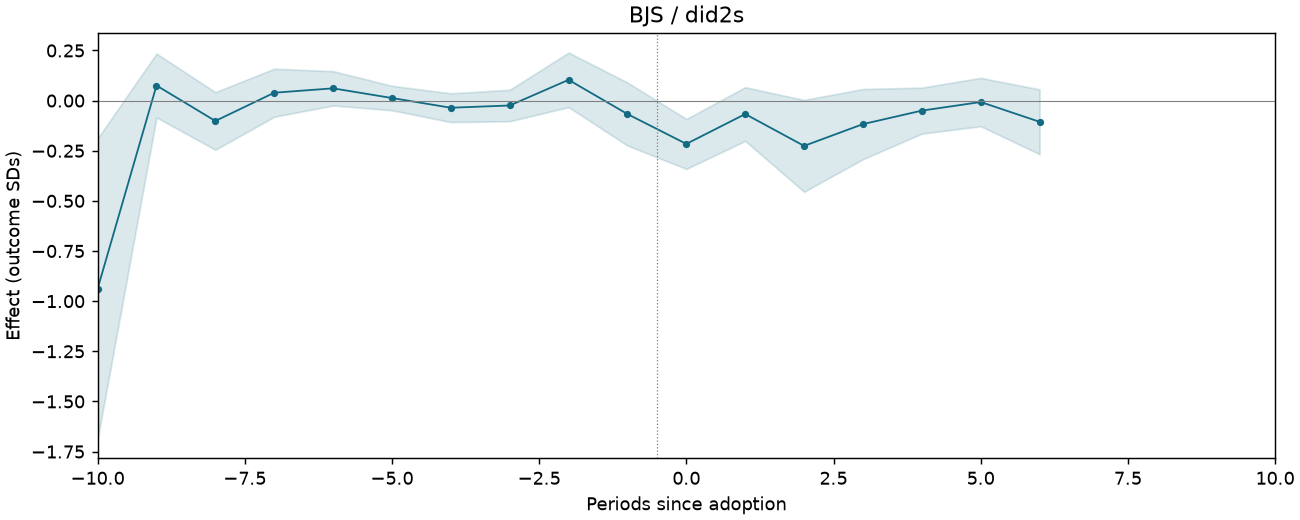
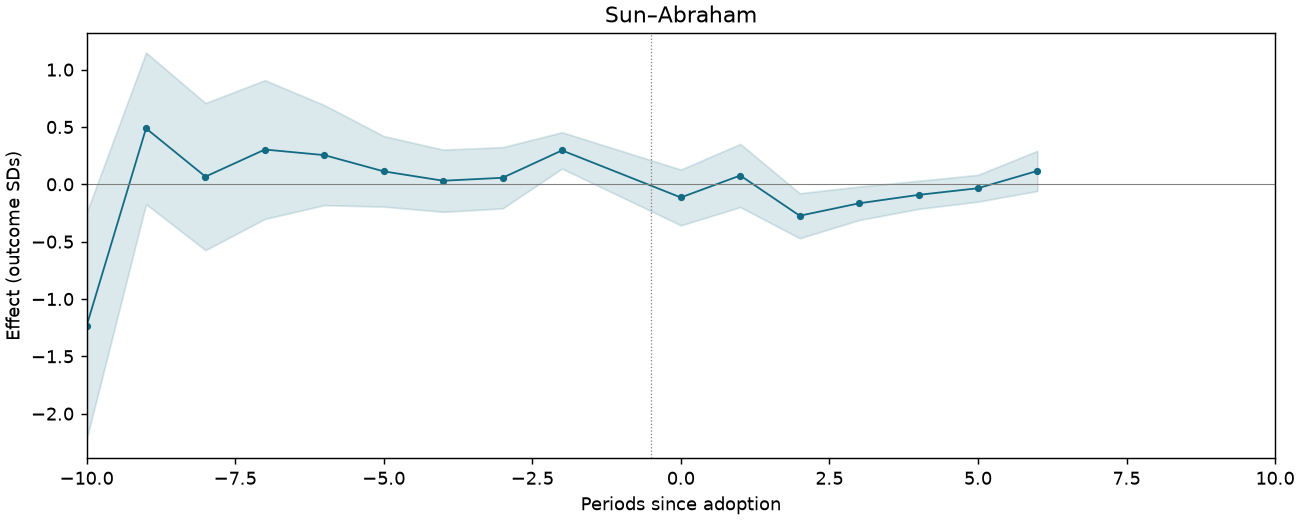
Event studies
Periods −10 to +10; pointwise 95% intervals where available.
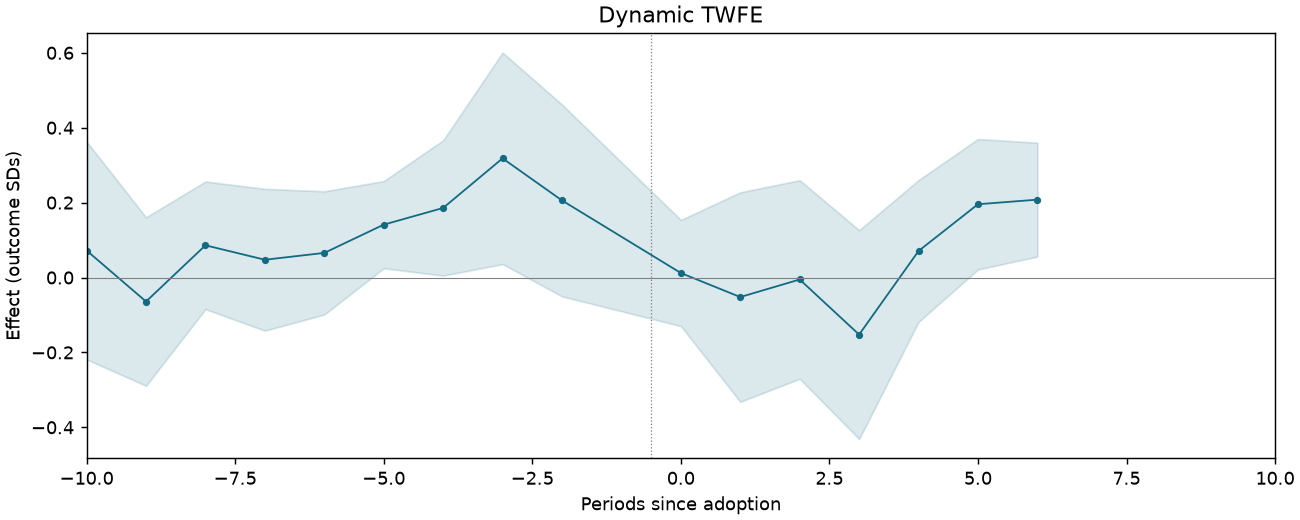
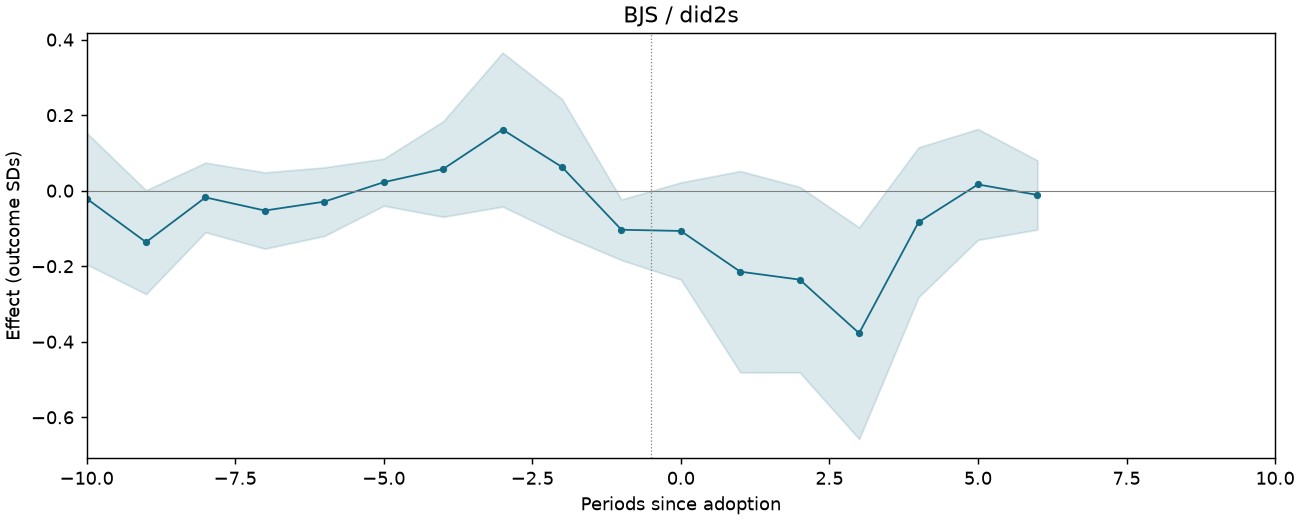
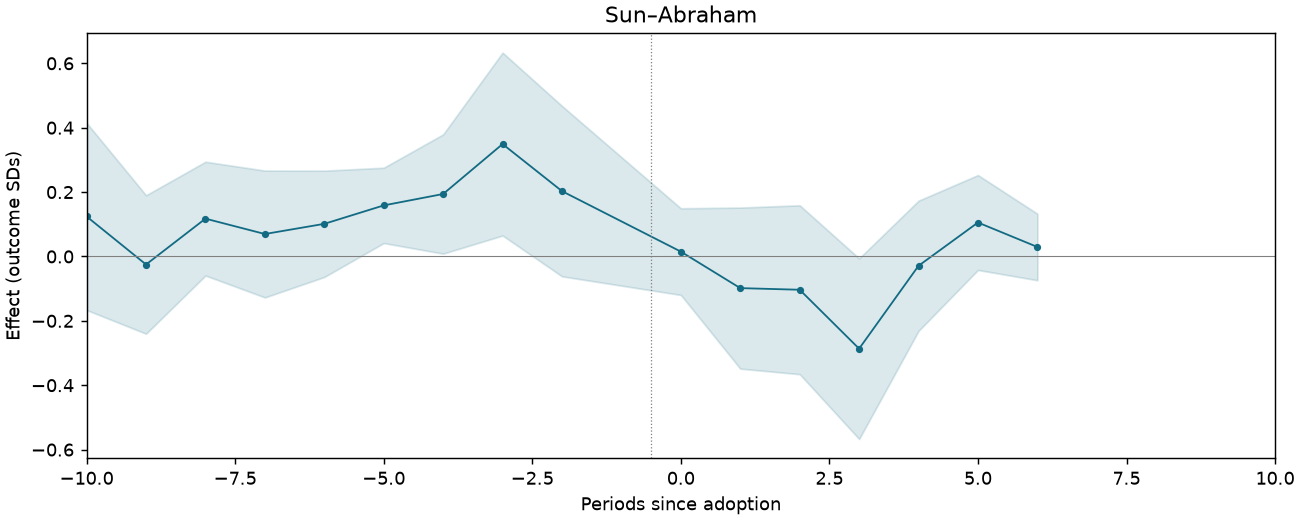
REXER-F4-THEFT-CTRLSPATIAL-SHNONE-FESTATE-TRNNPC-SFULL
2,895 observations · 271 units · 271 clusters · 32 treated / 239 control units.
Estimate comparison
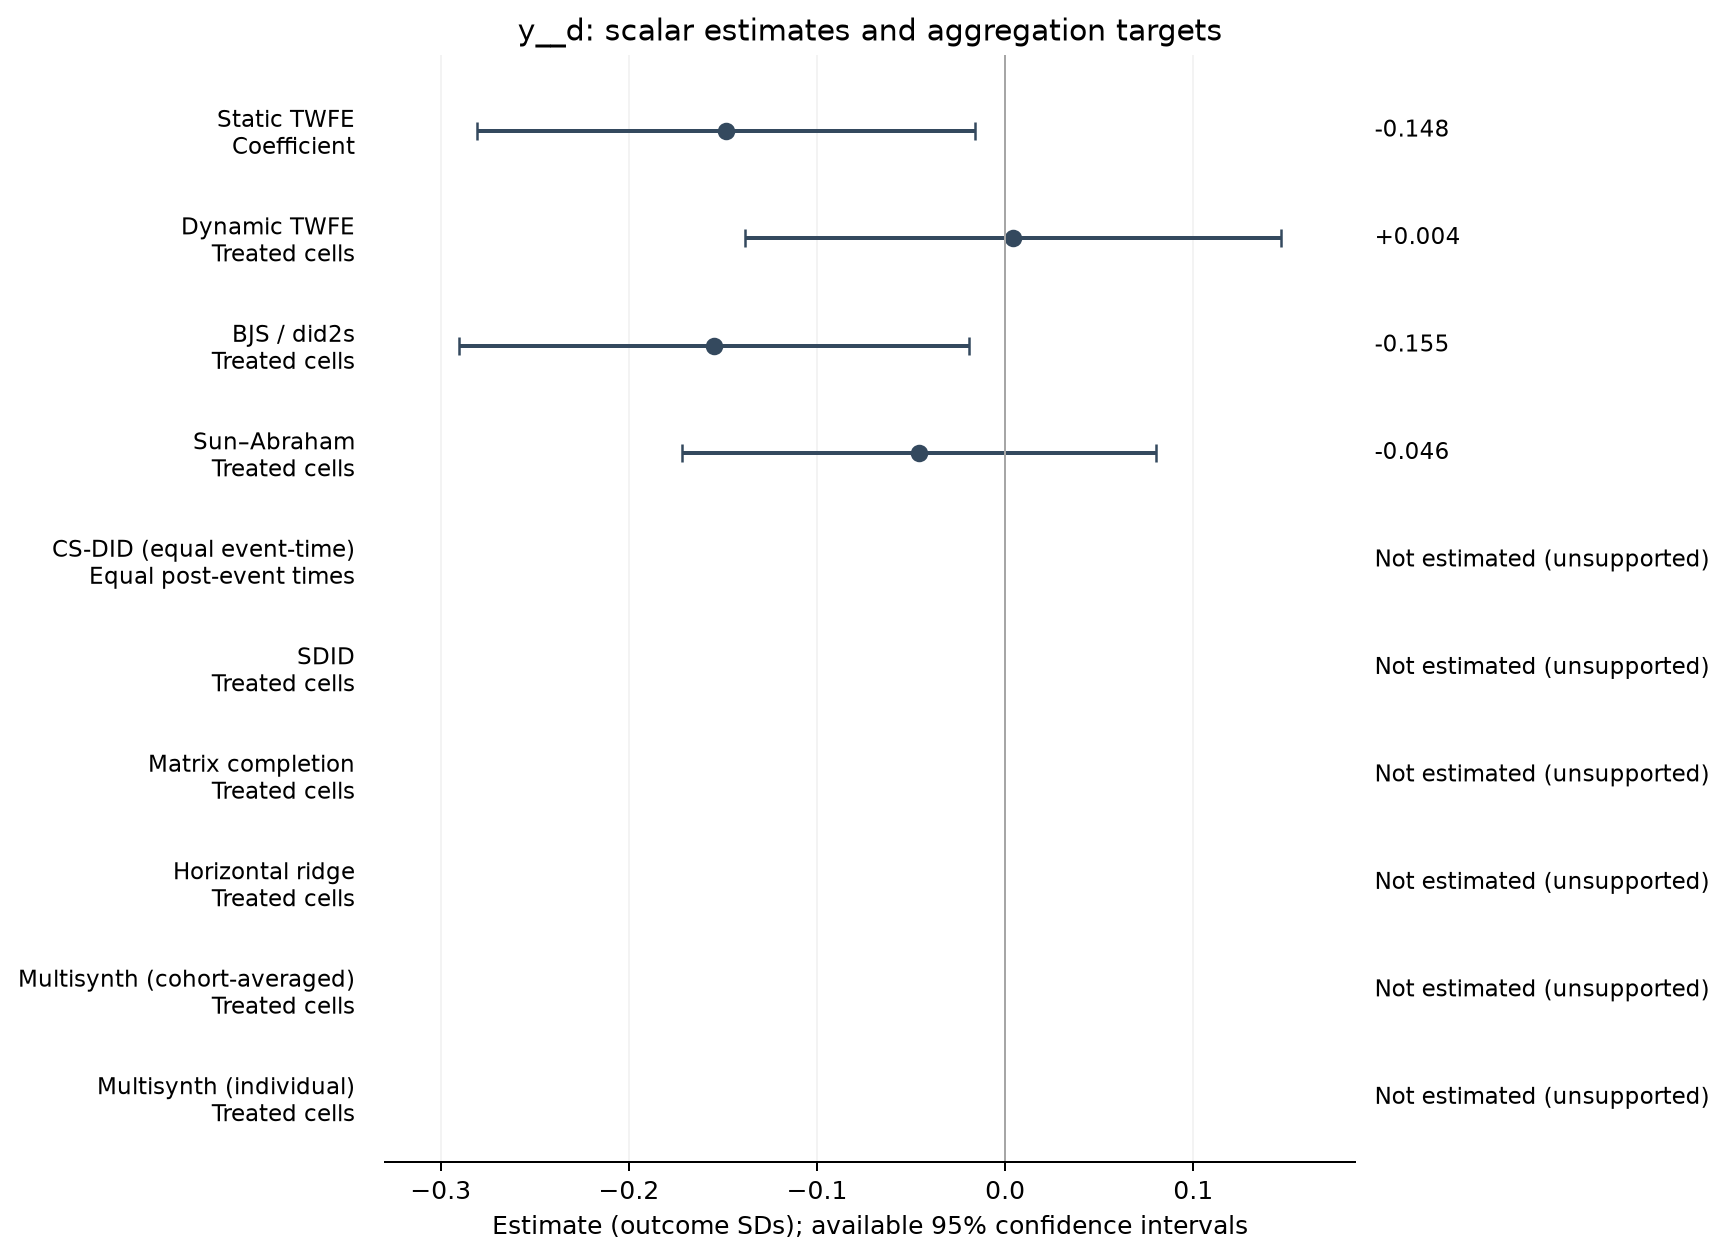
| Estimator | Estimate (SDs) | SE | 95% CI | Averaging |
|---|---|---|---|---|
| Static TWFE | -0.148 | 0.067 | [-0.281, -0.016] | Coefficient |
| Dynamic TWFE | 0.004 | 0.072 | [-0.138, 0.147] | Treated cells |
| BJS / did2s | -0.155 | 0.069 | [-0.290, -0.019] | Treated cells |
| Sun–Abraham | -0.046 | 0.064 | [-0.172, 0.080] | Treated cells |
Event studies
Periods −10 to +10; pointwise 95% intervals where available.
REXER-F4-THEFT-CTRLSPATIAL-SHNONE-FESTATE-TRNNPC-SONSHORE
2,085 observations · 192 units · 192 clusters · 29 treated / 163 control units.
Estimate comparison
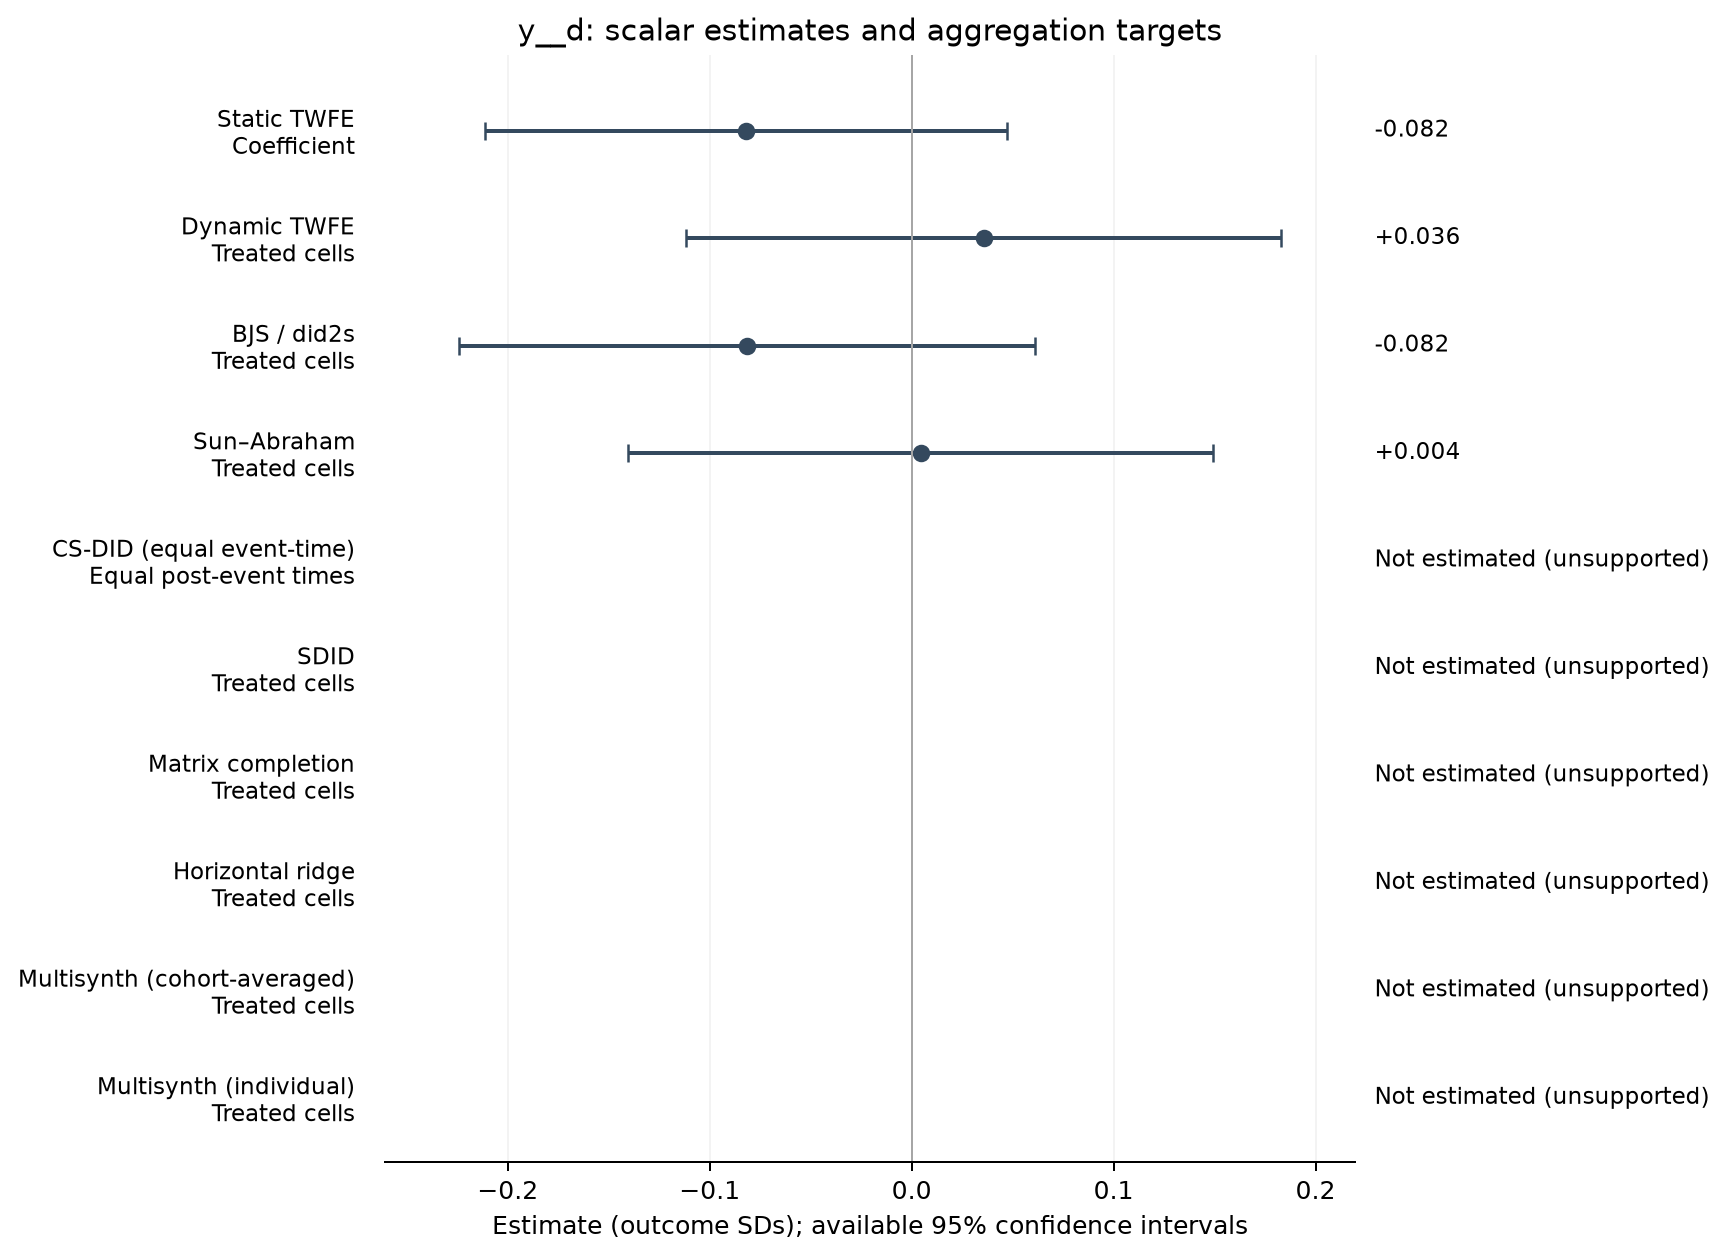
| Estimator | Estimate (SDs) | SE | 95% CI | Averaging |
|---|---|---|---|---|
| Static TWFE | -0.082 | 0.065 | [-0.211, 0.047] | Coefficient |
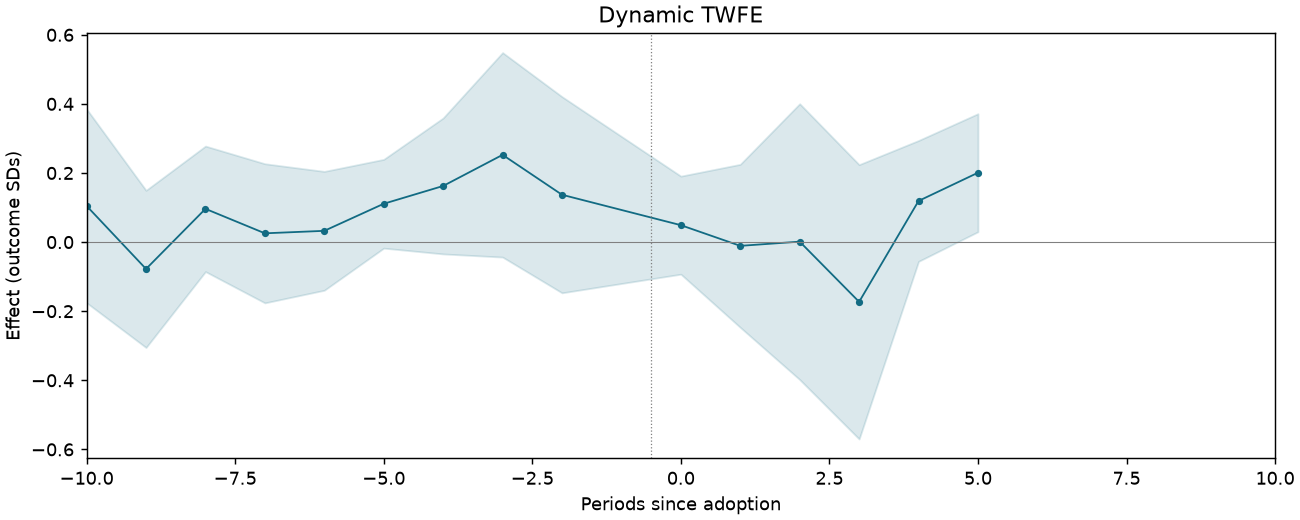
| Dynamic TWFE | 0.036 | 0.075 | [-0.112, 0.183] | Treated cells |
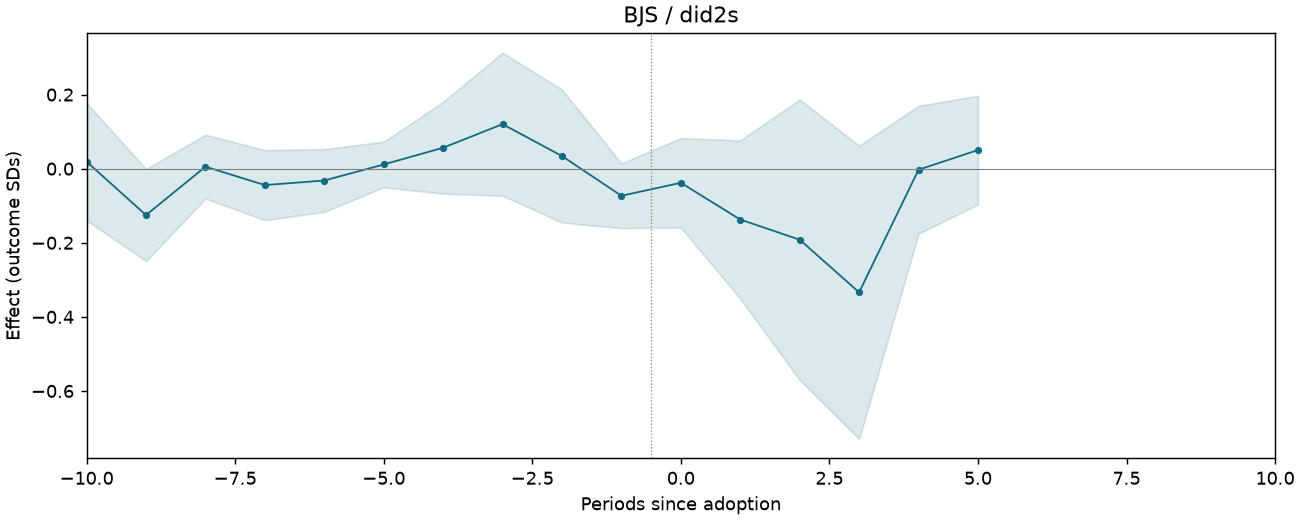
| BJS / did2s | -0.082 | 0.072 | [-0.224, 0.061] | Treated cells |
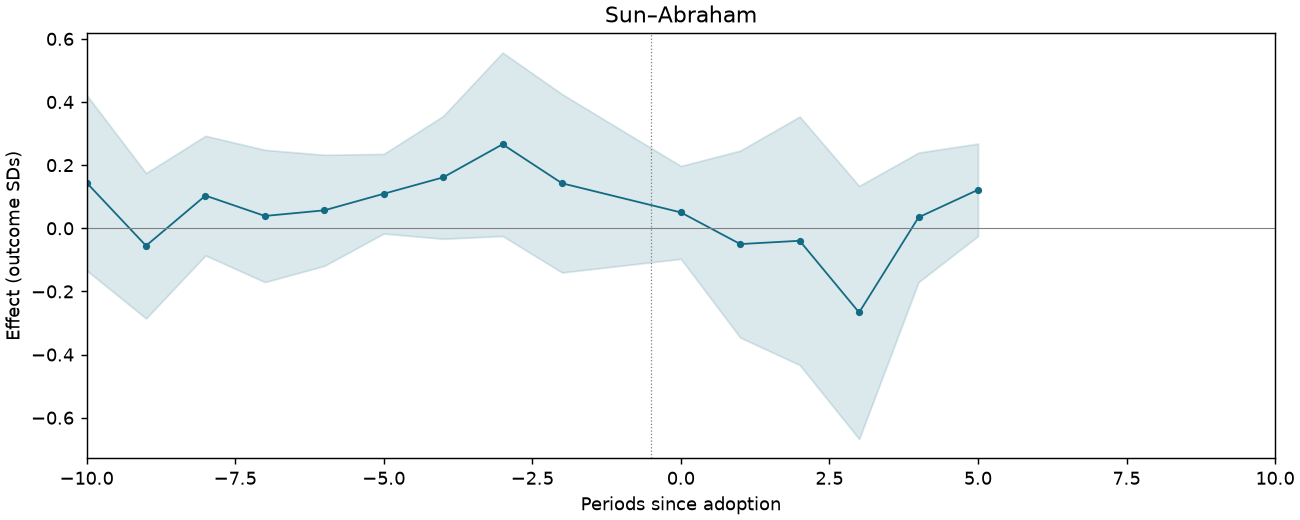
| Sun–Abraham | 0.004 | 0.073 | [-0.140, 0.149] | Treated cells |
Event studies
Periods −10 to +10; pointwise 95% intervals where available.
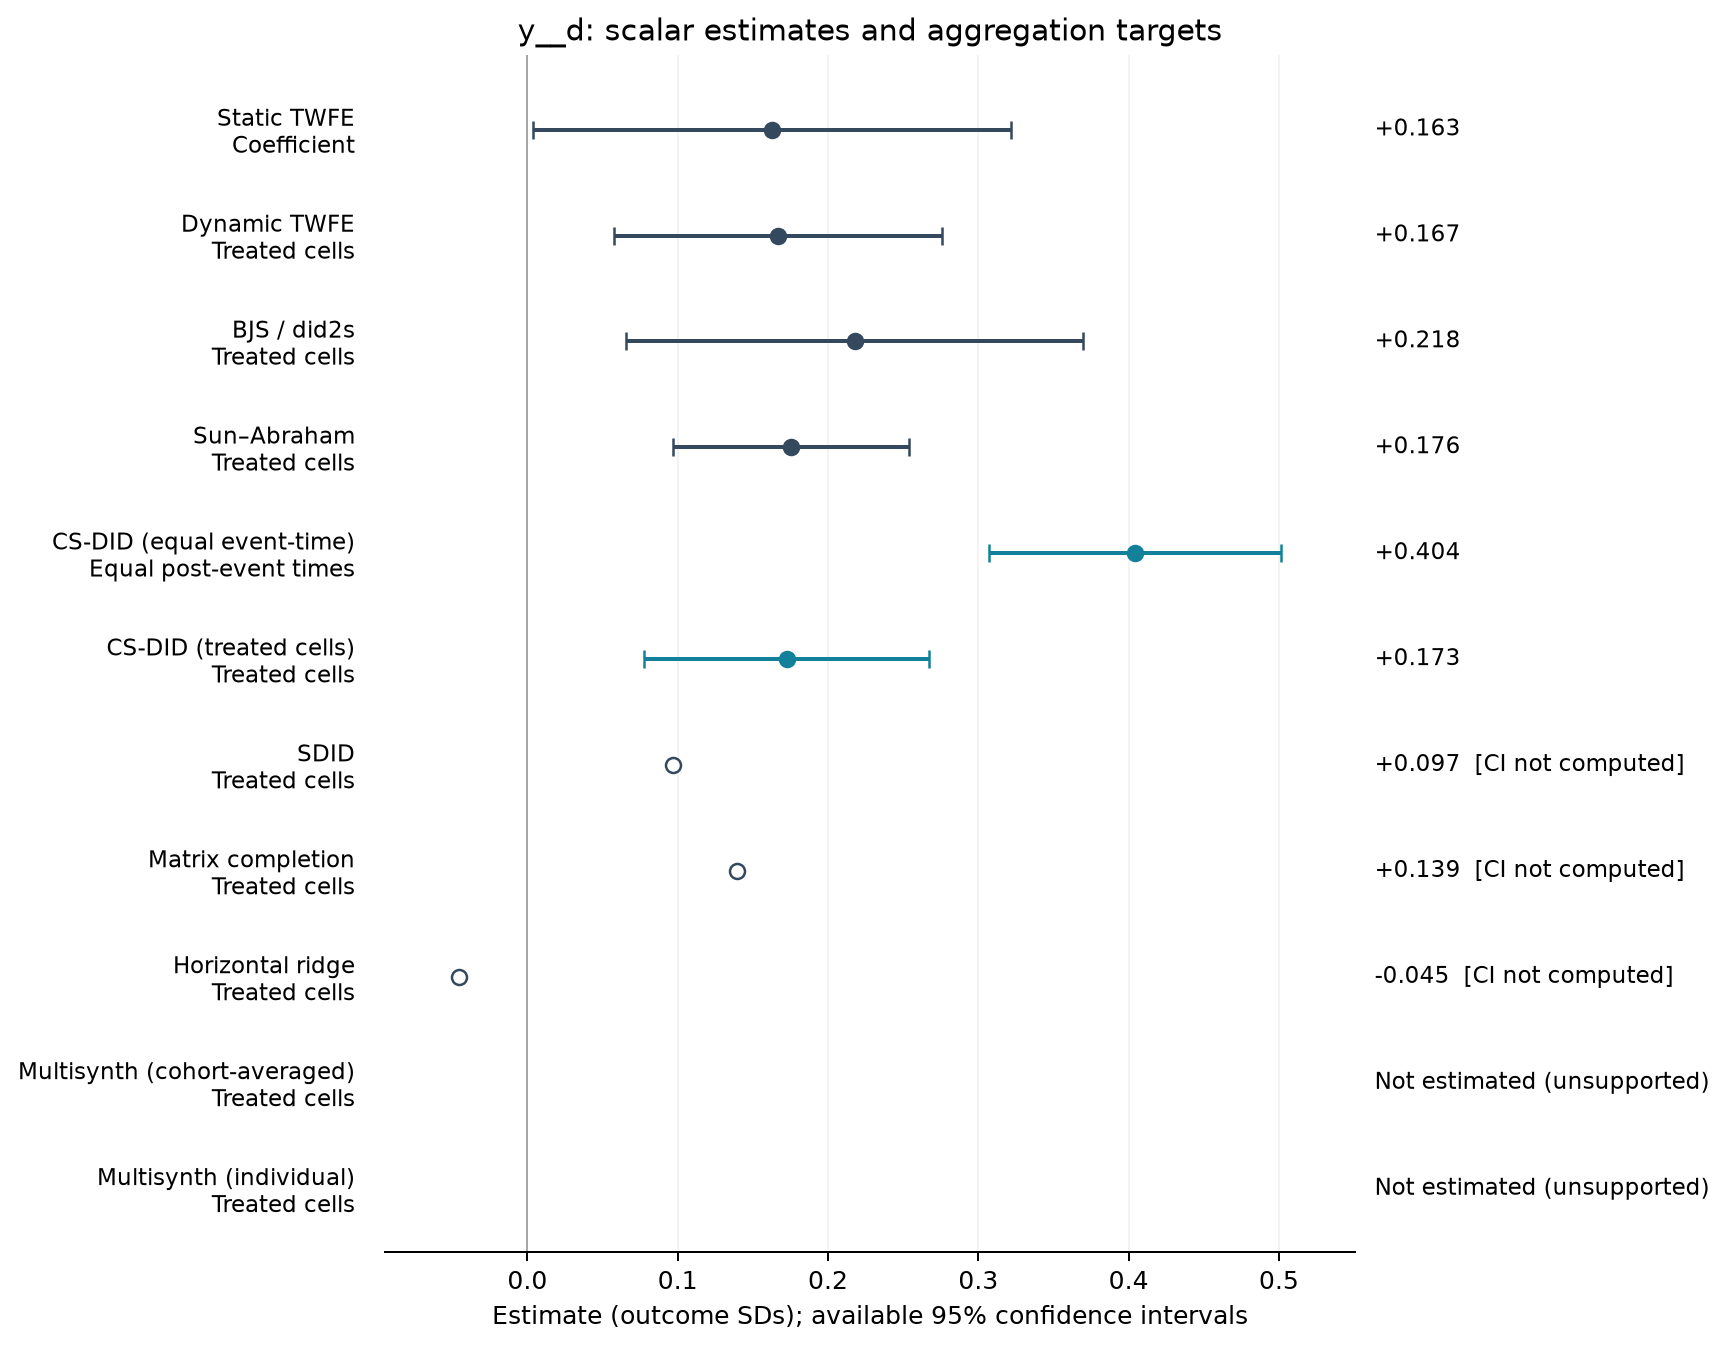
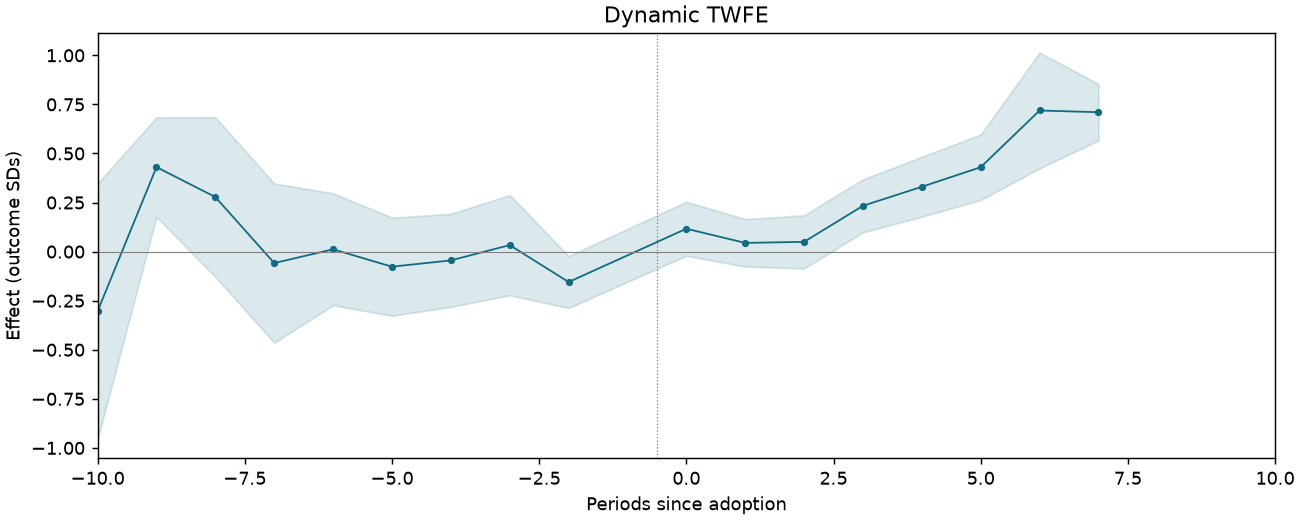
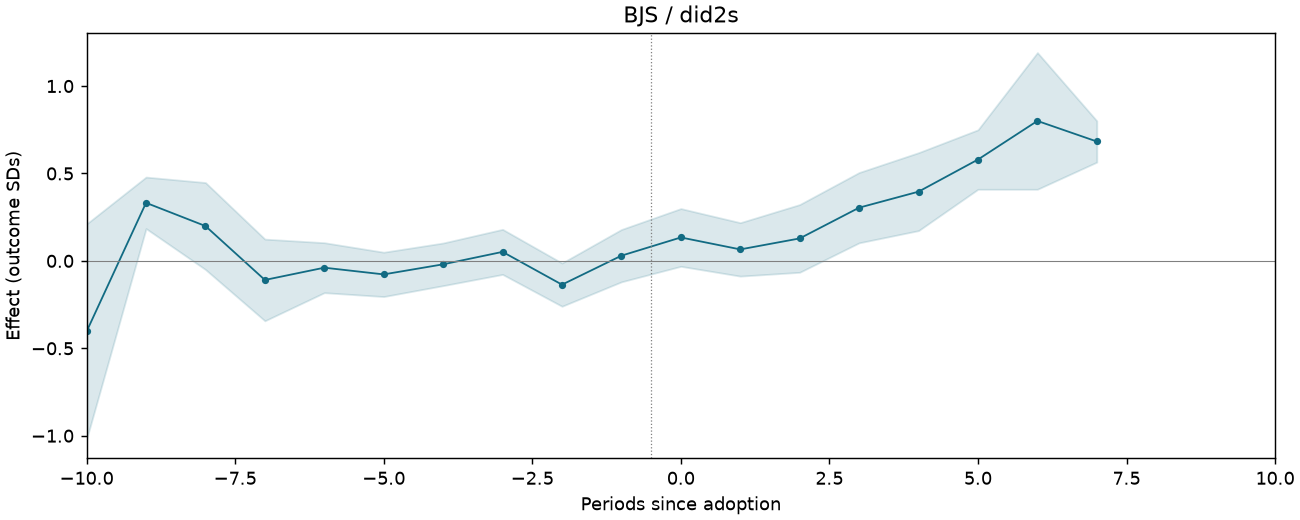
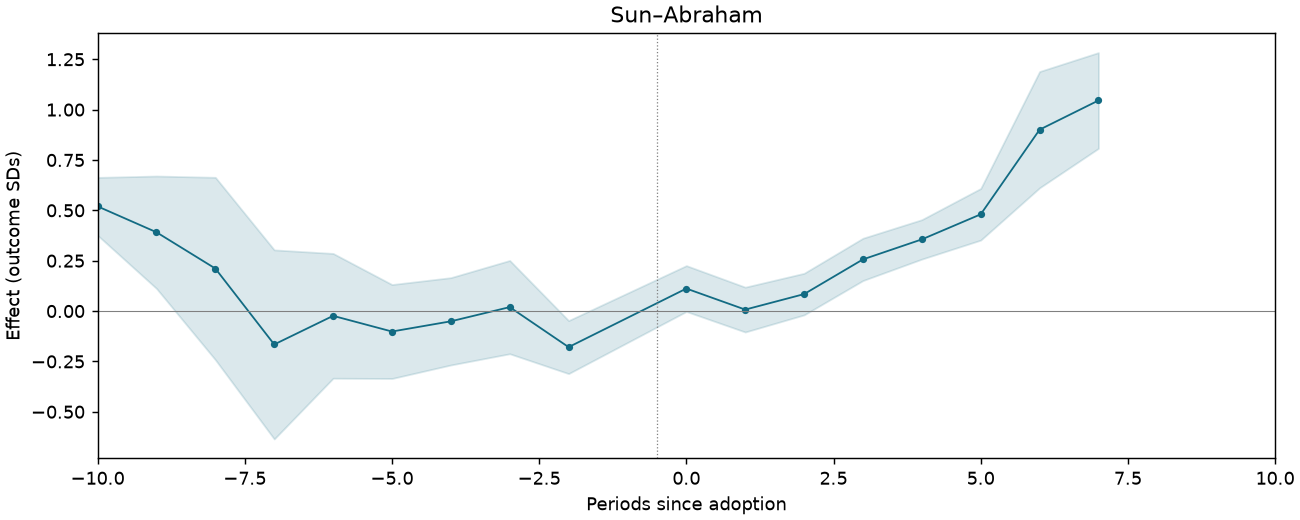
Operational oil spills: count of non-sabotage spills within 15 km of the field
2,895 observations · 271 units · 271 clusters · 56 treated / 215 control units.
Estimate comparison
| Estimator | Estimate (SDs) | SE | 95% CI | Averaging |
|---|---|---|---|---|
| Static TWFE | 0.163 | 0.081 | [0.004, 0.322] | Coefficient |
| Dynamic TWFE | 0.167 | 0.055 | [0.057, 0.276] | Treated cells |
| BJS / did2s | 0.218 | 0.077 | [0.066, 0.370] | Treated cells |
| Sun–Abraham | 0.176 | 0.040 | [0.097, 0.254] | Treated cells |
| CS-DID (equal event-time) | 0.404 | 0.050 | [0.307, 0.502] | Equal post-event times |
| CS-DID (treated cells) | 0.173 | 0.048 | [0.078, 0.267] | Treated cells |
| SDID | 0.097 | — | — | Treated cells |
| Matrix completion | 0.139 | — | — | Treated cells |
| Horizontal ridge | -0.045 | — | — | Treated cells |
Event studies
Periods −10 to +10; pointwise 95% intervals where available.
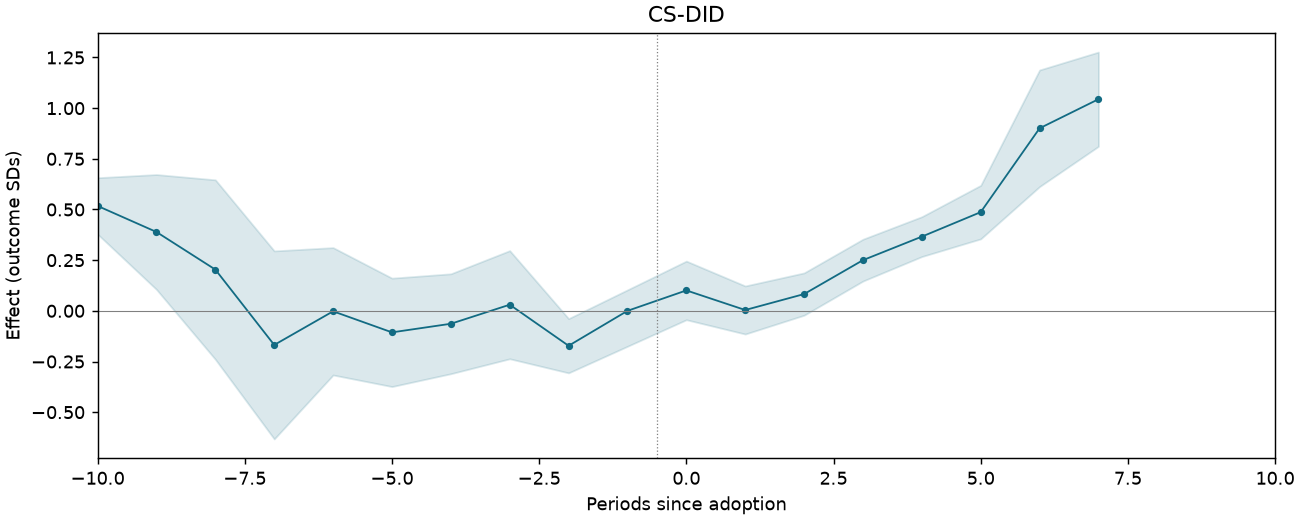
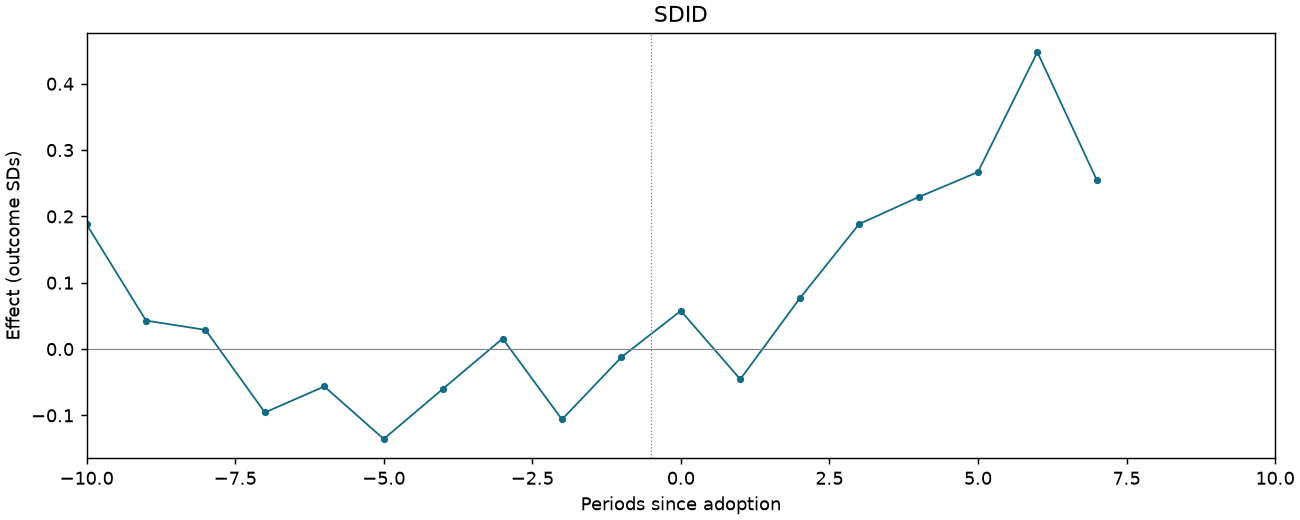
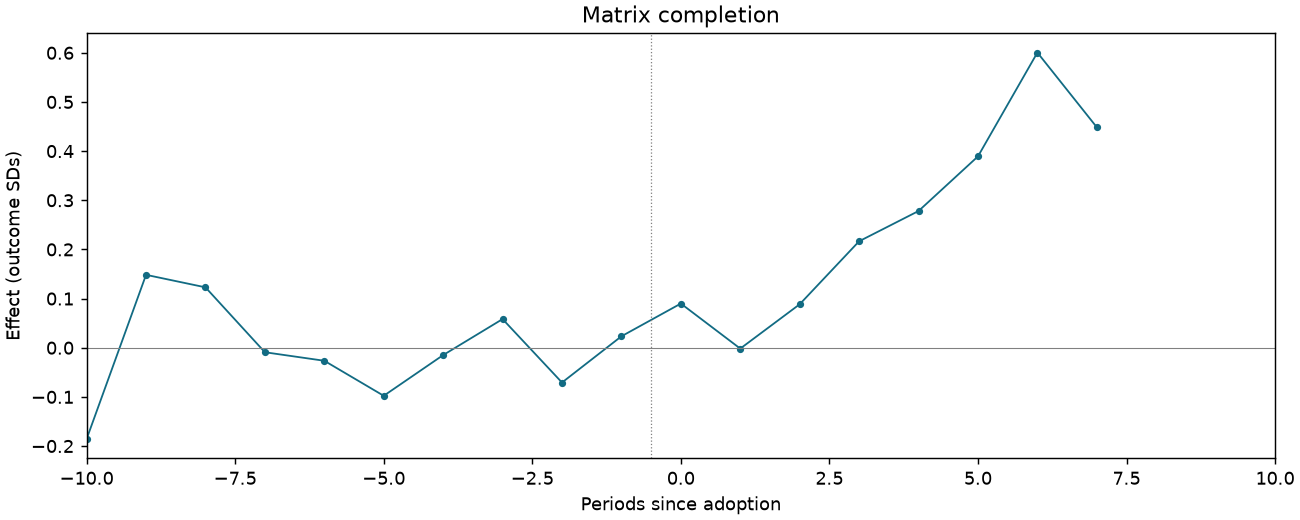
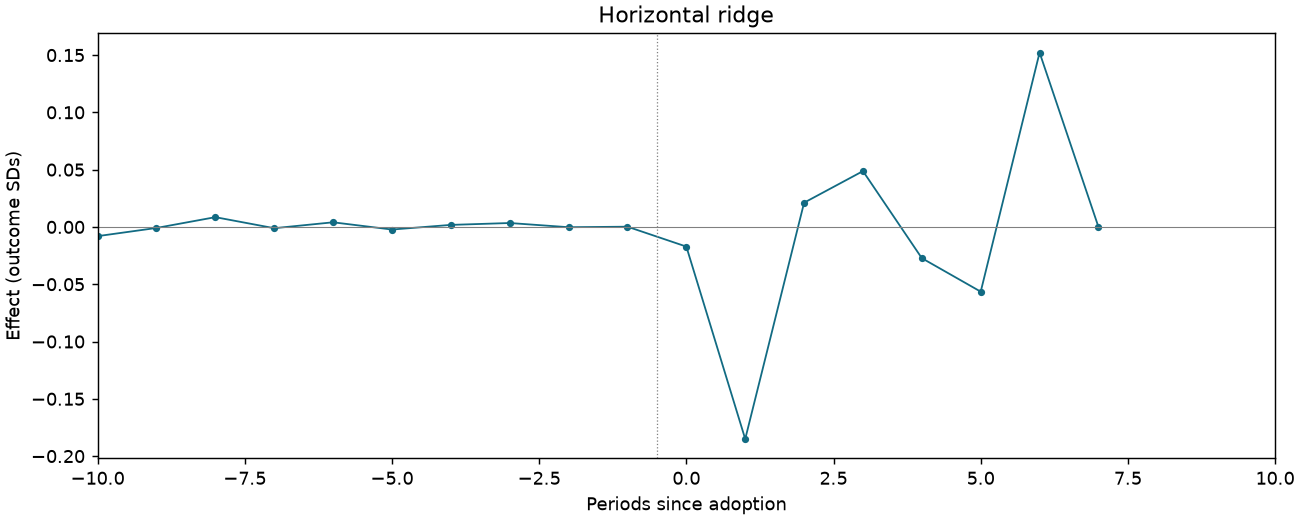
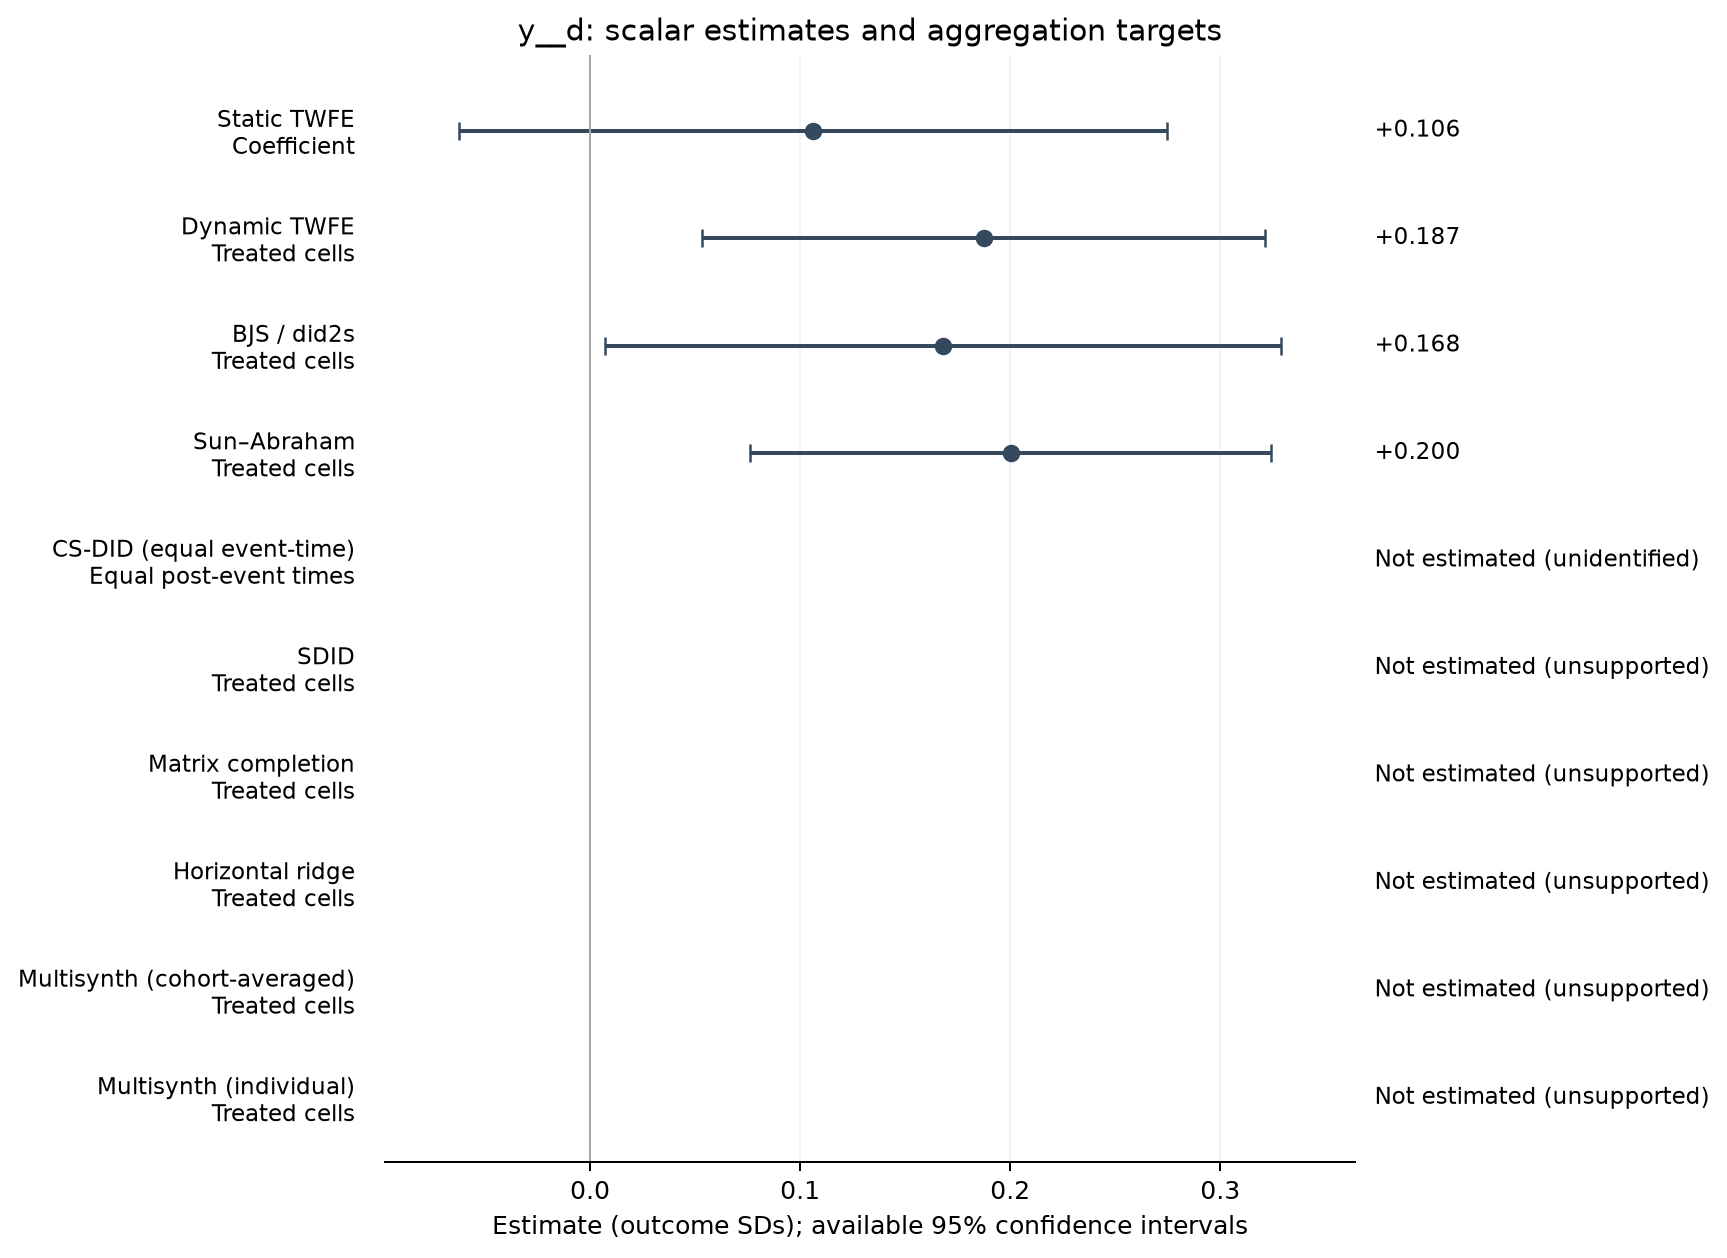
REXER-T1-PB-SPILLS-C2
2,895 observations · 271 units · 271 clusters · 56 treated / 215 control units.
Estimate comparison
| Estimator | Estimate (SDs) | SE | 95% CI | Averaging |
|---|---|---|---|---|
| Static TWFE | 0.106 | 0.086 | [-0.062, 0.275] | Coefficient |
| Dynamic TWFE | 0.187 | 0.068 | [0.053, 0.321] | Treated cells |
| BJS / did2s | 0.168 | 0.082 | [0.007, 0.329] | Treated cells |
| Sun–Abraham | 0.200 | 0.063 | [0.076, 0.324] | Treated cells |
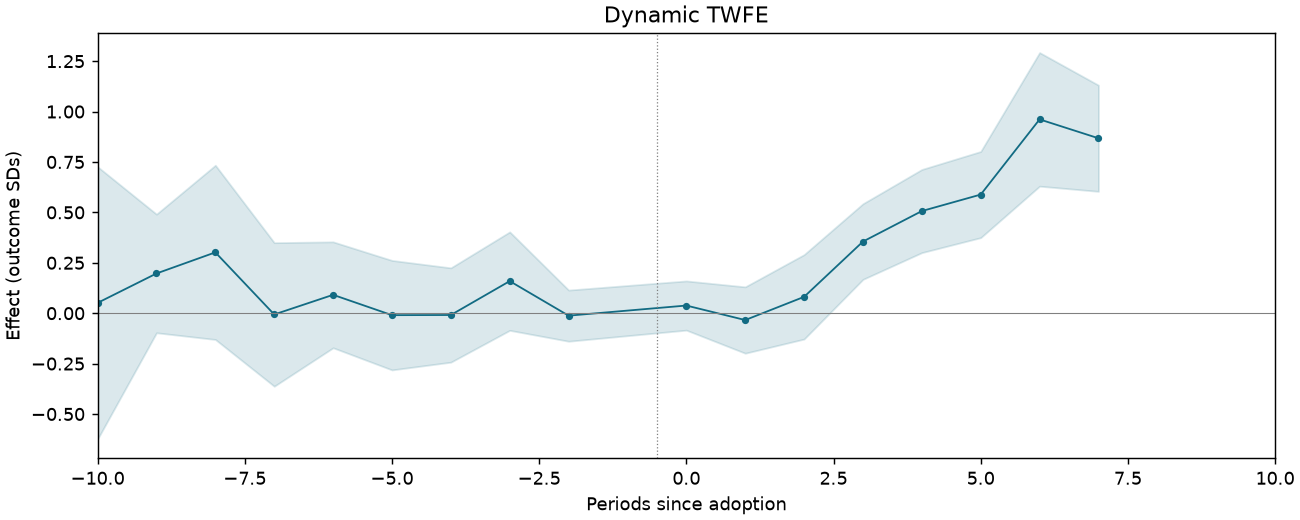
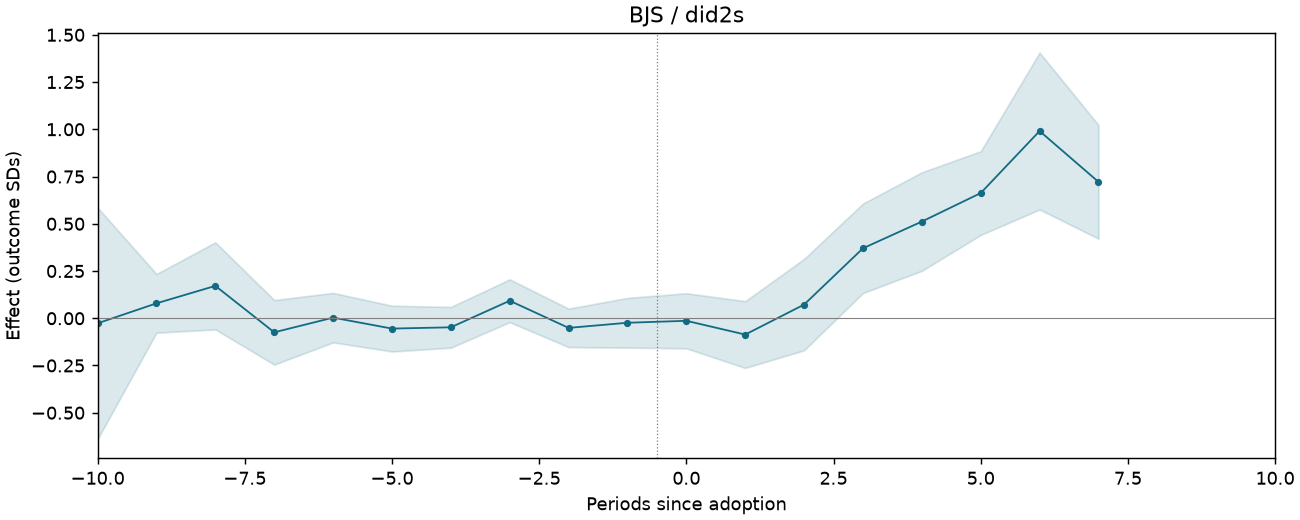
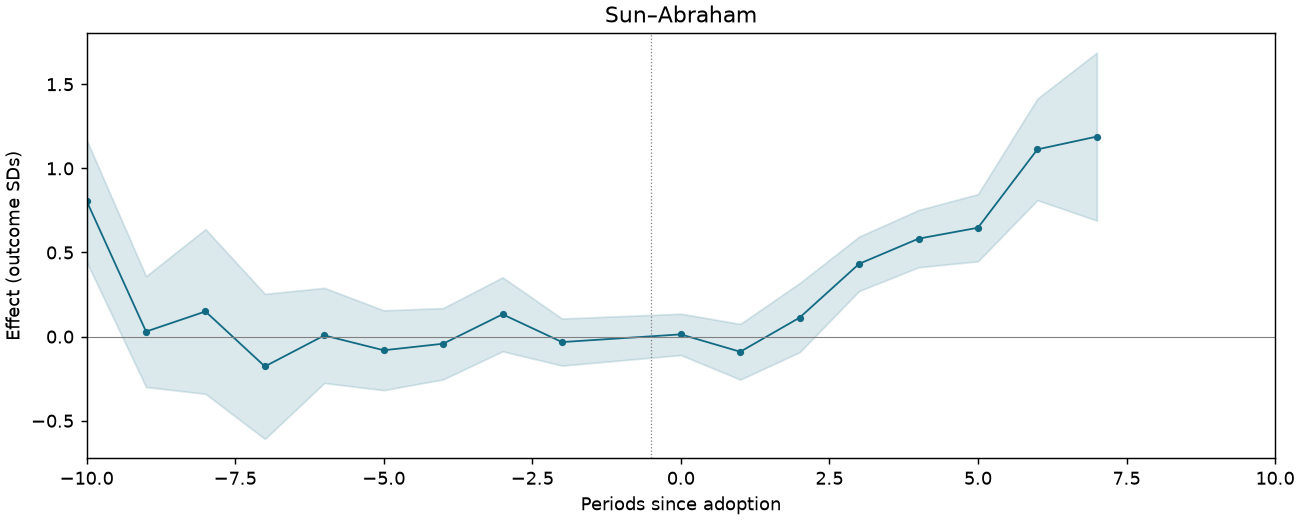
Event studies
Periods −10 to +10; pointwise 95% intervals where available.
REXER-T1-PB-SPILLS-C4
2,884 observations · 270 units · 270 clusters · 55 treated / 215 control units.
Estimate comparison
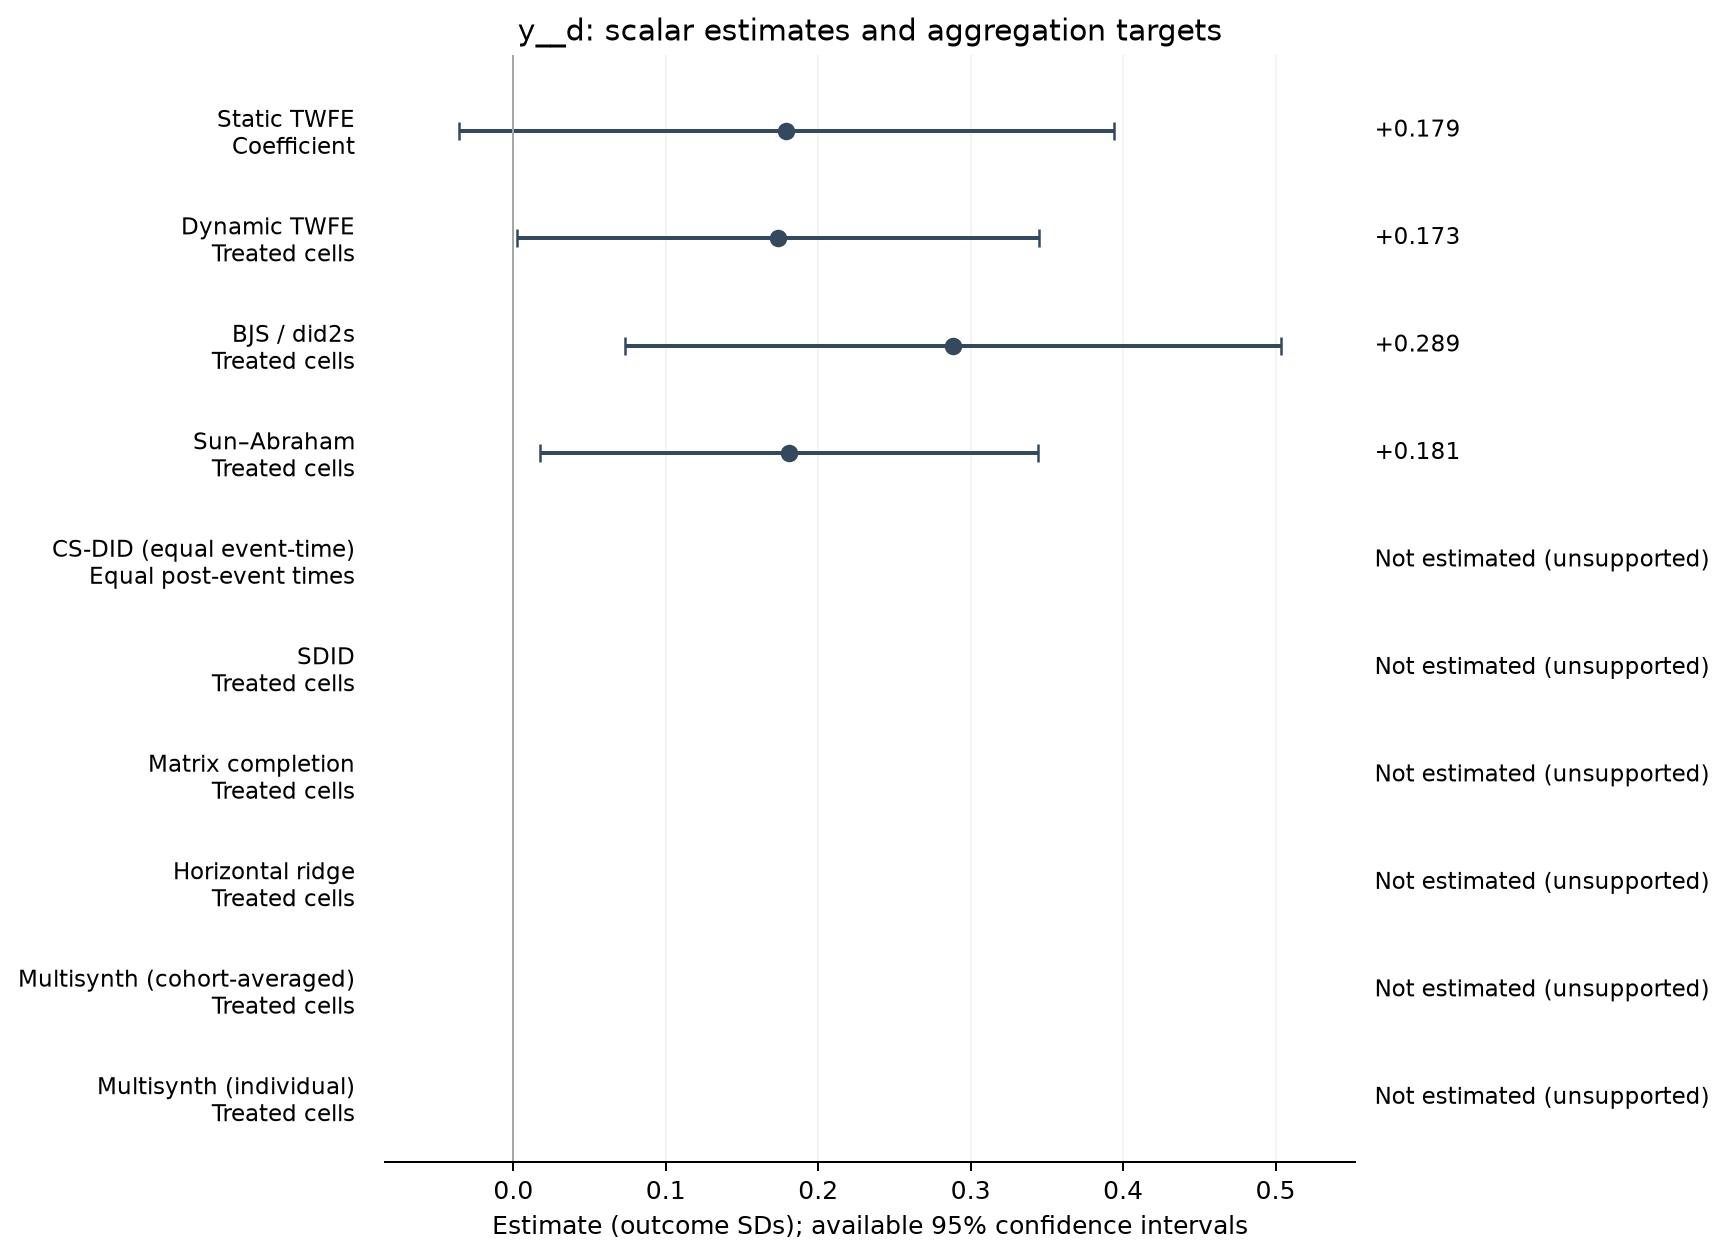
| Estimator | Estimate (SDs) | SE | 95% CI | Averaging |
|---|---|---|---|---|
| Static TWFE | 0.179 | 0.109 | [-0.036, 0.394] | Coefficient |
| Dynamic TWFE | 0.173 | 0.087 | [0.002, 0.345] | Treated cells |
| BJS / did2s | 0.289 | 0.109 | [0.073, 0.504] | Treated cells |
| Sun–Abraham | 0.181 | 0.083 | [0.018, 0.344] | Treated cells |
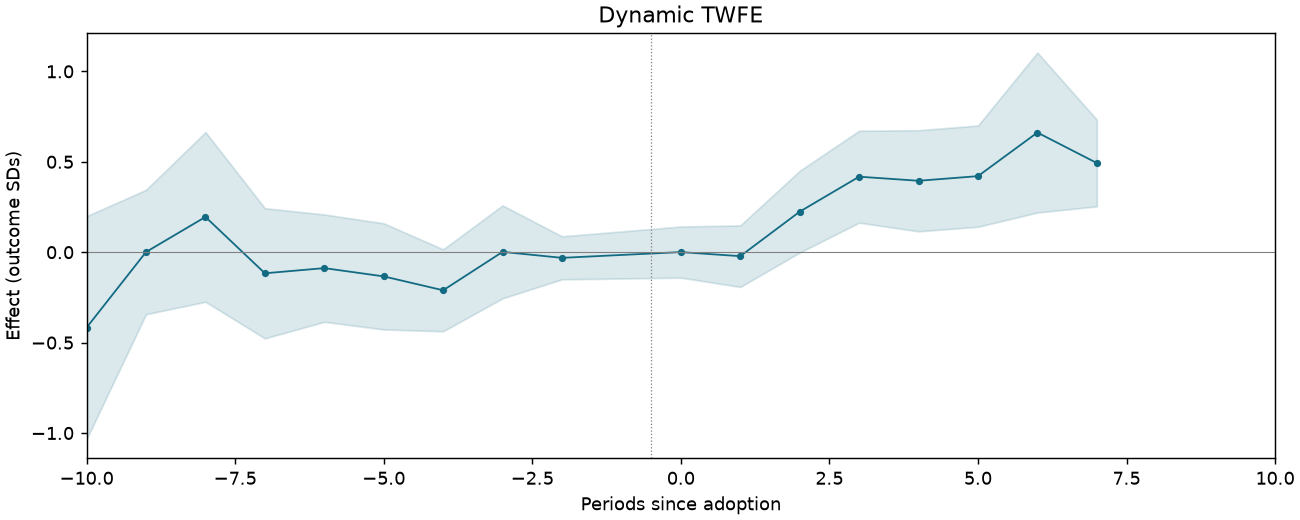
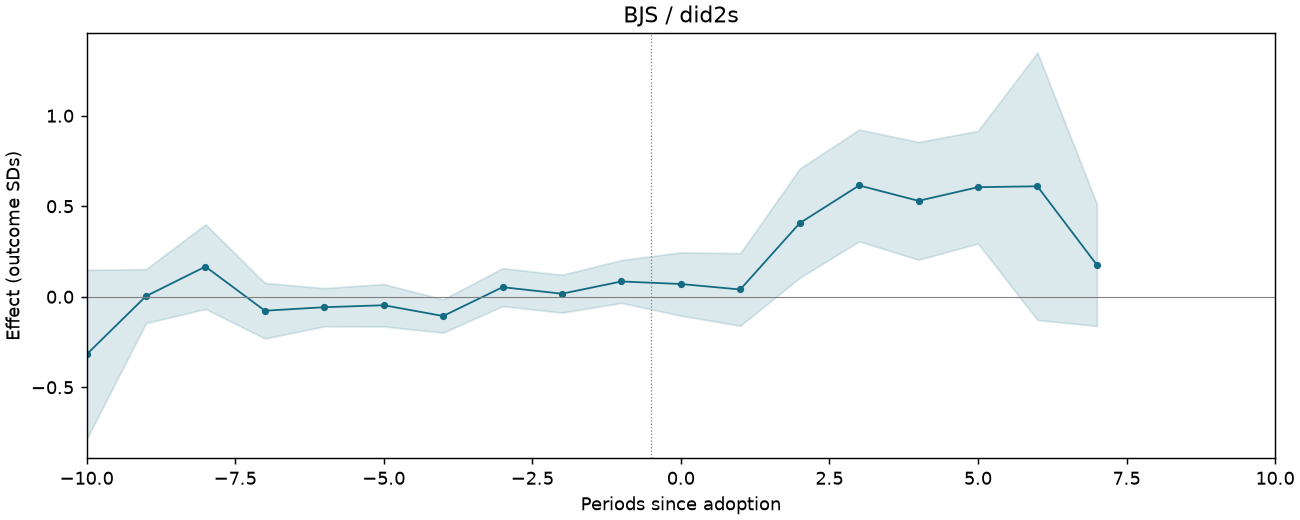
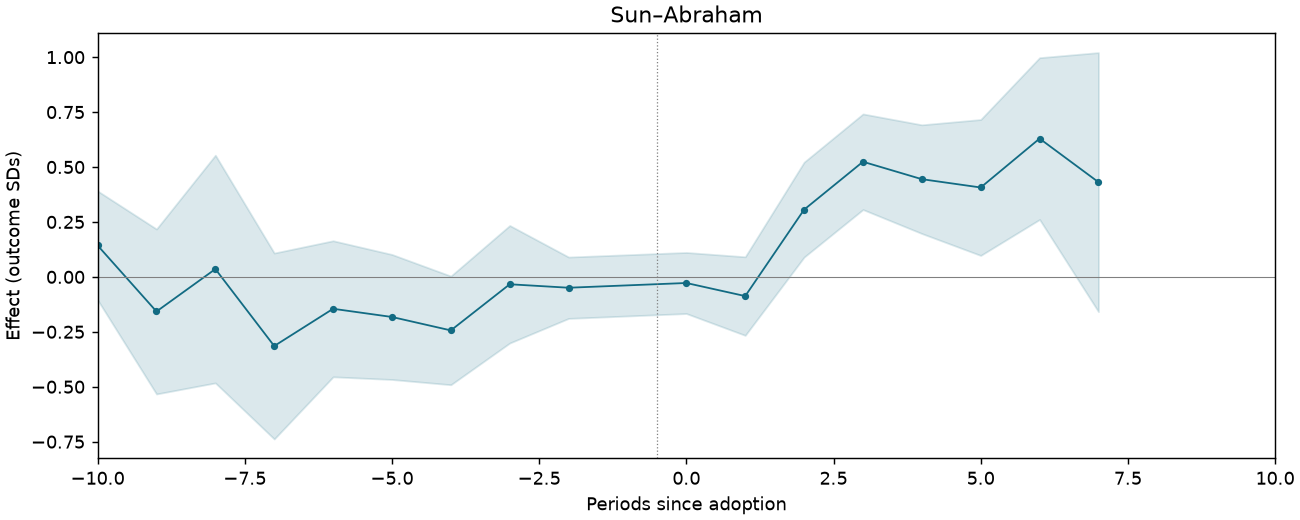
Event studies
Periods −10 to +10; pointwise 95% intervals where available.
REXER-T1-PB-SPILLS-C5
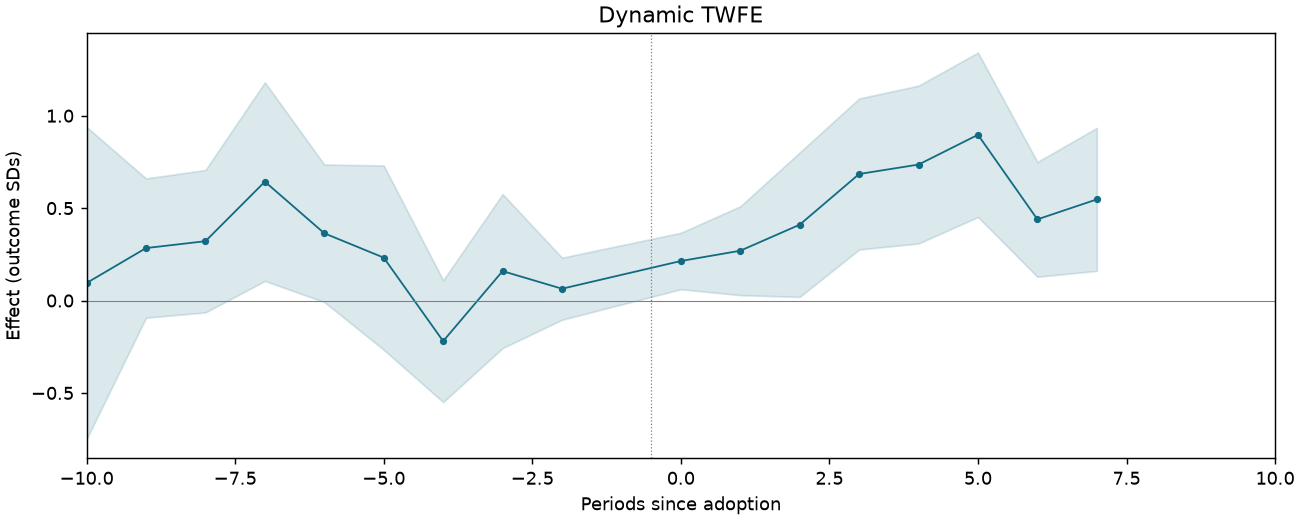
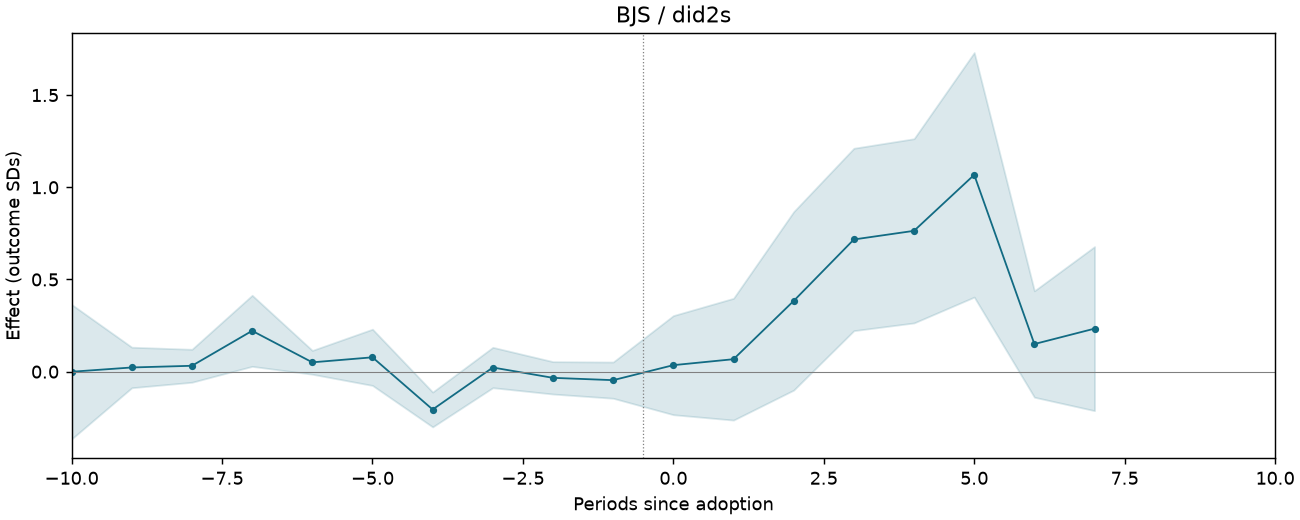
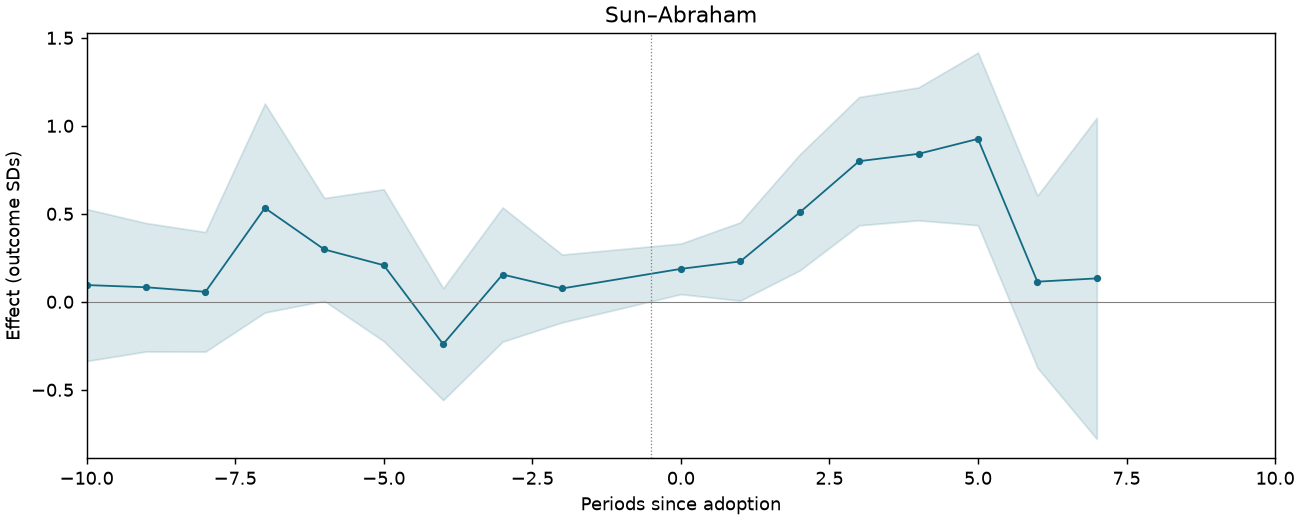
2,662 observations · 249 units · 249 clusters · 43 treated / 206 control units.
Estimate comparison
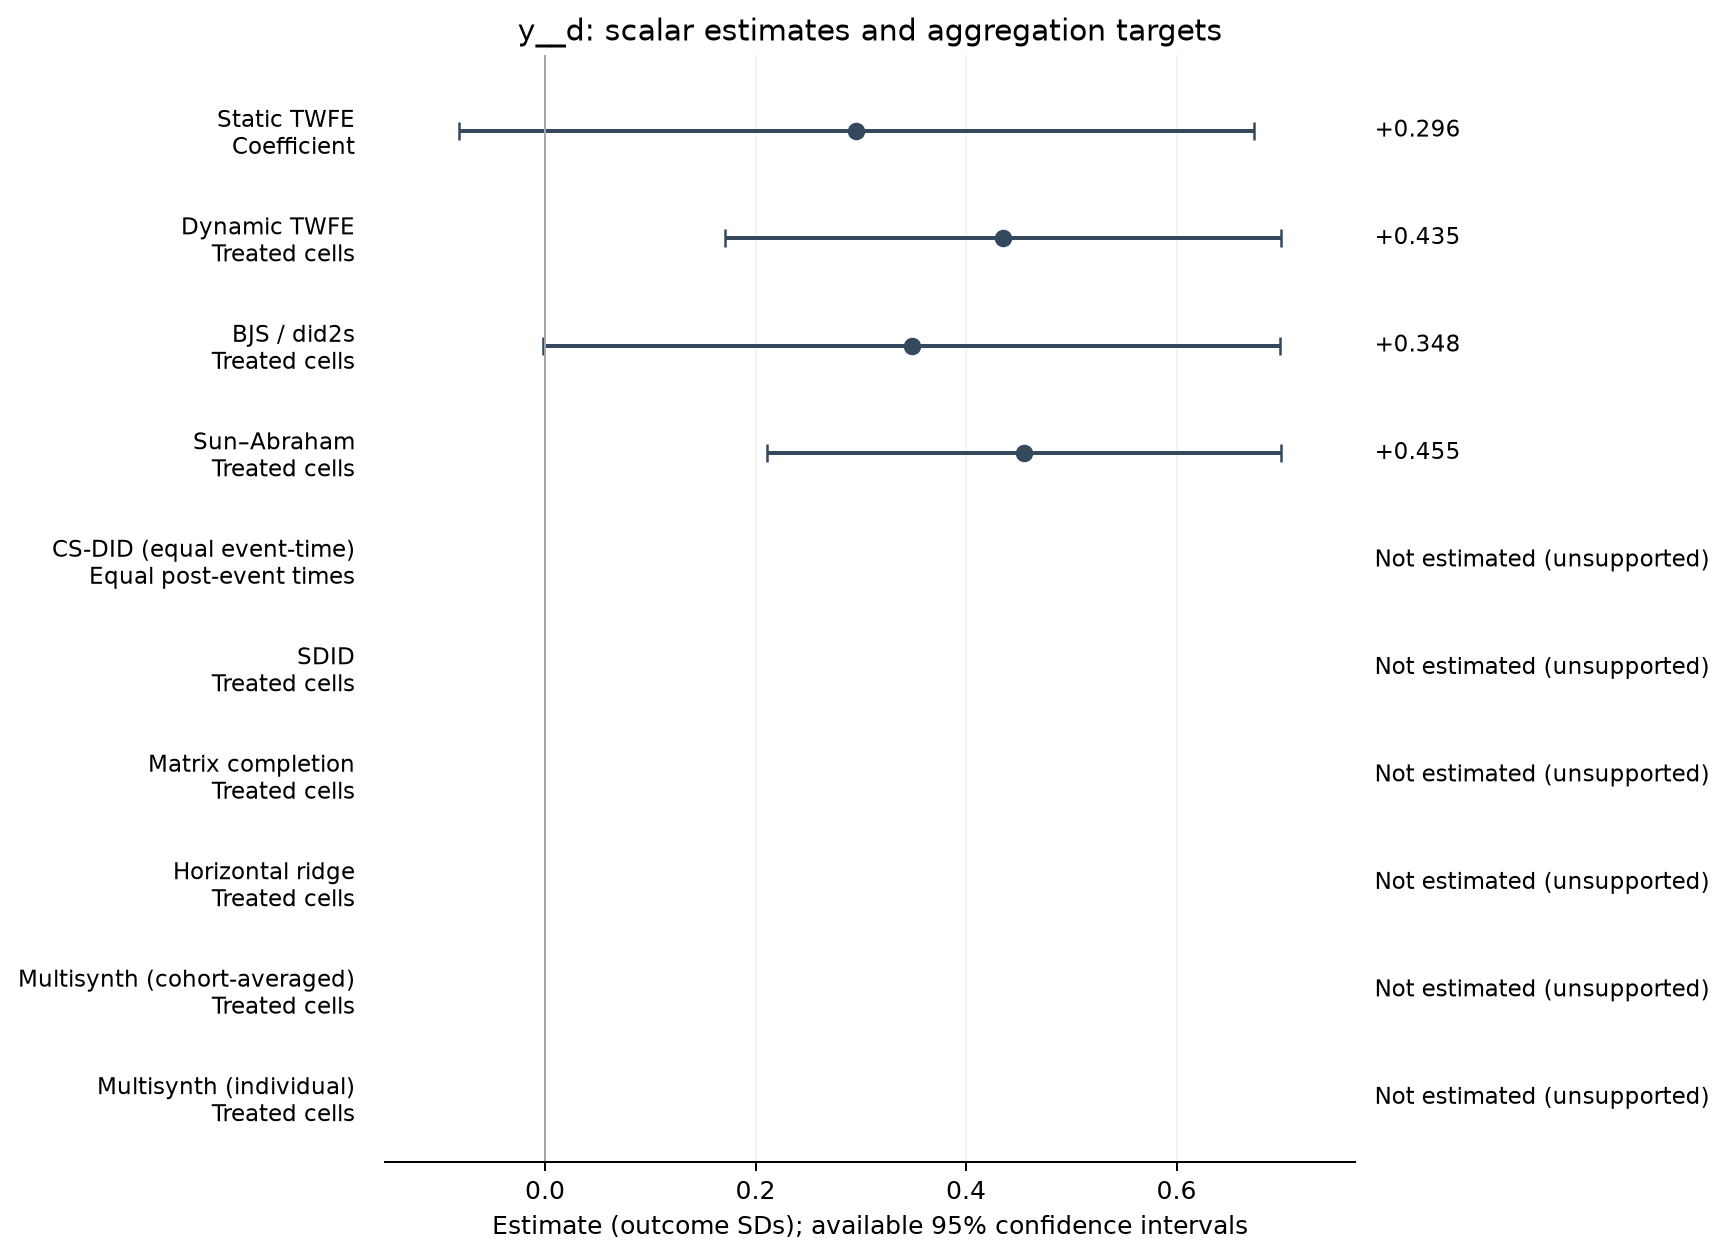
| Estimator | Estimate (SDs) | SE | 95% CI | Averaging |
|---|---|---|---|---|
| Static TWFE | 0.296 | 0.192 | [-0.082, 0.674] | Coefficient |
| Dynamic TWFE | 0.435 | 0.134 | [0.171, 0.699] | Treated cells |
| BJS / did2s | 0.348 | 0.178 | [-0.002, 0.698] | Treated cells |
| Sun–Abraham | 0.455 | 0.124 | [0.211, 0.699] | Treated cells |
Event studies
Periods −10 to +10; pointwise 95% intervals where available.
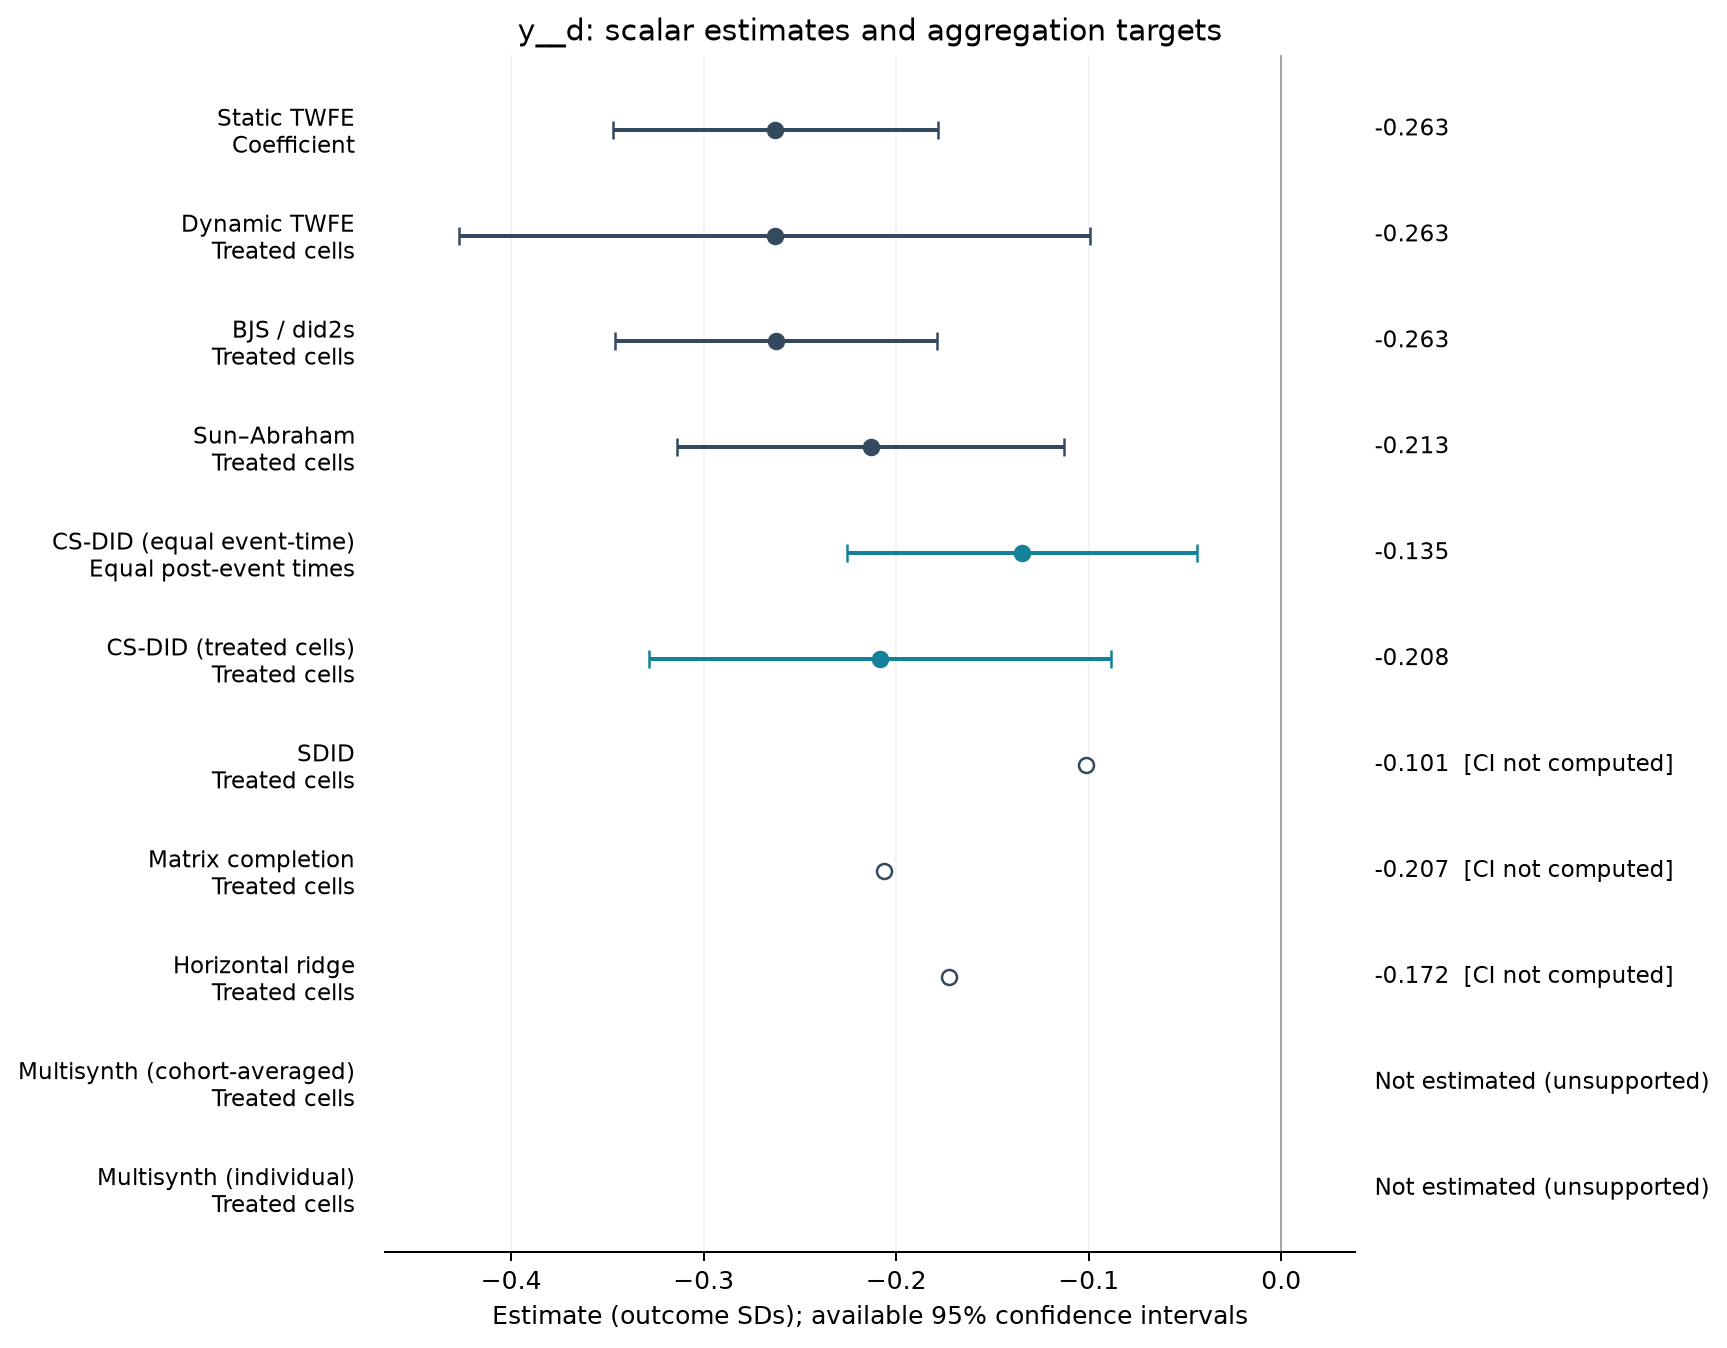
Oil theft: count of sabotage spills within 15 km of the field
2,895 observations · 271 units · 271 clusters · 56 treated / 215 control units.
Estimate comparison
| Estimator | Estimate (SDs) | SE | 95% CI | Averaging |
|---|---|---|---|---|
| Static TWFE | -0.263 | 0.043 | [-0.347, -0.178] | Coefficient |
| Dynamic TWFE | -0.263 | 0.083 | [-0.427, -0.099] | Treated cells |
| BJS / did2s | -0.263 | 0.043 | [-0.346, -0.179] | Treated cells |
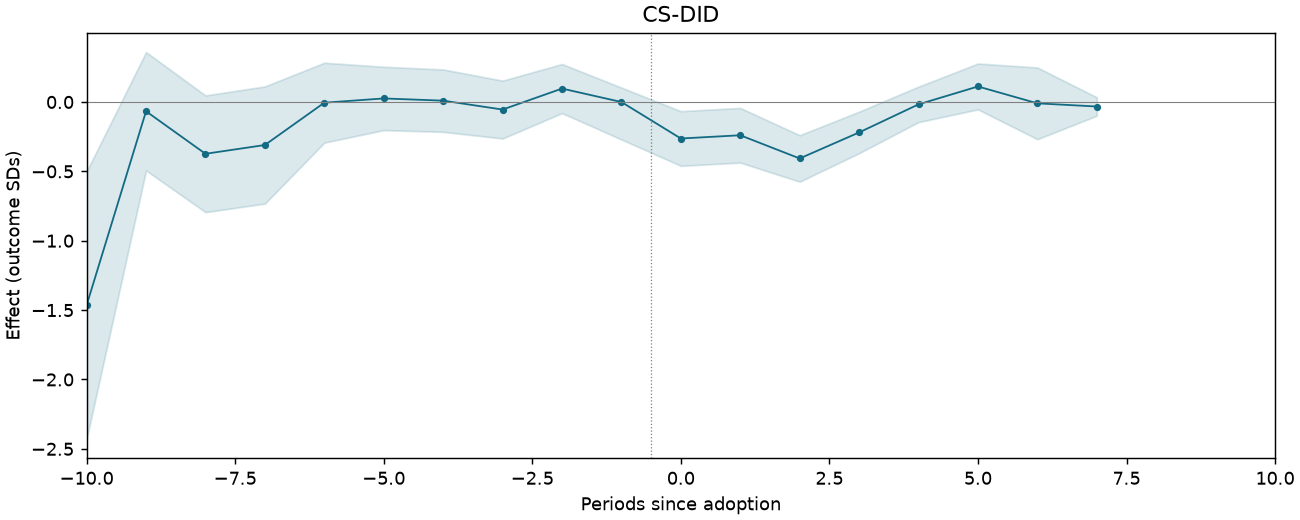
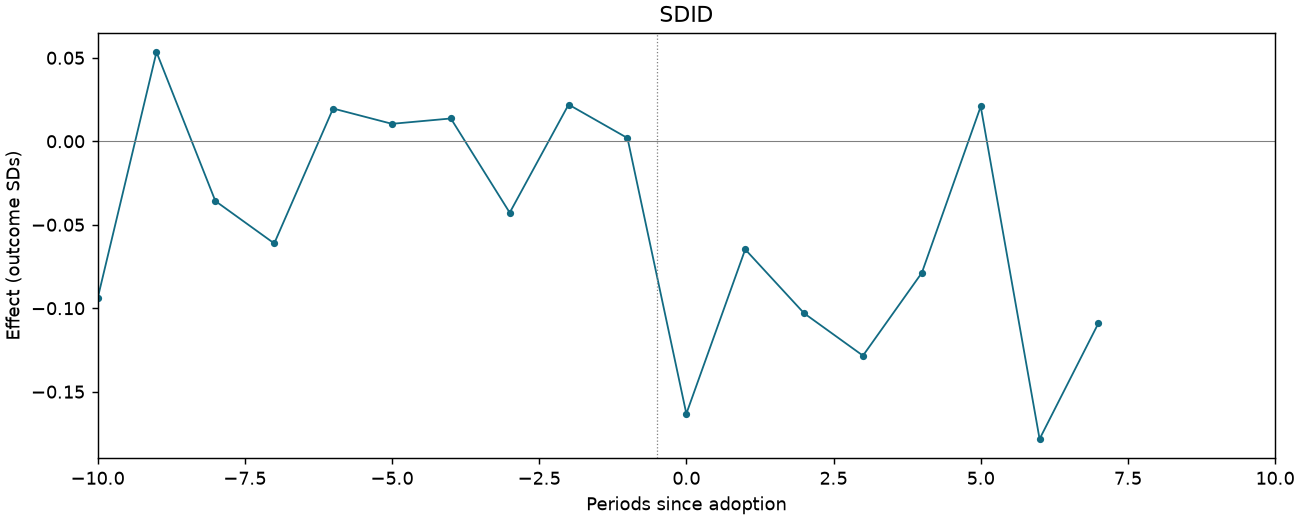
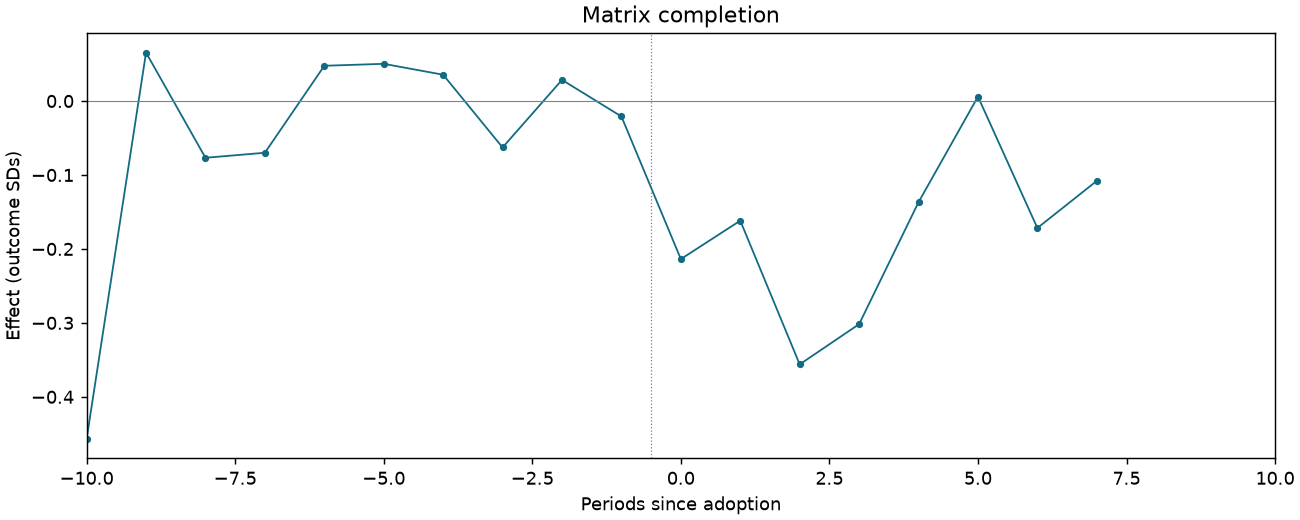
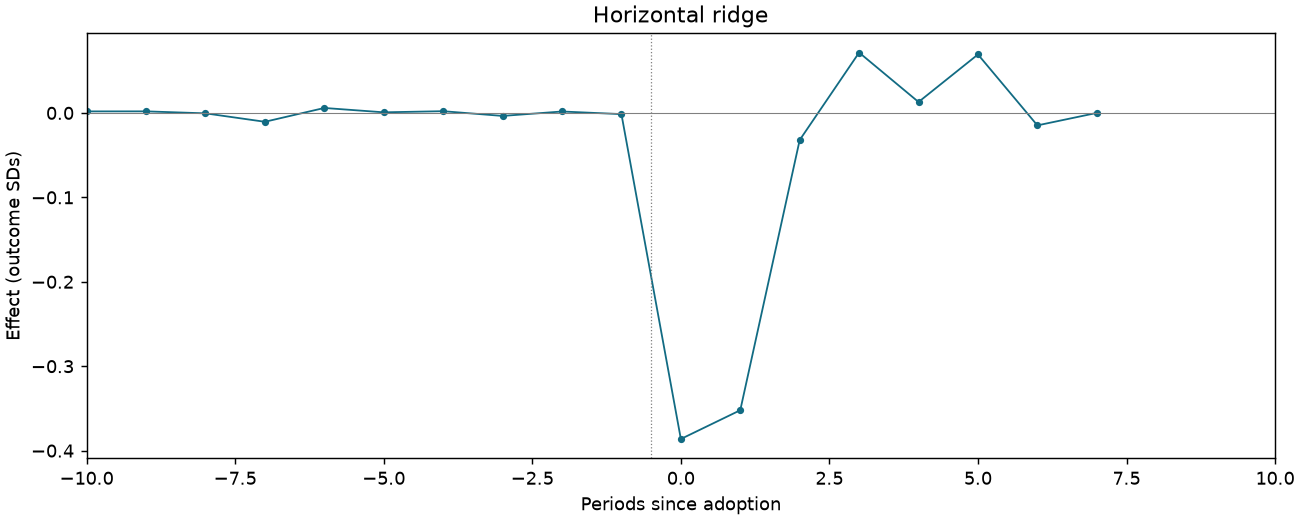
| Sun–Abraham | -0.213 | 0.051 | [-0.314, -0.113] | Treated cells |
| CS-DID (equal event-time) | -0.135 | 0.046 | [-0.226, -0.044] | Equal post-event times |
| CS-DID (treated cells) | -0.208 | 0.061 | [-0.328, -0.088] | Treated cells |
| SDID | -0.101 | — | — | Treated cells |
| Matrix completion | -0.207 | — | — | Treated cells |
| Horizontal ridge | -0.172 | — | — | Treated cells |
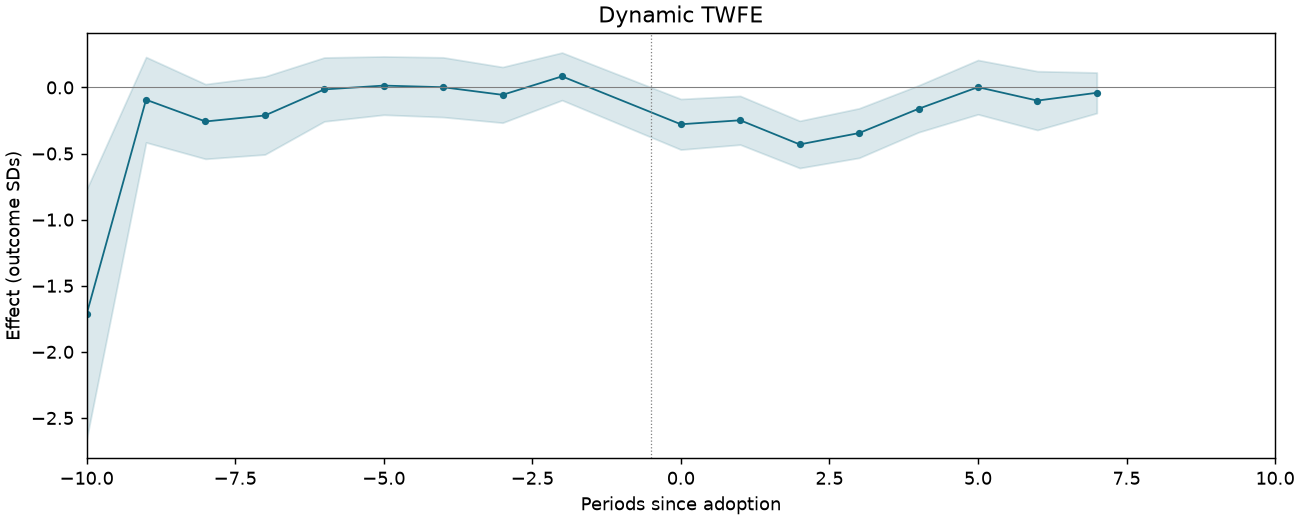
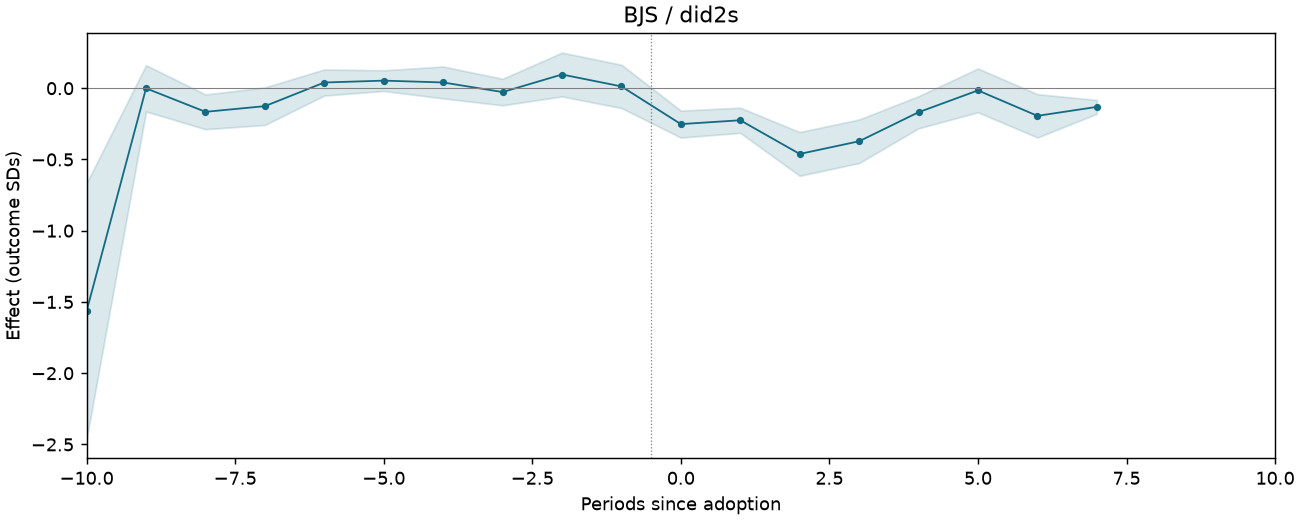
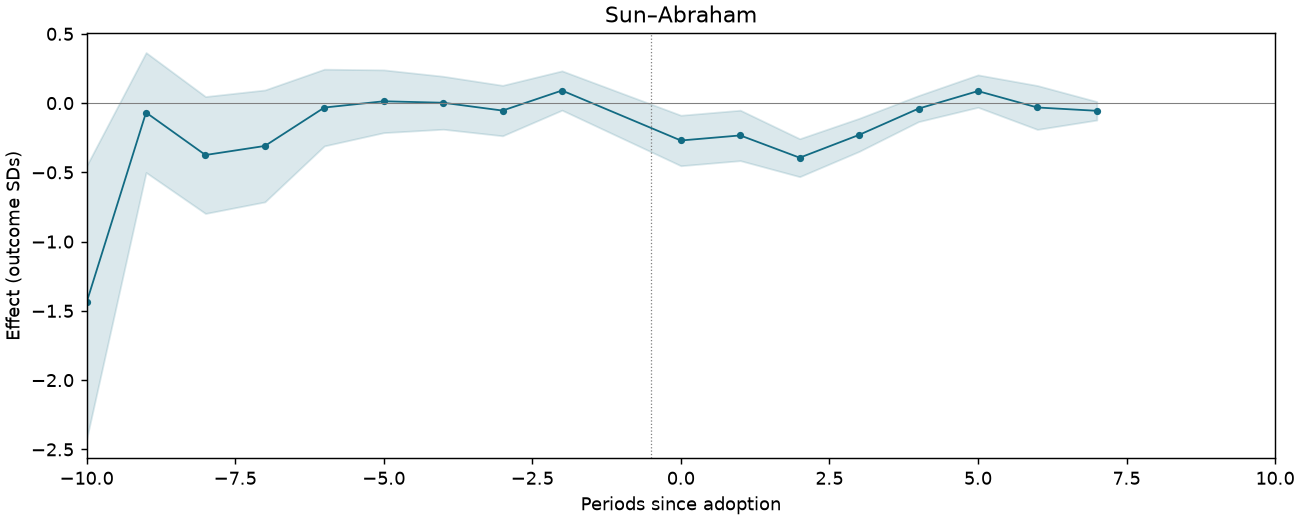
Event studies
Periods −10 to +10; pointwise 95% intervals where available.
REXER-T1-PC-THEFT-C2
2,895 observations · 271 units · 271 clusters · 56 treated / 215 control units.
Estimate comparison
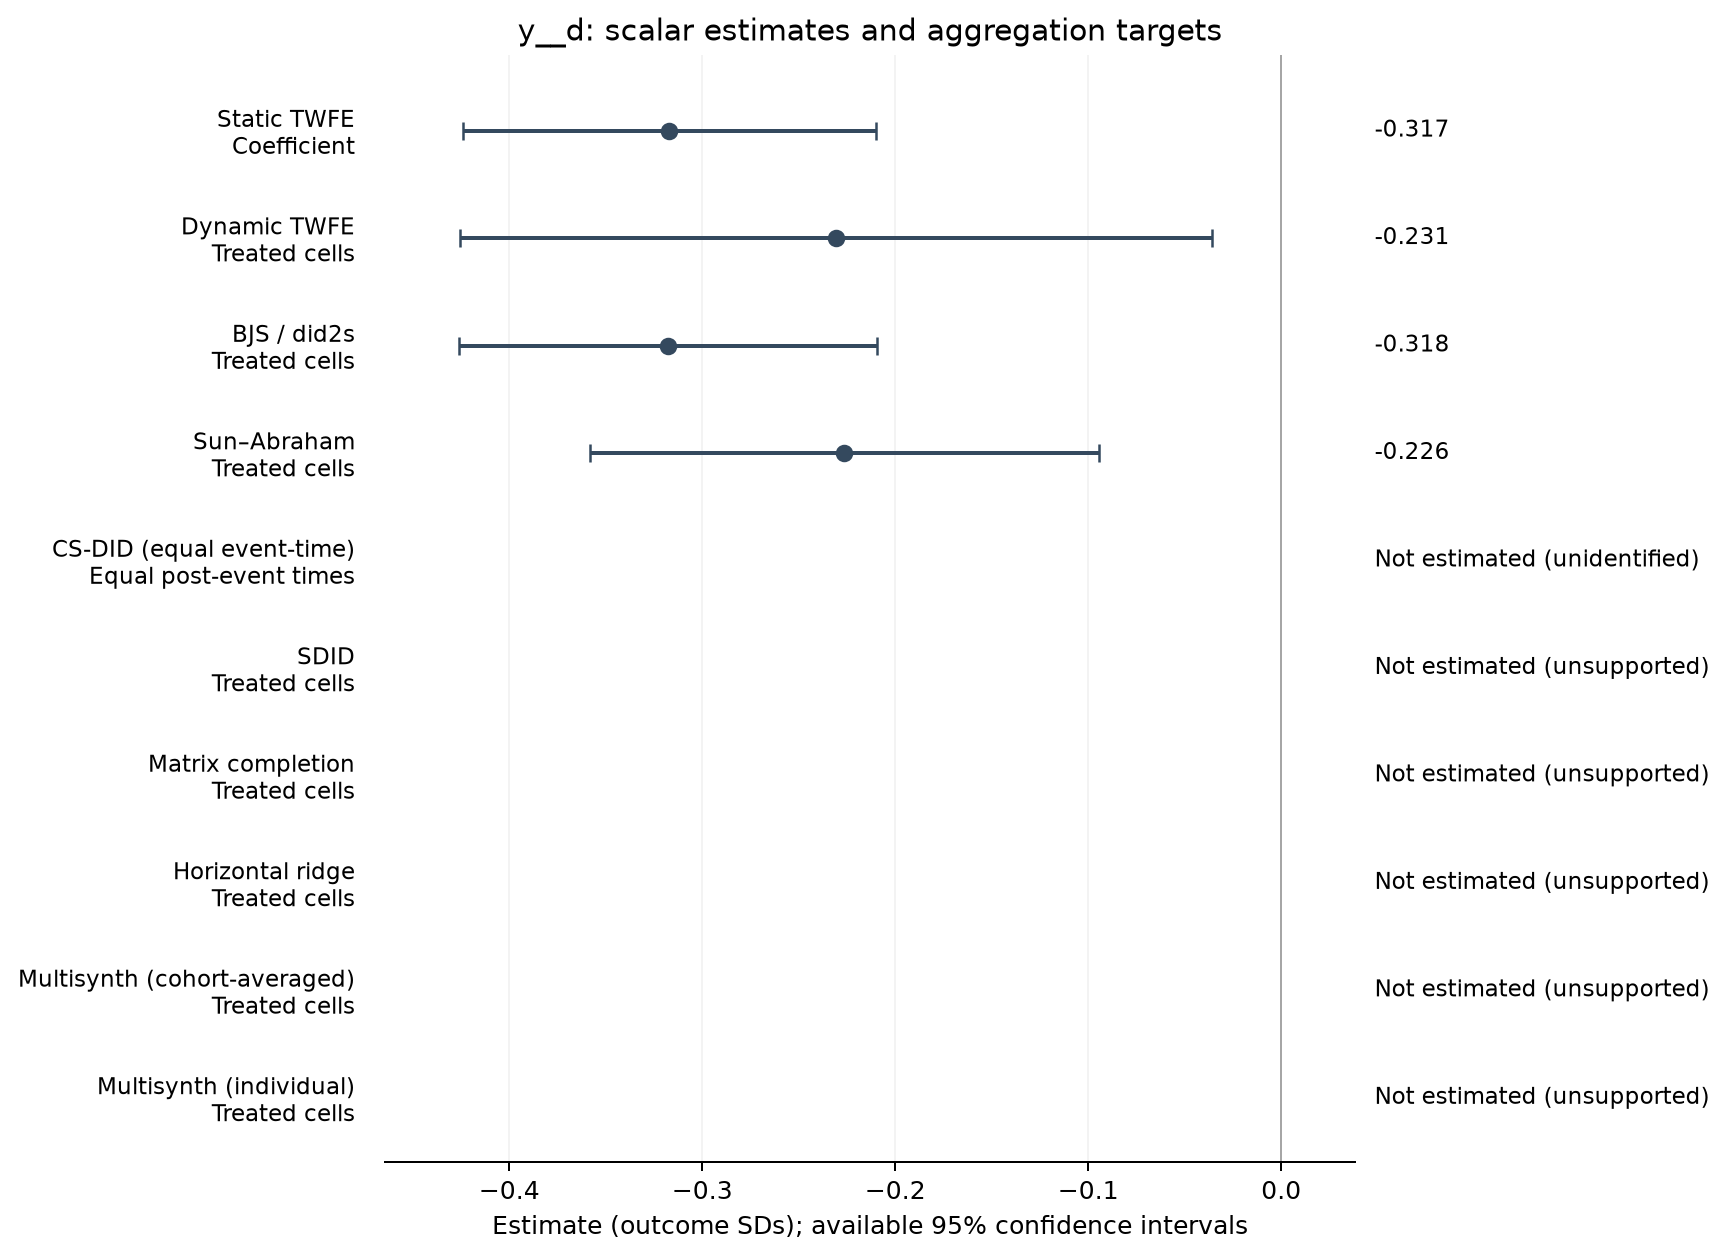
| Estimator | Estimate (SDs) | SE | 95% CI | Averaging |
|---|---|---|---|---|
| Static TWFE | -0.317 | 0.054 | [-0.424, -0.210] | Coefficient |
| Dynamic TWFE | -0.231 | 0.099 | [-0.426, -0.036] | Treated cells |
| BJS / did2s | -0.318 | 0.055 | [-0.426, -0.210] | Treated cells |
| Sun–Abraham | -0.226 | 0.067 | [-0.358, -0.095] | Treated cells |
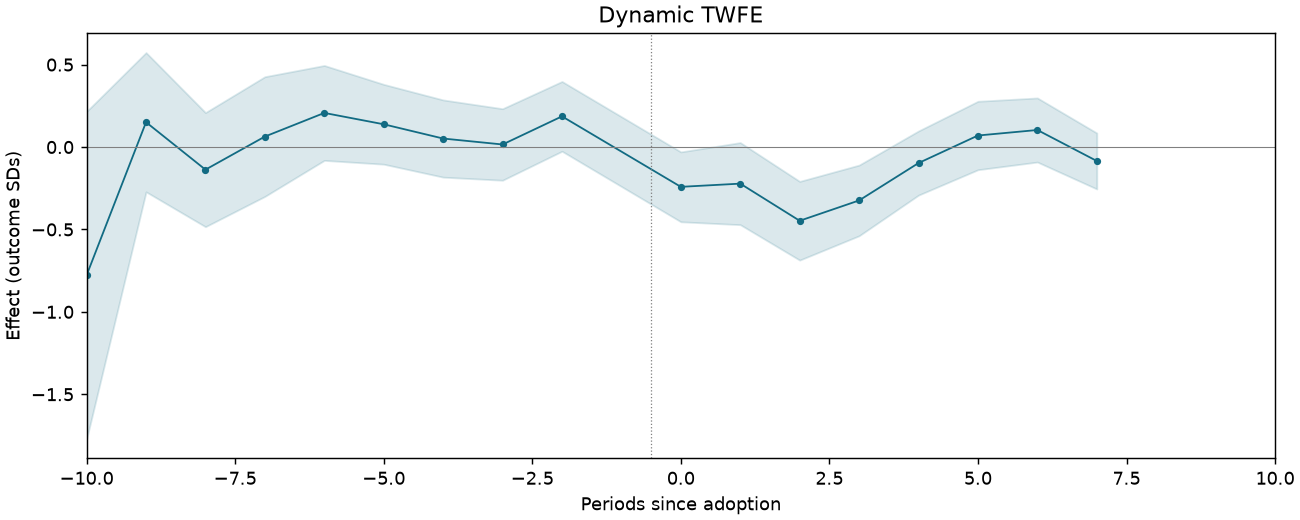
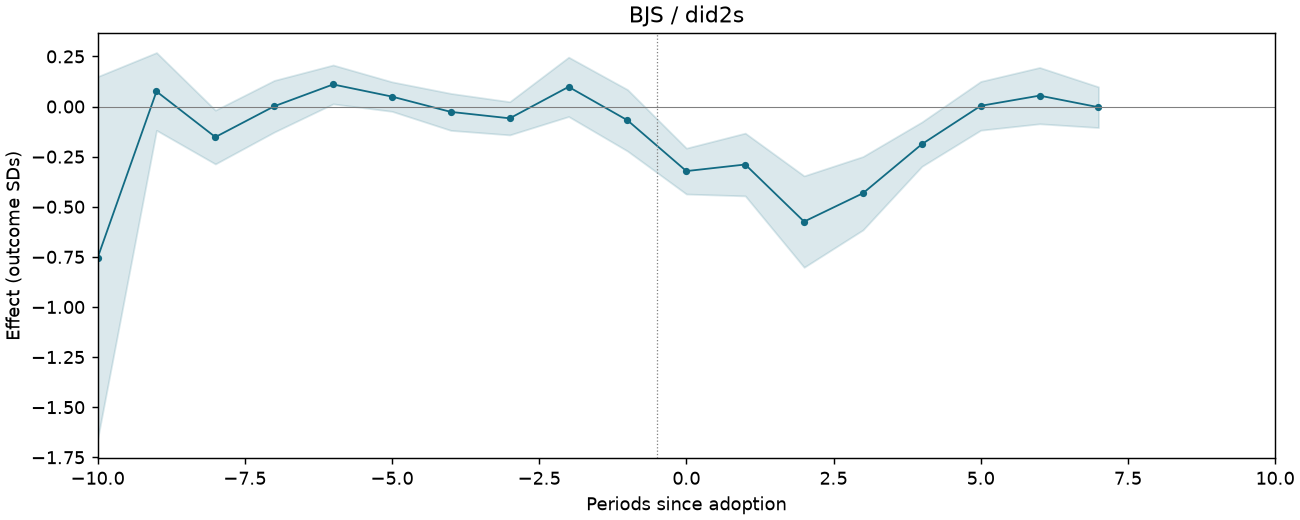
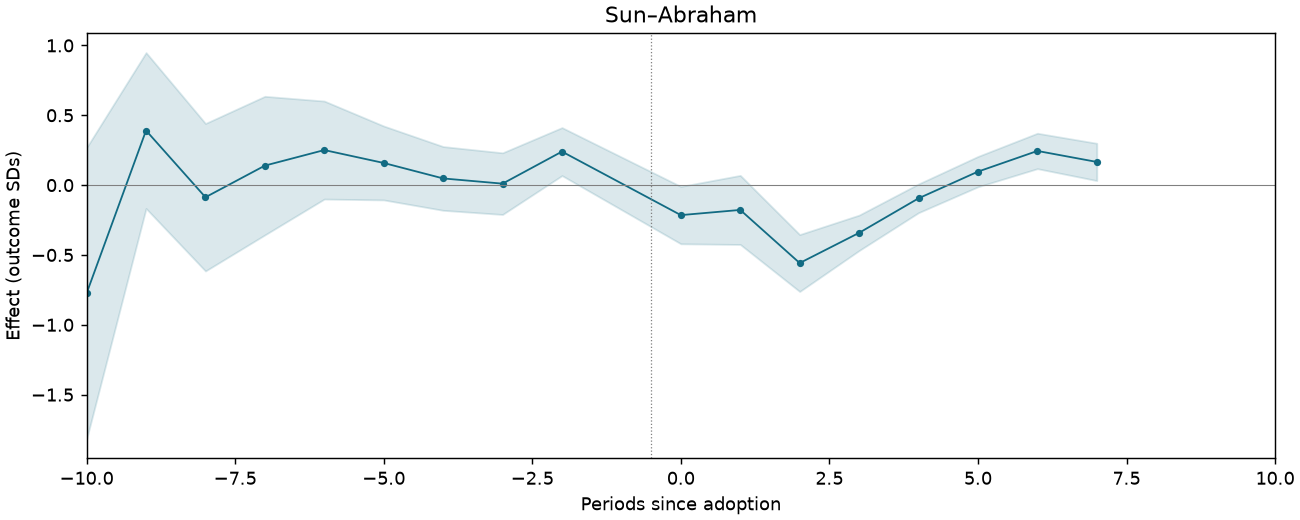
Event studies
Periods −10 to +10; pointwise 95% intervals where available.
REXER-T1-PC-THEFT-C4
2,884 observations · 270 units · 270 clusters · 55 treated / 215 control units.
Estimate comparison
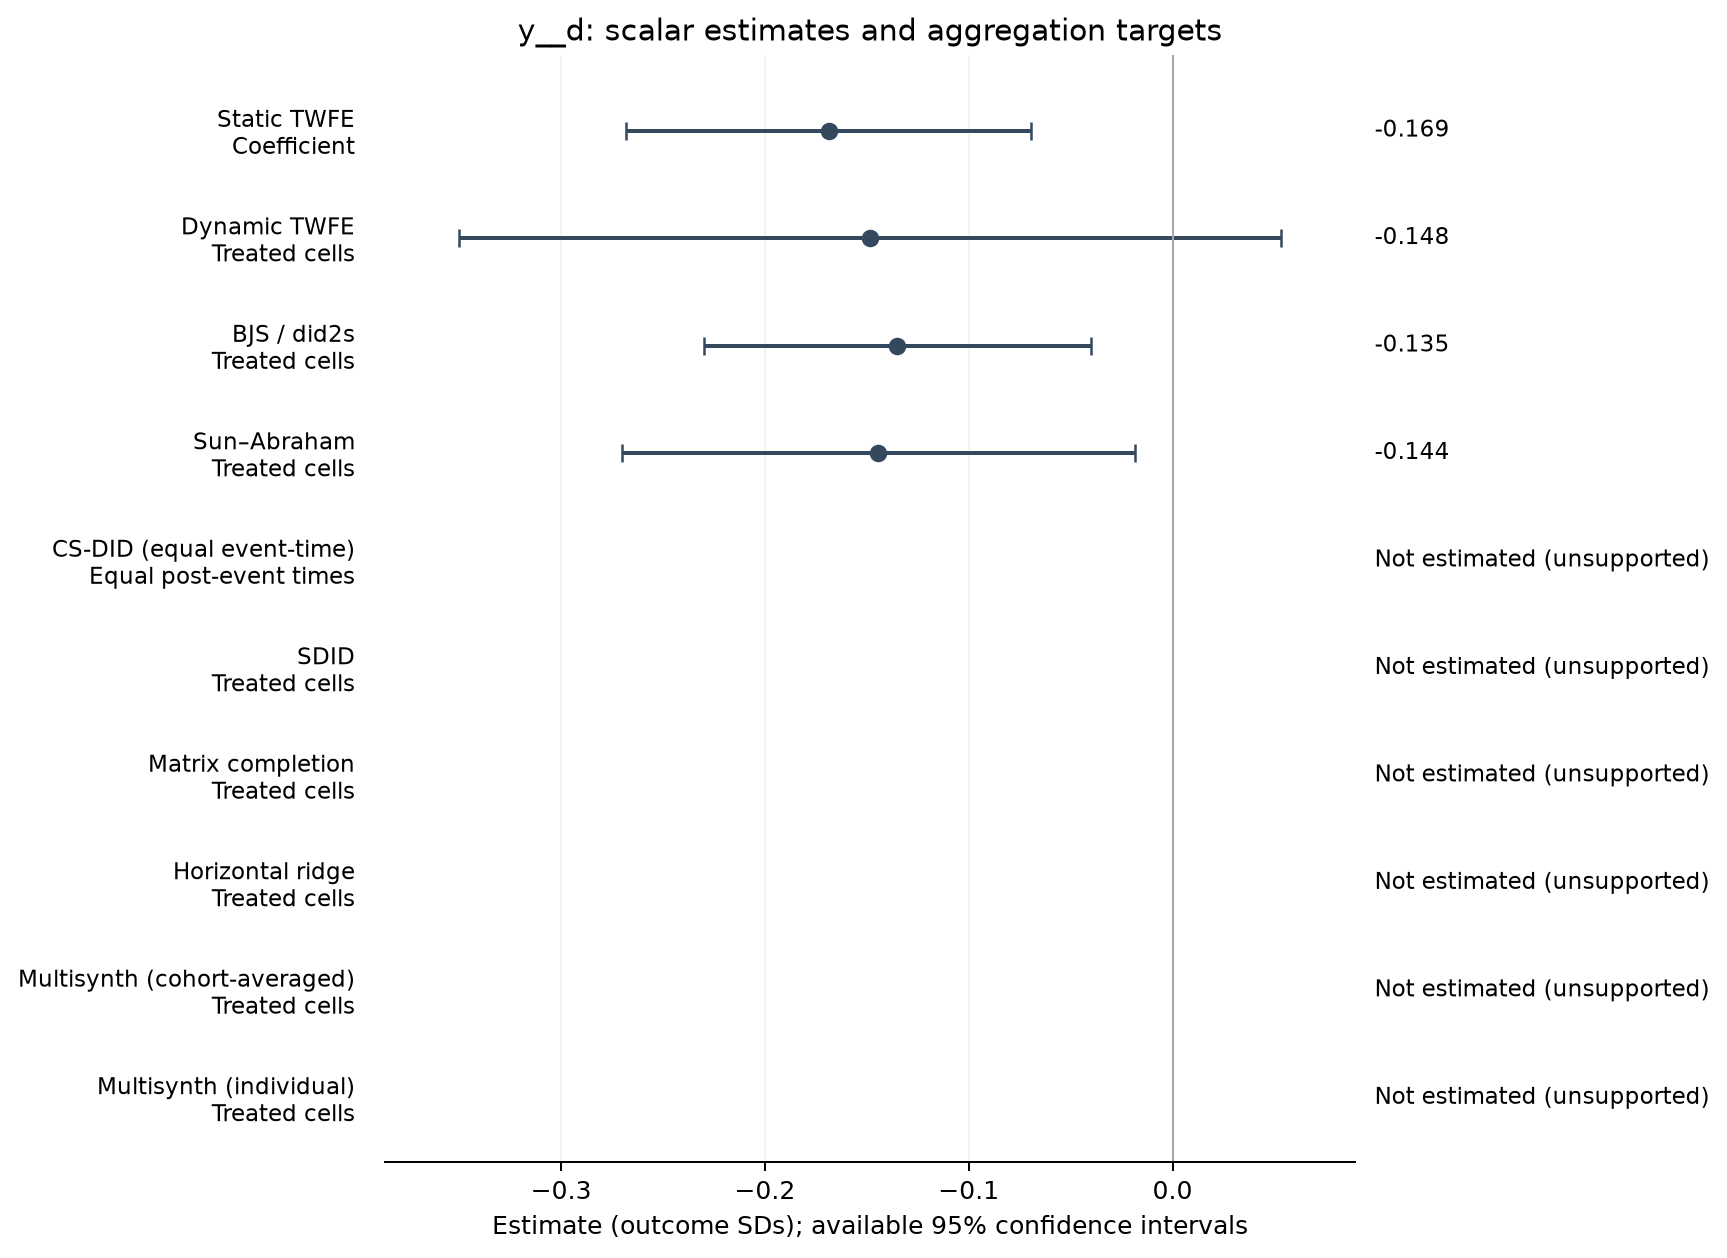
| Estimator | Estimate (SDs) | SE | 95% CI | Averaging |
|---|---|---|---|---|
| Static TWFE | -0.169 | 0.051 | [-0.268, -0.069] | Coefficient |
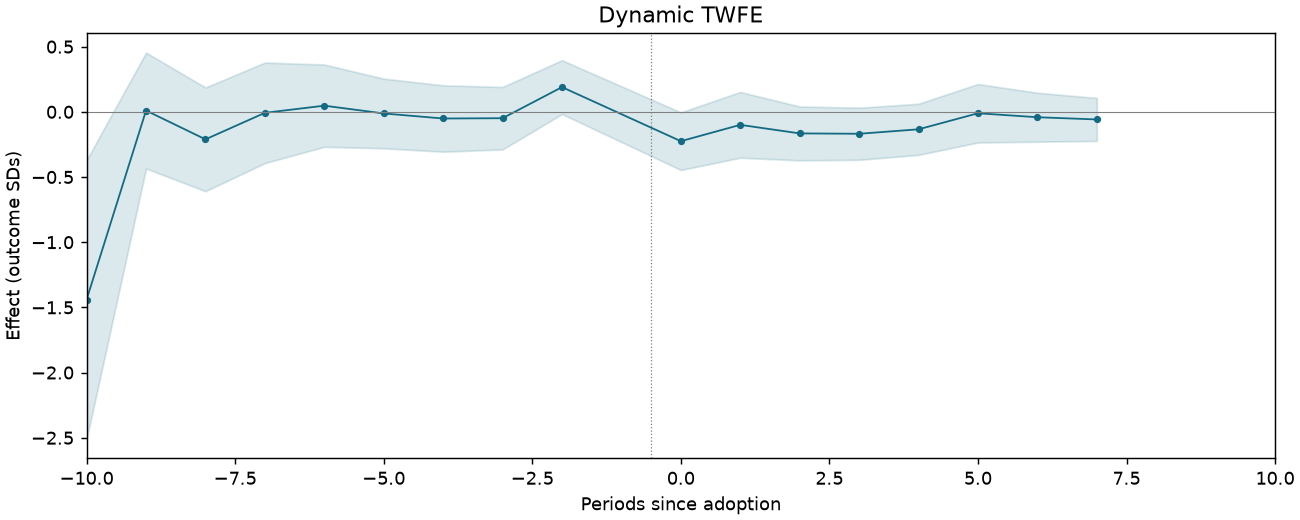
| Dynamic TWFE | -0.148 | 0.102 | [-0.350, 0.053] | Treated cells |
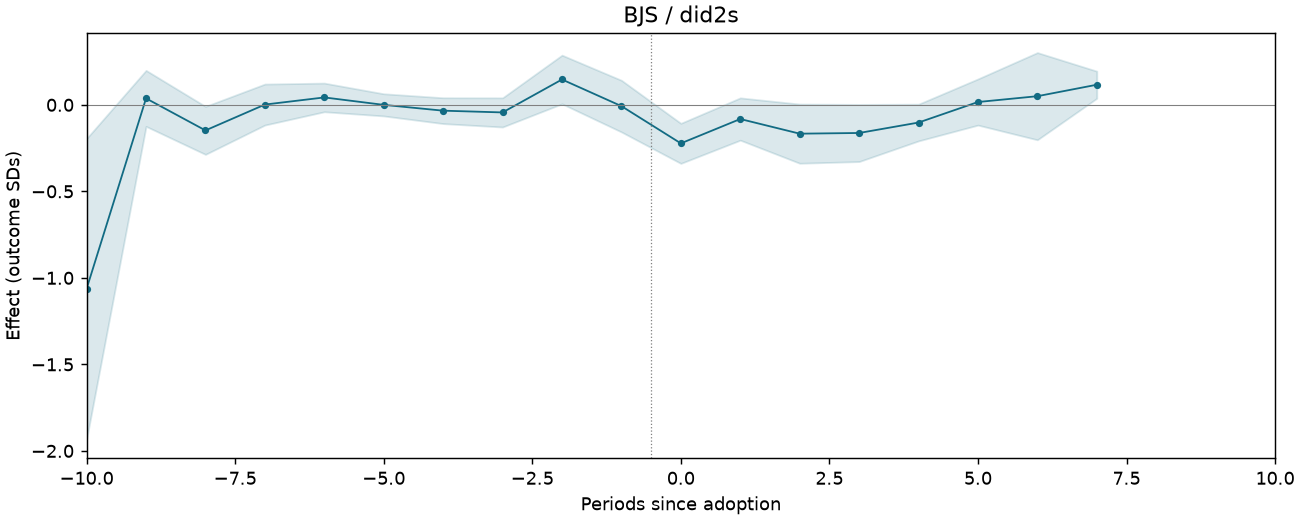
| BJS / did2s | -0.135 | 0.048 | [-0.230, -0.040] | Treated cells |
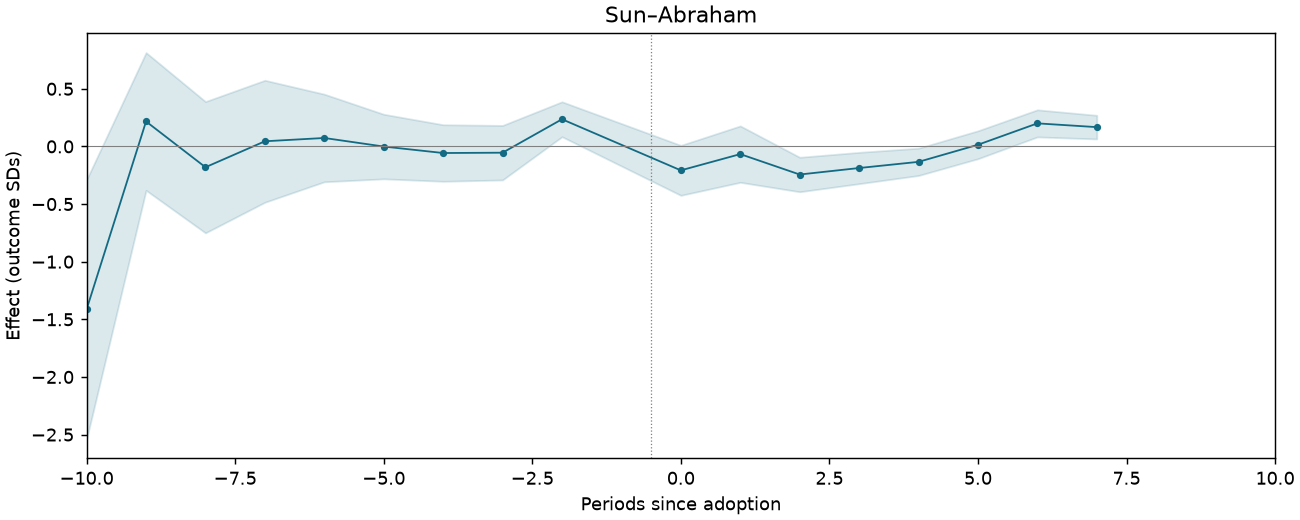
| Sun–Abraham | -0.144 | 0.064 | [-0.270, -0.018] | Treated cells |
Event studies
Periods −10 to +10; pointwise 95% intervals where available.
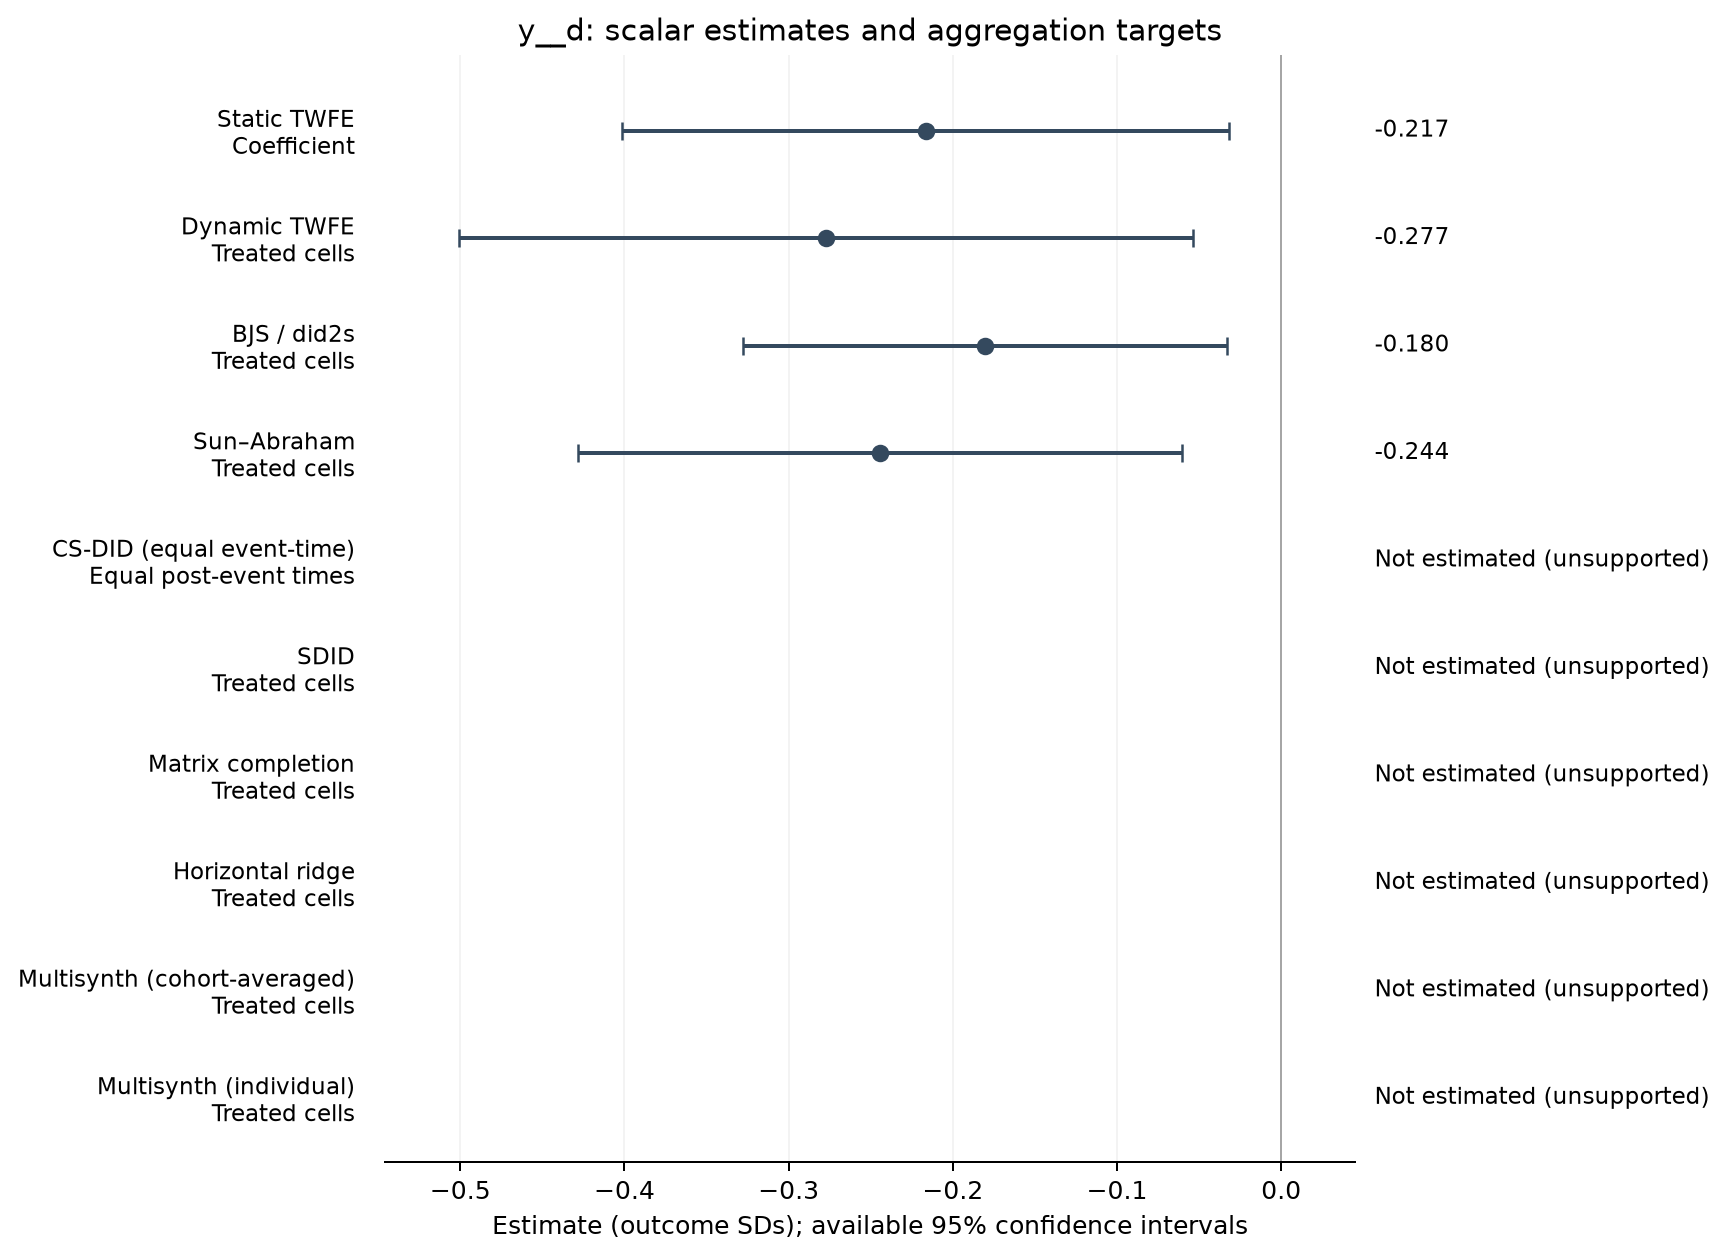
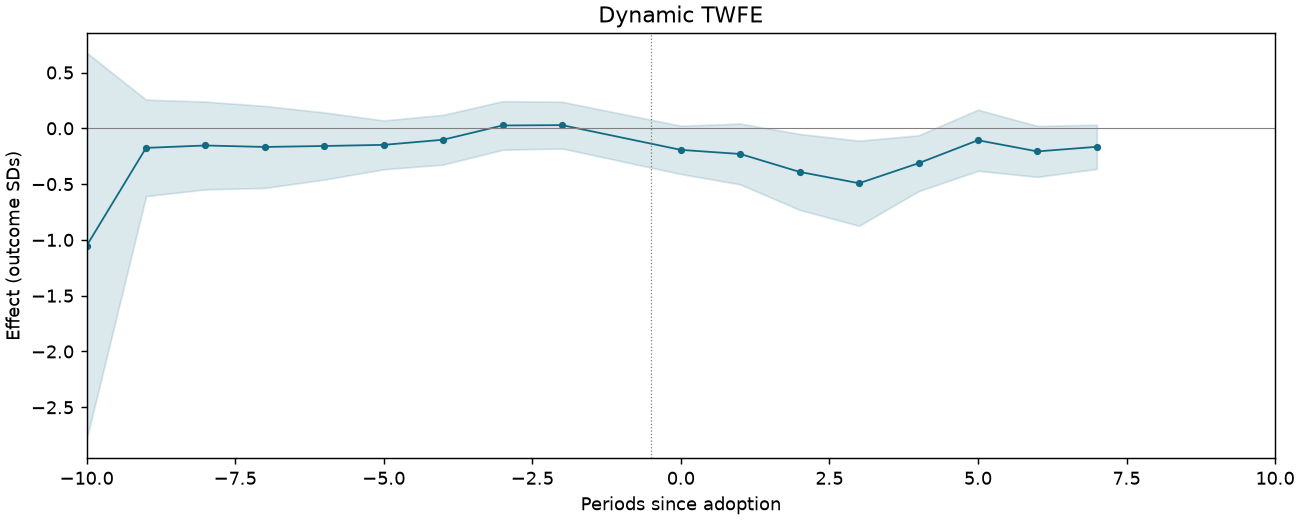
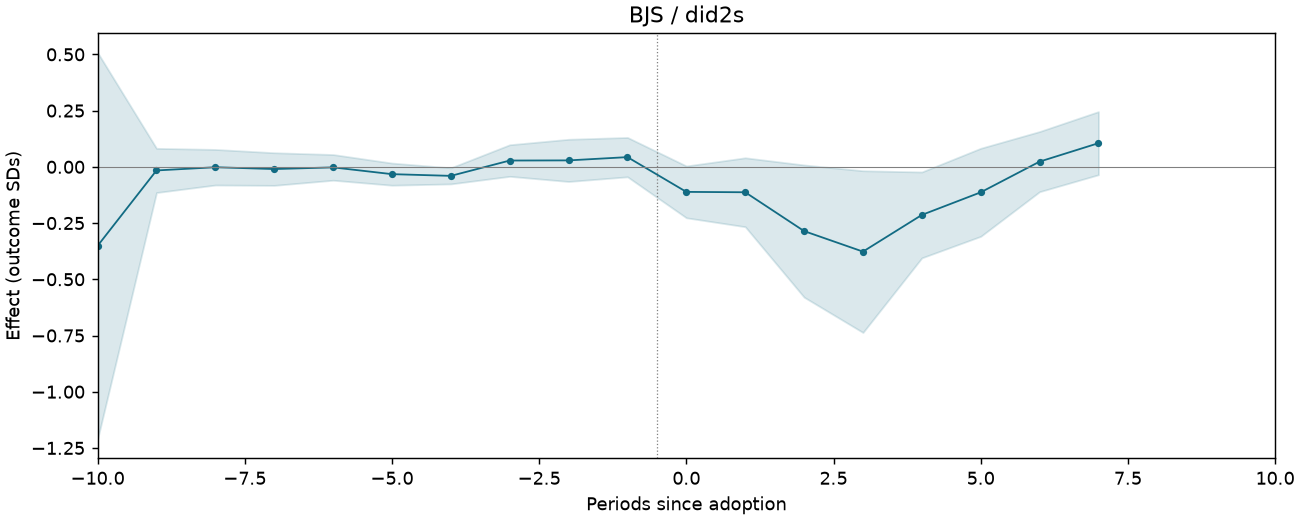
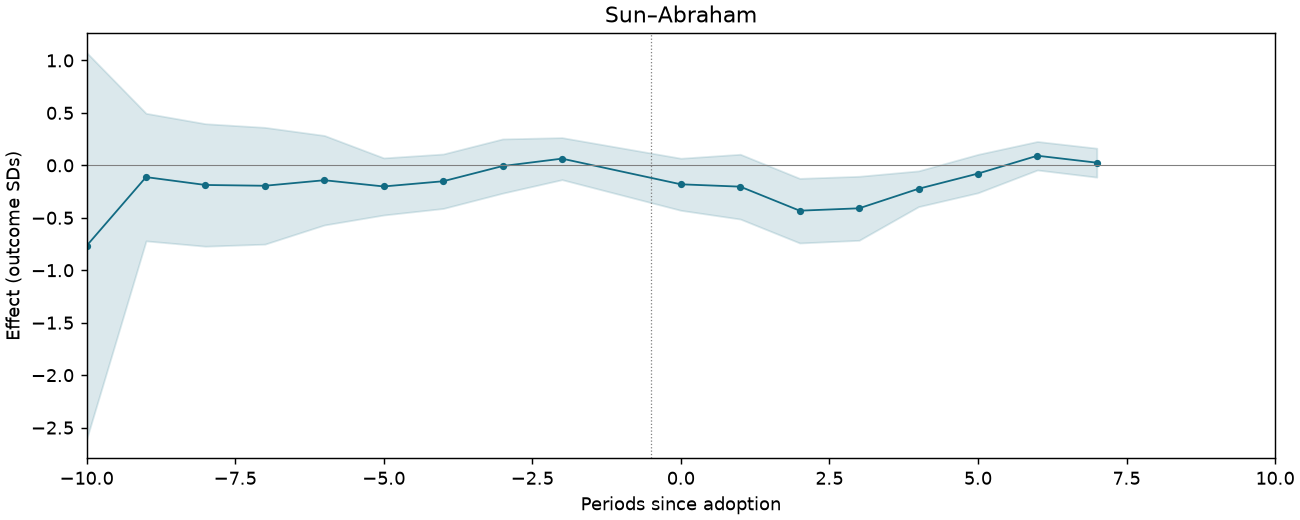
REXER-T1-PC-THEFT-C5
2,662 observations · 249 units · 249 clusters · 43 treated / 206 control units.
Estimate comparison
| Estimator | Estimate (SDs) | SE | 95% CI | Averaging |
|---|---|---|---|---|
| Static TWFE | -0.217 | 0.094 | [-0.402, -0.032] | Coefficient |
| Dynamic TWFE | -0.277 | 0.113 | [-0.501, -0.054] | Treated cells |
| BJS / did2s | -0.180 | 0.075 | [-0.328, -0.033] | Treated cells |
| Sun–Abraham | -0.244 | 0.093 | [-0.428, -0.061] | Treated cells |
Event studies
Periods −10 to +10; pointwise 95% intervals where available.
Oil theft: count of sabotage spills within 15 km of the field
The archive supplies frozen estimates but not this specification’s input sample or required outcome/controls.
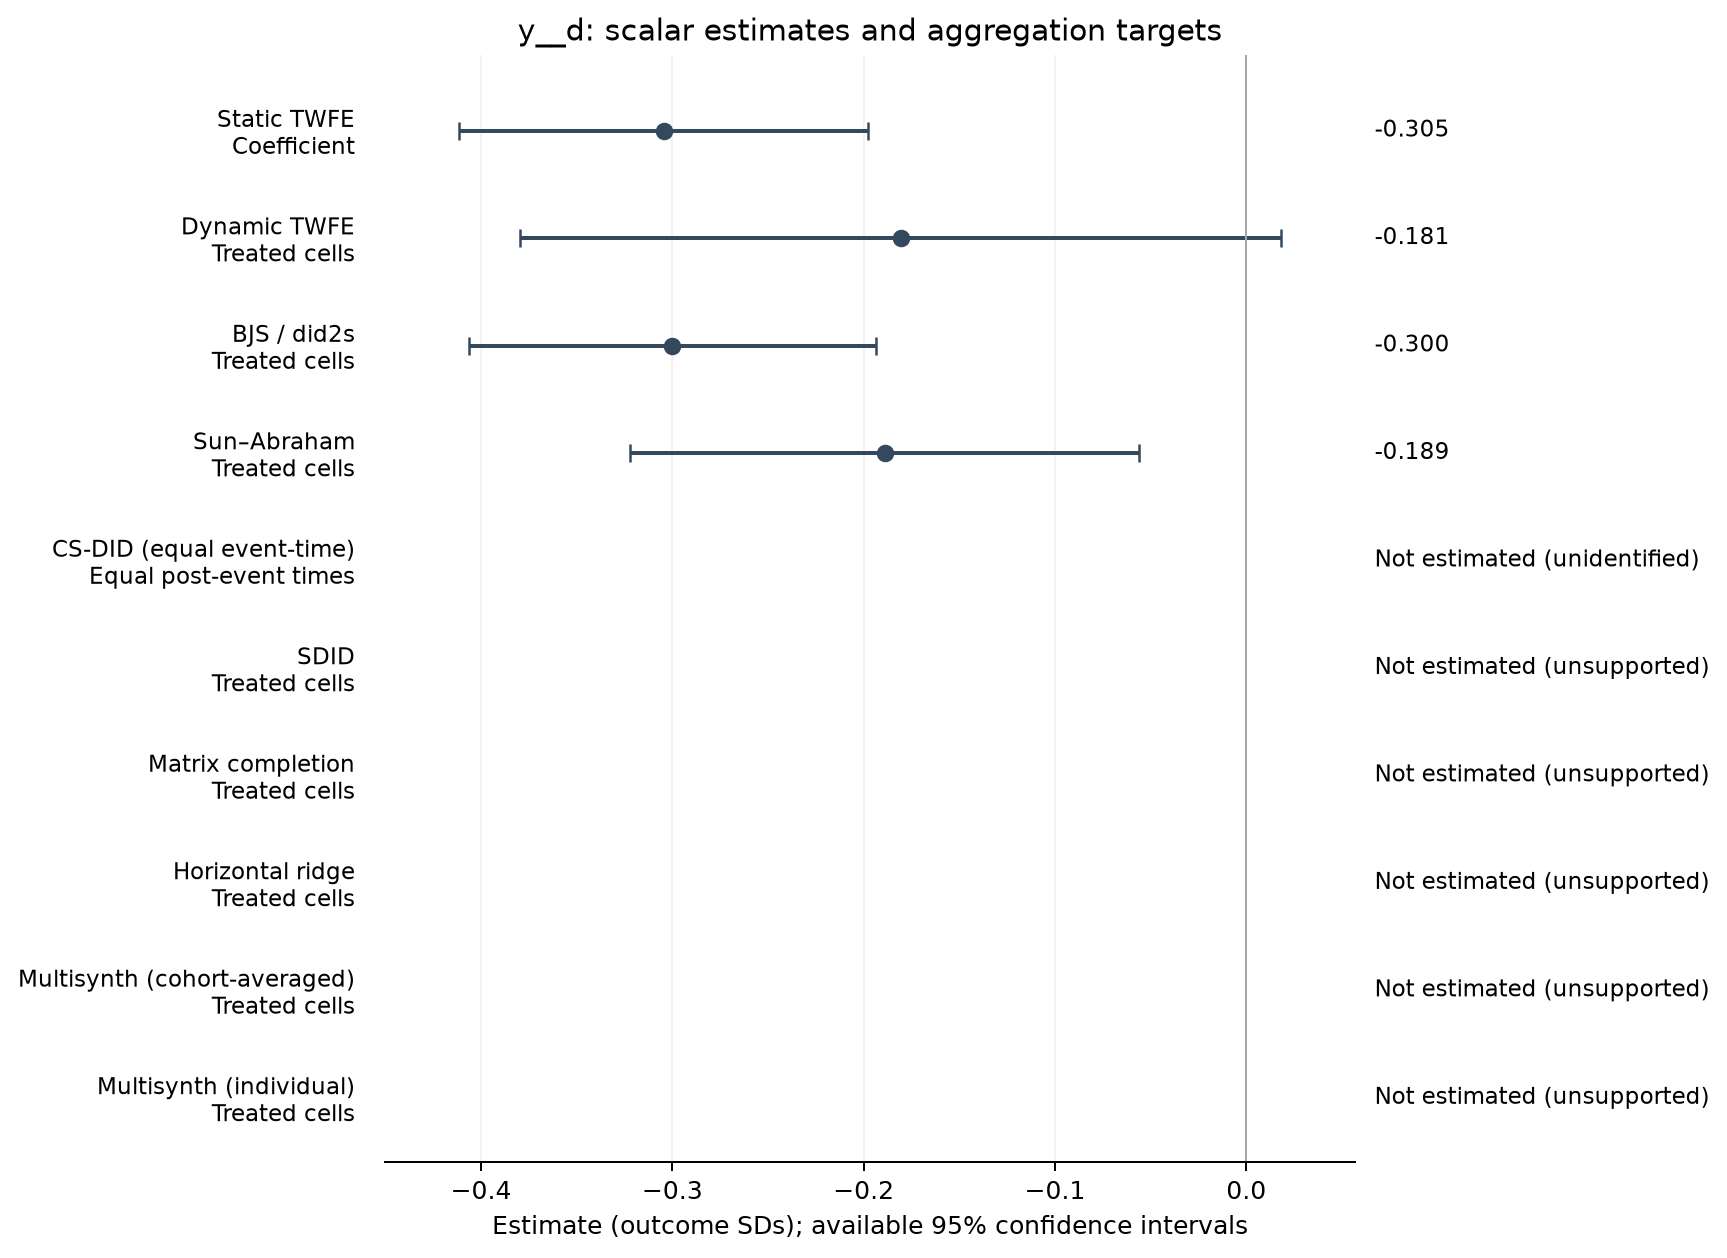
REXER-T2-PA-ONSHORE-C4
2,096 observations · 193 units · 193 clusters · 52 treated / 141 control units.
Estimate comparison
| Estimator | Estimate (SDs) | SE | 95% CI | Averaging |
|---|---|---|---|---|
| Static TWFE | -0.305 | 0.054 | [-0.412, -0.198] | Coefficient |
| Dynamic TWFE | -0.181 | 0.101 | [-0.380, 0.018] | Treated cells |
| BJS / did2s | -0.300 | 0.054 | [-0.406, -0.194] | Treated cells |
| Sun–Abraham | -0.189 | 0.067 | [-0.322, -0.056] | Treated cells |
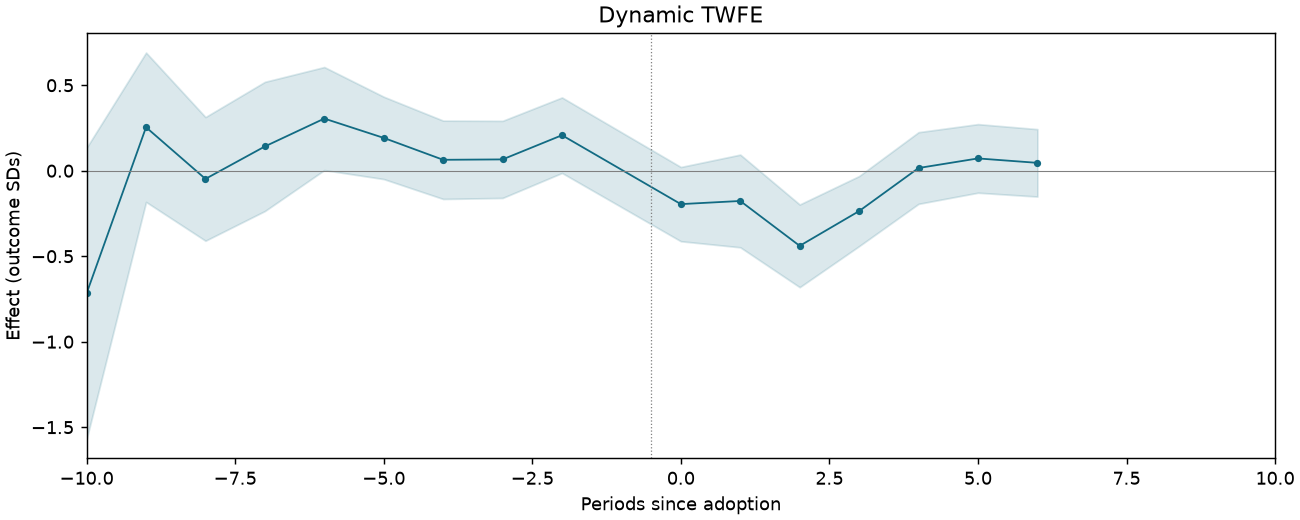
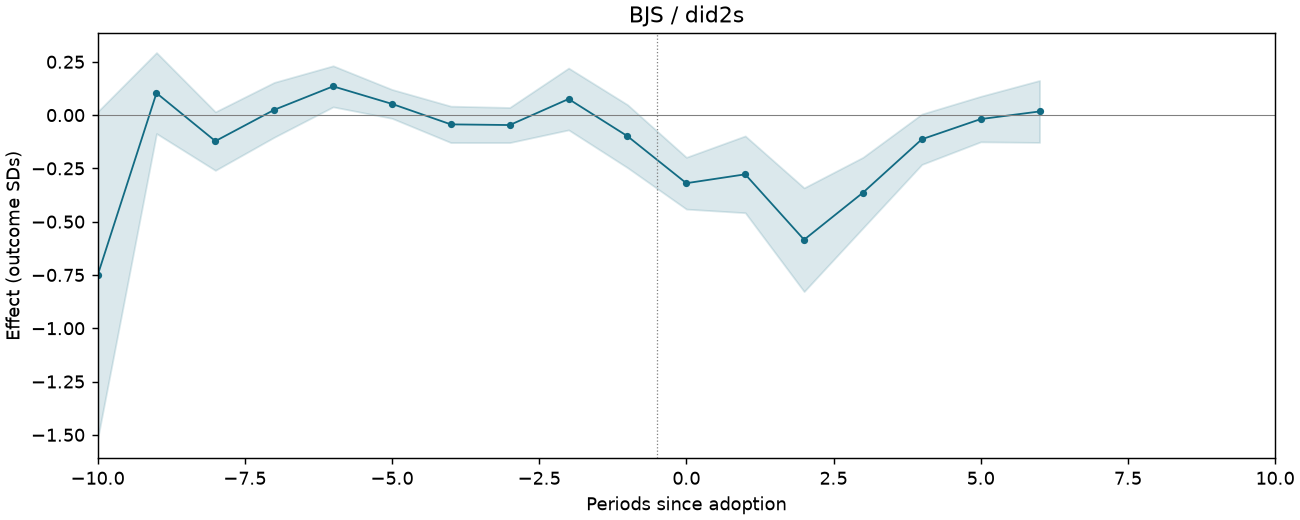
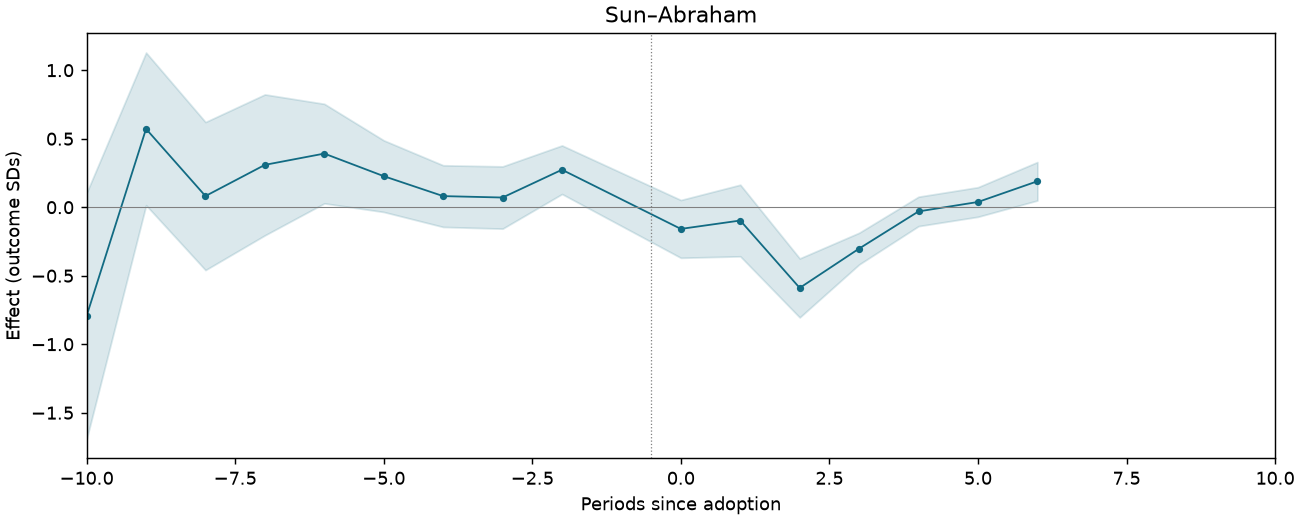
Event studies
Periods −10 to +10; pointwise 95% intervals where available.
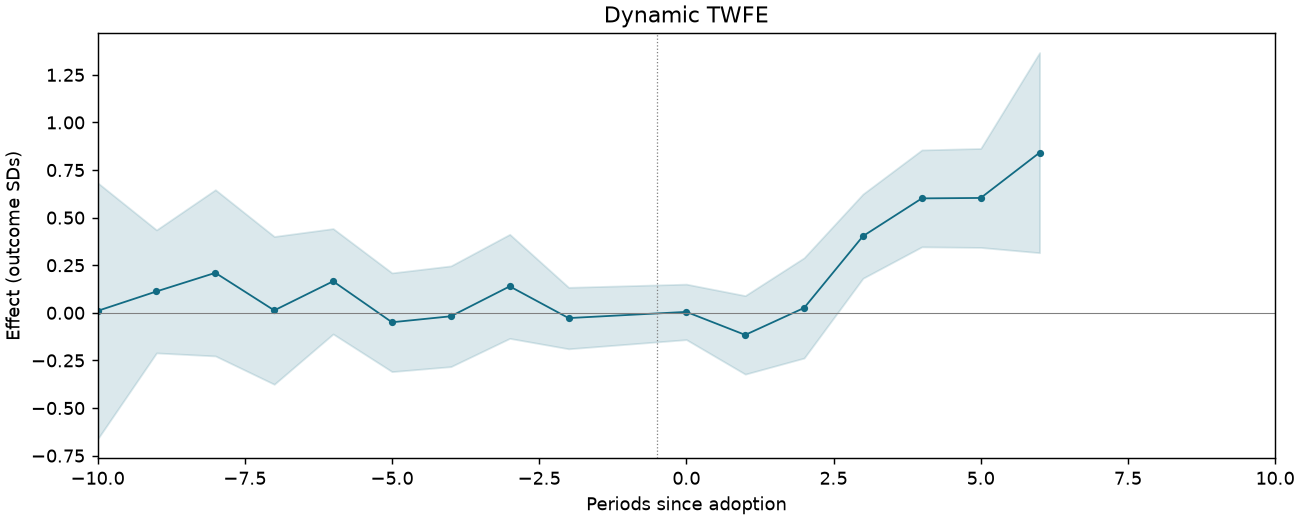
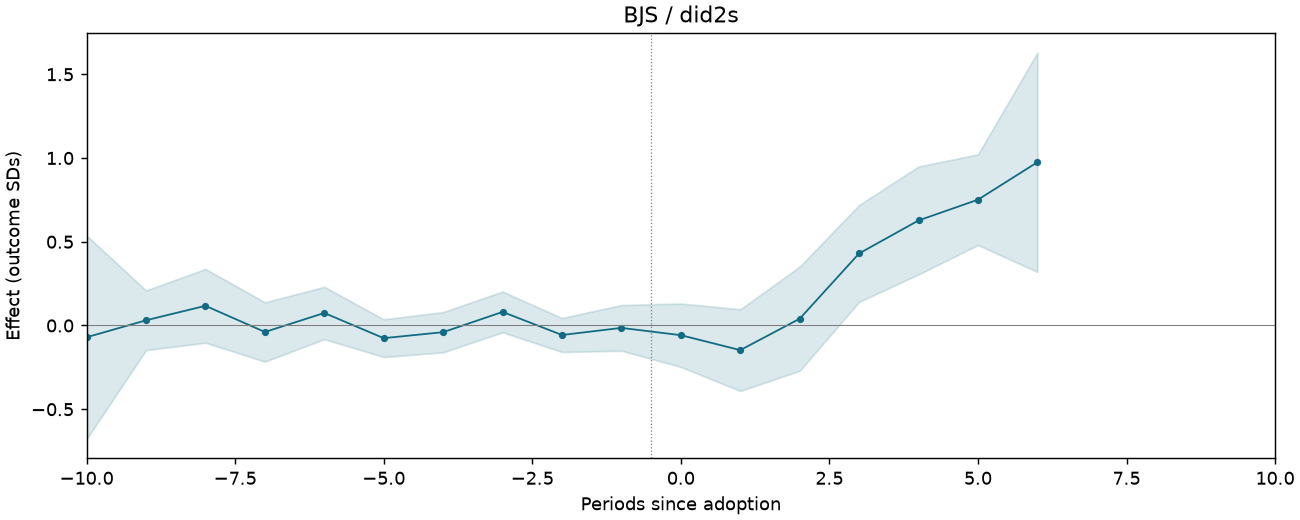
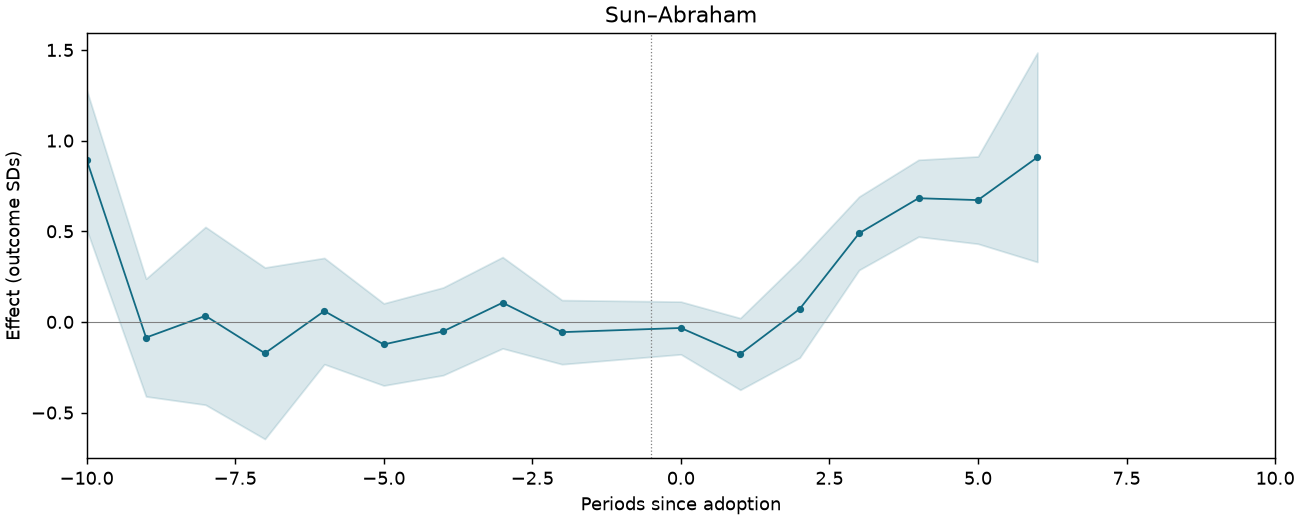
Operational oil spills: count of non-sabotage spills within 15 km of the field
The archive supplies frozen estimates but not this specification’s input sample or required outcome/controls.
REXER-T2-PA-ONSHORE-C6
2,096 observations · 193 units · 193 clusters · 52 treated / 141 control units.
Estimate comparison
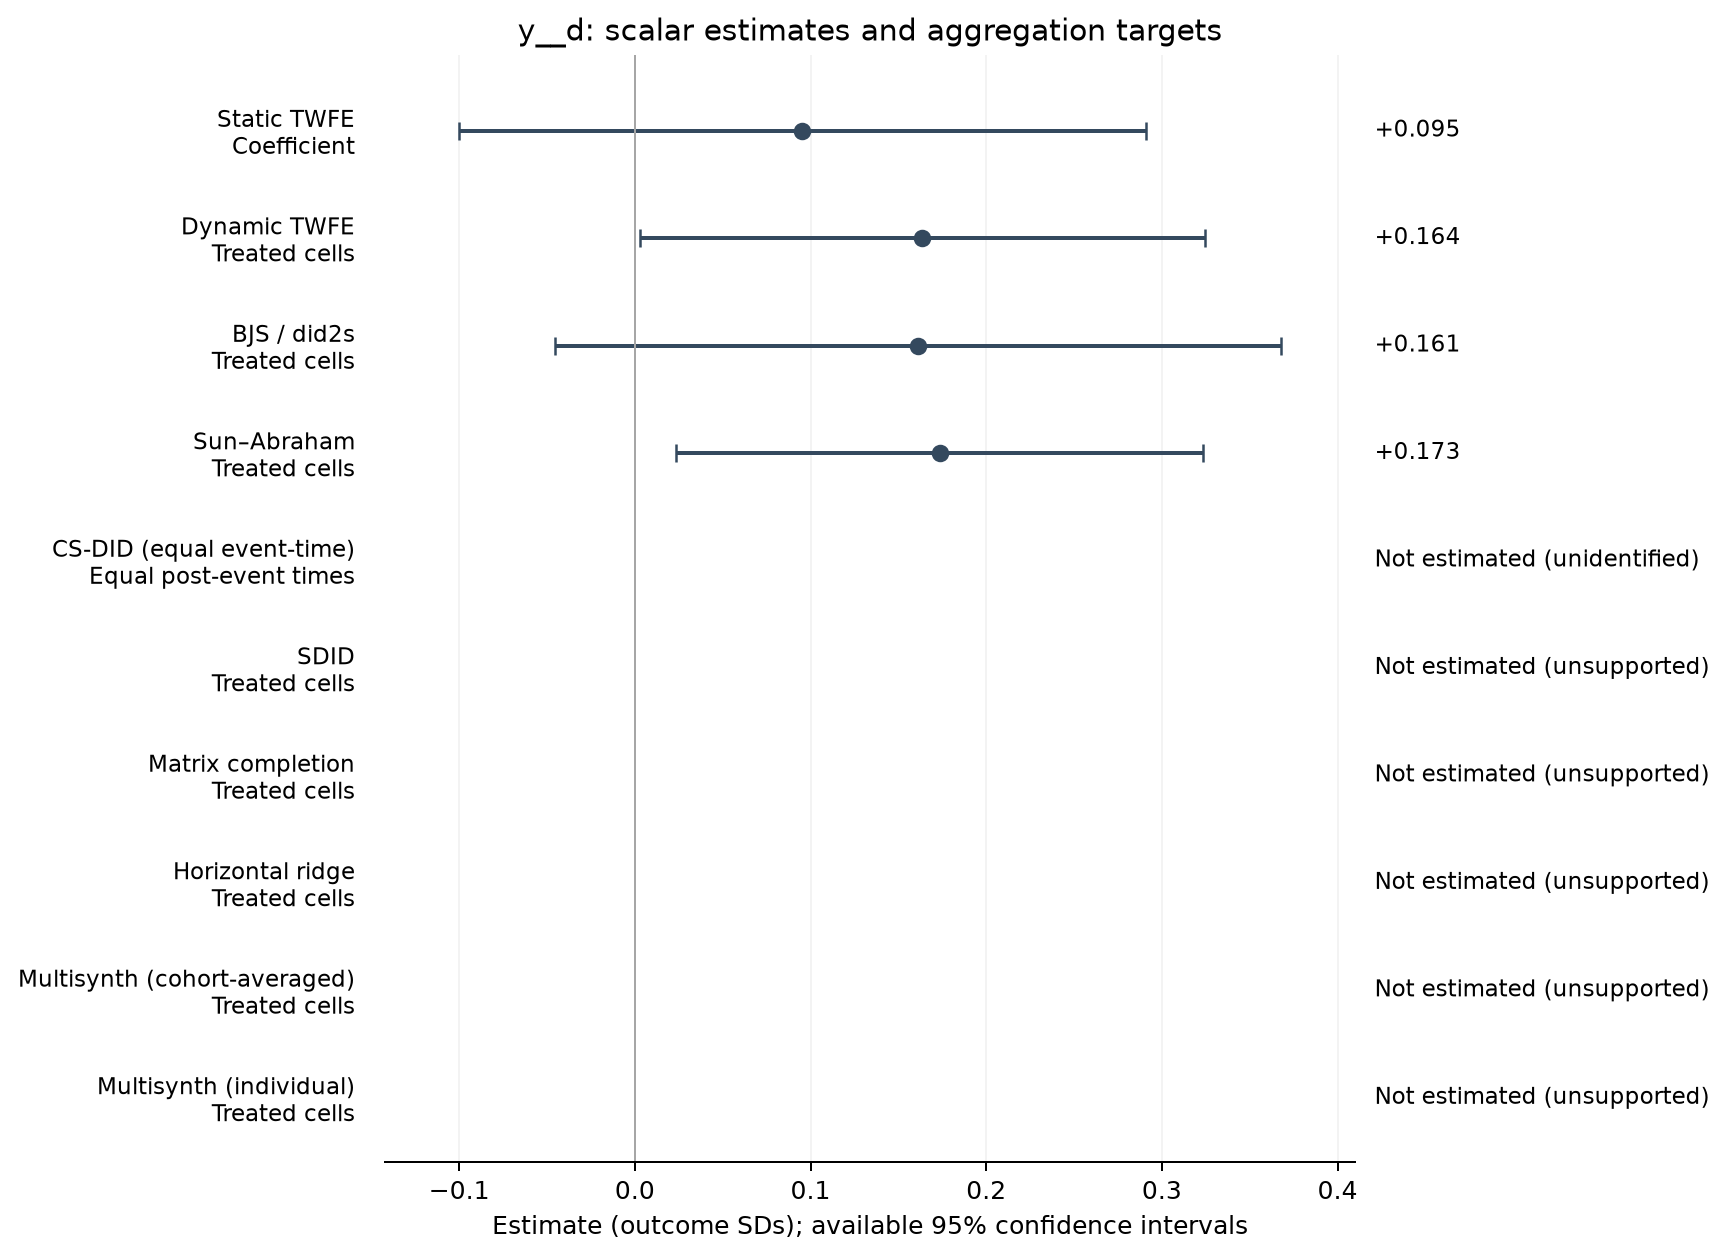
| Estimator | Estimate (SDs) | SE | 95% CI | Averaging |
|---|---|---|---|---|
| Static TWFE | 0.095 | 0.099 | [-0.100, 0.291] | Coefficient |
| Dynamic TWFE | 0.164 | 0.082 | [0.003, 0.324] | Treated cells |
| BJS / did2s | 0.161 | 0.105 | [-0.045, 0.368] | Treated cells |
| Sun–Abraham | 0.173 | 0.076 | [0.023, 0.324] | Treated cells |
Event studies
Periods −10 to +10; pointwise 95% intervals where available.
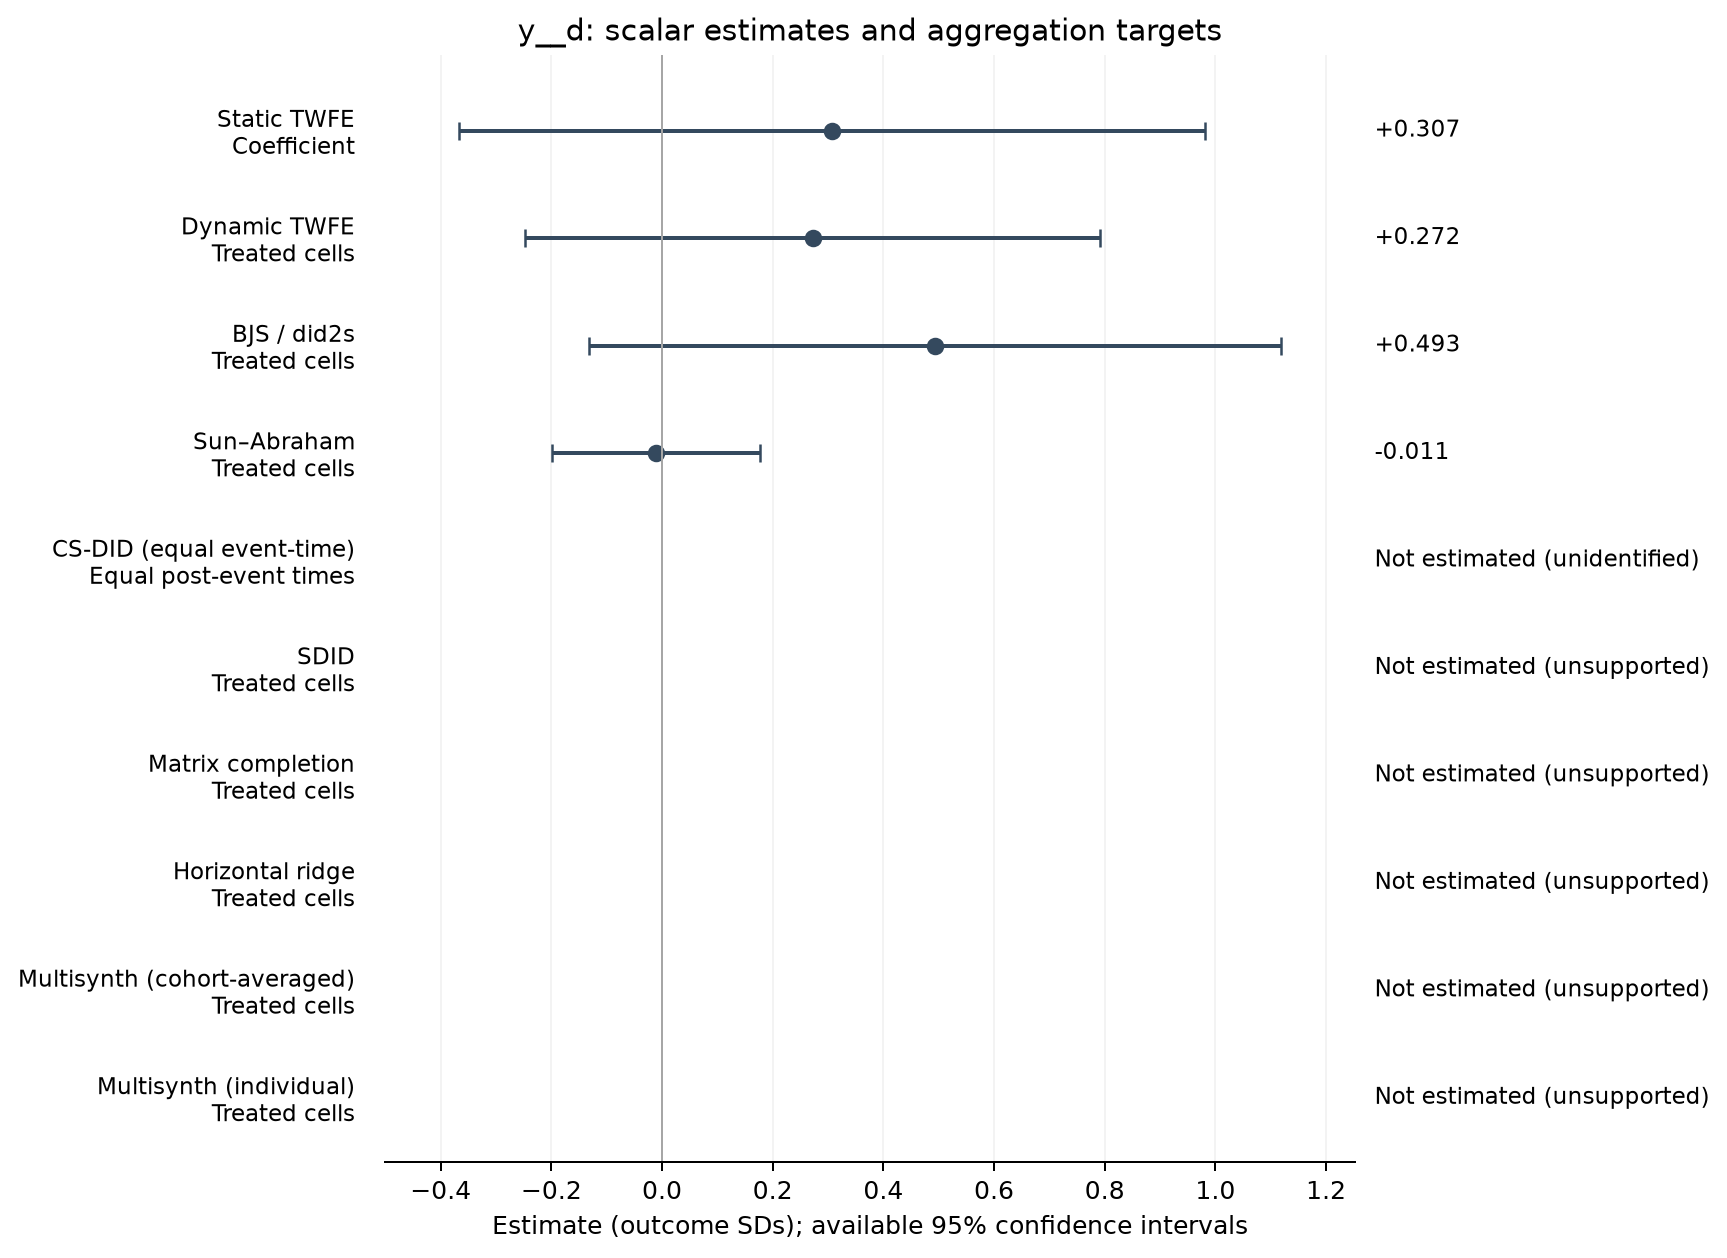
Oil theft: count of sabotage spills within 15 km of the field
The archive supplies frozen estimates but not this specification’s input sample or required outcome/controls.
REXER-T2-PB-OFFSHORE-C4
799 observations · 78 units · 78 clusters · 4 treated / 74 control units.
Estimate comparison
| Estimator | Estimate (SDs) | SE | 95% CI | Averaging |
|---|---|---|---|---|
| Static TWFE | 0.307 | 0.338 | [-0.367, 0.980] | Coefficient |
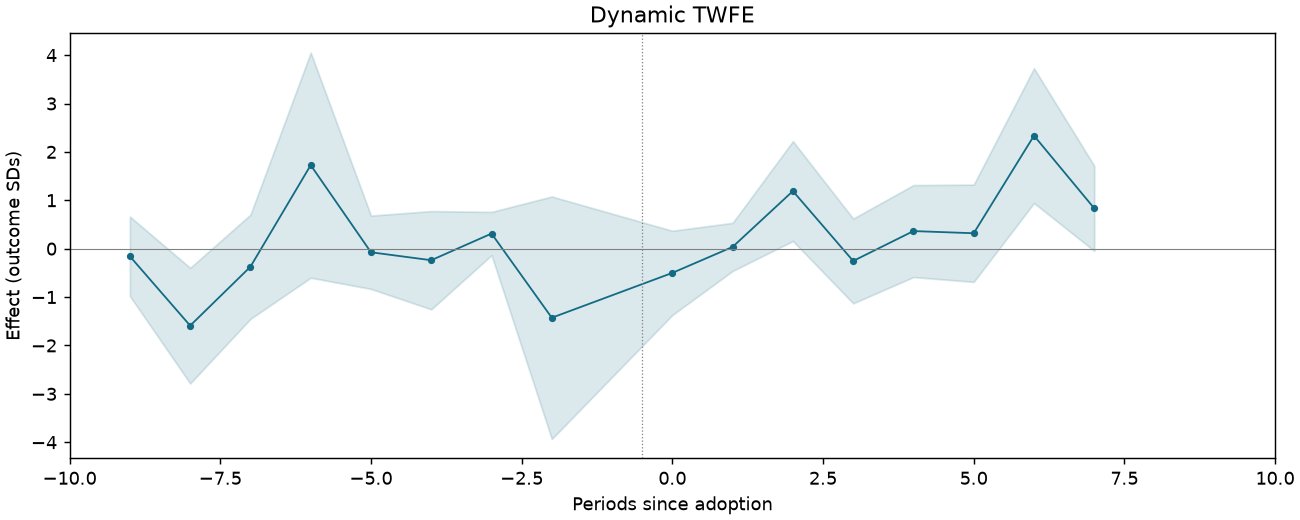
| Dynamic TWFE | 0.272 | 0.261 | [-0.247, 0.791] | Treated cells |
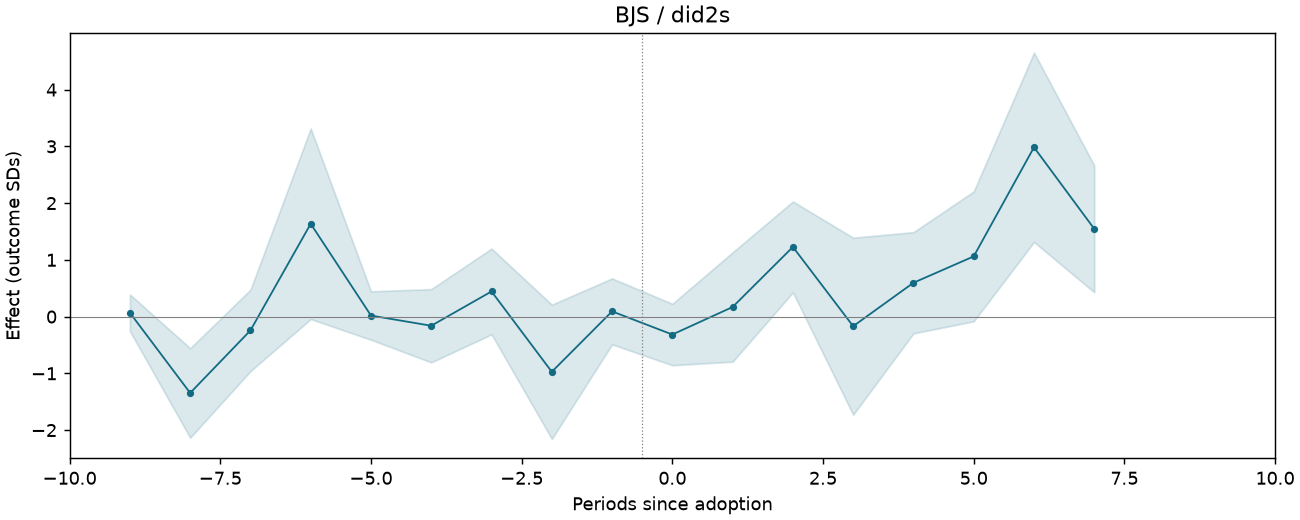
| BJS / did2s | 0.493 | 0.314 | [-0.133, 1.119] | Treated cells |
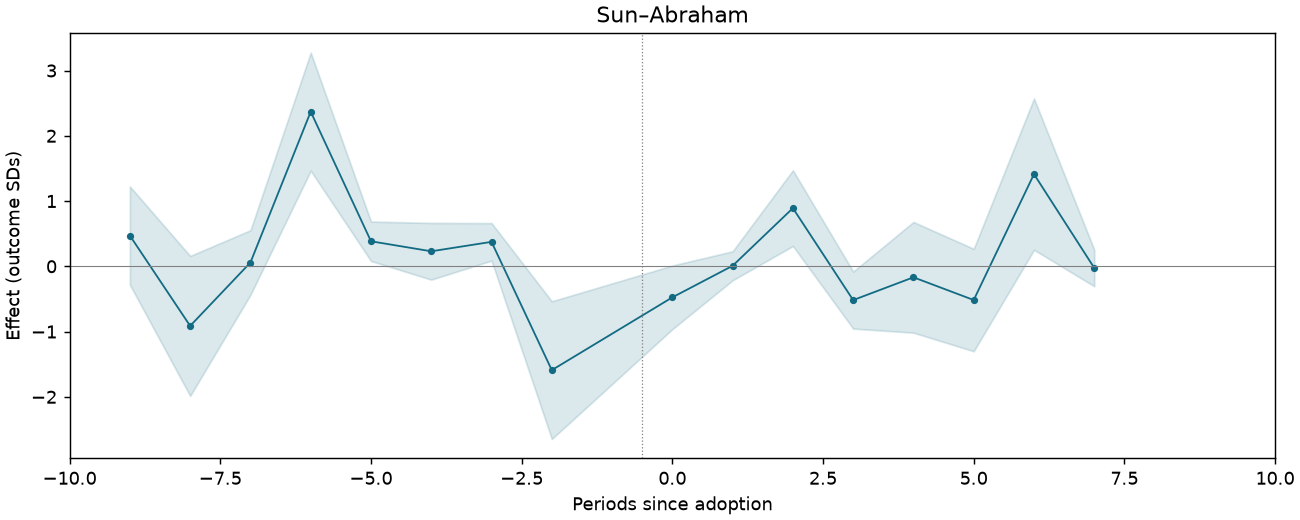
| Sun–Abraham | -0.011 | 0.094 | [-0.199, 0.176] | Treated cells |
Event studies
Periods −10 to +10; pointwise 95% intervals where available.
Operational oil spills: count of non-sabotage spills within 15 km of the field
The archive supplies frozen estimates but not this specification’s input sample or required outcome/controls.
REXER-T2-PB-OFFSHORE-C6
799 observations · 78 units · 78 clusters · 4 treated / 74 control units.
Estimate comparison
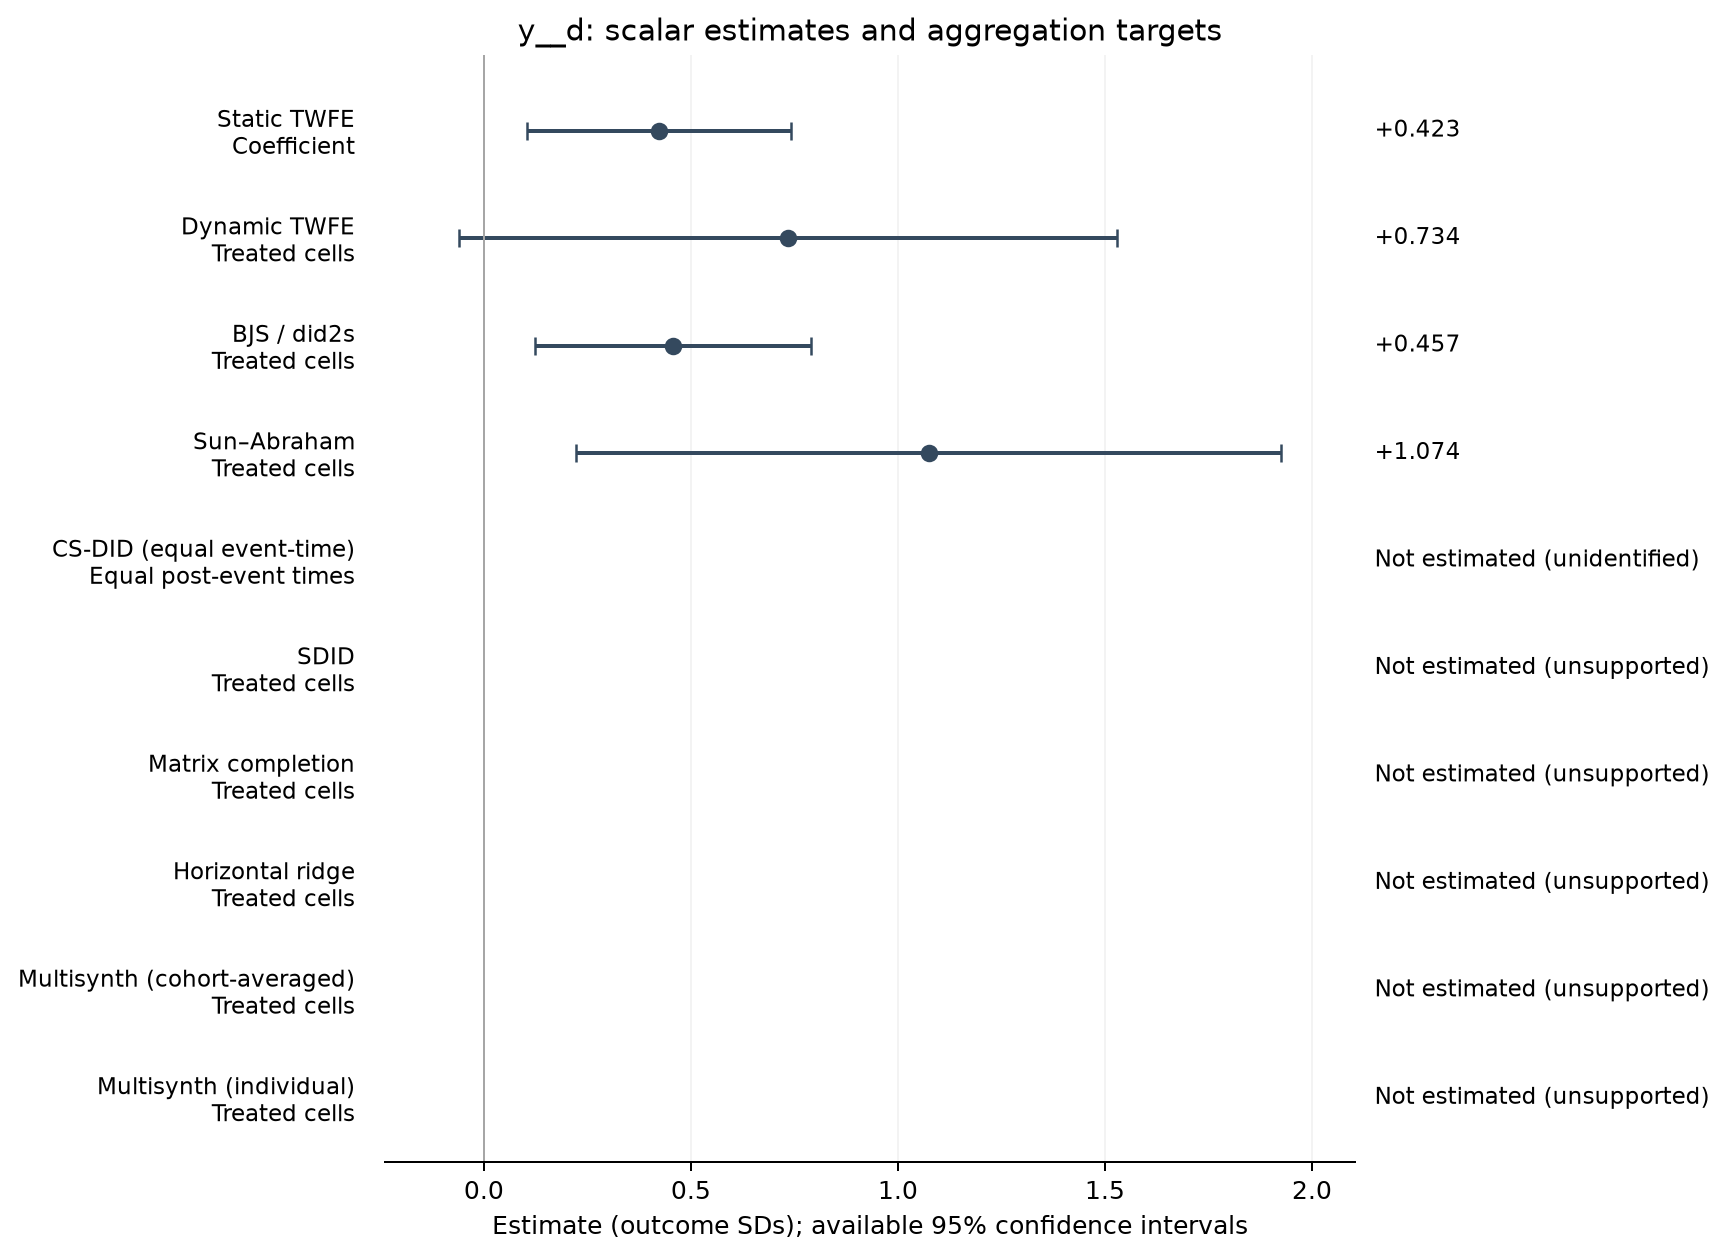
| Estimator | Estimate (SDs) | SE | 95% CI | Averaging |
|---|---|---|---|---|
| Static TWFE | 0.423 | 0.160 | [0.104, 0.741] | Coefficient |
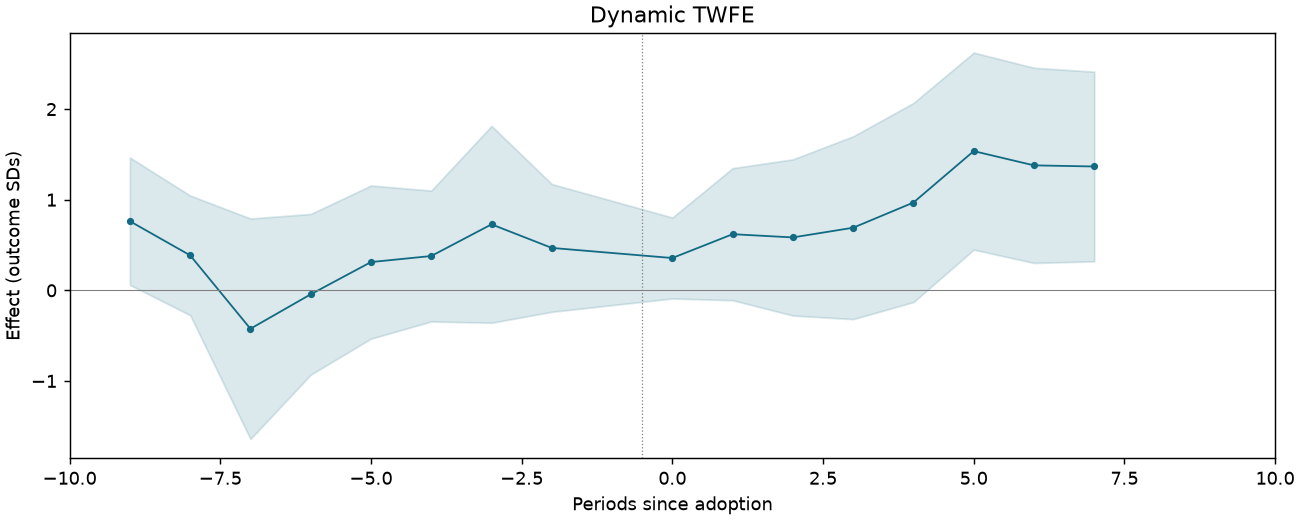
| Dynamic TWFE | 0.734 | 0.399 | [-0.060, 1.529] | Treated cells |
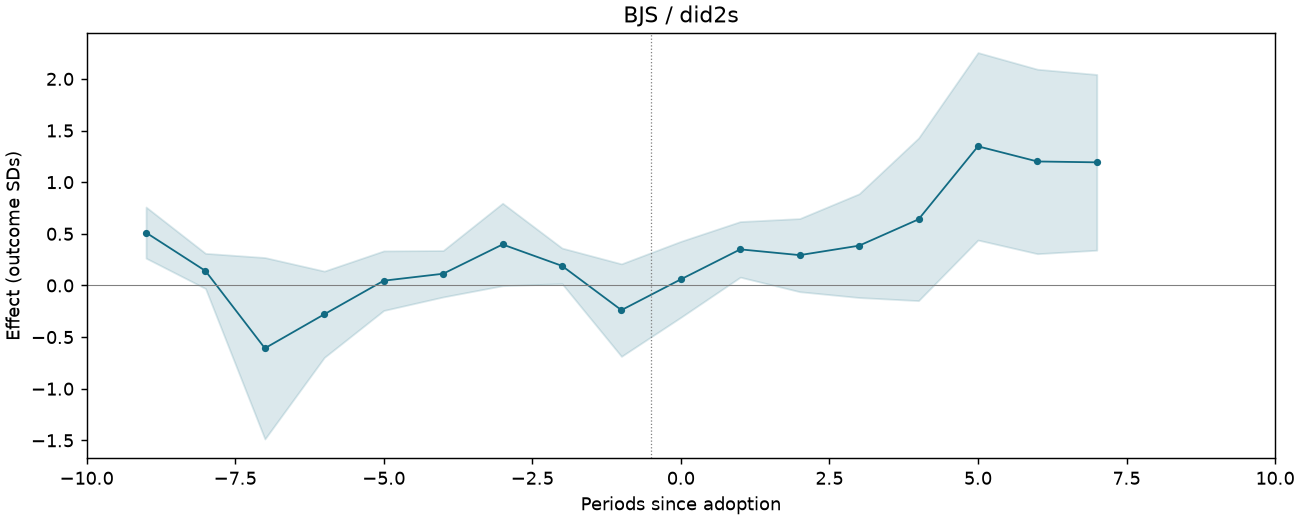
| BJS / did2s | 0.457 | 0.167 | [0.124, 0.791] | Treated cells |
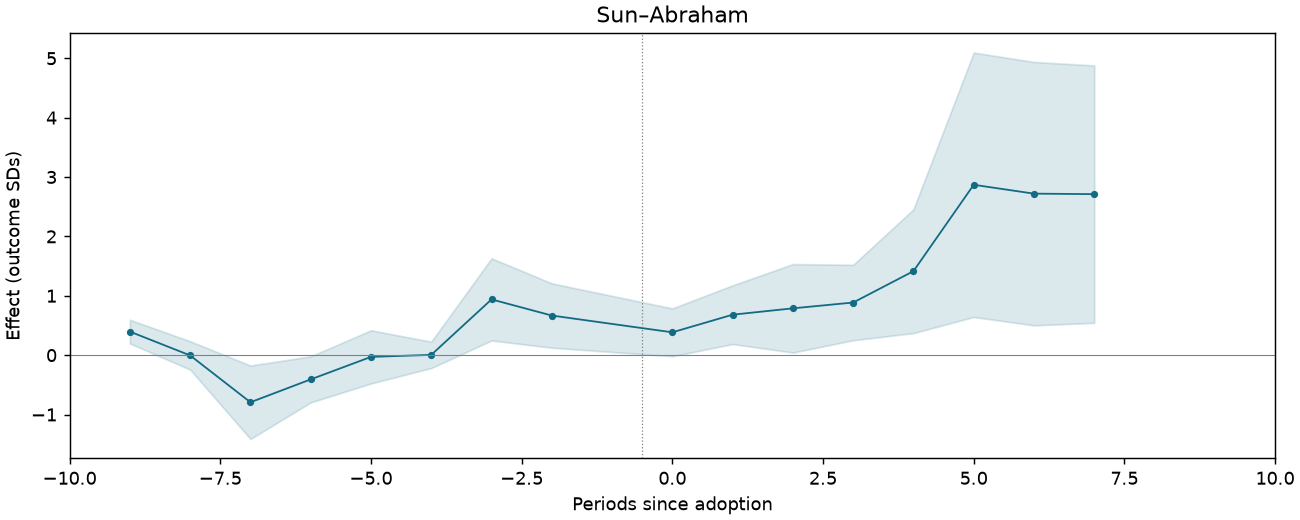
| Sun–Abraham | 1.074 | 0.428 | [0.223, 1.926] | Treated cells |
Event studies
Periods −10 to +10; pointwise 95% intervals where available.
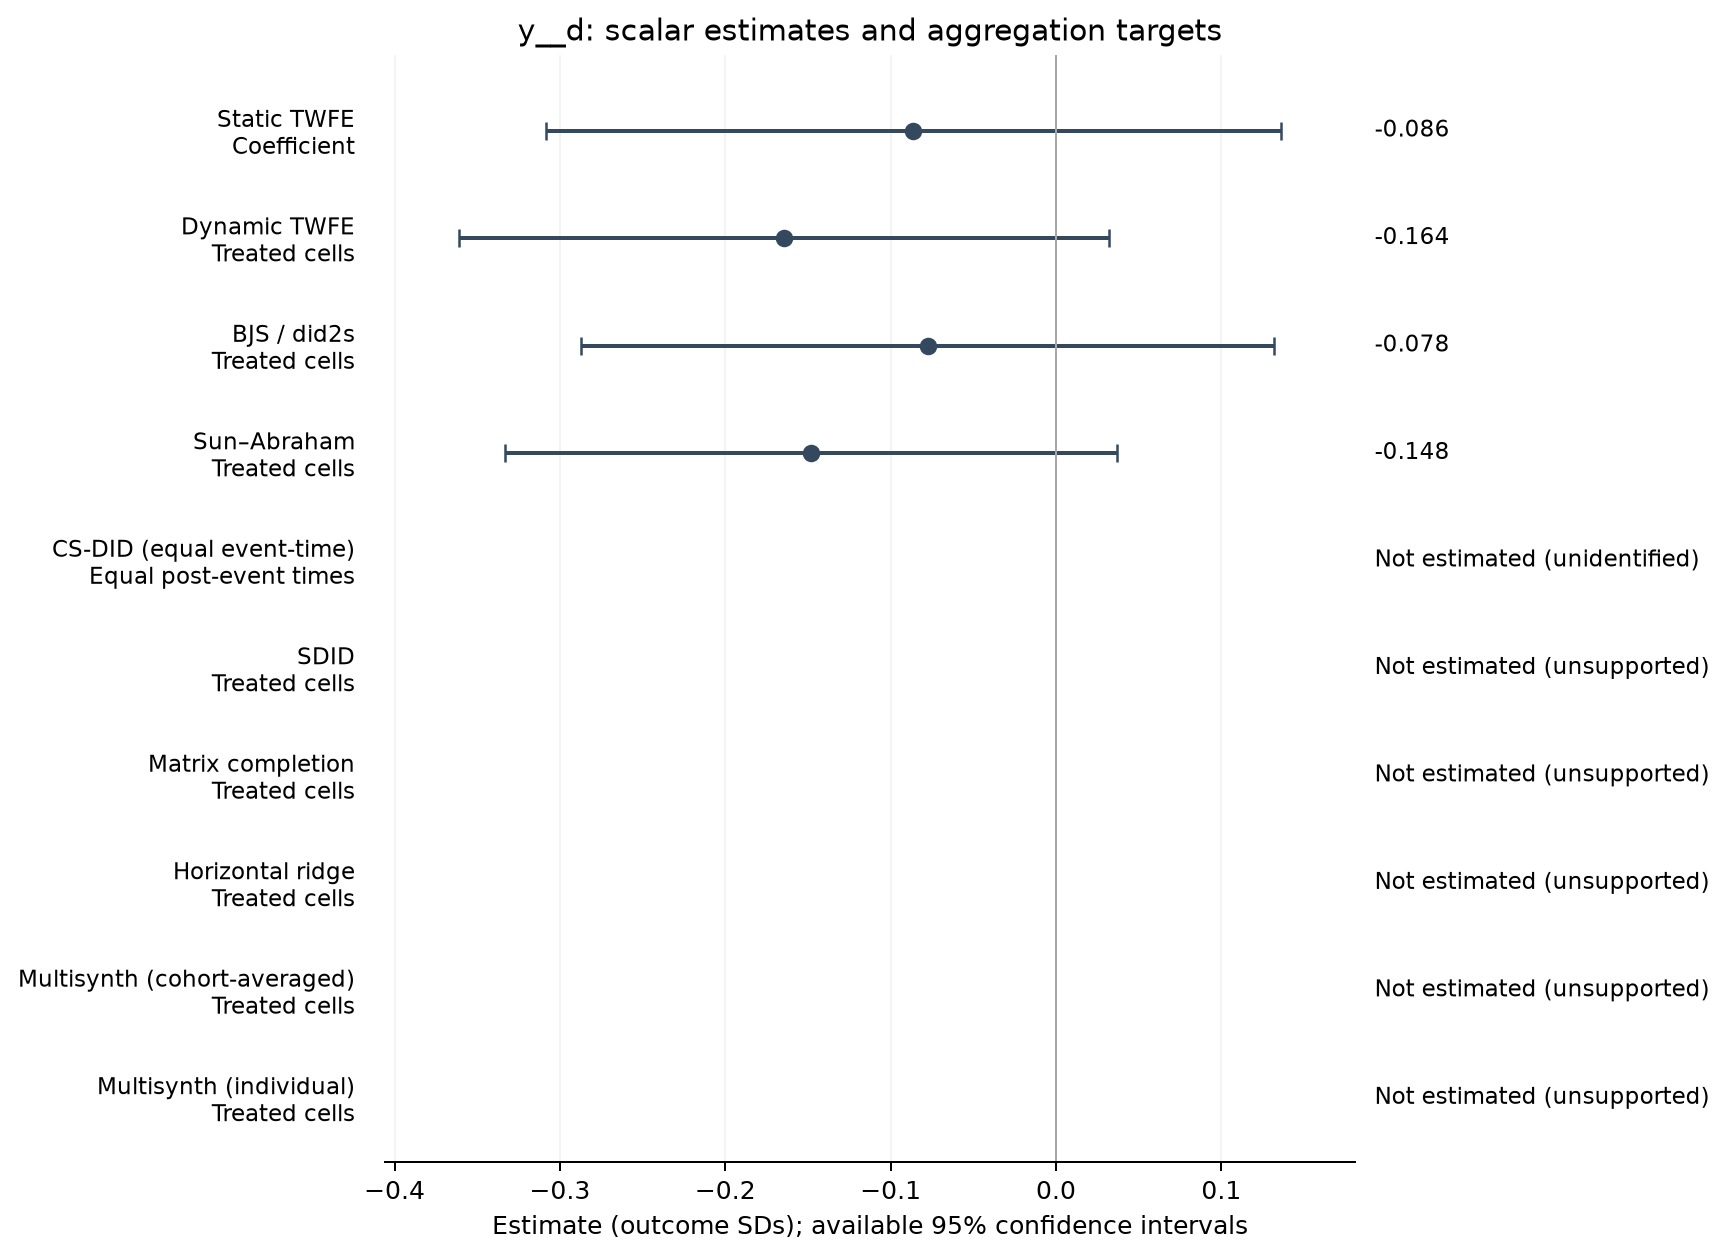
REXER-T3-C6-TERMINATED-HOLD
3,048 observations · 303 units · 303 clusters · 35 treated / 268 control units.
Estimate comparison
| Estimator | Estimate (SDs) | SE | 95% CI | Averaging |
|---|---|---|---|---|
| Static TWFE | -0.086 | 0.113 | [-0.309, 0.136] | Coefficient |
| Dynamic TWFE | -0.164 | 0.100 | [-0.361, 0.032] | Treated cells |
| BJS / did2s | -0.078 | 0.107 | [-0.287, 0.132] | Treated cells |
| Sun–Abraham | -0.148 | 0.094 | [-0.333, 0.037] | Treated cells |
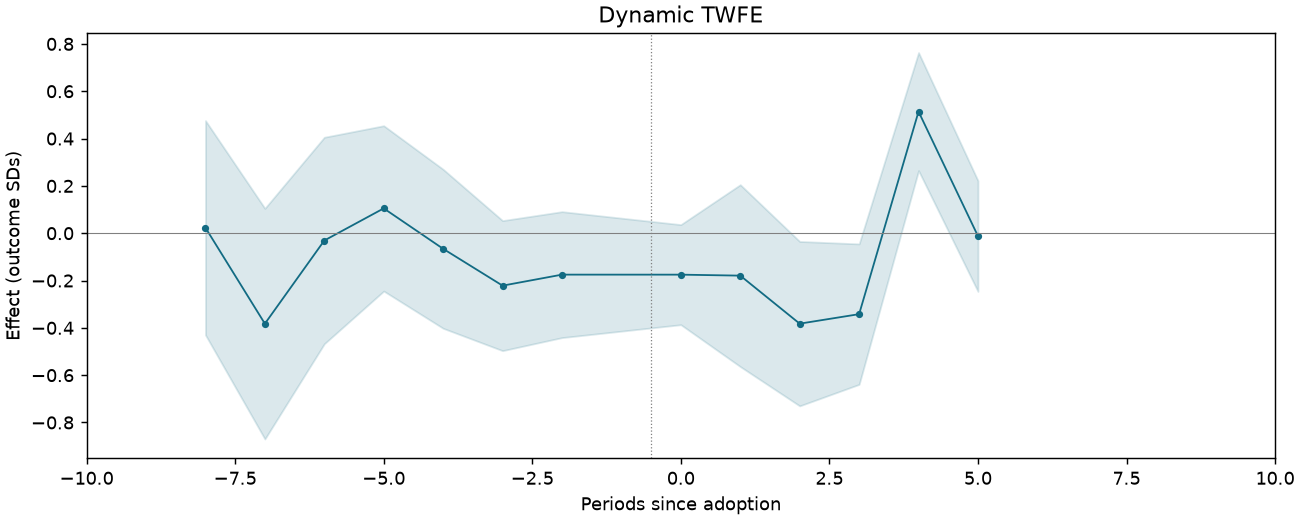
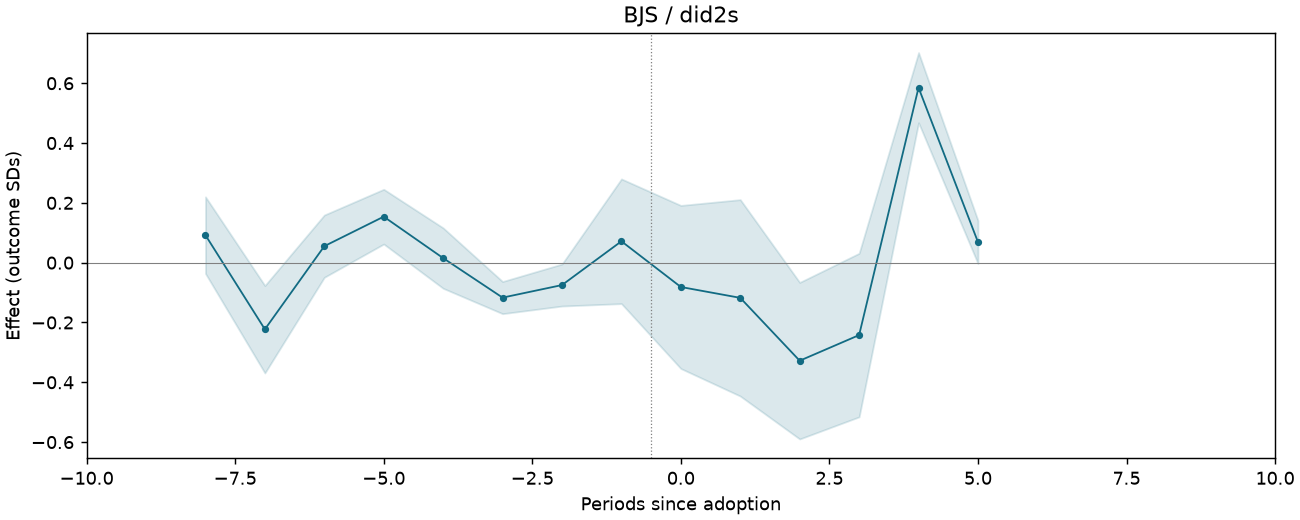
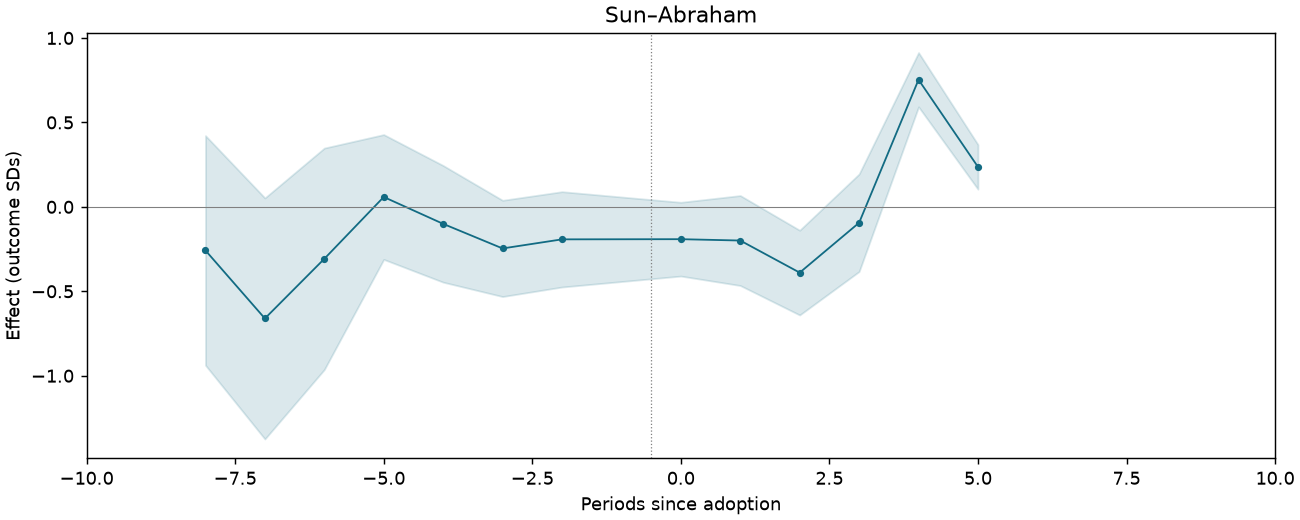
Event studies
Periods −10 to +10; pointwise 95% intervals where available.
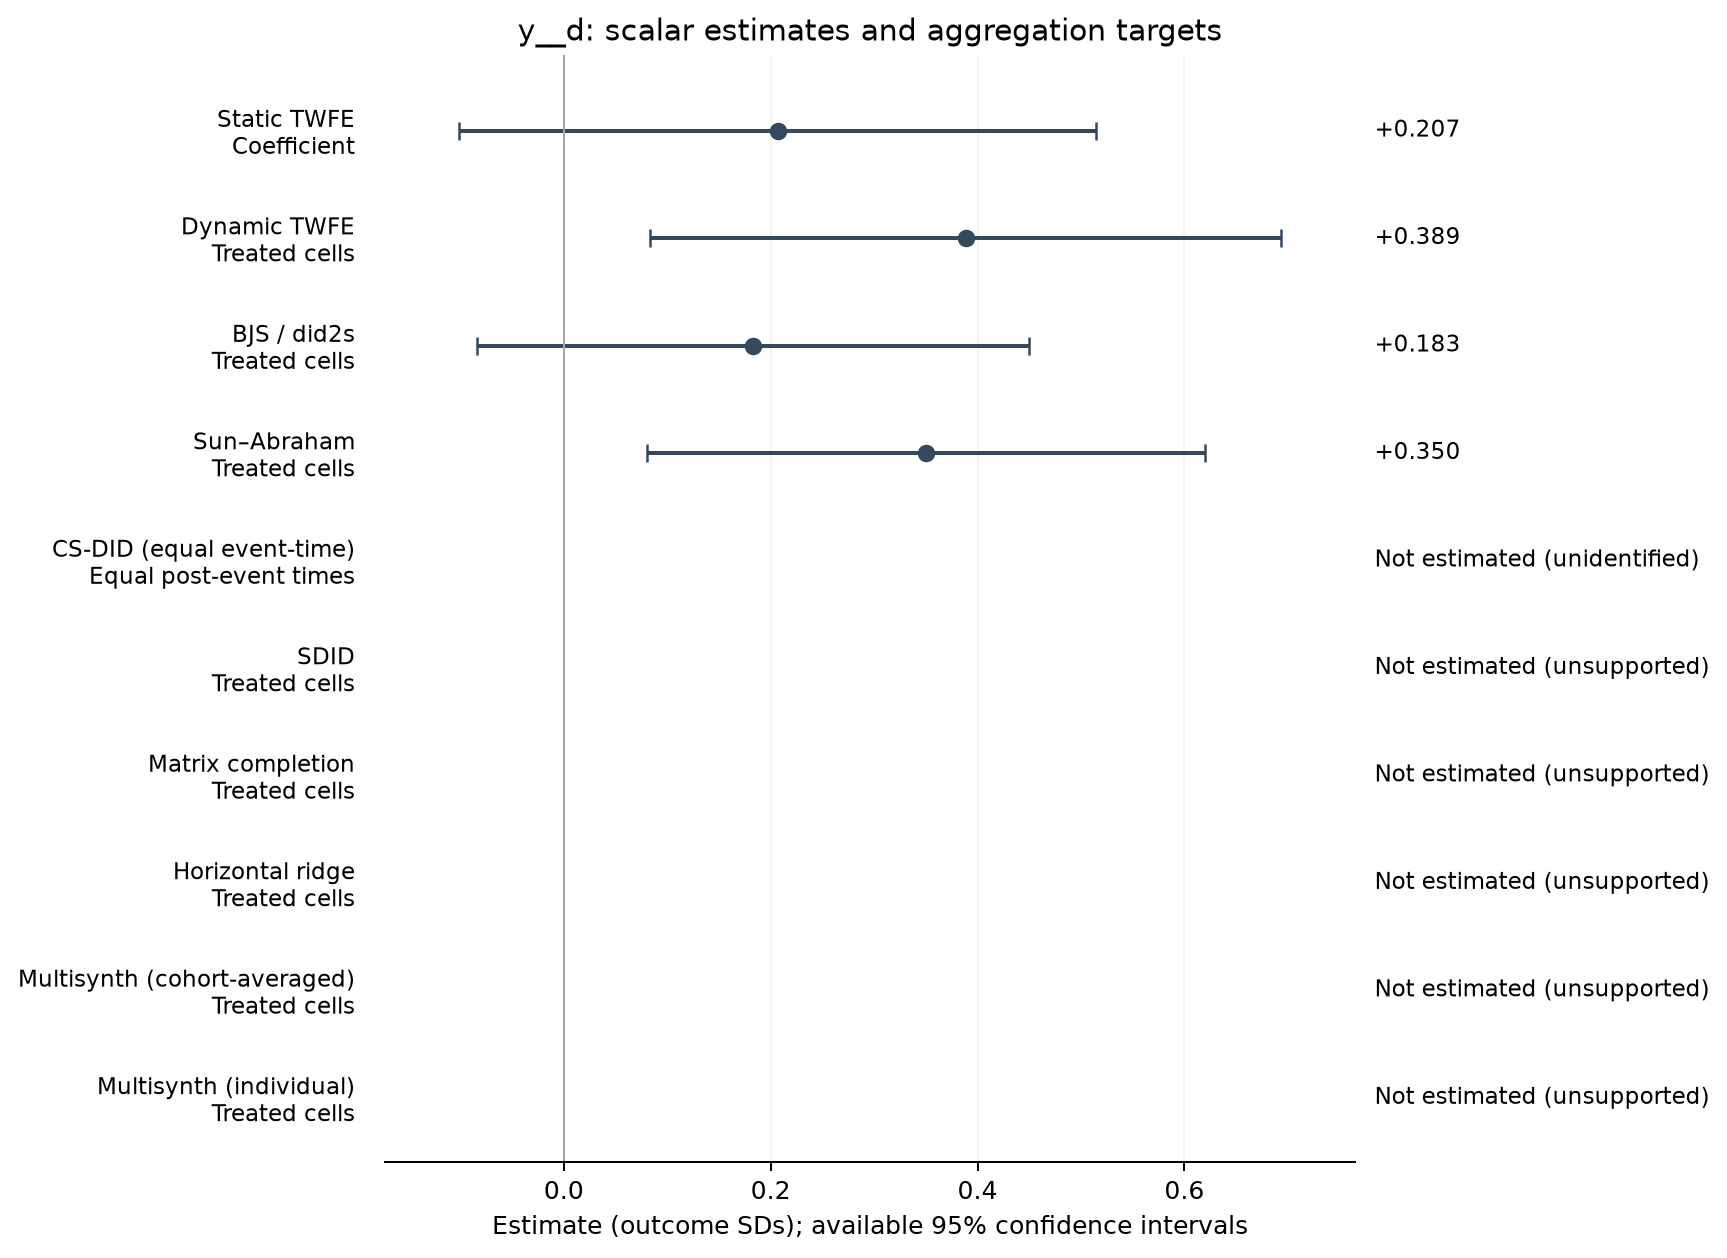
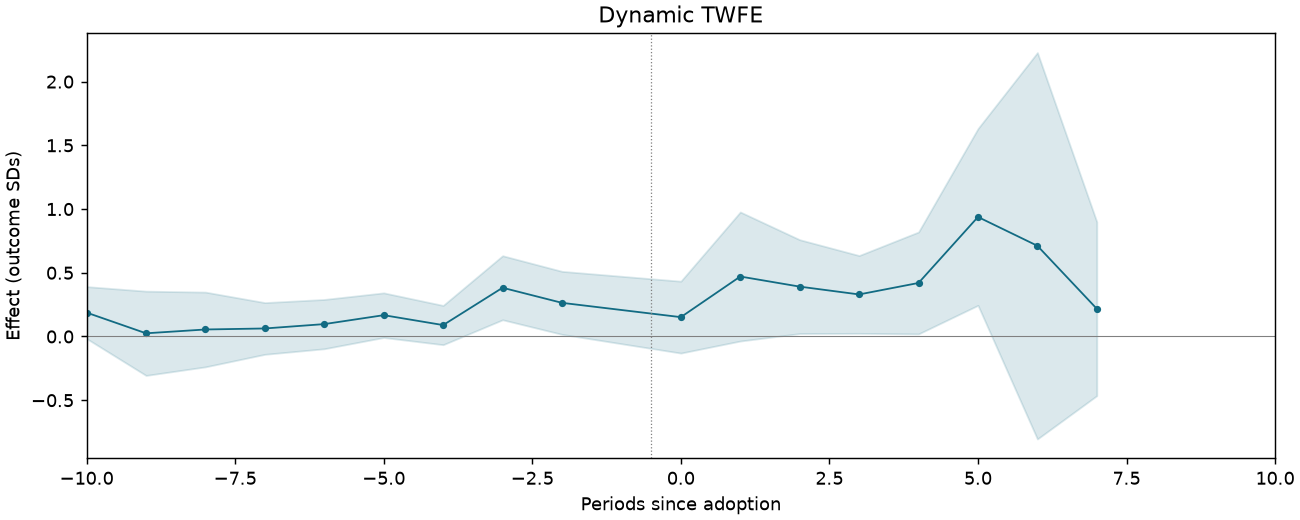
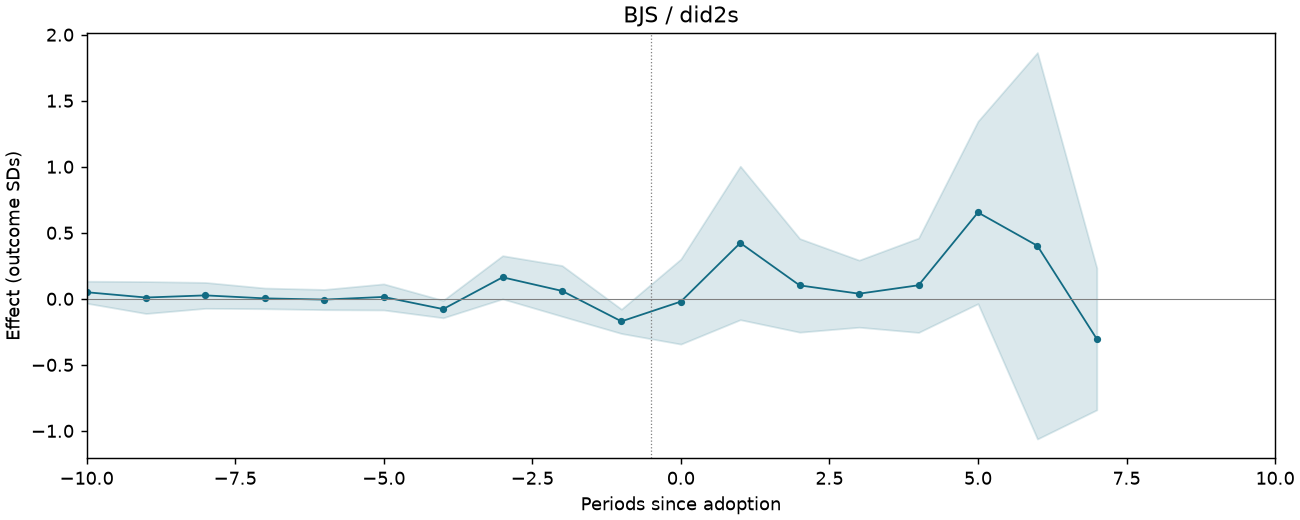
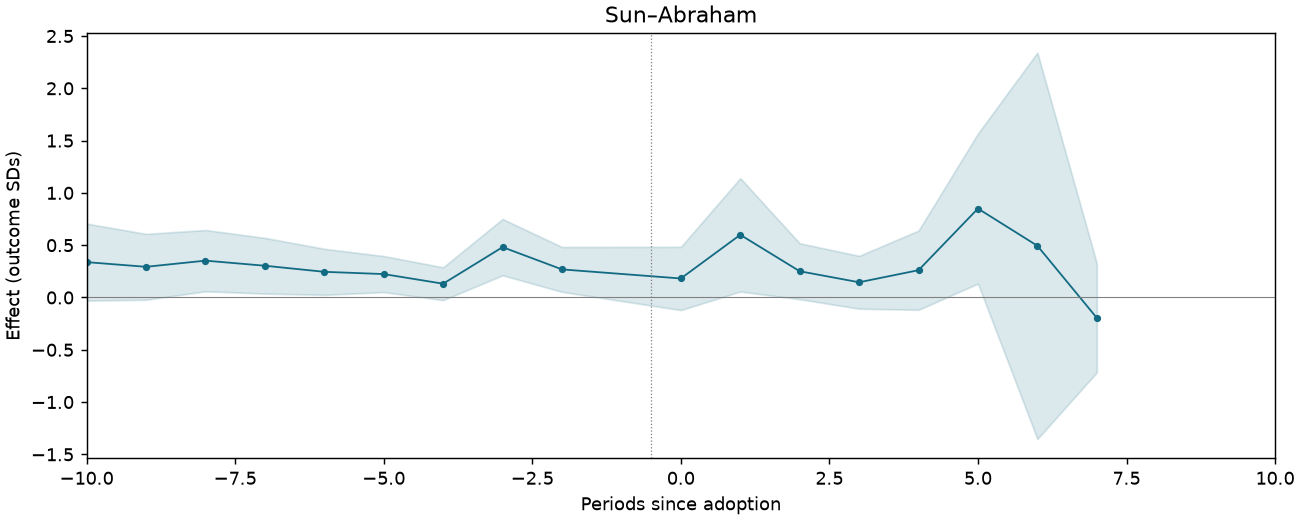
All anti-oil-theft law-enforcement events within 15 km
The archive supplies frozen estimates but not this specification’s input sample or required outcome/controls.
REXER-T4-C2
2,895 observations · 271 units · 271 clusters · 56 treated / 215 control units.
Estimate comparison
| Estimator | Estimate (SDs) | SE | 95% CI | Averaging |
|---|---|---|---|---|
| Static TWFE | 0.207 | 0.156 | [-0.101, 0.515] | Coefficient |
| Dynamic TWFE | 0.389 | 0.155 | [0.084, 0.694] | Treated cells |
| BJS / did2s | 0.183 | 0.135 | [-0.084, 0.449] | Treated cells |
| Sun–Abraham | 0.350 | 0.137 | [0.080, 0.620] | Treated cells |
Event studies
Periods −10 to +10; pointwise 95% intervals where available.
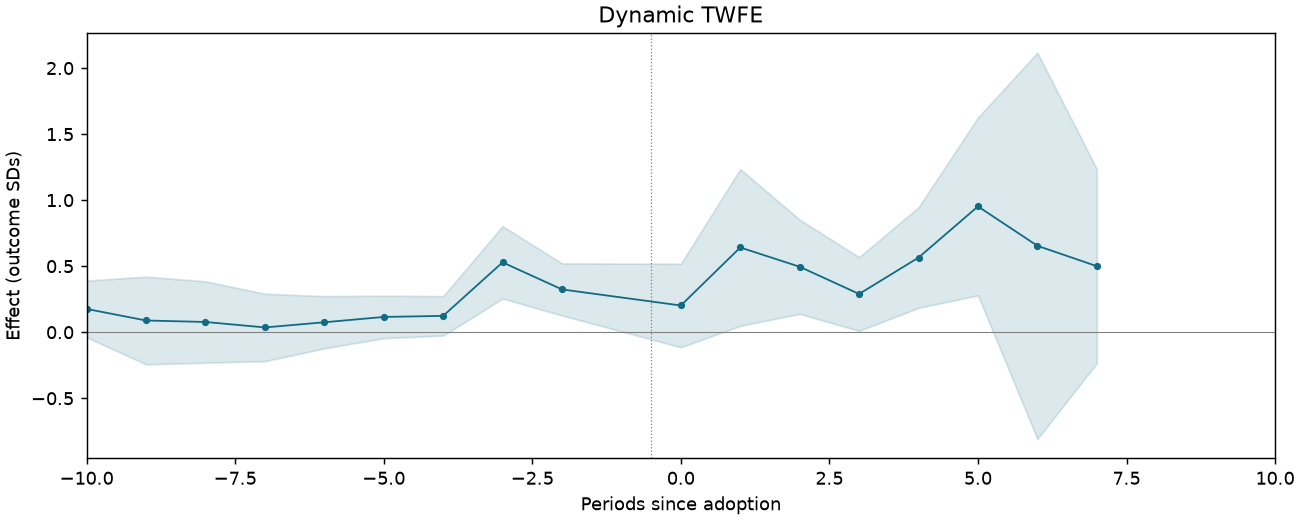
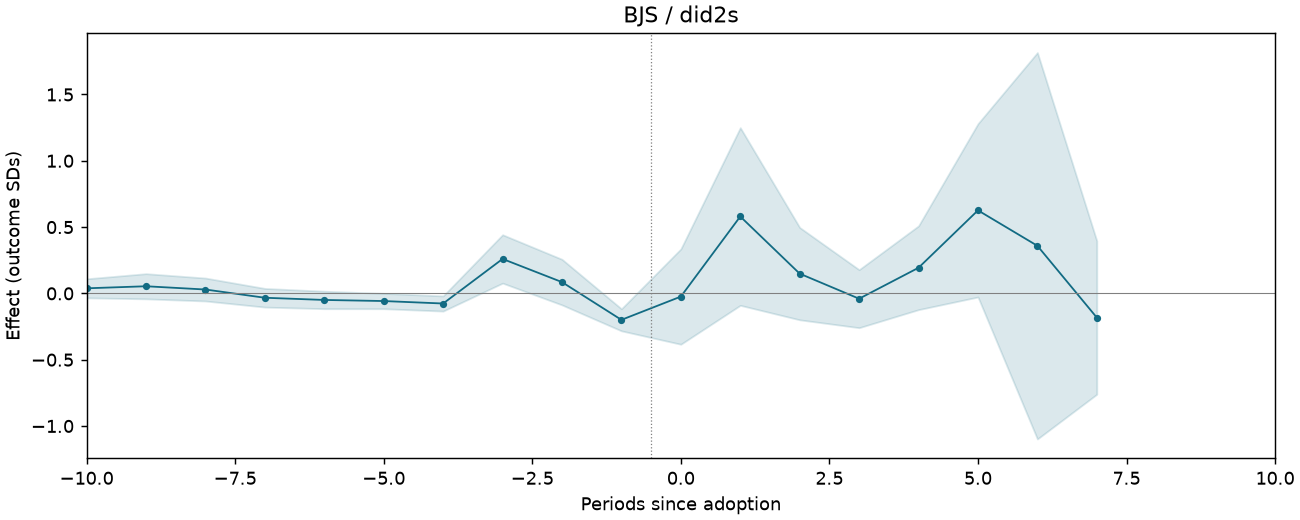
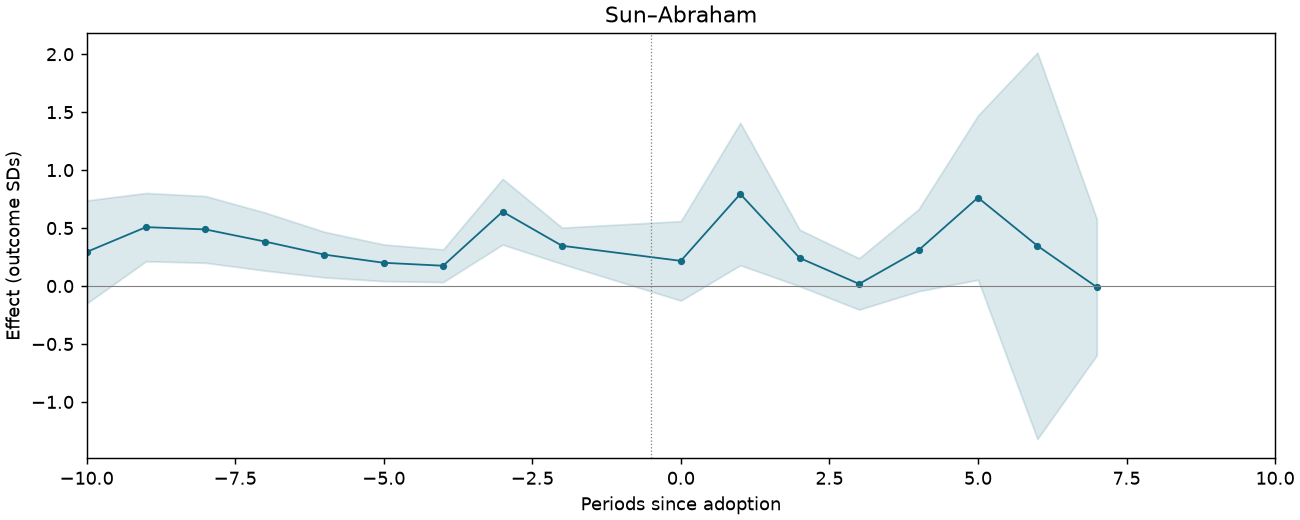
Oil-seizure enforcement events within 15 km
The archive supplies frozen estimates but not this specification’s input sample or required outcome/controls.
REXER-T4-C4
2,895 observations · 271 units · 271 clusters · 56 treated / 215 control units.
Estimate comparison
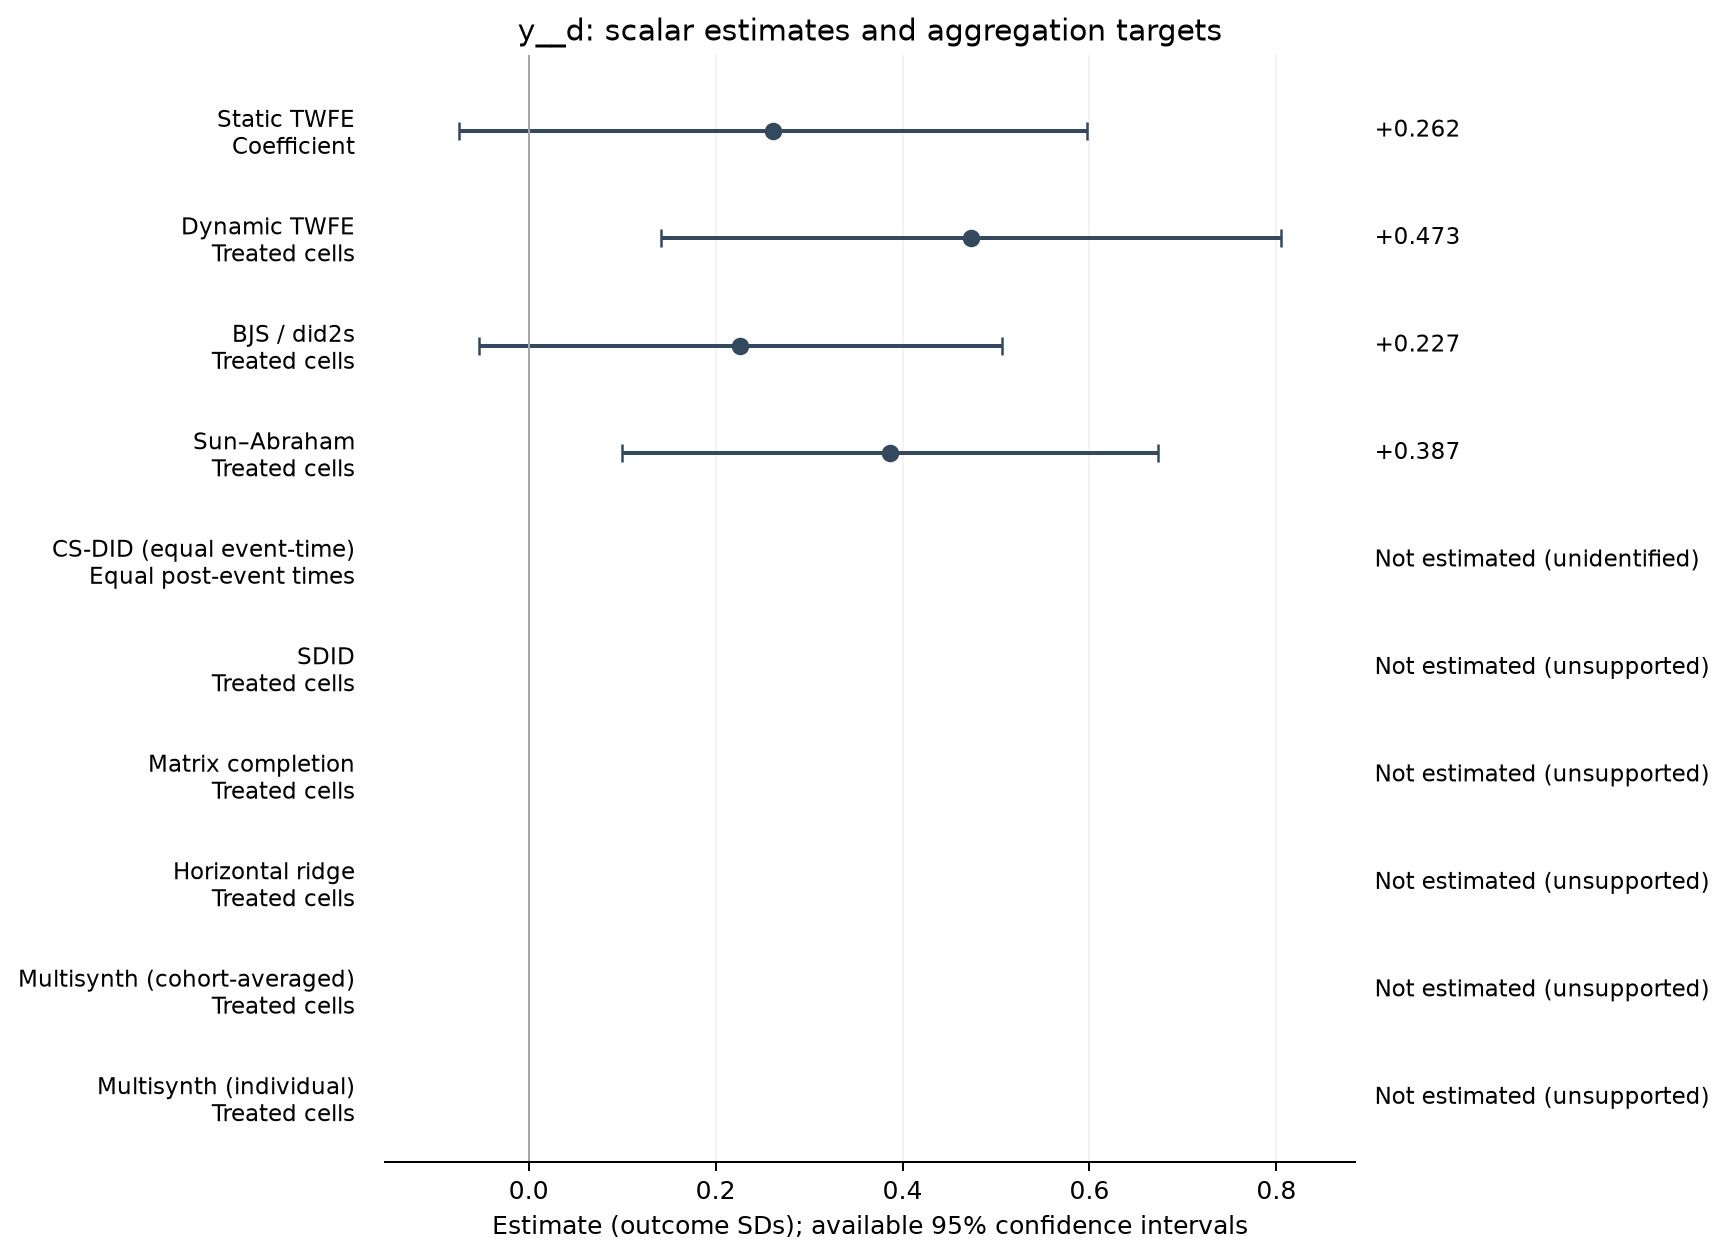
| Estimator | Estimate (SDs) | SE | 95% CI | Averaging |
|---|---|---|---|---|
| Static TWFE | 0.262 | 0.171 | [-0.075, 0.598] | Coefficient |
| Dynamic TWFE | 0.473 | 0.169 | [0.142, 0.805] | Treated cells |
| BJS / did2s | 0.227 | 0.142 | [-0.053, 0.506] | Treated cells |
| Sun–Abraham | 0.387 | 0.146 | [0.100, 0.674] | Treated cells |
Event studies
Periods −10 to +10; pointwise 95% intervals where available.
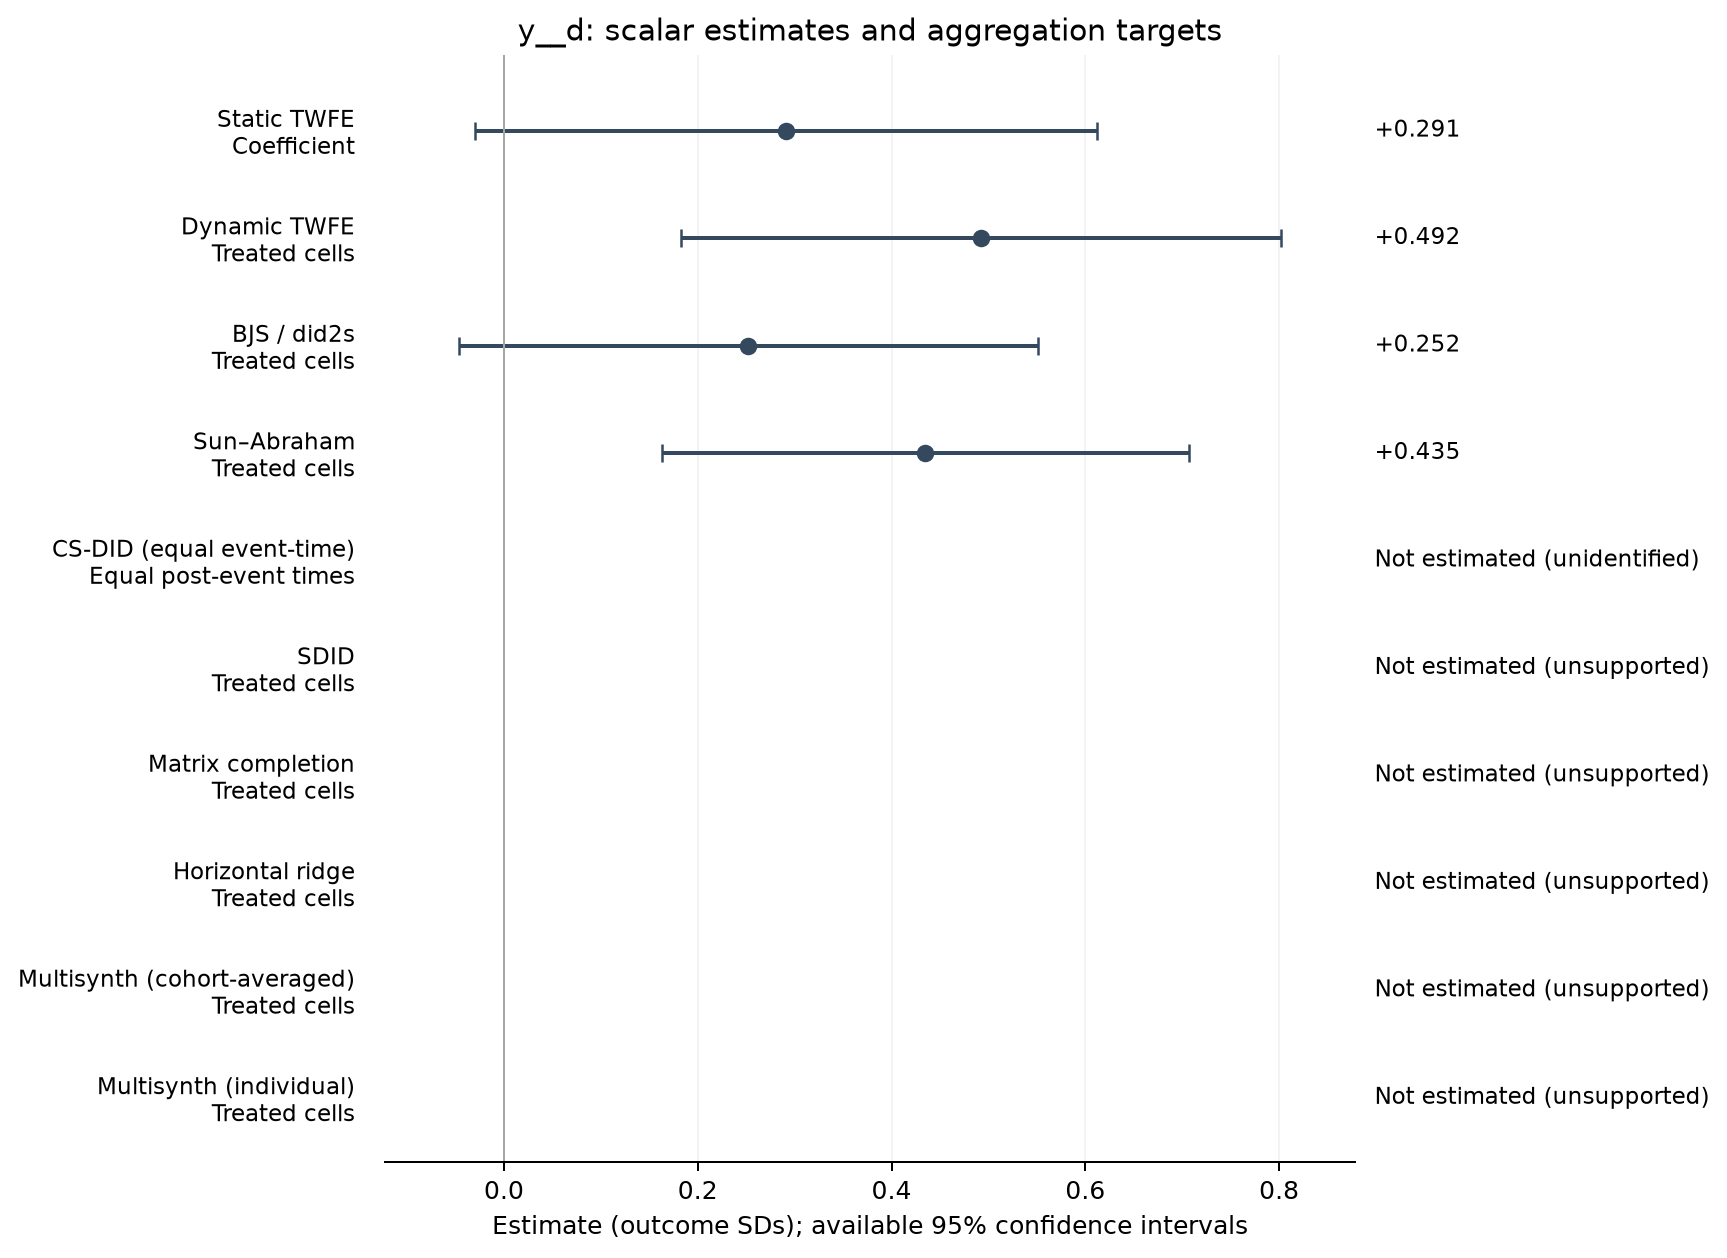
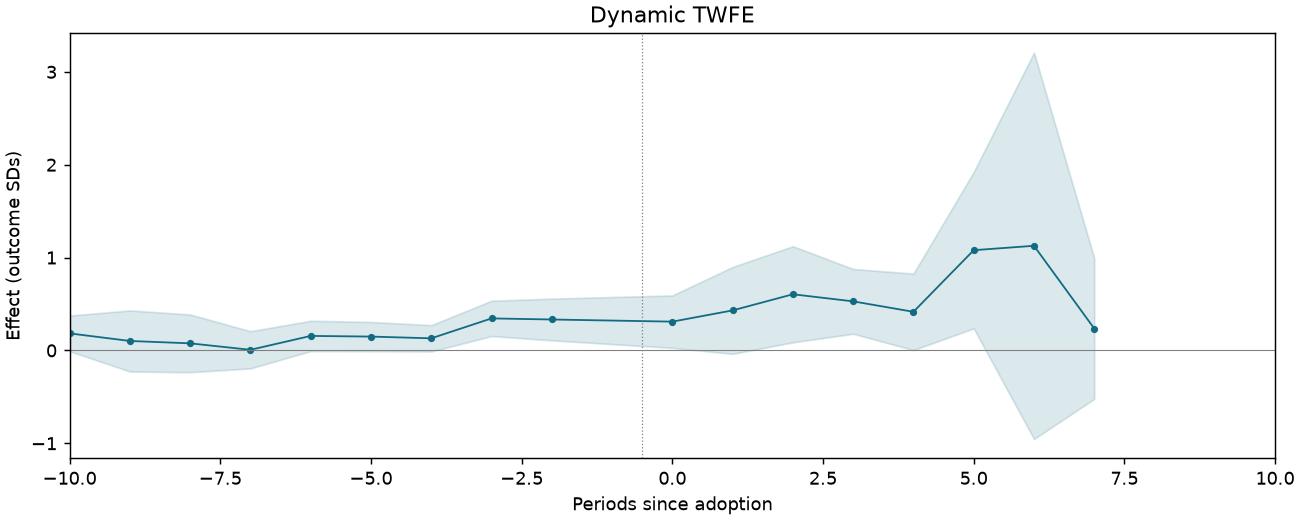
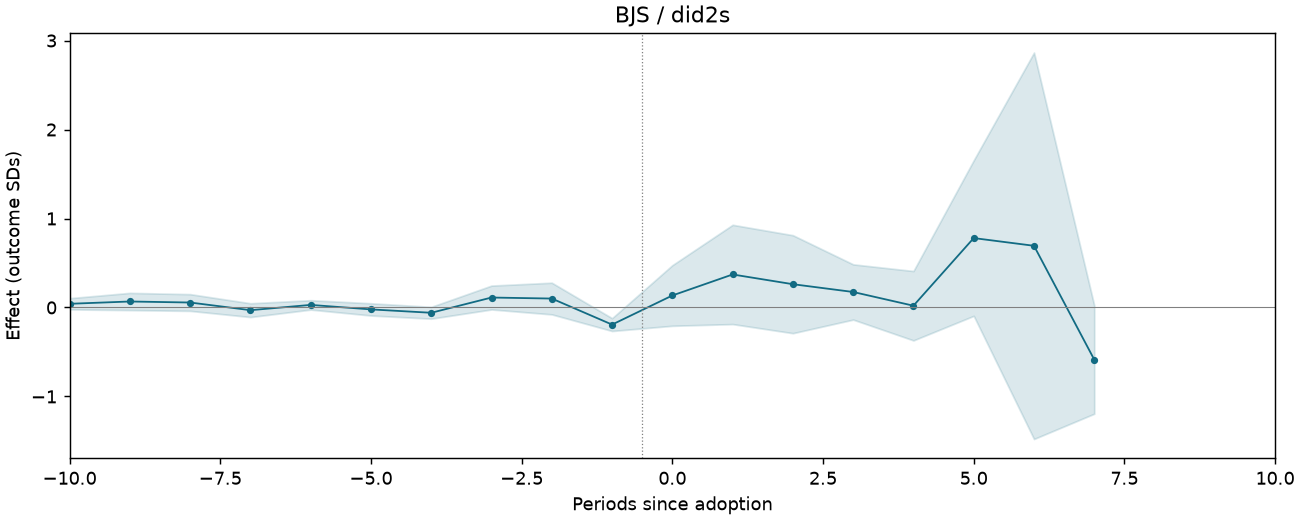
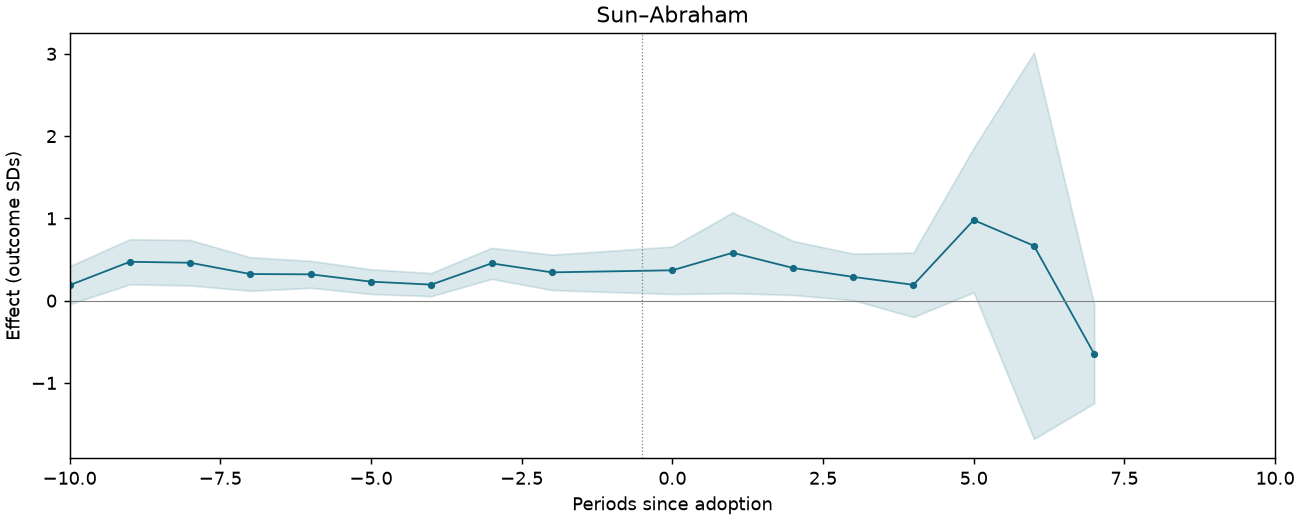
Illegal-refinery raid events within 15 km
The archive supplies frozen estimates but not this specification’s input sample or required outcome/controls.
REXER-T4-C6
2,895 observations · 271 units · 271 clusters · 56 treated / 215 control units.
Estimate comparison
| Estimator | Estimate (SDs) | SE | 95% CI | Averaging |
|---|---|---|---|---|
| Static TWFE | 0.291 | 0.163 | [-0.030, 0.612] | Coefficient |
| Dynamic TWFE | 0.492 | 0.157 | [0.182, 0.802] | Treated cells |
| BJS / did2s | 0.252 | 0.152 | [-0.046, 0.551] | Treated cells |
| Sun–Abraham | 0.435 | 0.138 | [0.163, 0.707] | Treated cells |
Event studies
Periods −10 to +10; pointwise 95% intervals where available.
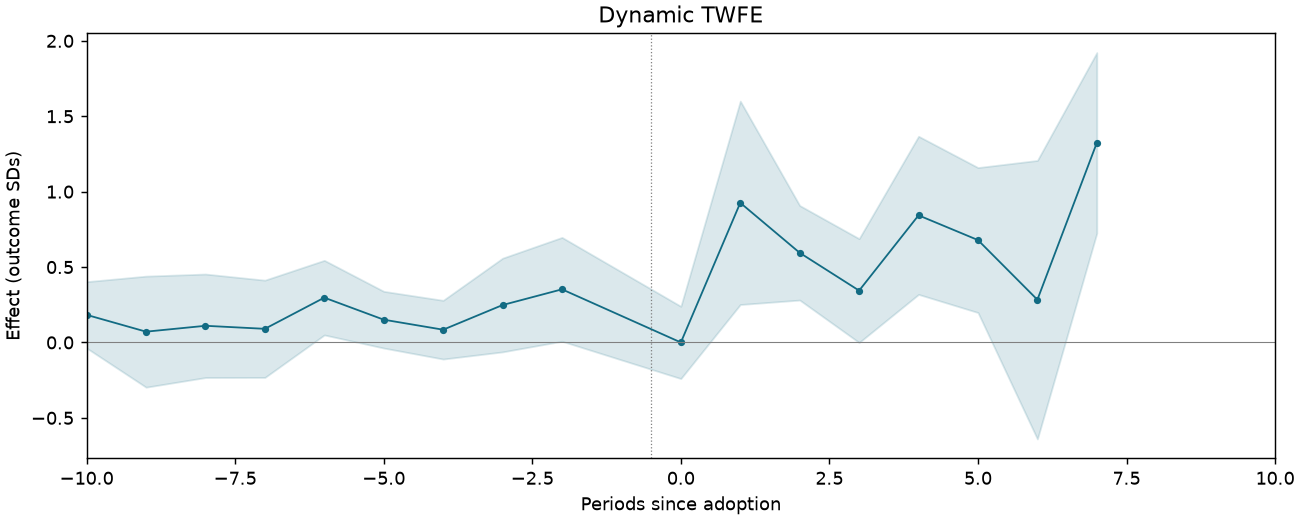
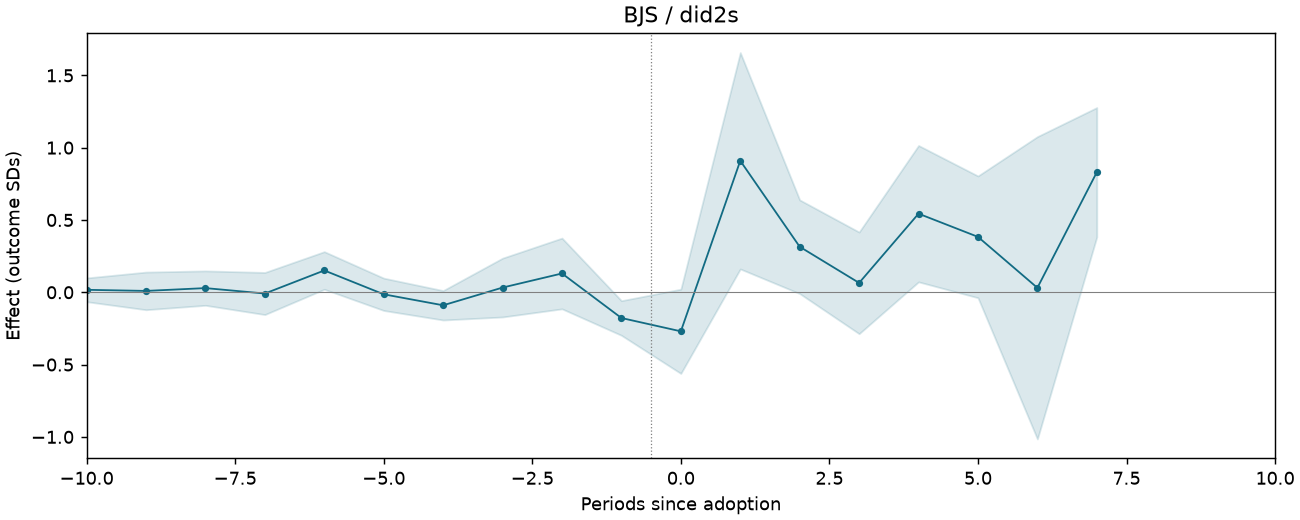
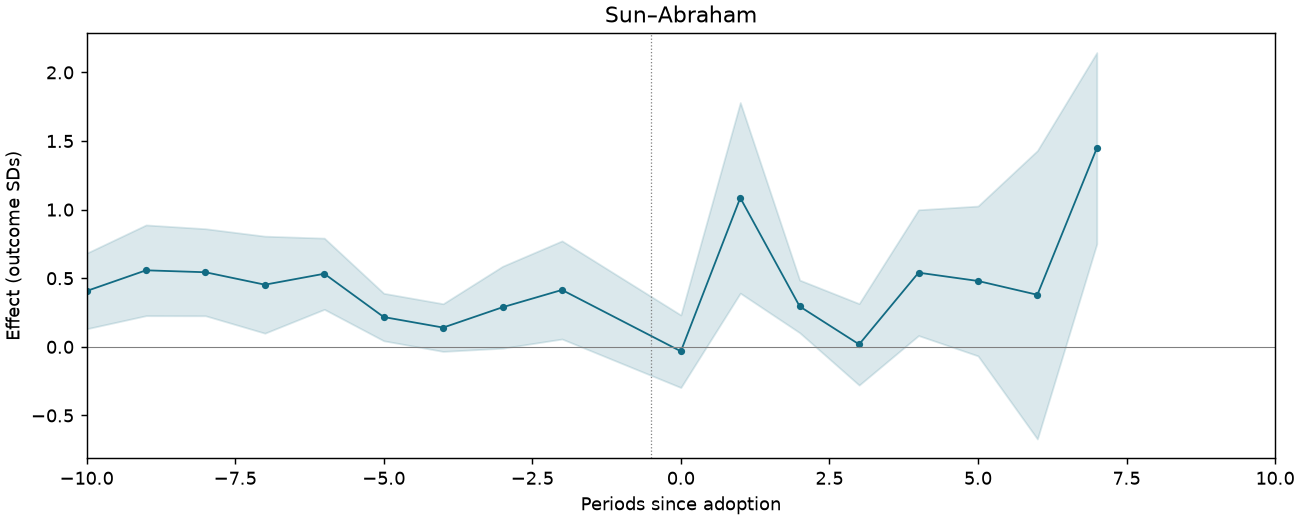
Illegal-export enforcement events within 15 km
The archive supplies frozen estimates but not this specification’s input sample or required outcome/controls.
REXER-T4-C8
2,895 observations · 271 units · 271 clusters · 56 treated / 215 control units.
Estimate comparison
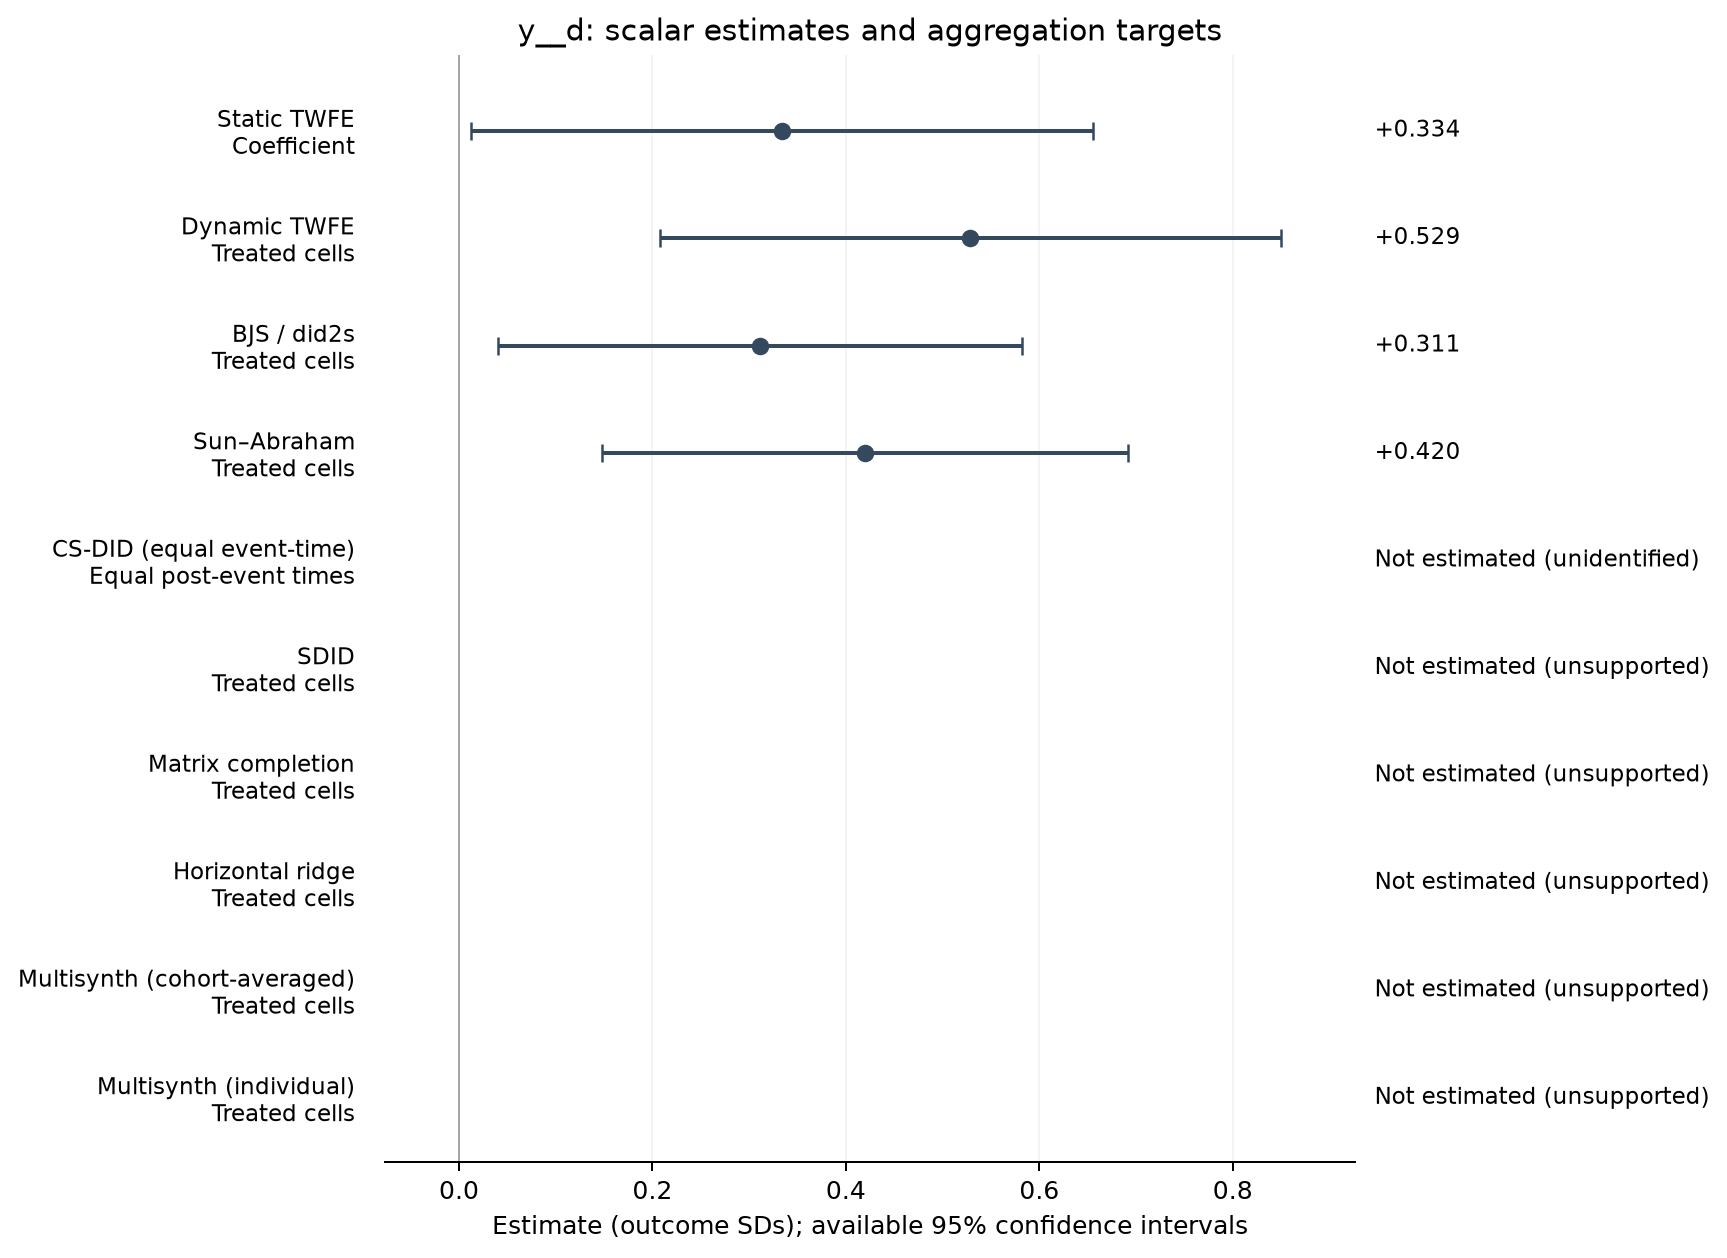
| Estimator | Estimate (SDs) | SE | 95% CI | Averaging |
|---|---|---|---|---|
| Static TWFE | 0.334 | 0.163 | [0.012, 0.655] | Coefficient |
| Dynamic TWFE | 0.529 | 0.163 | [0.207, 0.850] | Treated cells |
| BJS / did2s | 0.311 | 0.138 | [0.041, 0.582] | Treated cells |
| Sun–Abraham | 0.420 | 0.138 | [0.148, 0.692] | Treated cells |
Event studies
Periods −10 to +10; pointwise 95% intervals where available.
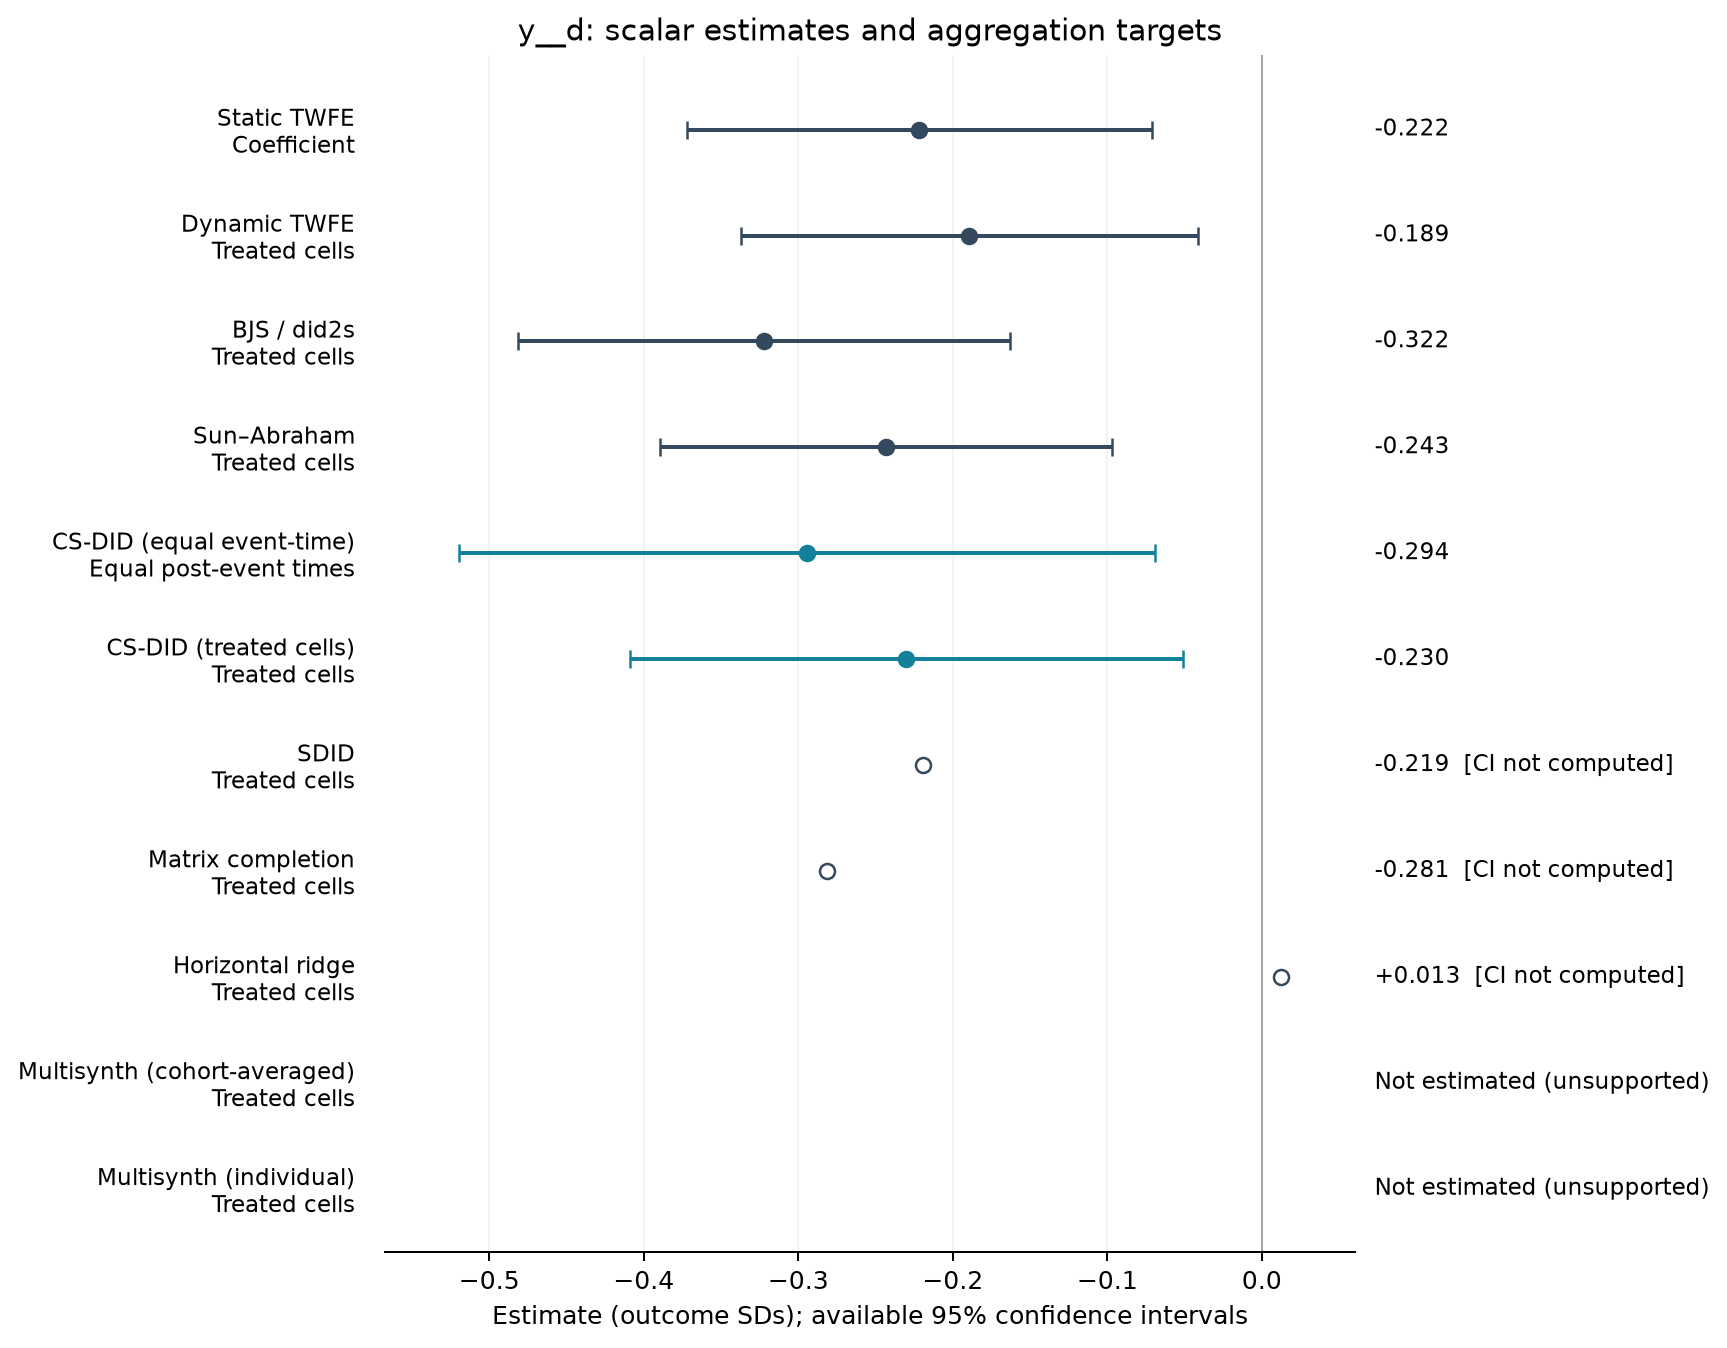
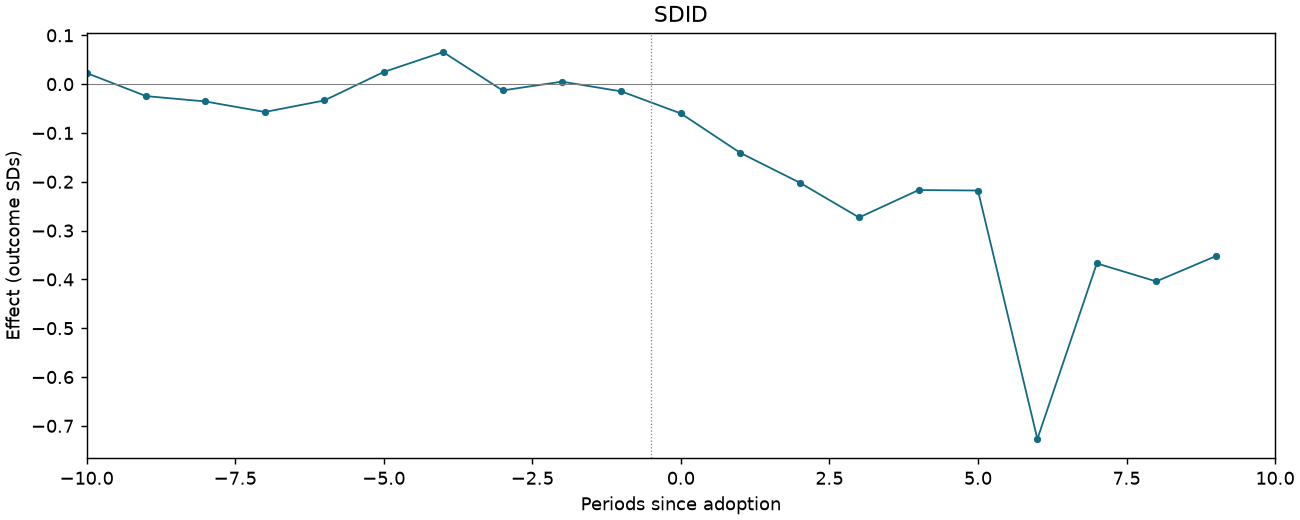
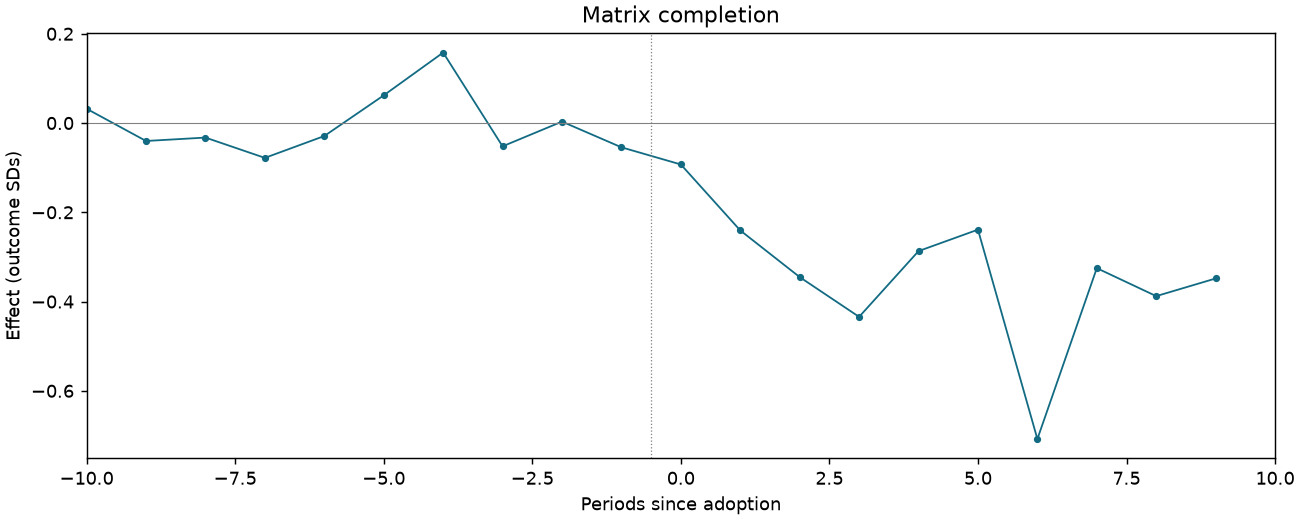
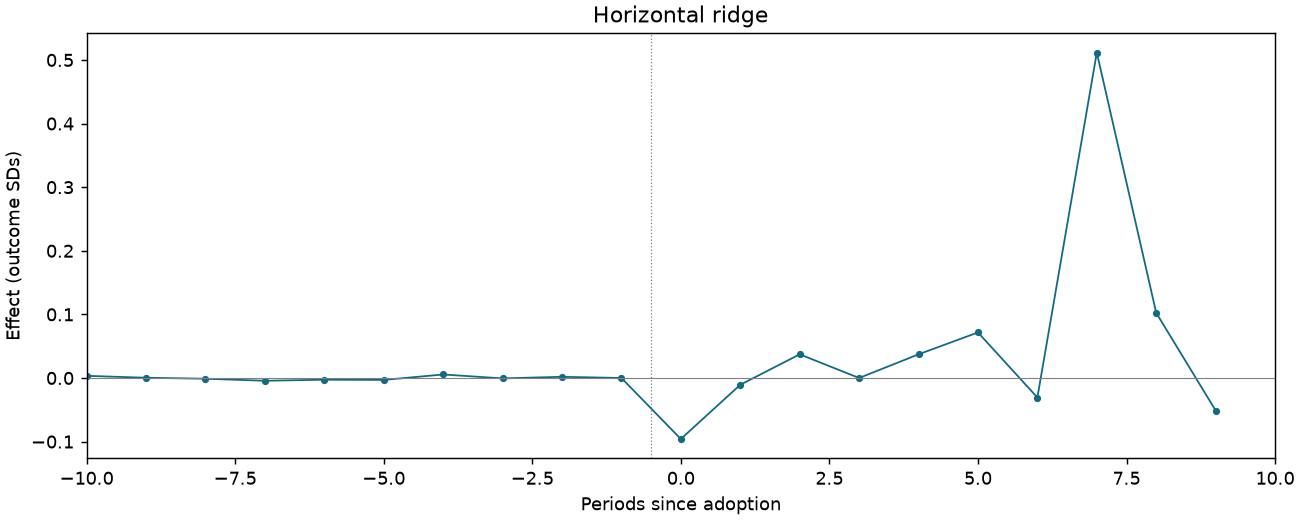
REXER-T6-PA-SECURITY-C3-HOLD
3,088 observations · 294 units · 294 clusters · 24 treated / 270 control units.
Estimate comparison
| Estimator | Estimate (SDs) | SE | 95% CI | Averaging |
|---|---|---|---|---|
| Static TWFE | -0.222 | 0.077 | [-0.372, -0.071] | Coefficient |
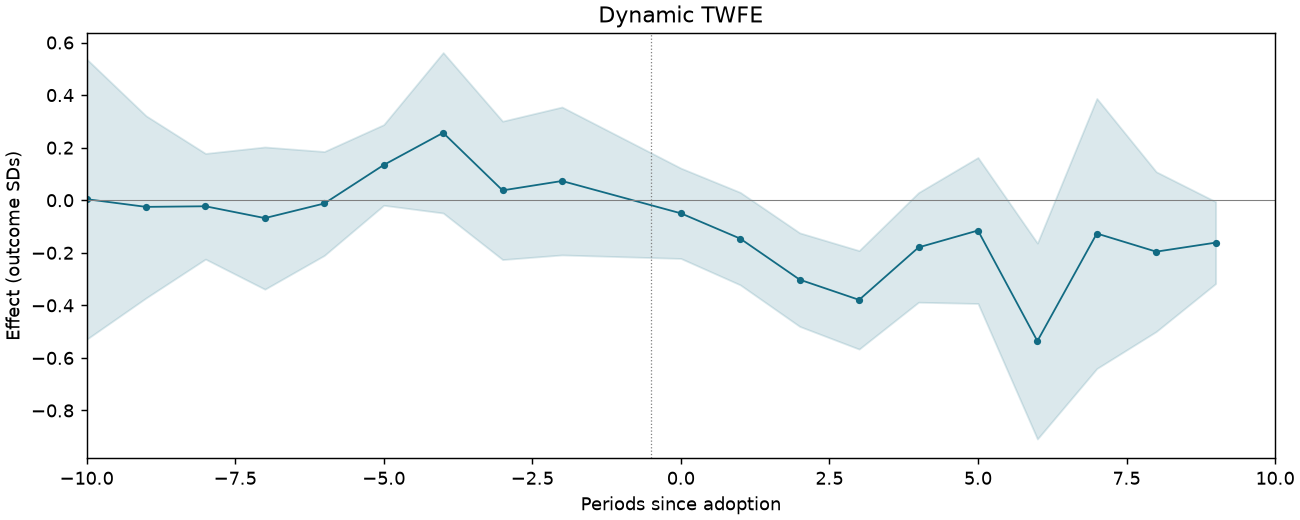
| Dynamic TWFE | -0.189 | 0.075 | [-0.337, -0.042] | Treated cells |
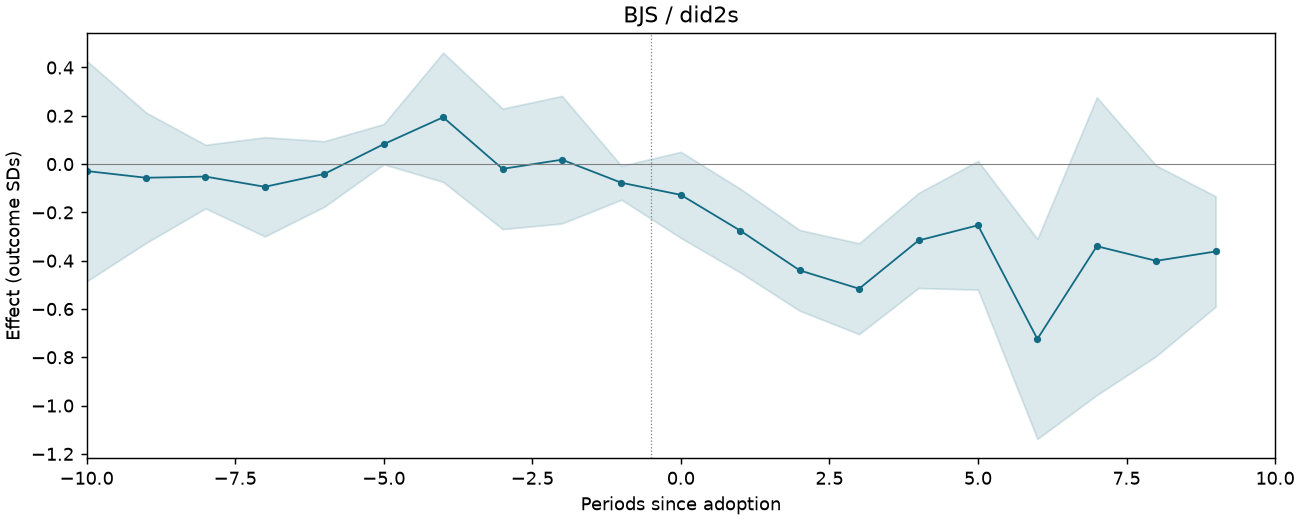
| BJS / did2s | -0.322 | 0.081 | [-0.481, -0.163] | Treated cells |
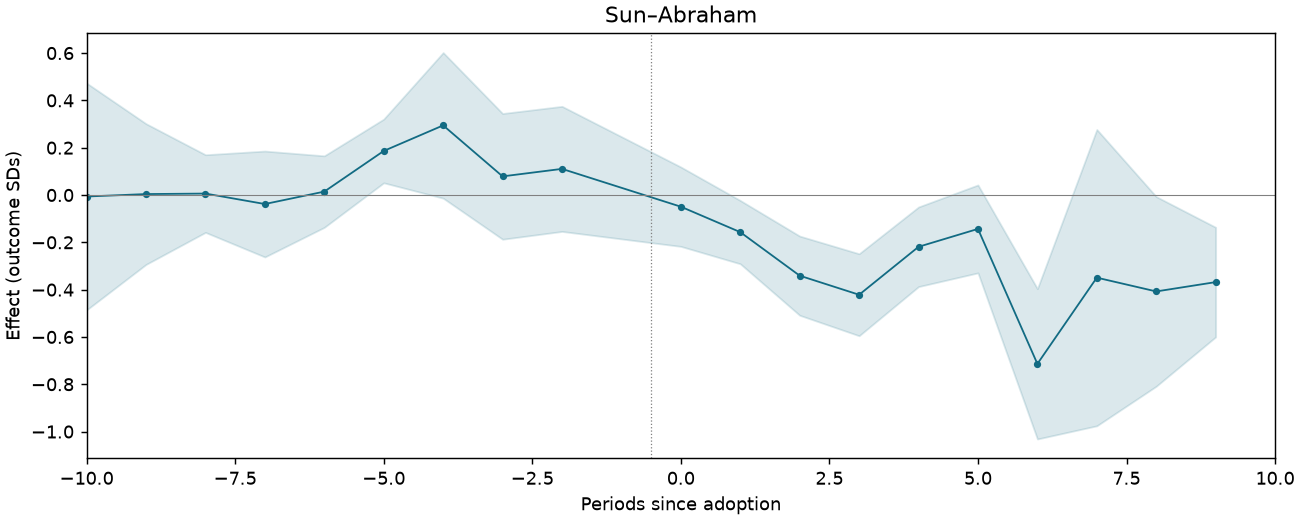
| Sun–Abraham | -0.243 | 0.074 | [-0.389, -0.097] | Treated cells |
| CS-DID (equal event-time) | -0.294 | 0.115 | [-0.520, -0.069] | Equal post-event times |
| CS-DID (treated cells) | -0.230 | 0.091 | [-0.409, -0.051] | Treated cells |
| SDID | -0.219 | — | — | Treated cells |
| Matrix completion | -0.281 | — | — | Treated cells |
| Horizontal ridge | 0.013 | — | — | Treated cells |
Event studies
Periods −10 to +10; pointwise 95% intervals where available.
REXER-T6-PA-SECURITY-C4-HOLD
3,088 observations · 294 units · 294 clusters · 24 treated / 270 control units.
Estimate comparison
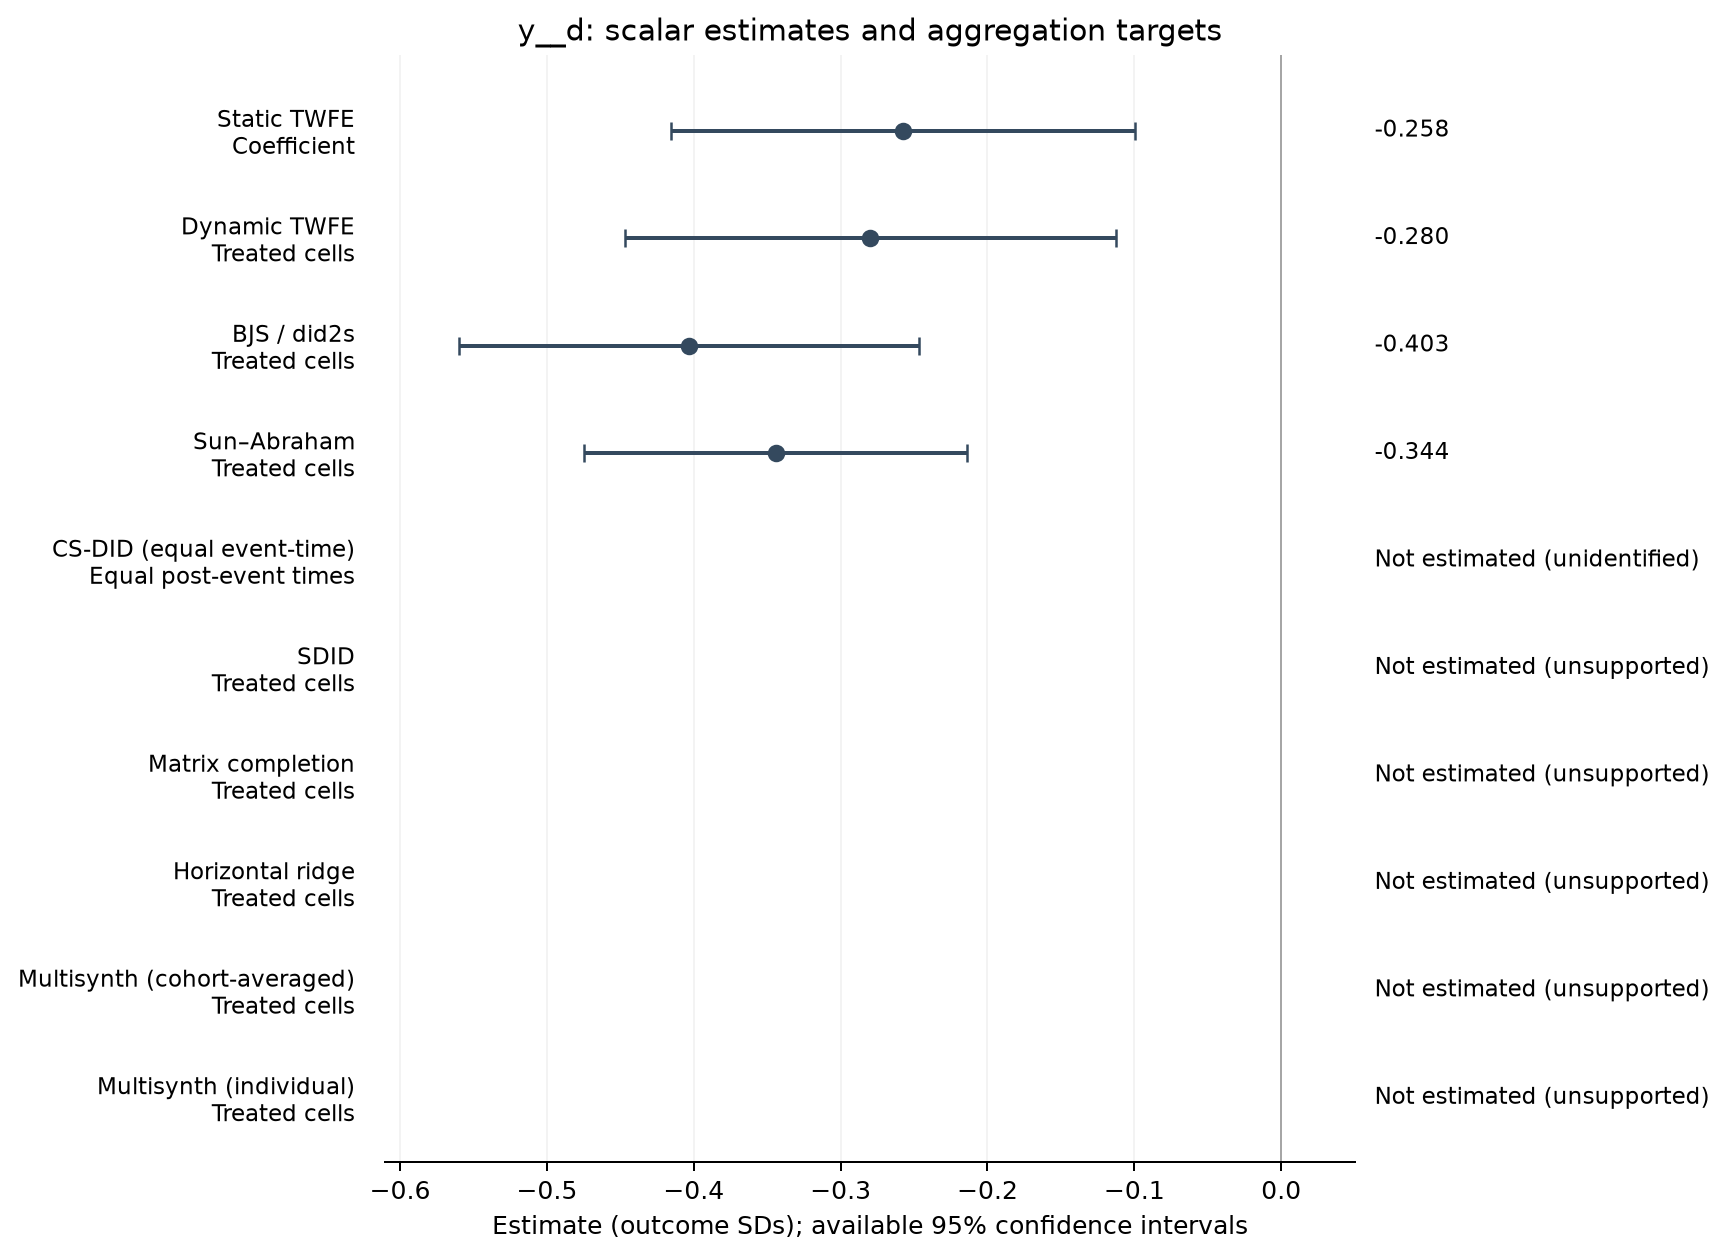
| Estimator | Estimate (SDs) | SE | 95% CI | Averaging |
|---|---|---|---|---|
| Static TWFE | -0.258 | 0.080 | [-0.416, -0.100] | Coefficient |
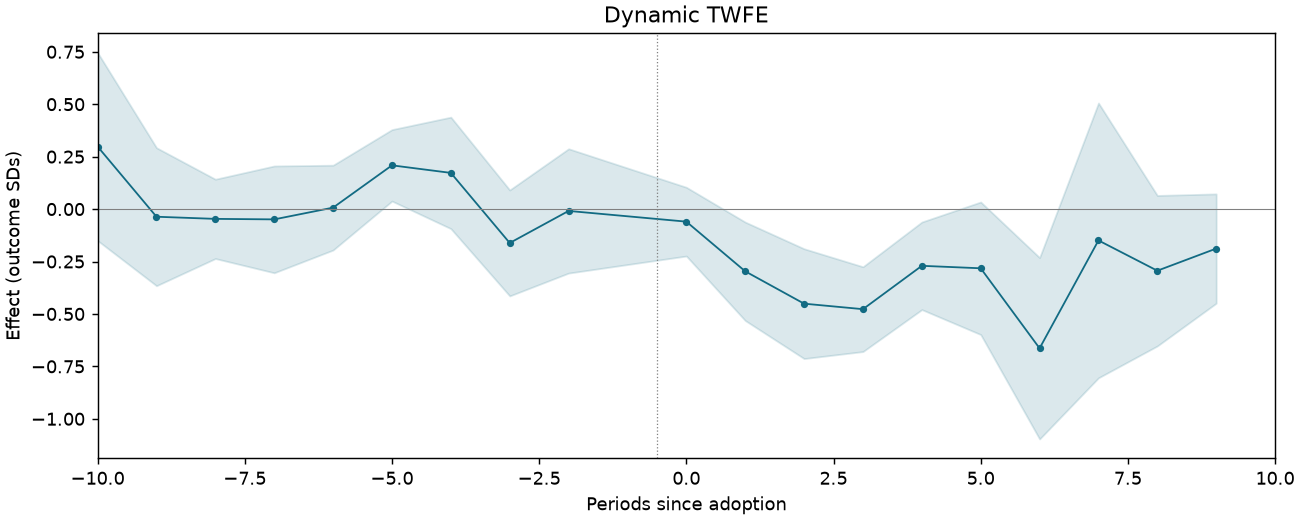
| Dynamic TWFE | -0.280 | 0.085 | [-0.447, -0.112] | Treated cells |
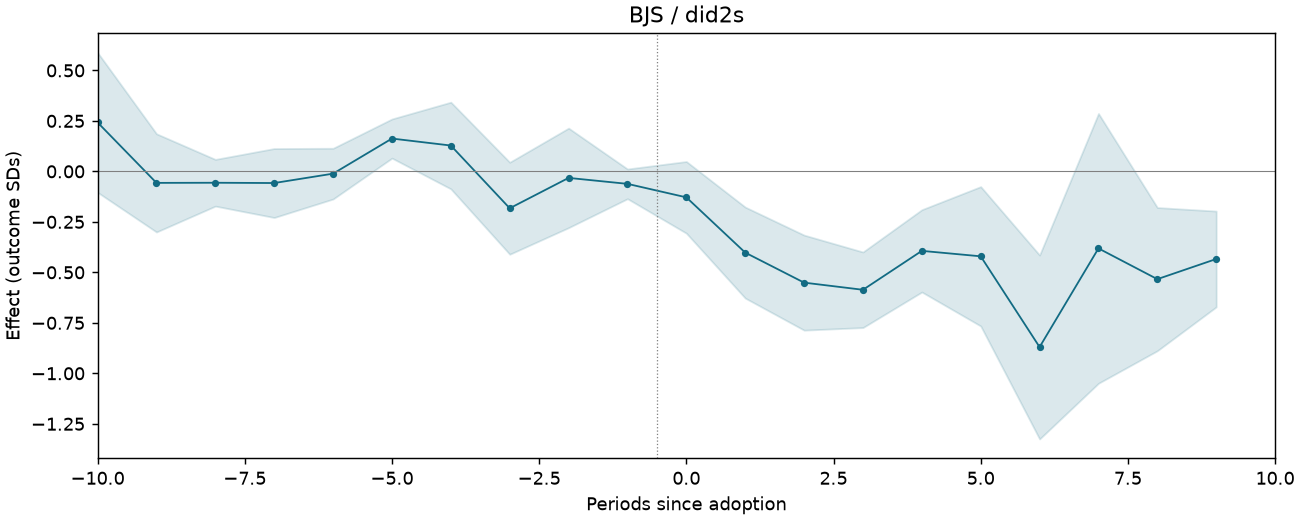
| BJS / did2s | -0.403 | 0.080 | [-0.560, -0.247] | Treated cells |
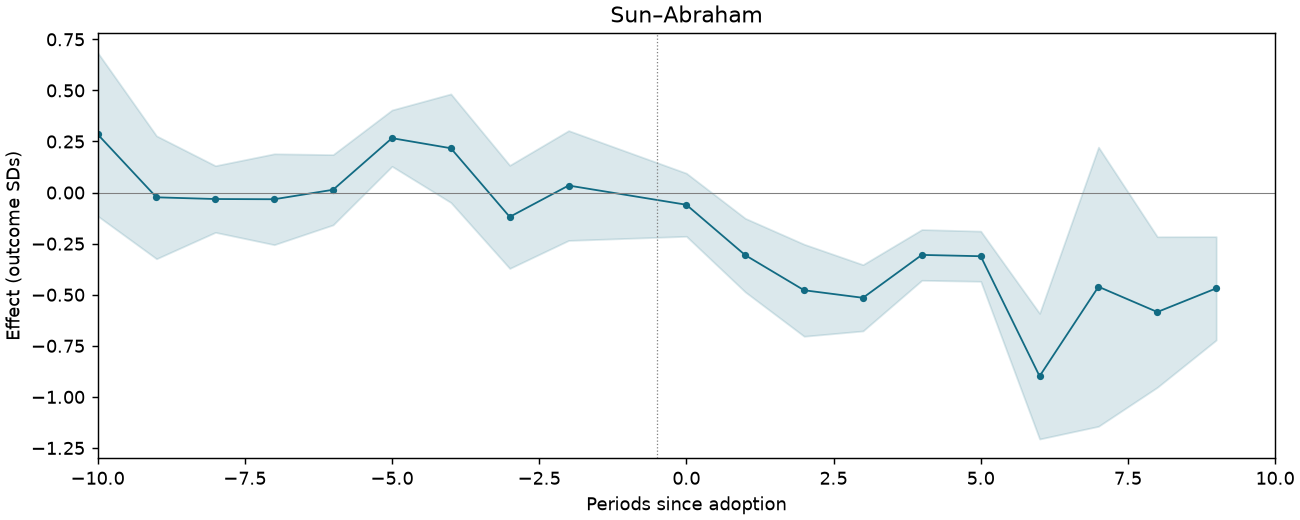
| Sun–Abraham | -0.344 | 0.066 | [-0.475, -0.214] | Treated cells |
Event studies
Periods −10 to +10; pointwise 95% intervals where available.
REXER-T6-PA-SECURITY-C5-HOLD
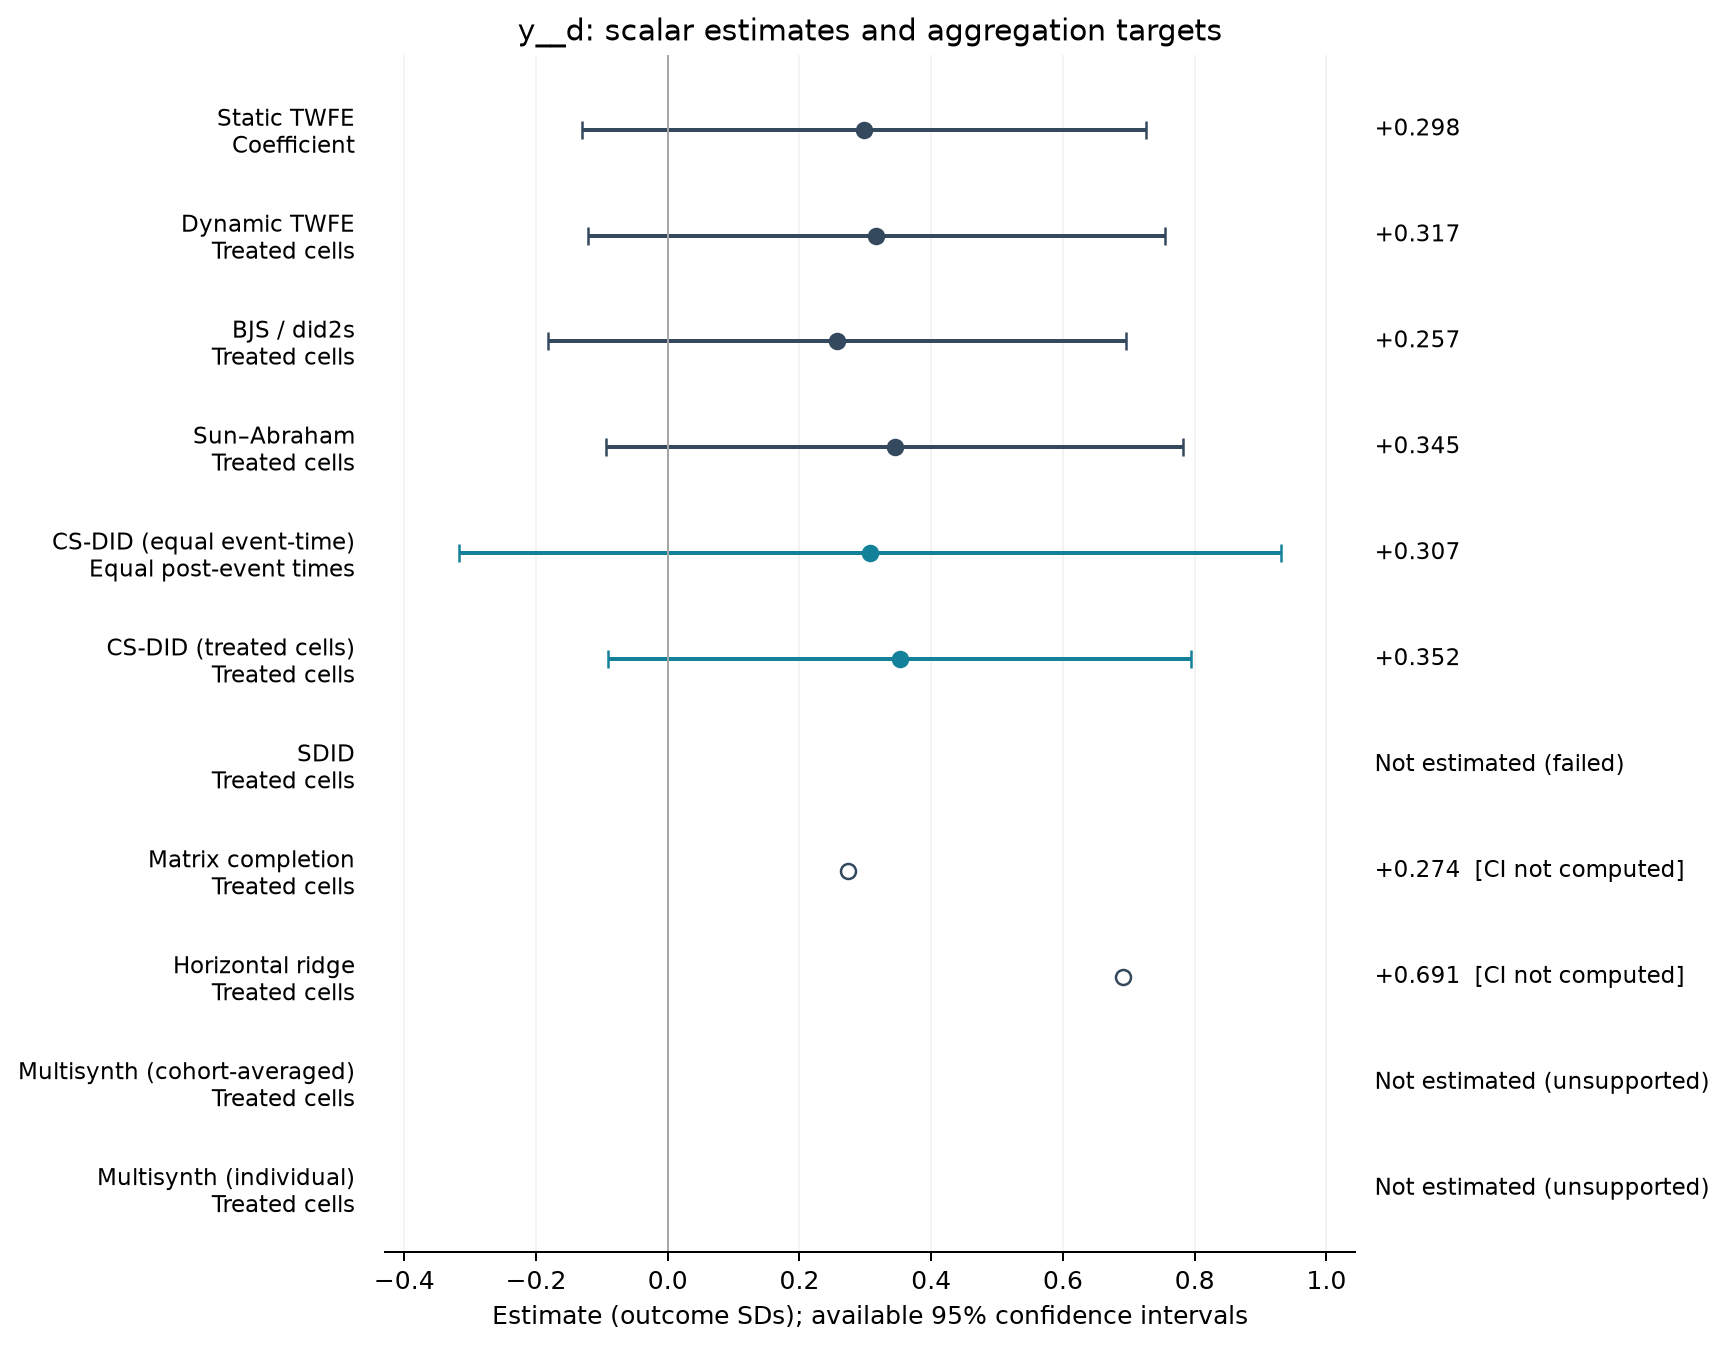
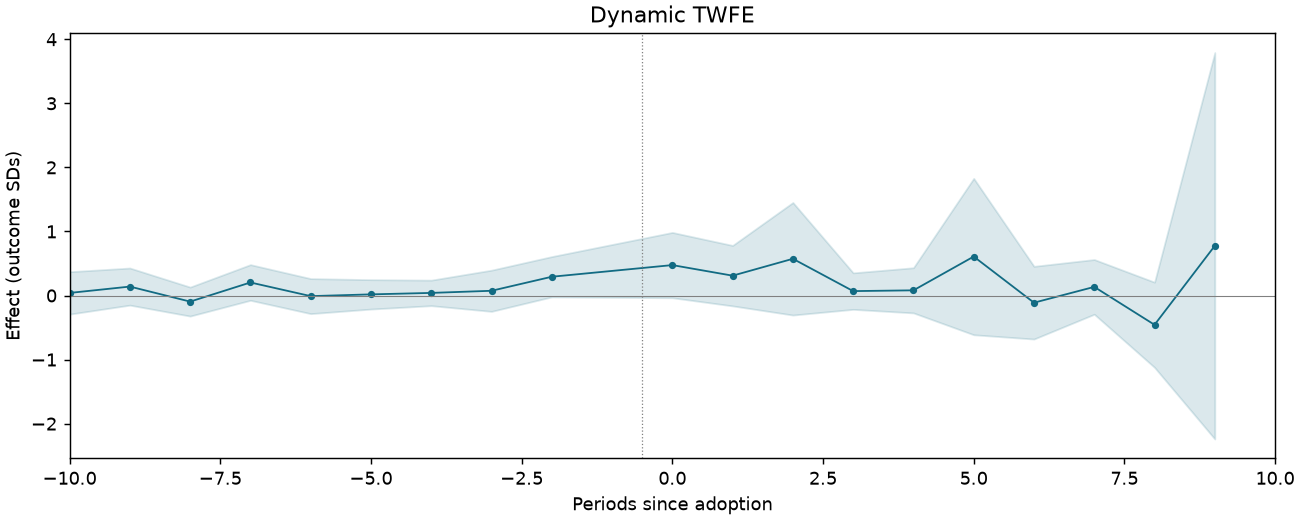
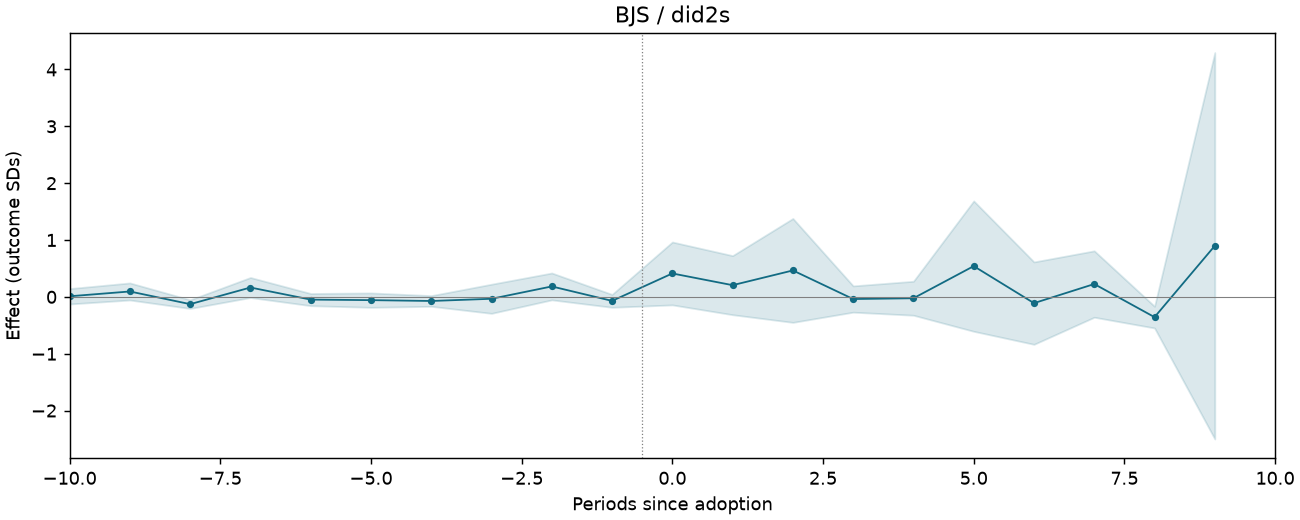
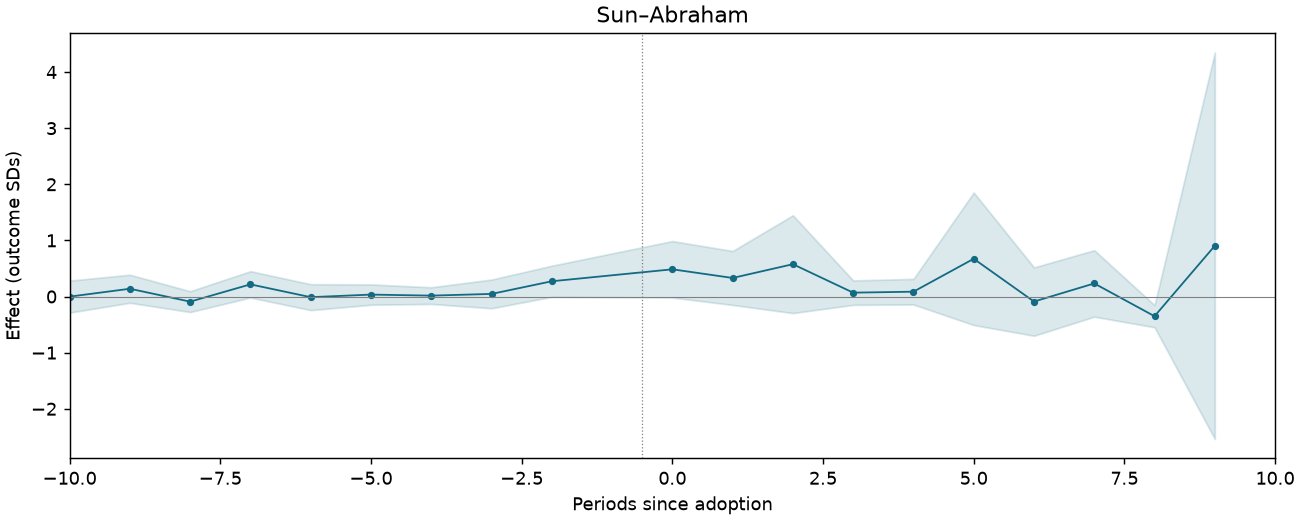
3,088 observations · 294 units · 294 clusters · 24 treated / 270 control units.
Estimate comparison
| Estimator | Estimate (SDs) | SE | 95% CI | Averaging |
|---|---|---|---|---|
| Static TWFE | 0.298 | 0.217 | [-0.130, 0.725] | Coefficient |
| Dynamic TWFE | 0.317 | 0.223 | [-0.121, 0.755] | Treated cells |
| BJS / did2s | 0.257 | 0.223 | [-0.182, 0.696] | Treated cells |
| Sun–Abraham | 0.345 | 0.222 | [-0.093, 0.782] | Treated cells |
| CS-DID (equal event-time) | 0.307 | 0.318 | [-0.317, 0.931] | Equal post-event times |
| CS-DID (treated cells) | 0.352 | 0.226 | [-0.090, 0.795] | Treated cells |
| Matrix completion | 0.274 | — | — | Treated cells |
| Horizontal ridge | 0.691 | — | — | Treated cells |
Event studies
Periods −10 to +10; pointwise 95% intervals where available.
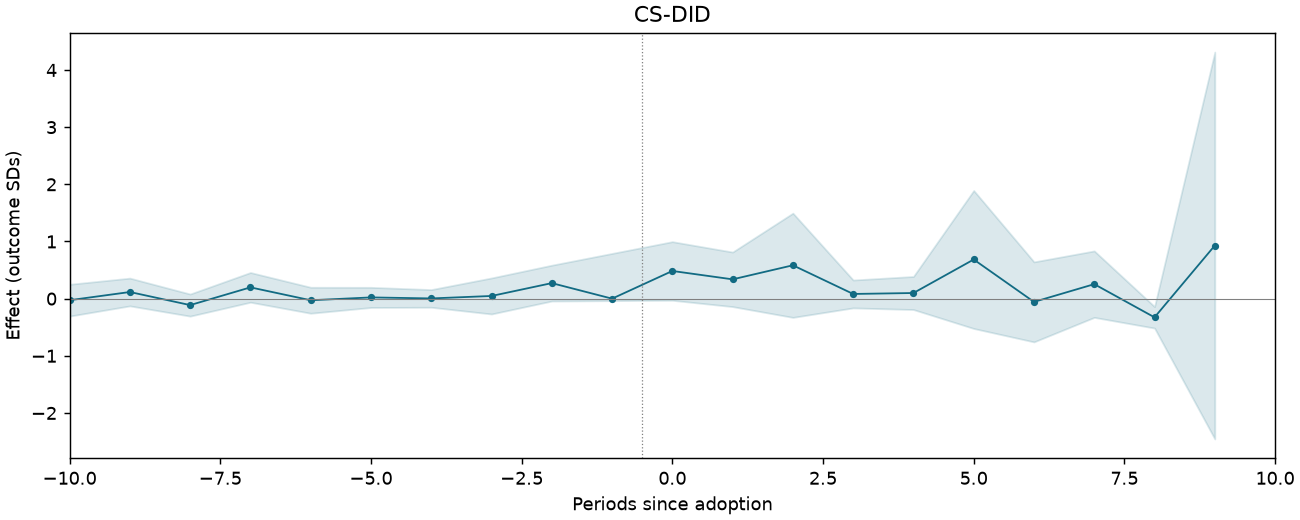
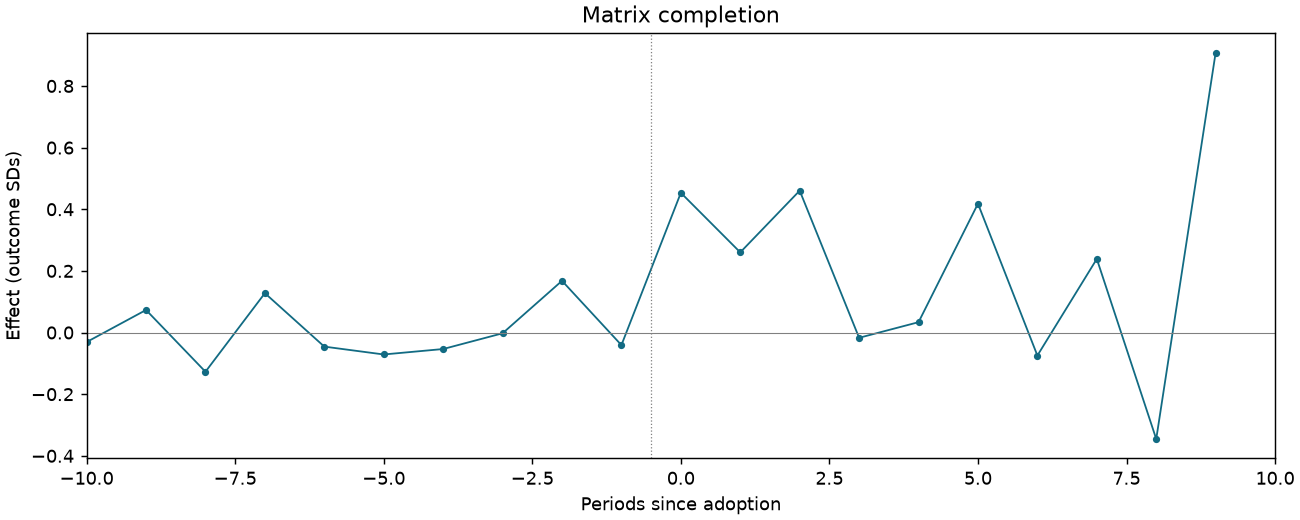
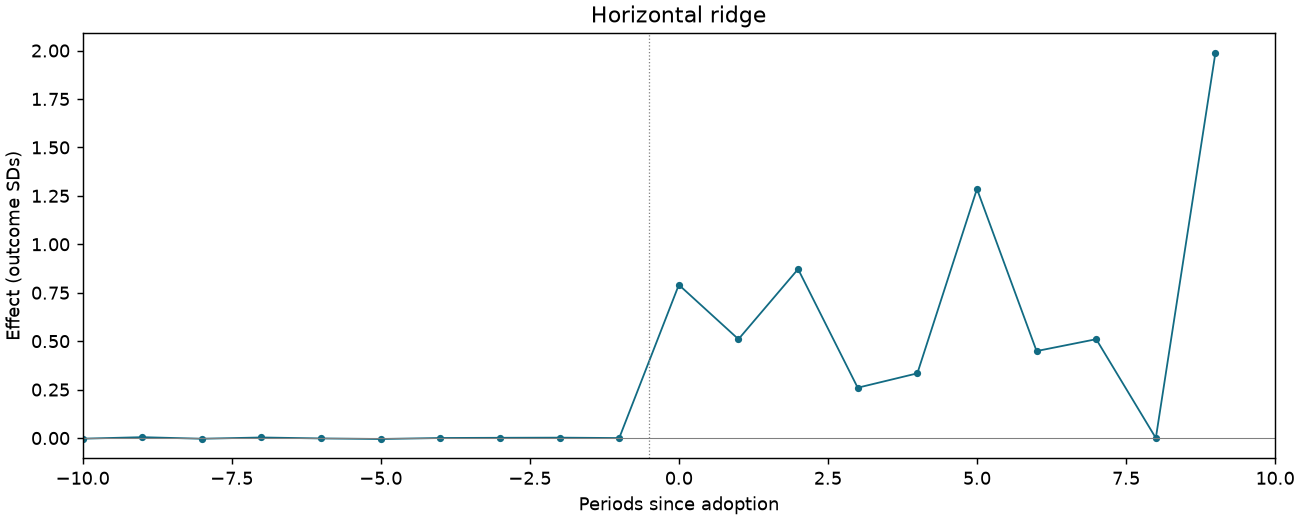
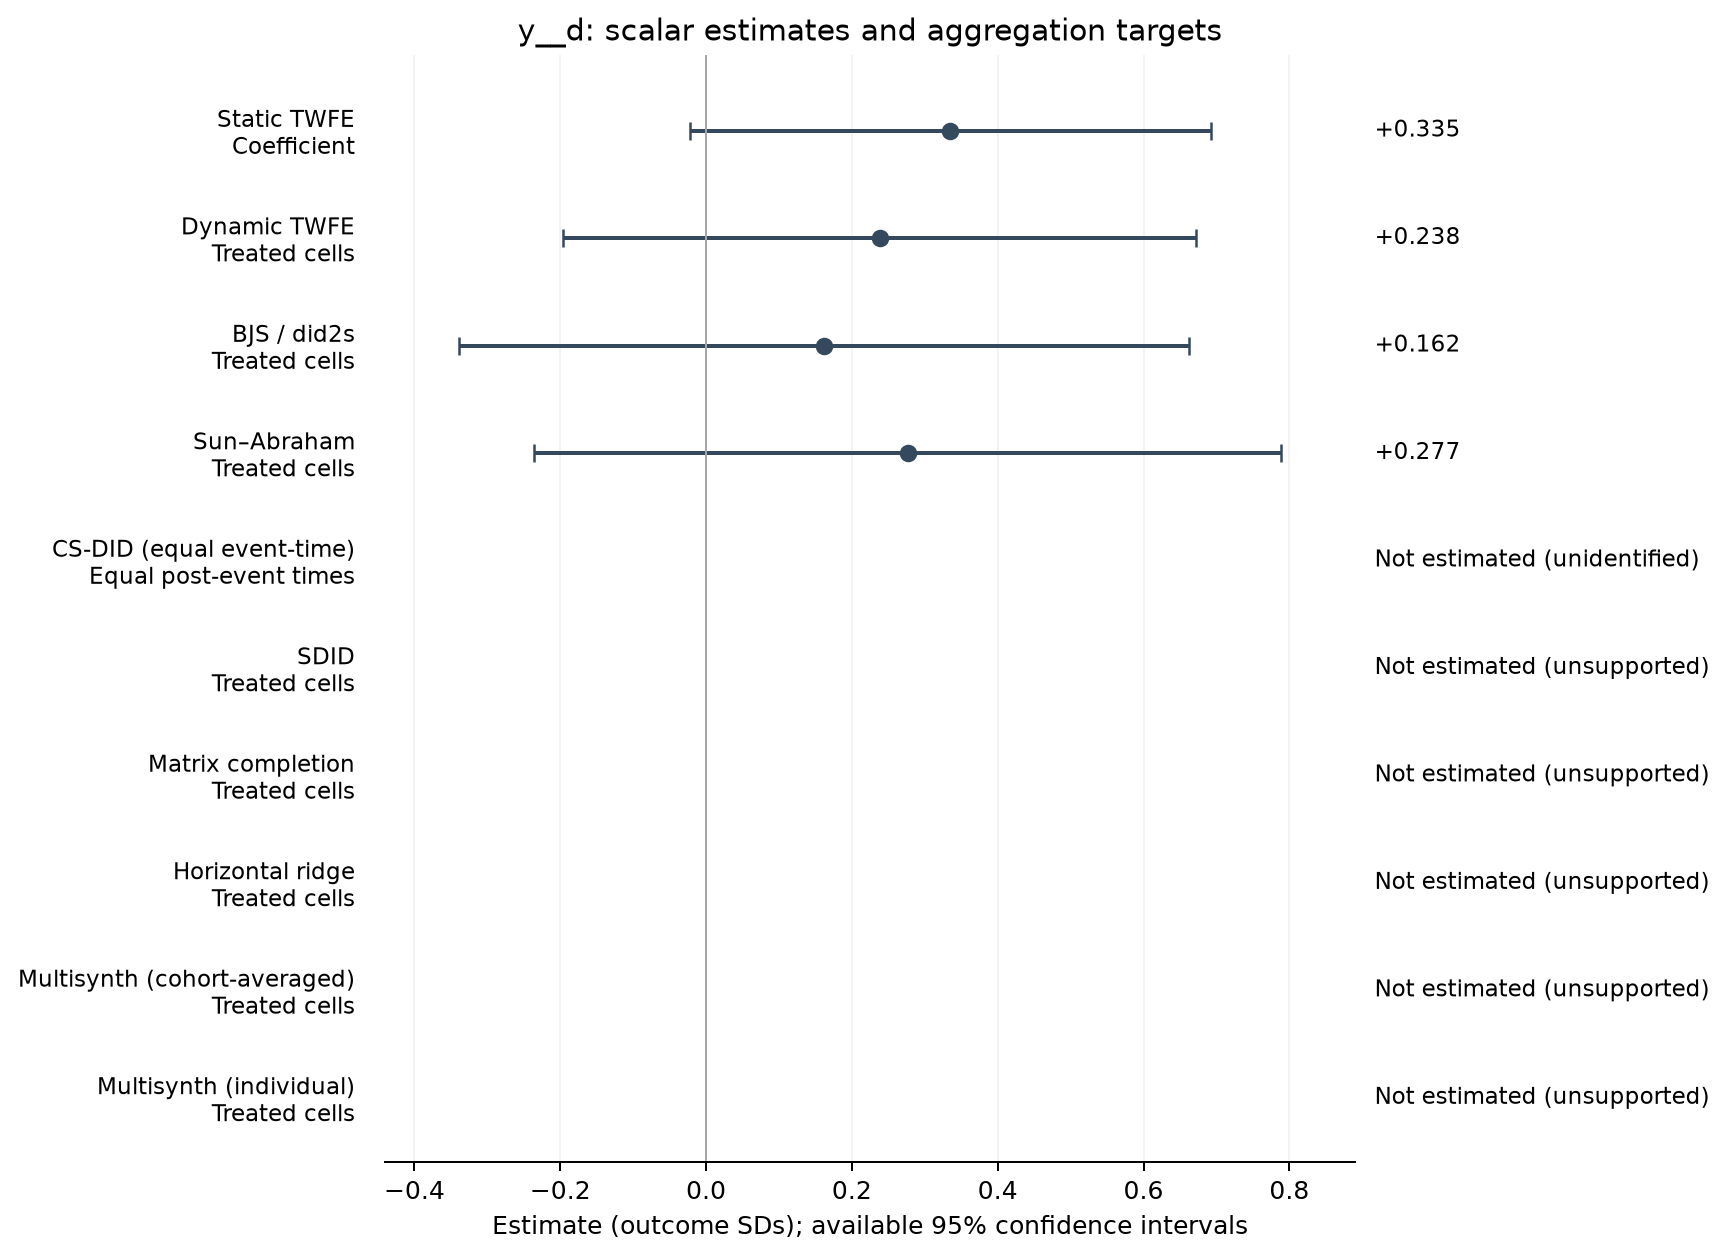
REXER-T6-PA-SECURITY-C6-HOLD
3,088 observations · 294 units · 294 clusters · 24 treated / 270 control units.
Estimate comparison
| Estimator | Estimate (SDs) | SE | 95% CI | Averaging |
|---|---|---|---|---|
| Static TWFE | 0.335 | 0.182 | [-0.023, 0.692] | Coefficient |
| Dynamic TWFE | 0.238 | 0.221 | [-0.196, 0.672] | Treated cells |
| BJS / did2s | 0.162 | 0.254 | [-0.339, 0.663] | Treated cells |
| Sun–Abraham | 0.277 | 0.260 | [-0.235, 0.789] | Treated cells |
Event studies
Periods −10 to +10; pointwise 95% intervals where available.
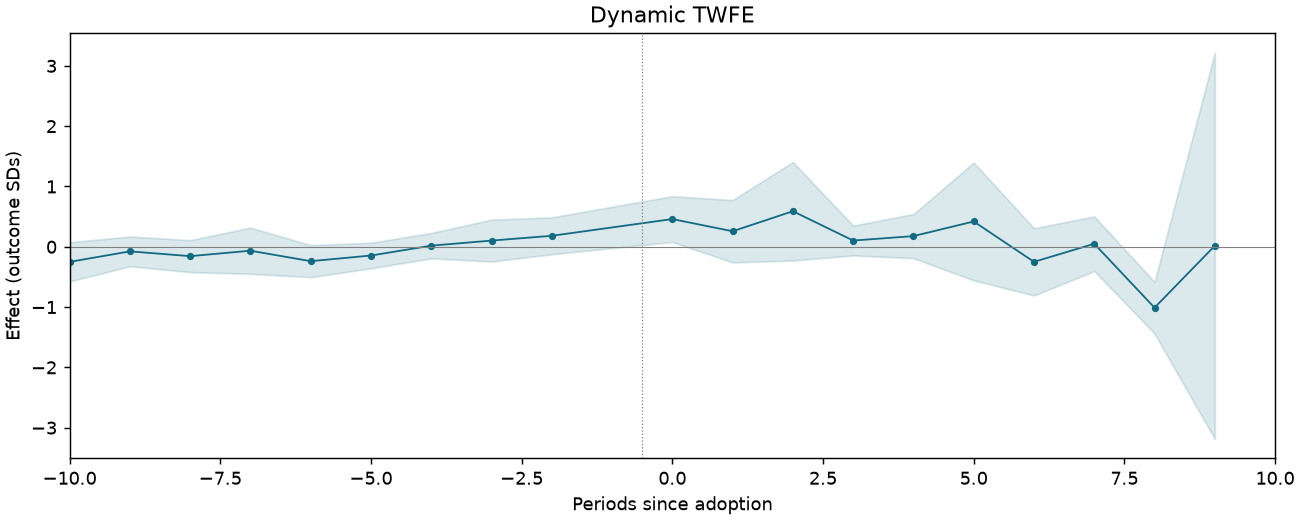
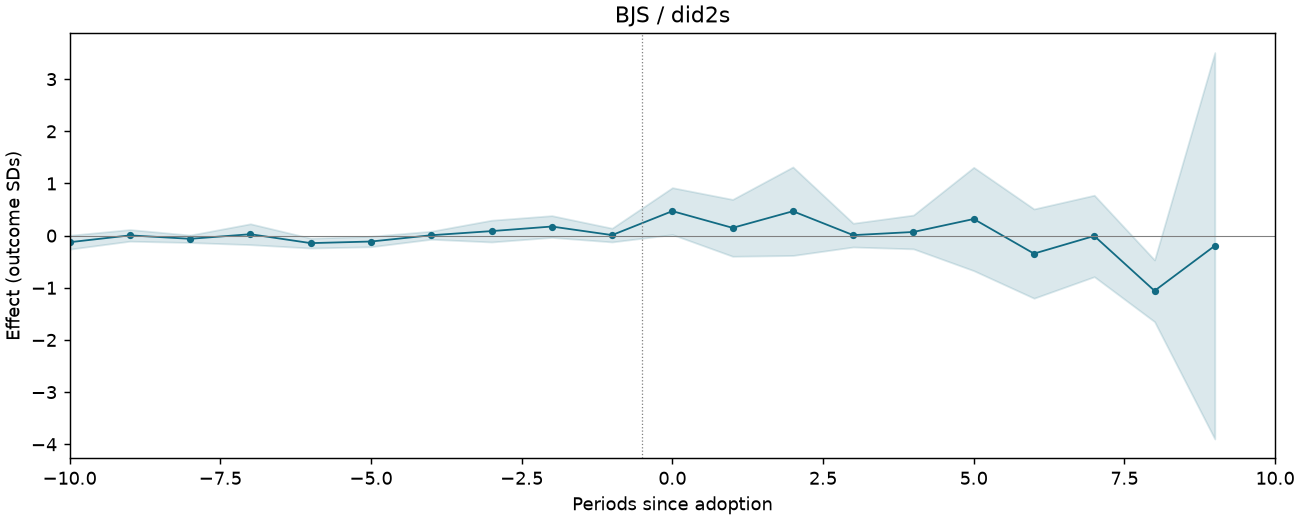
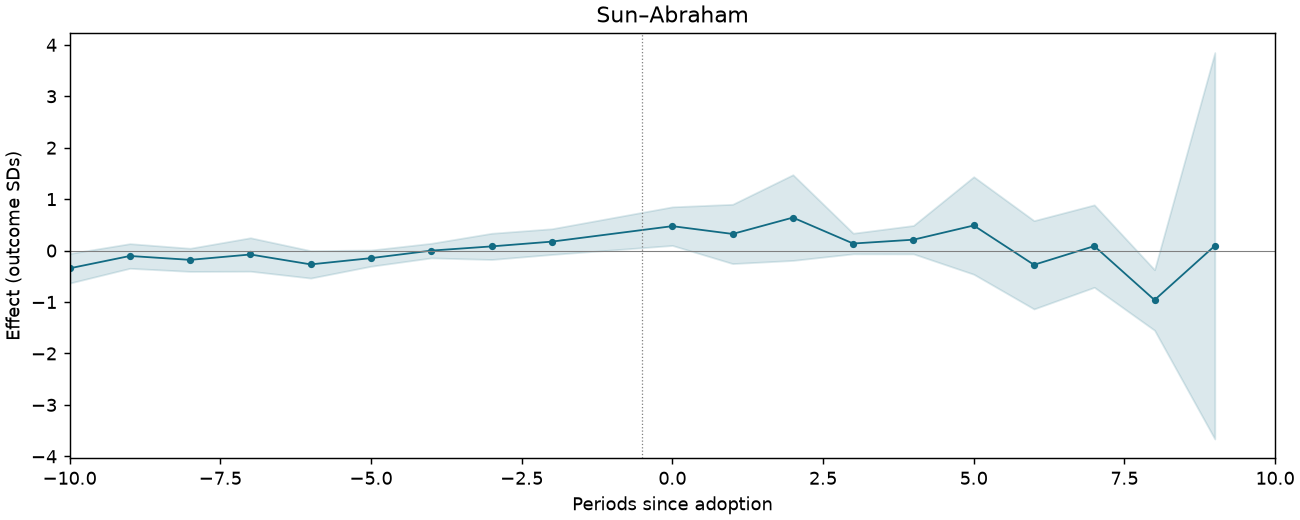
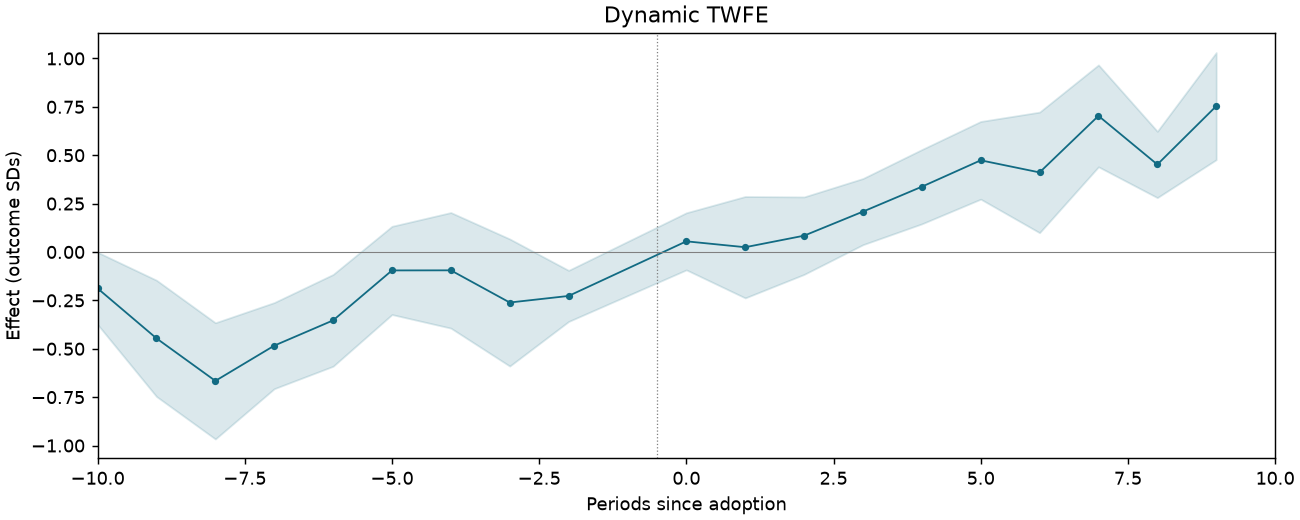
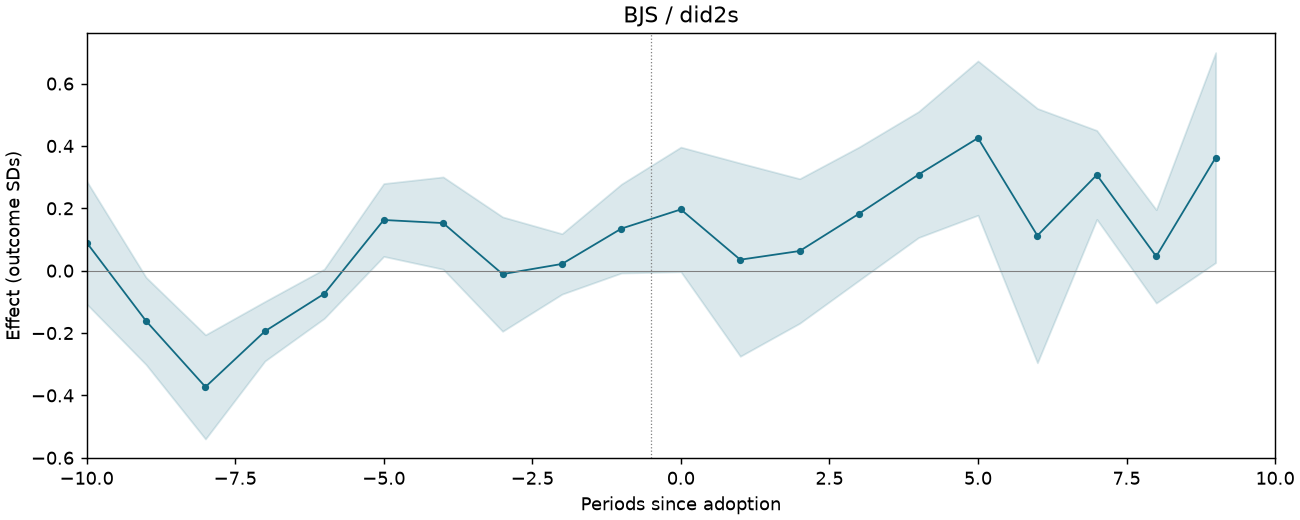
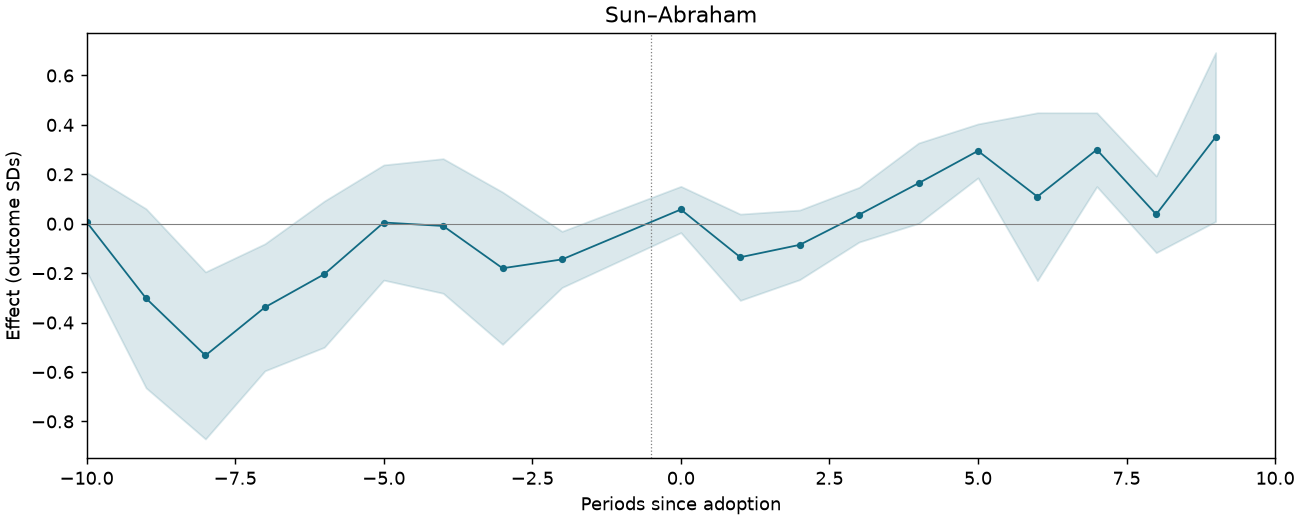
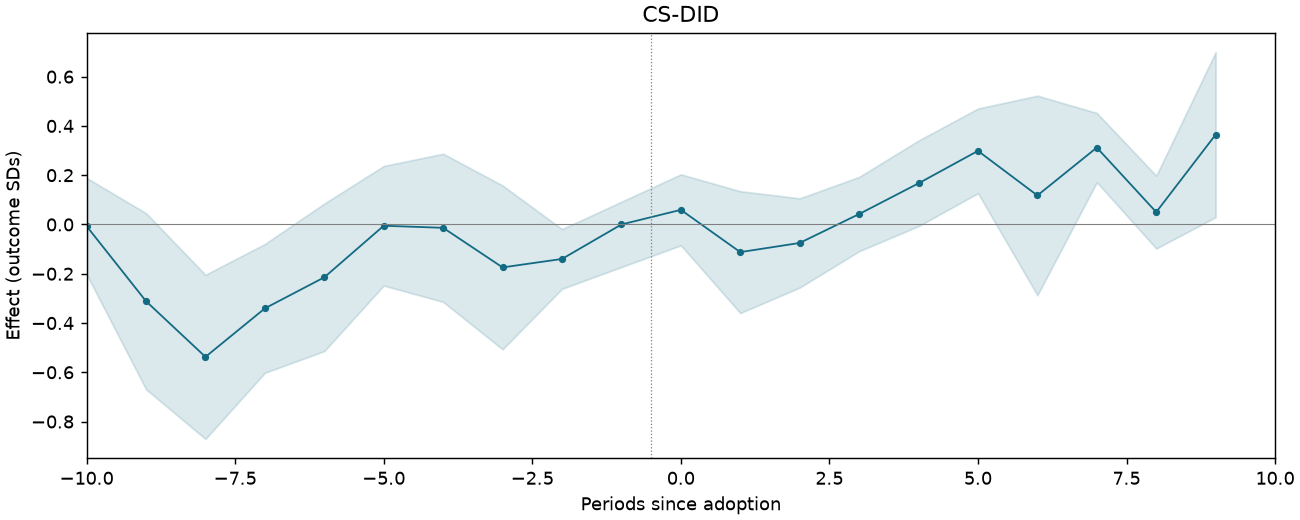
REXER-T6-PA-SECURITY-C7-HOLD
3,088 observations · 294 units · 294 clusters · 24 treated / 270 control units.
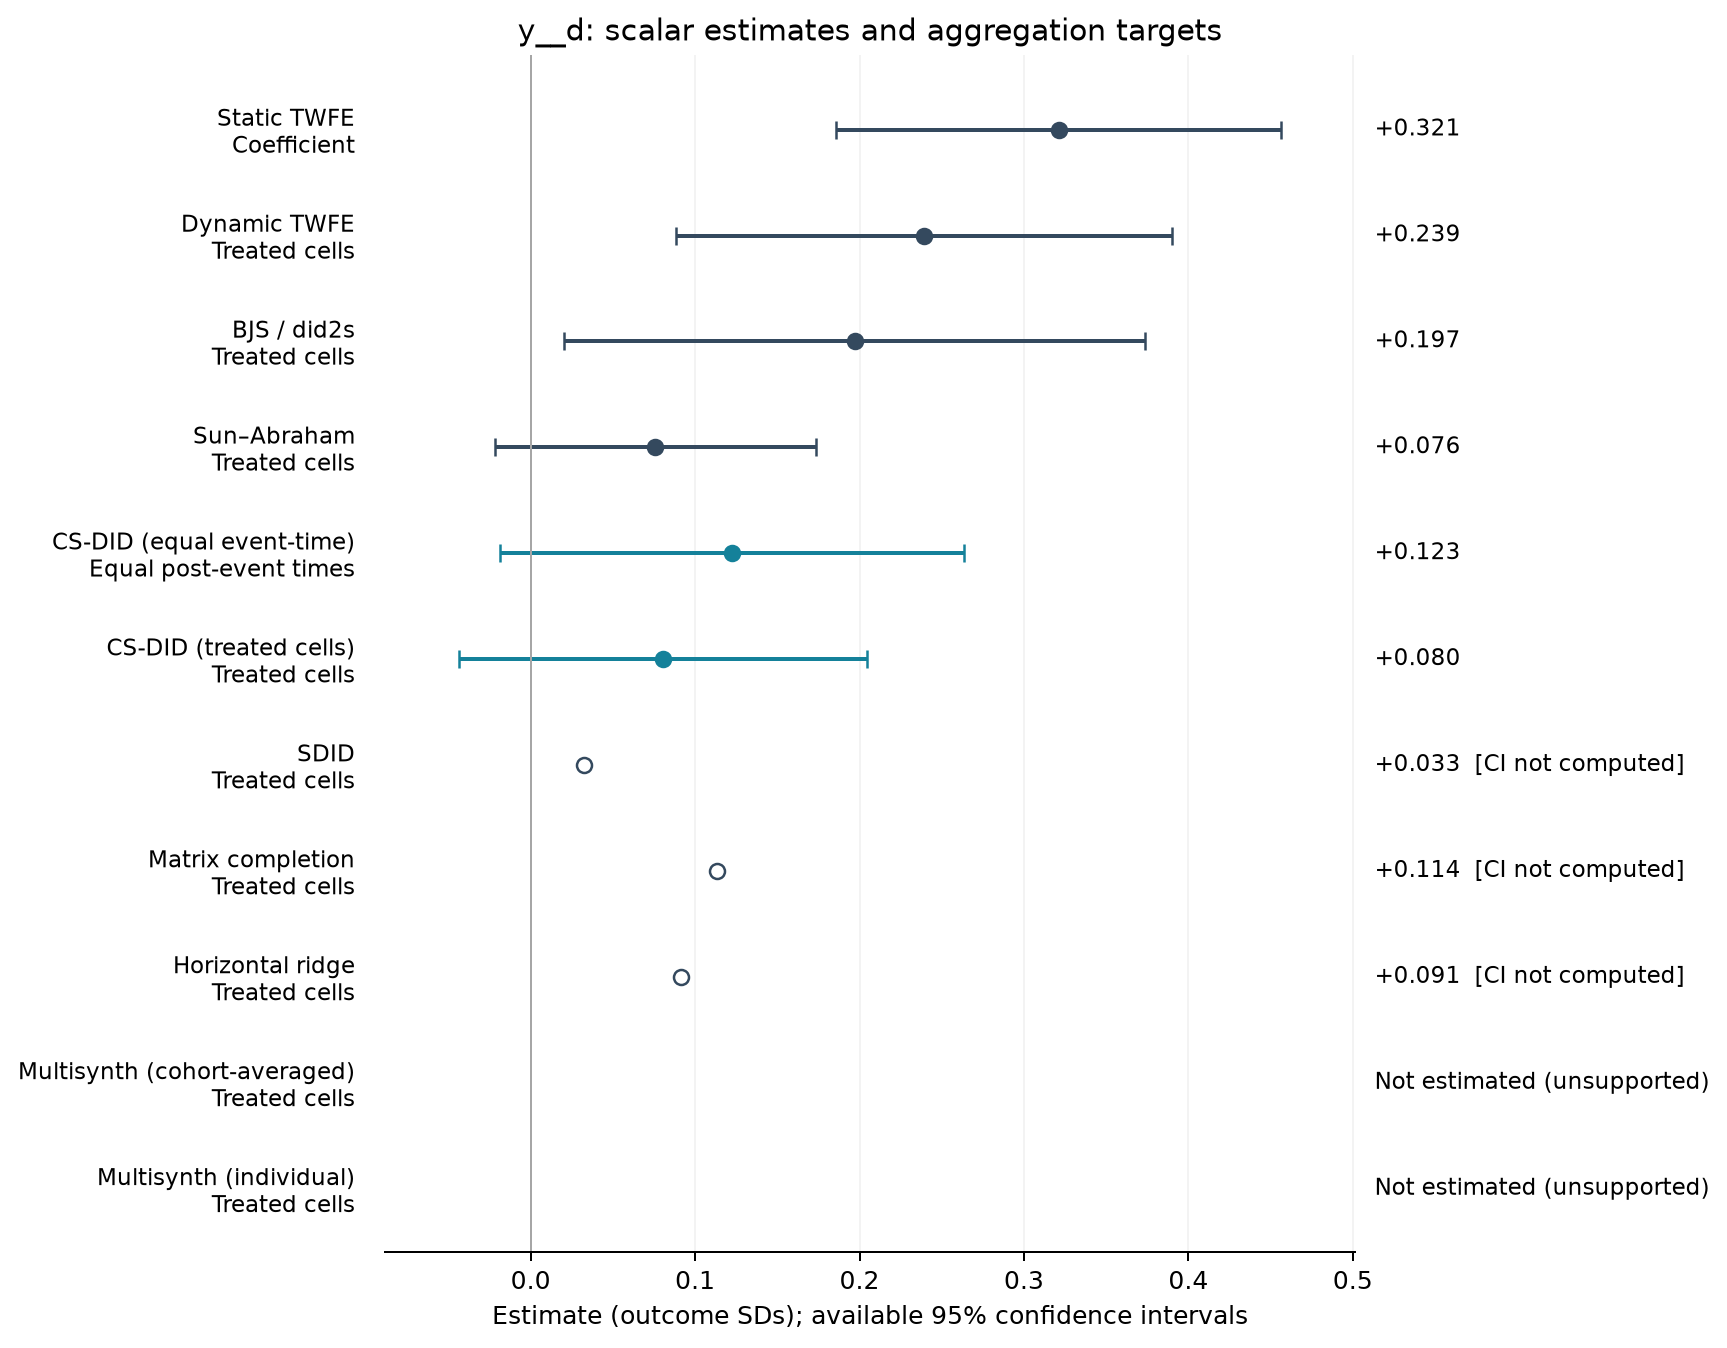
Estimate comparison
| Estimator | Estimate (SDs) | SE | 95% CI | Averaging |
|---|---|---|---|---|
| Static TWFE | 0.321 | 0.069 | [0.186, 0.456] | Coefficient |
| Dynamic TWFE | 0.239 | 0.077 | [0.089, 0.390] | Treated cells |
| BJS / did2s | 0.197 | 0.090 | [0.020, 0.374] | Treated cells |
| Sun–Abraham | 0.076 | 0.050 | [-0.022, 0.173] | Treated cells |
| CS-DID (equal event-time) | 0.123 | 0.072 | [-0.018, 0.263] | Equal post-event times |
| CS-DID (treated cells) | 0.080 | 0.063 | [-0.044, 0.204] | Treated cells |
| SDID | 0.033 | — | — | Treated cells |
| Matrix completion | 0.114 | — | — | Treated cells |
| Horizontal ridge | 0.091 | — | — | Treated cells |
Event studies
Periods −10 to +10; pointwise 95% intervals where available.
REXER-T6-PA-SECURITY-C8-HOLD
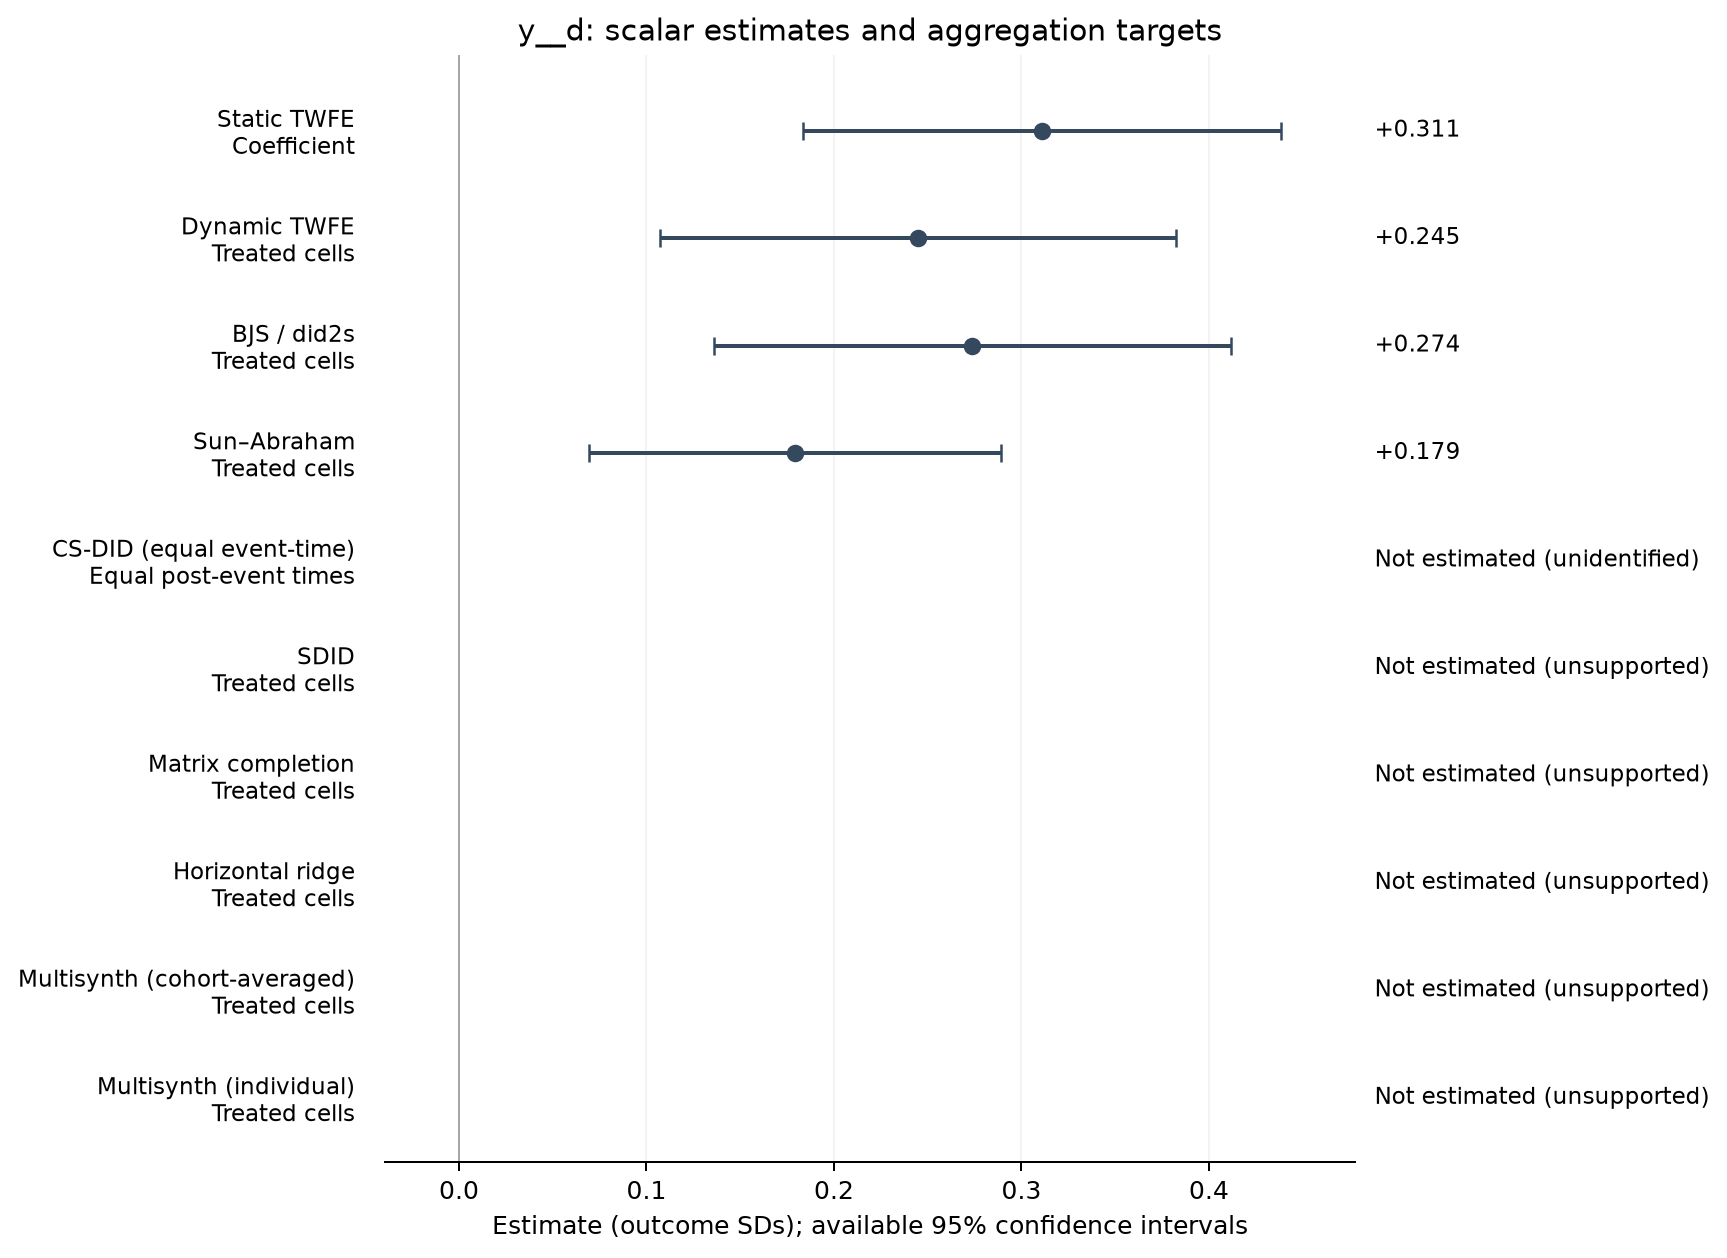
3,088 observations · 294 units · 294 clusters · 24 treated / 270 control units.
Estimate comparison
| Estimator | Estimate (SDs) | SE | 95% CI | Averaging |
|---|---|---|---|---|
| Static TWFE | 0.311 | 0.065 | [0.184, 0.439] | Coefficient |
| Dynamic TWFE | 0.245 | 0.070 | [0.107, 0.383] | Treated cells |
| BJS / did2s | 0.274 | 0.070 | [0.136, 0.412] | Treated cells |
| Sun–Abraham | 0.179 | 0.056 | [0.069, 0.289] | Treated cells |
Event studies
Periods −10 to +10; pointwise 95% intervals where available.
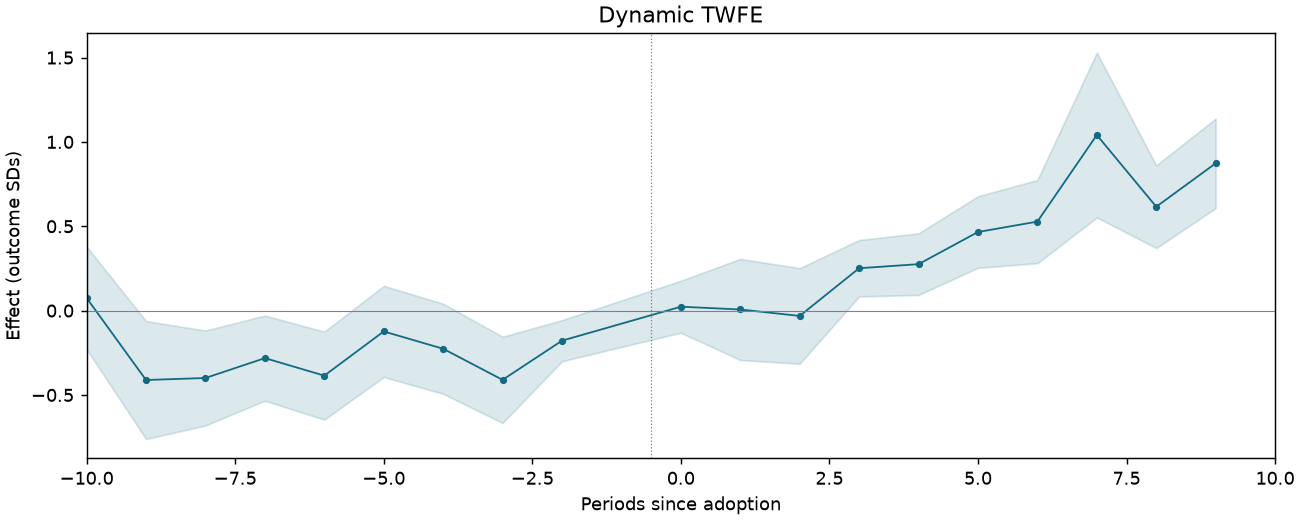
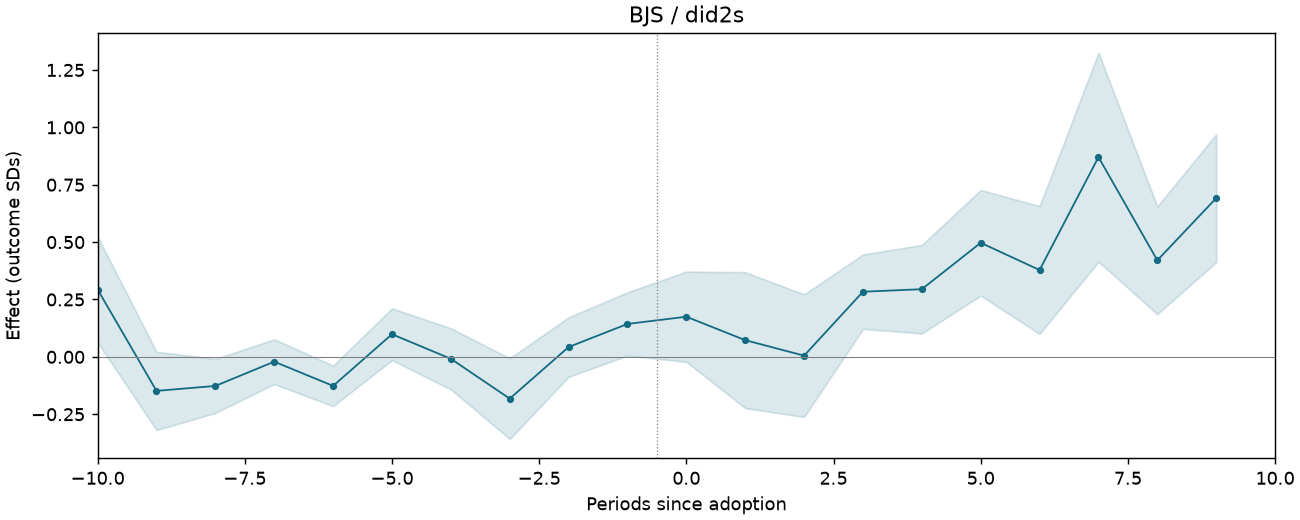
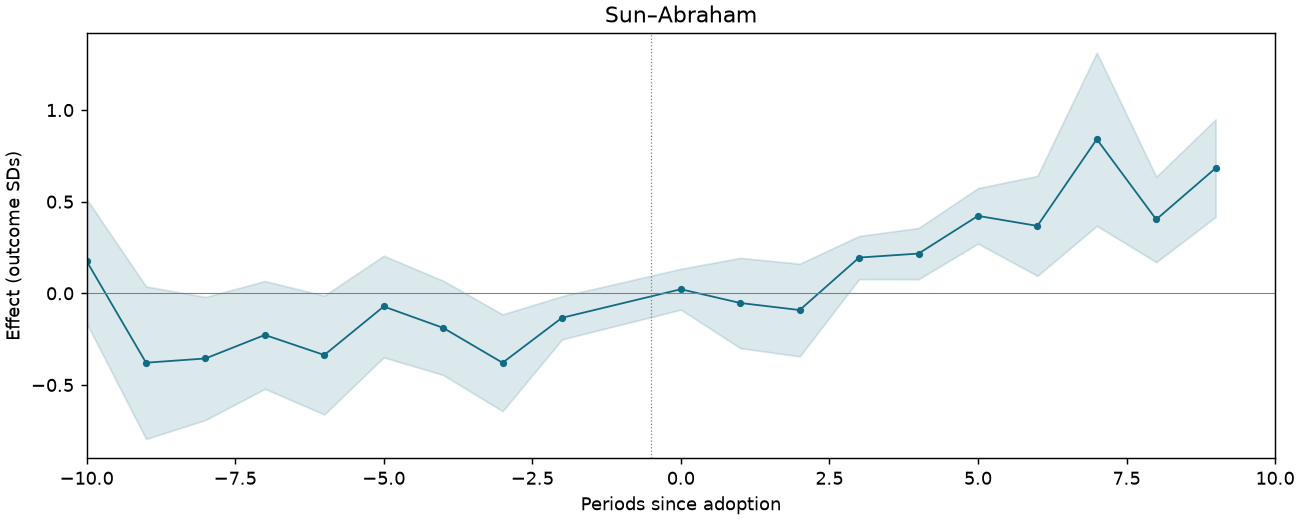
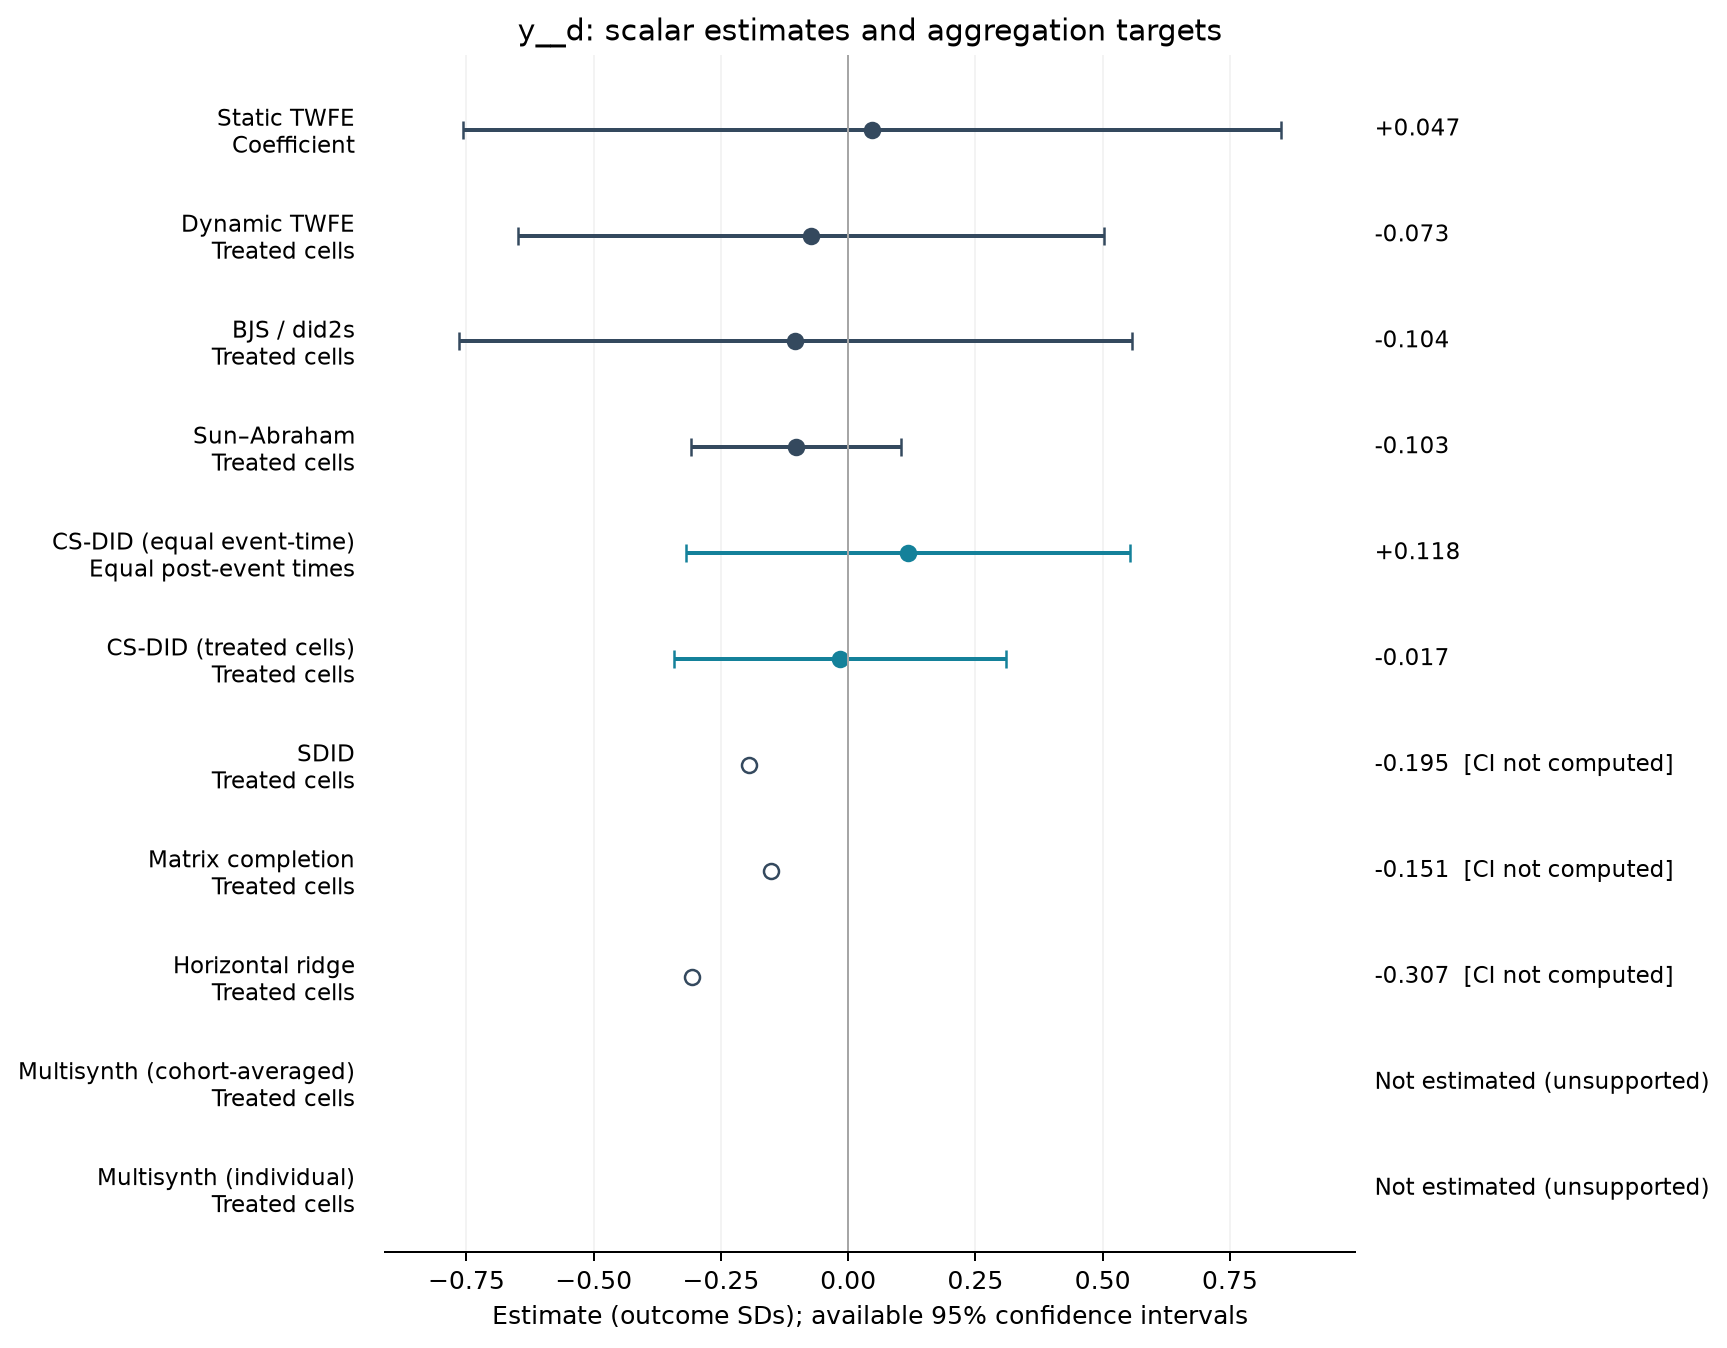
REXER-T6-PB-OTHER-C3-HOLD
546 observations · 56 units · 56 clusters · 3 treated / 53 control units.
Estimate comparison
| Estimator | Estimate (SDs) | SE | 95% CI | Averaging |
|---|---|---|---|---|
| Static TWFE | 0.047 | 0.401 | [-0.757, 0.851] | Coefficient |
| Dynamic TWFE | -0.073 | 0.287 | [-0.648, 0.502] | Treated cells |
| BJS / did2s | -0.104 | 0.330 | [-0.765, 0.557] | Treated cells |
| Sun–Abraham | -0.103 | 0.103 | [-0.309, 0.103] | Treated cells |
| CS-DID (equal event-time) | 0.118 | 0.223 | [-0.319, 0.554] | Equal post-event times |
| CS-DID (treated cells) | -0.017 | 0.166 | [-0.343, 0.309] | Treated cells |
| SDID | -0.195 | — | — | Treated cells |
| Matrix completion | -0.151 | — | — | Treated cells |
| Horizontal ridge | -0.307 | — | — | Treated cells |
Event studies
Periods −10 to +10; pointwise 95% intervals where available.
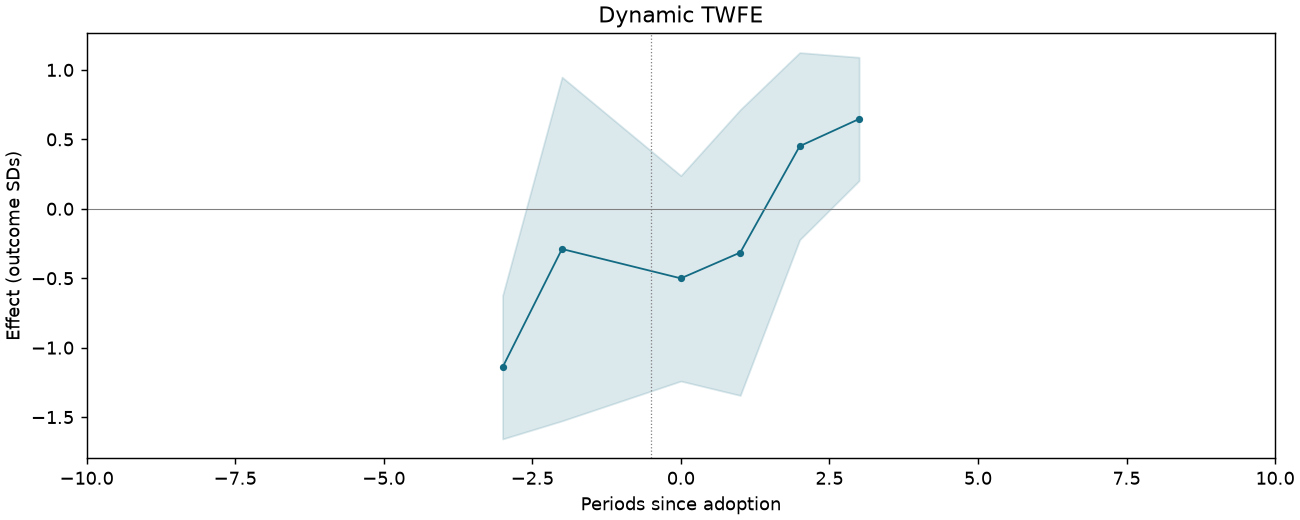
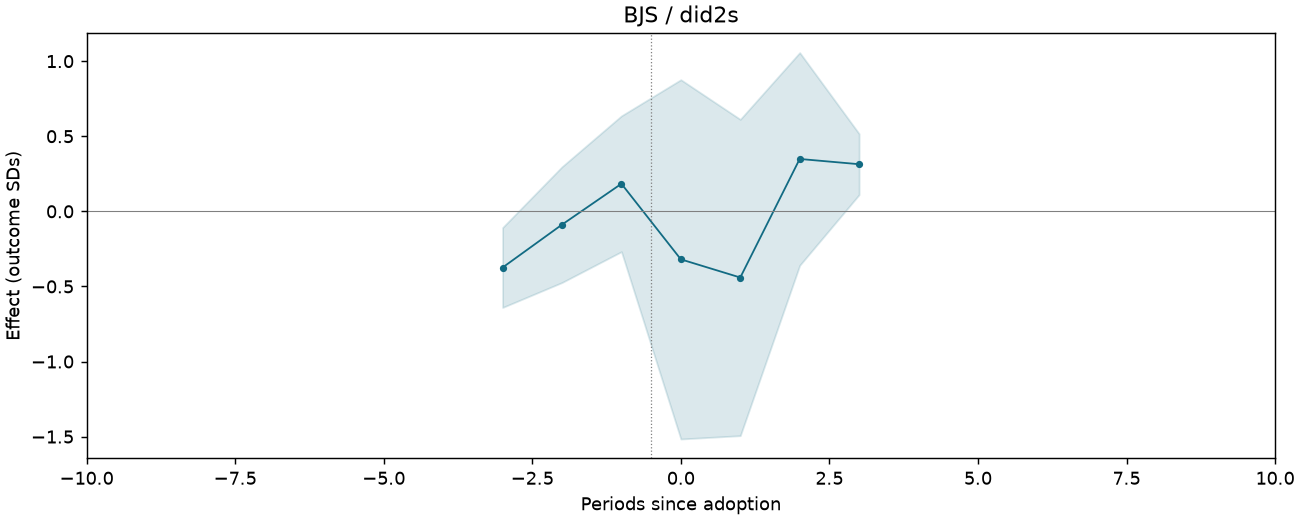
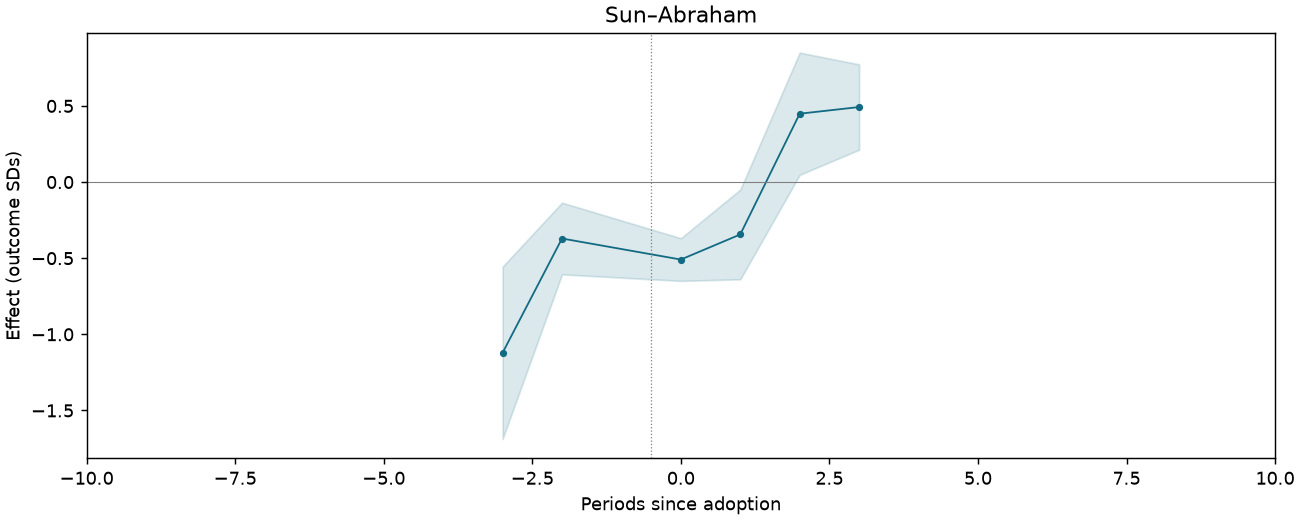
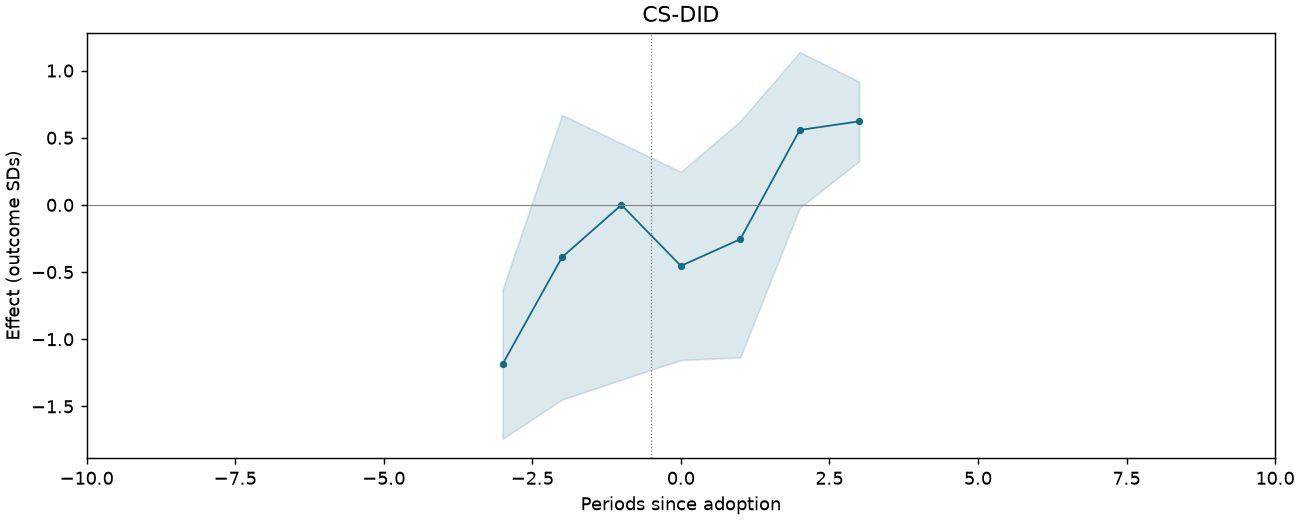
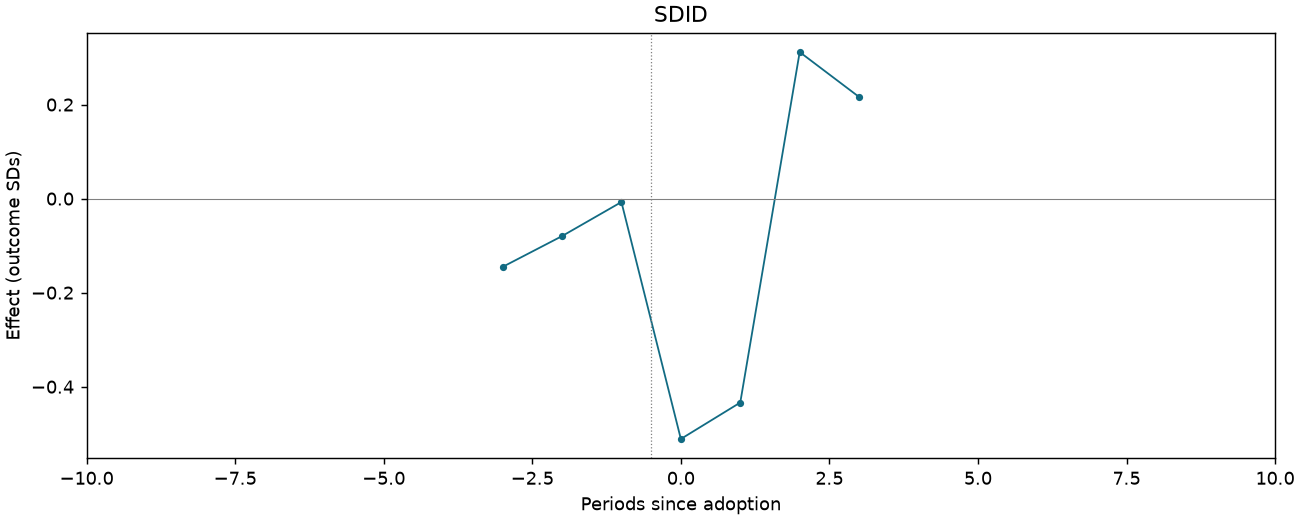
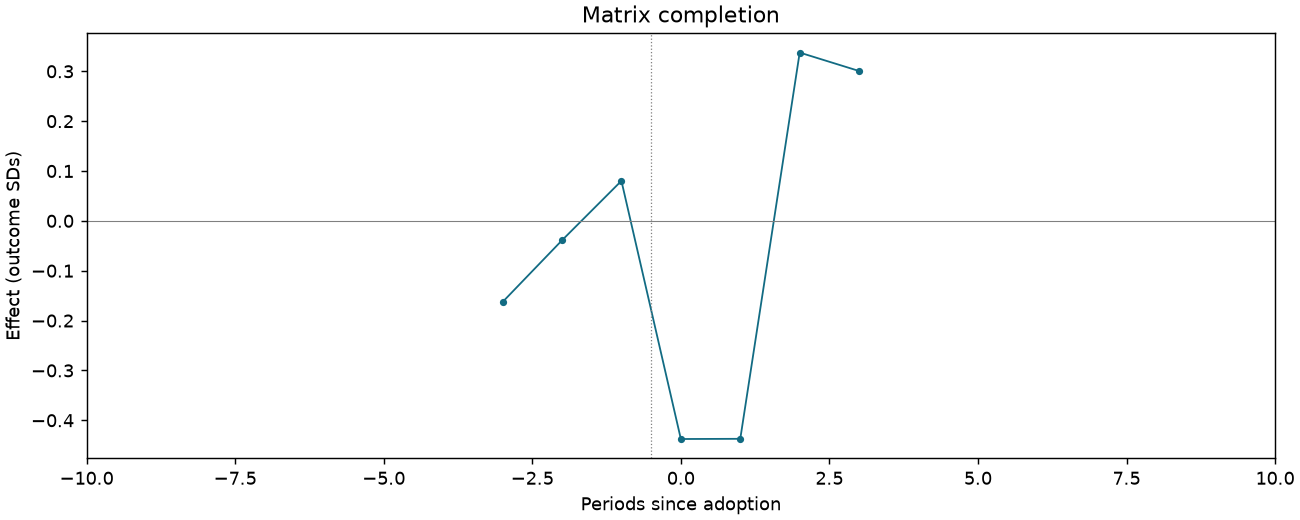
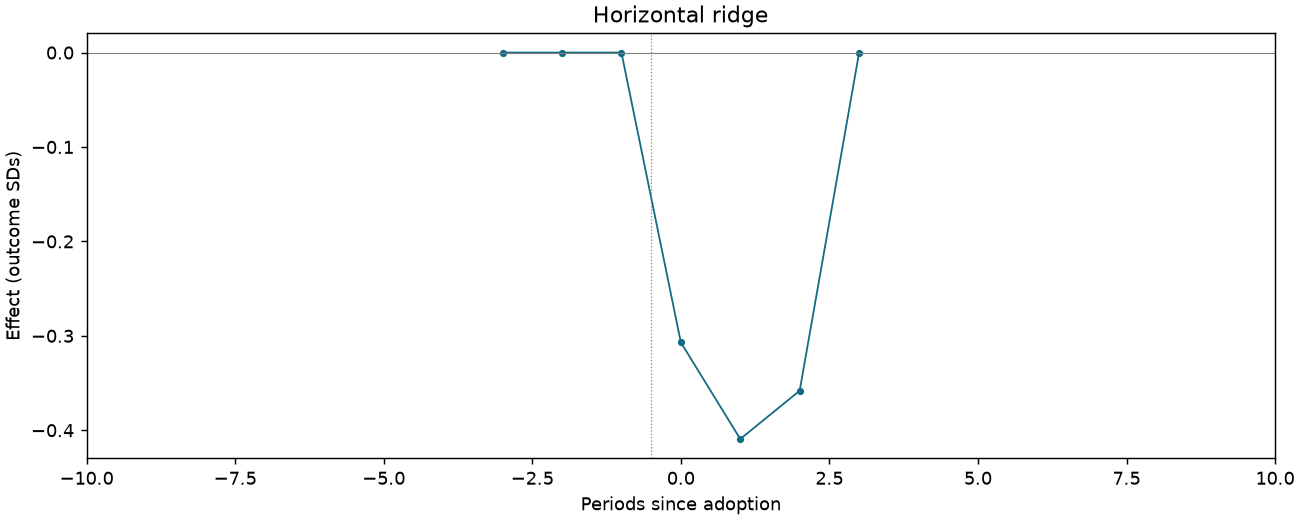
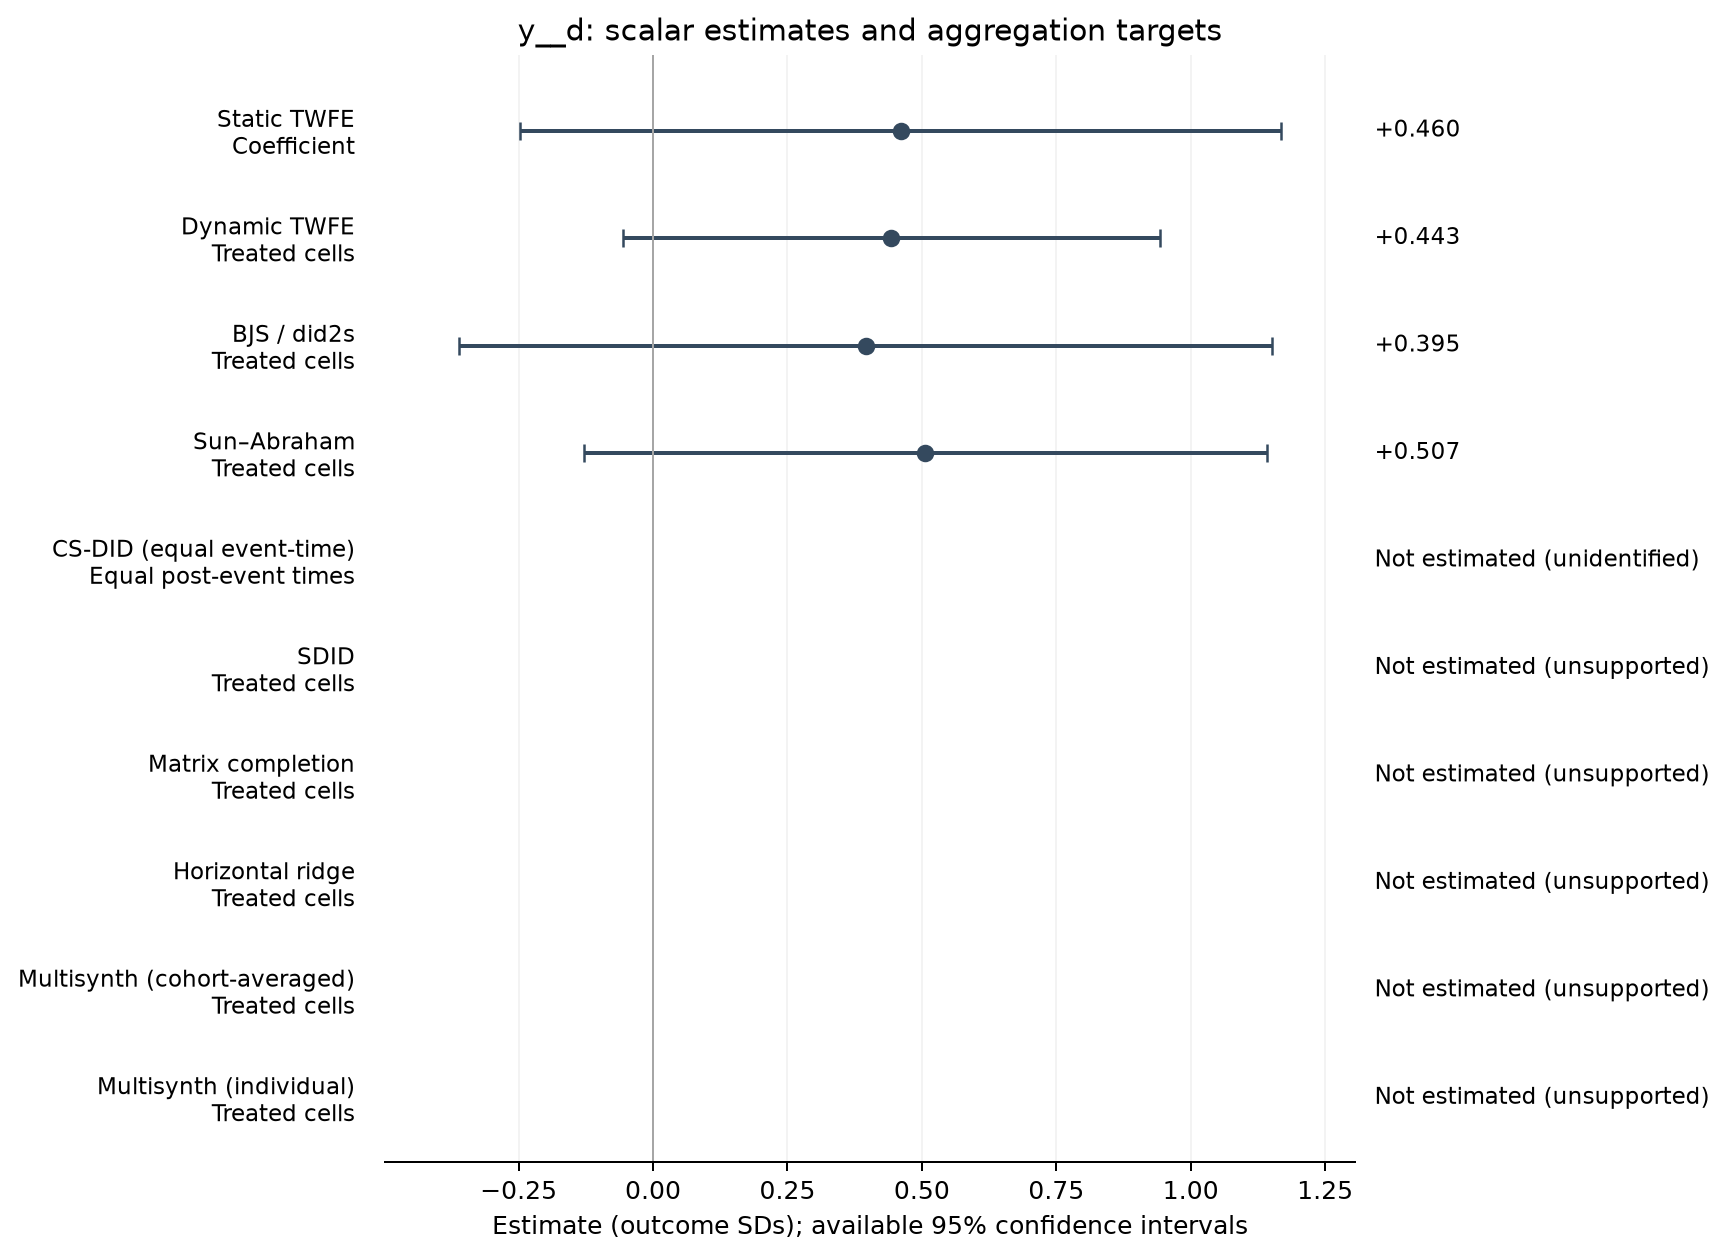
REXER-T6-PB-OTHER-C4-HOLD
546 observations · 56 units · 56 clusters · 3 treated / 53 control units.
Estimate comparison
| Estimator | Estimate (SDs) | SE | 95% CI | Averaging |
|---|---|---|---|---|
| Static TWFE | 0.460 | 0.353 | [-0.247, 1.168] | Coefficient |
| Dynamic TWFE | 0.443 | 0.249 | [-0.056, 0.942] | Treated cells |
| BJS / did2s | 0.395 | 0.377 | [-0.361, 1.151] | Treated cells |
| Sun–Abraham | 0.507 | 0.317 | [-0.129, 1.142] | Treated cells |
Event studies
Periods −10 to +10; pointwise 95% intervals where available.
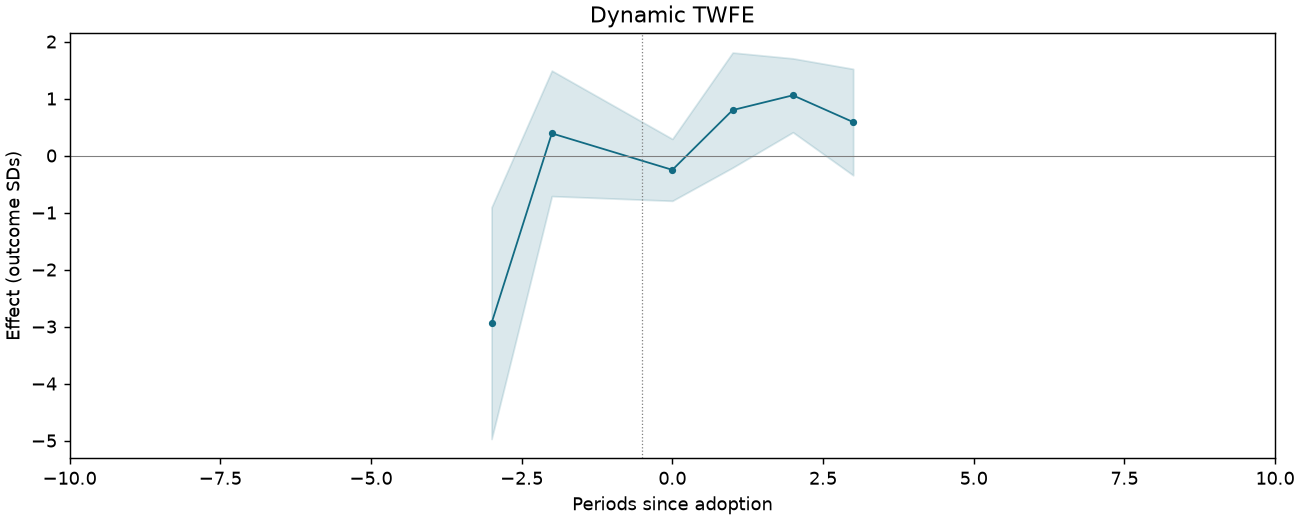
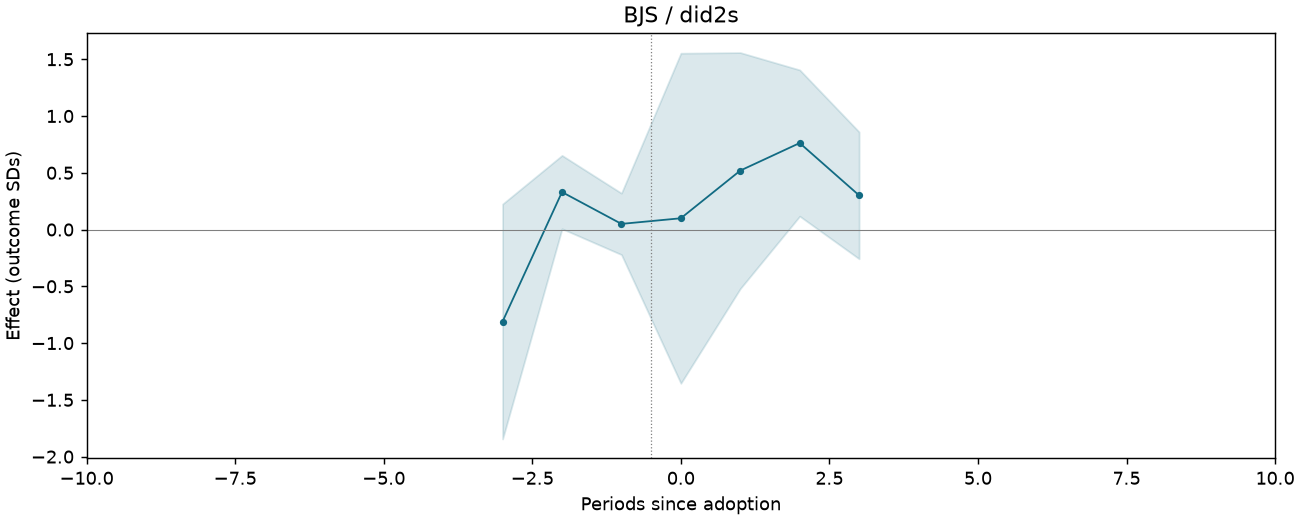
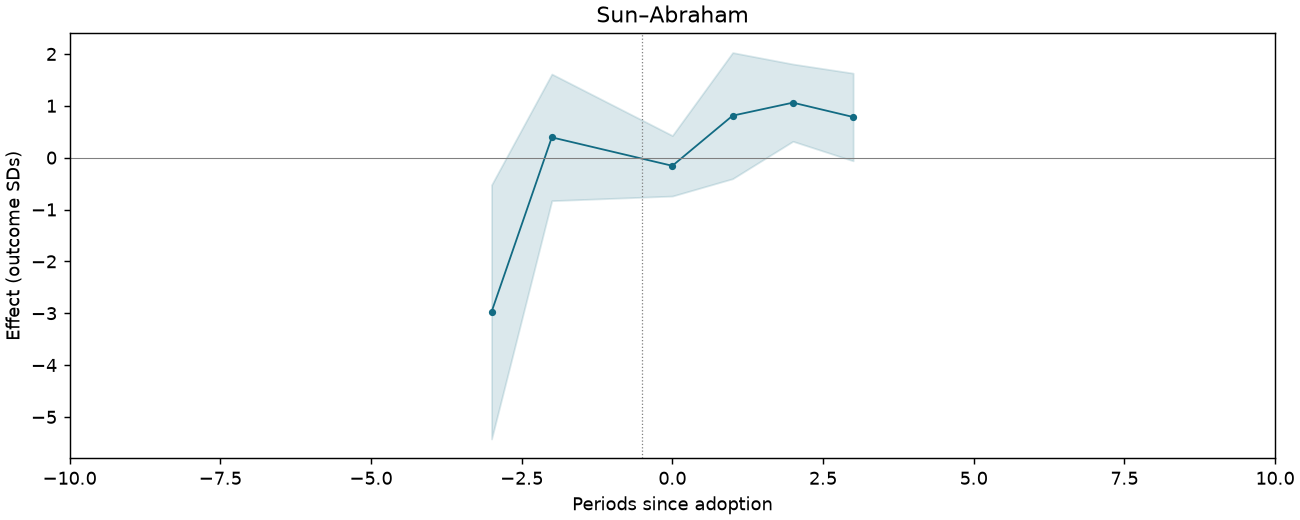
REXER-T6-PB-OTHER-C5-HOLD
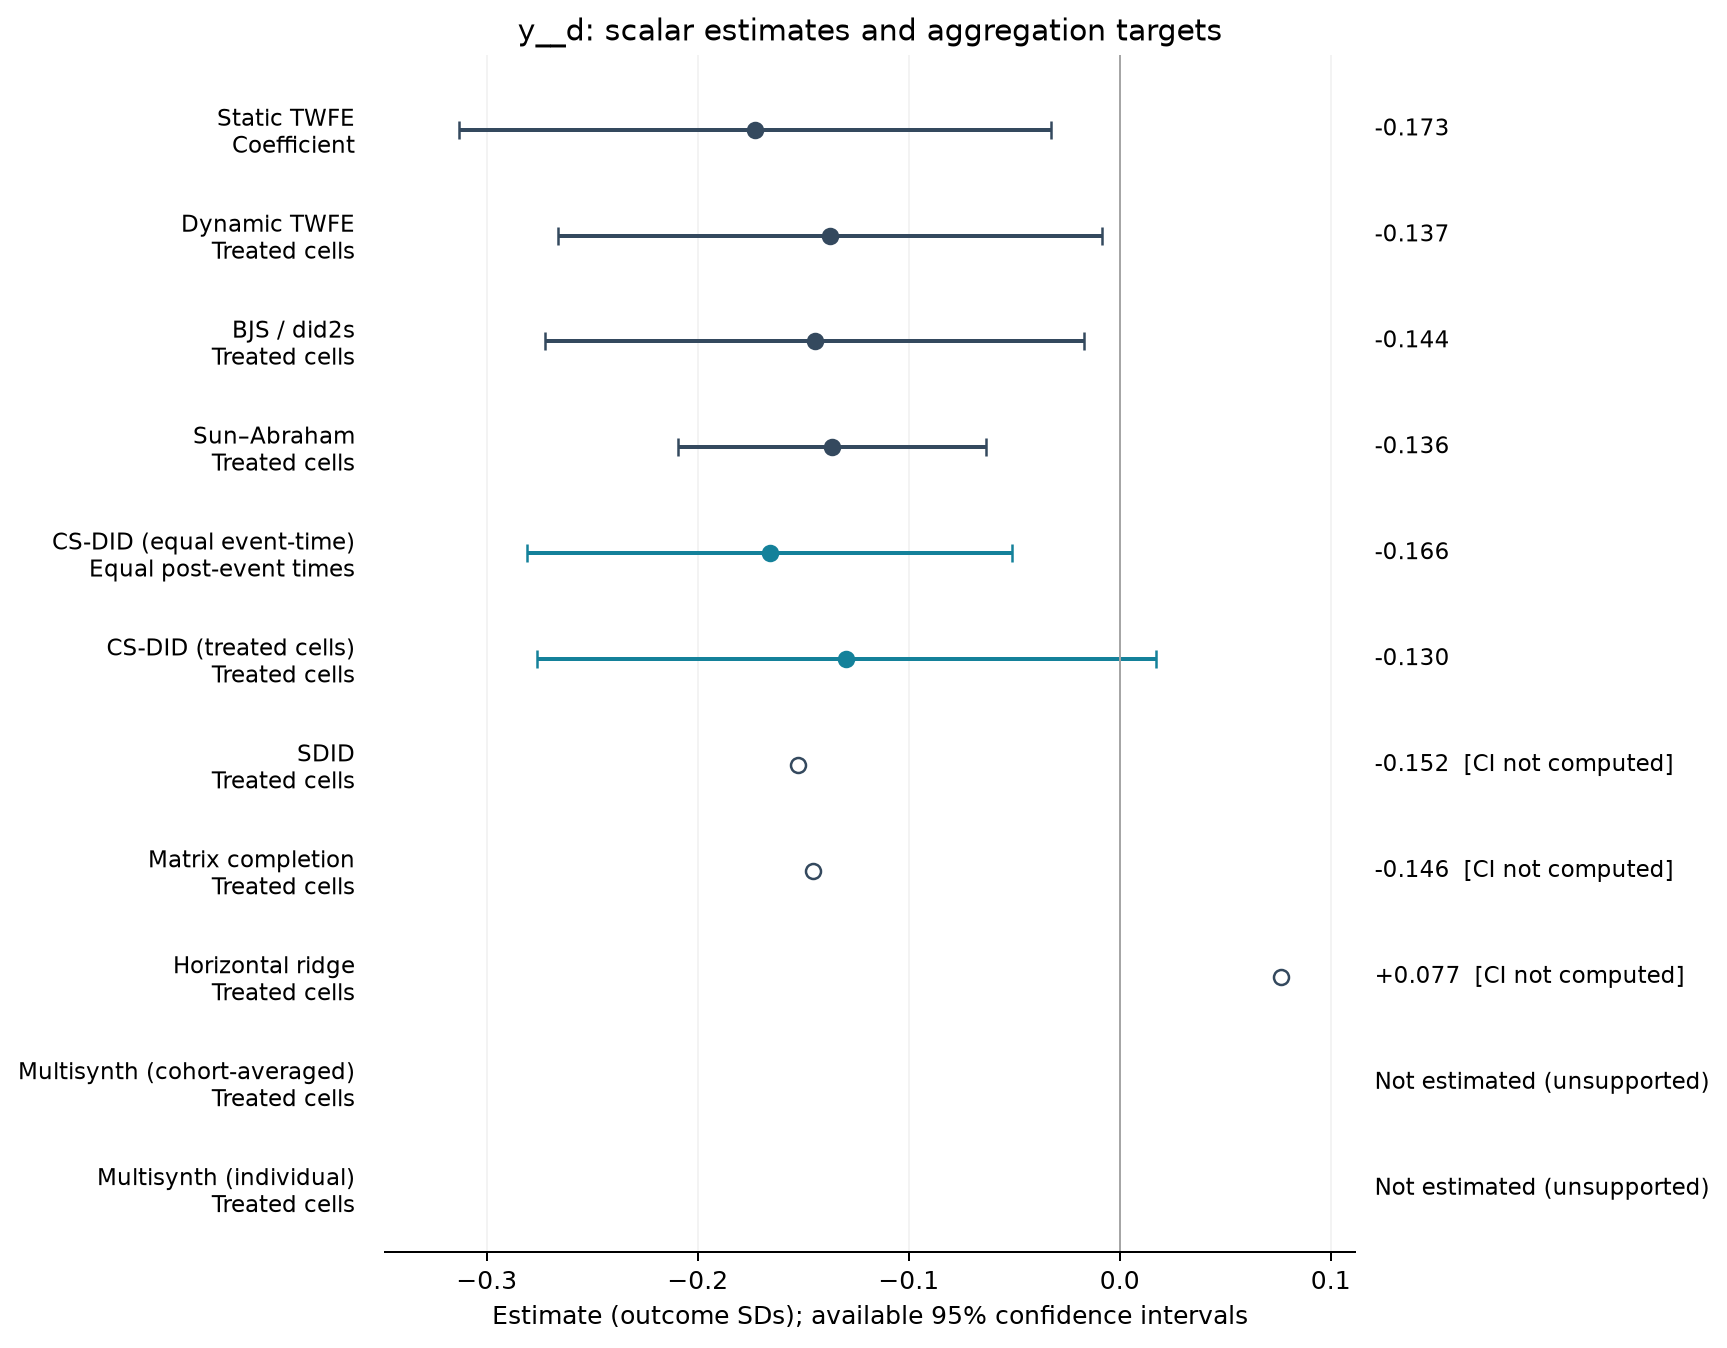
546 observations · 56 units · 56 clusters · 3 treated / 53 control units.
Estimate comparison
| Estimator | Estimate (SDs) | SE | 95% CI | Averaging |
|---|---|---|---|---|
| Static TWFE | -0.173 | 0.070 | [-0.313, -0.033] | Coefficient |
| Dynamic TWFE | -0.137 | 0.064 | [-0.266, -0.008] | Treated cells |
| BJS / did2s | -0.144 | 0.064 | [-0.272, -0.017] | Treated cells |
| Sun–Abraham | -0.136 | 0.036 | [-0.209, -0.063] | Treated cells |
| CS-DID (equal event-time) | -0.166 | 0.059 | [-0.281, -0.051] | Equal post-event times |
| CS-DID (treated cells) | -0.130 | 0.075 | [-0.276, 0.017] | Treated cells |
| SDID | -0.152 | — | — | Treated cells |
| Matrix completion | -0.146 | — | — | Treated cells |
| Horizontal ridge | 0.077 | — | — | Treated cells |
Event studies
Periods −10 to +10; pointwise 95% intervals where available.
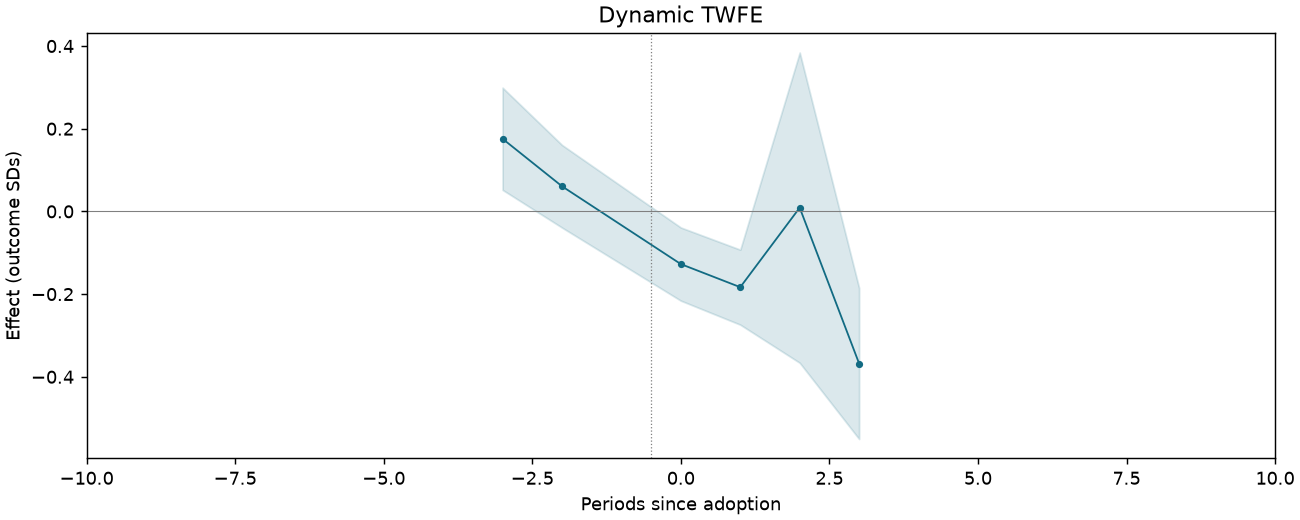
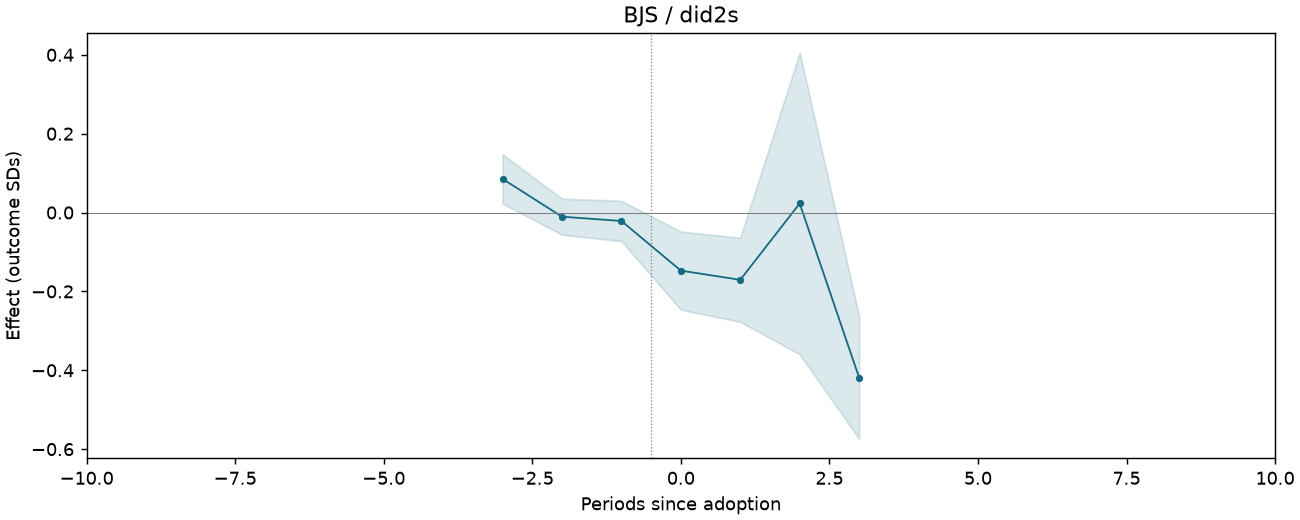
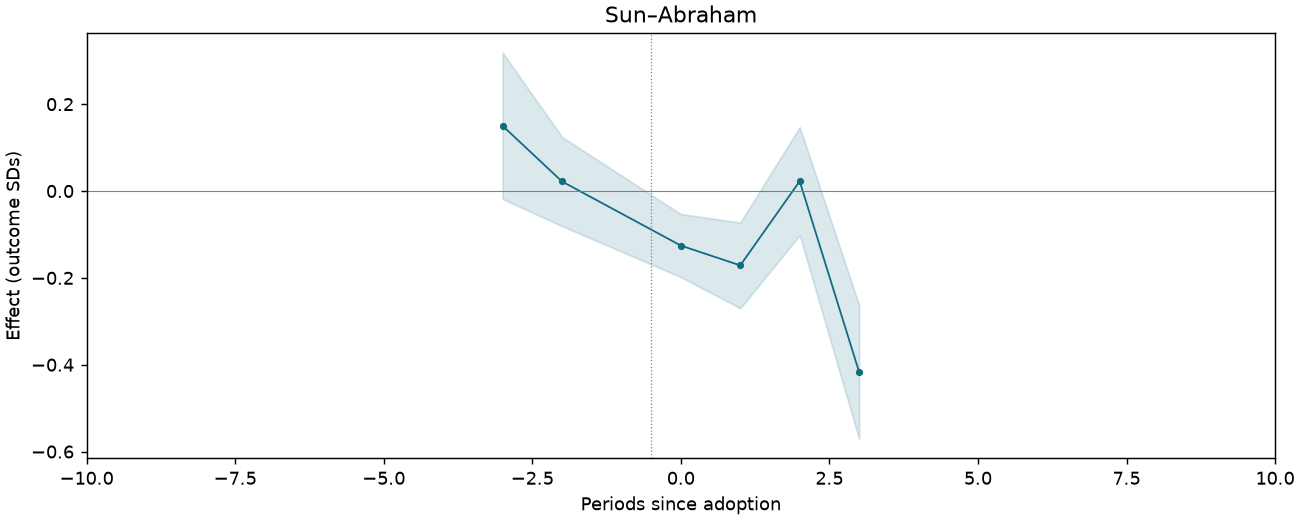
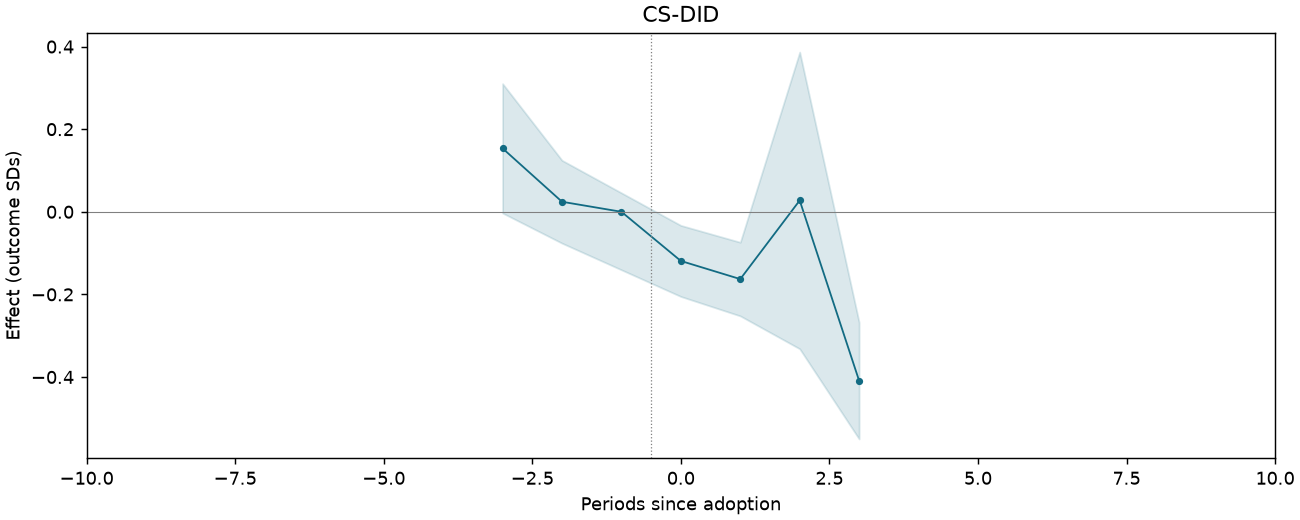
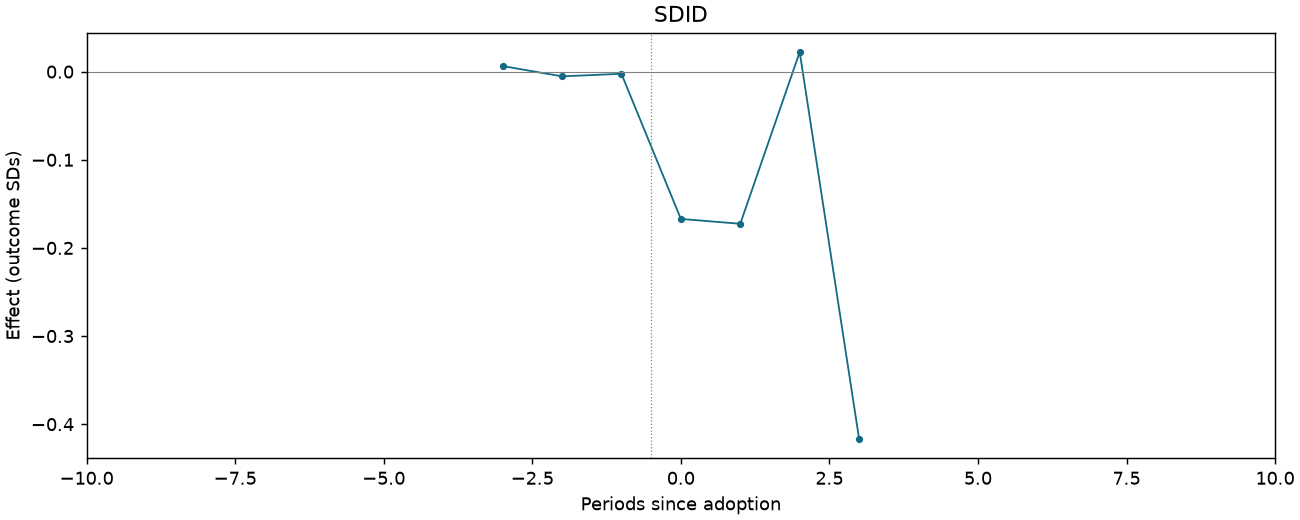
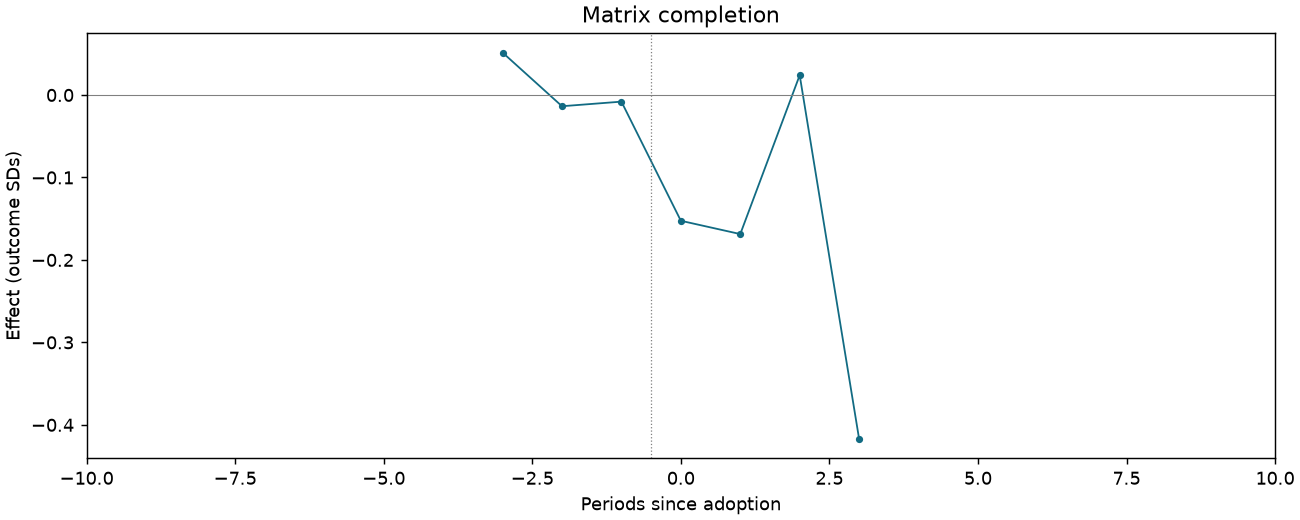
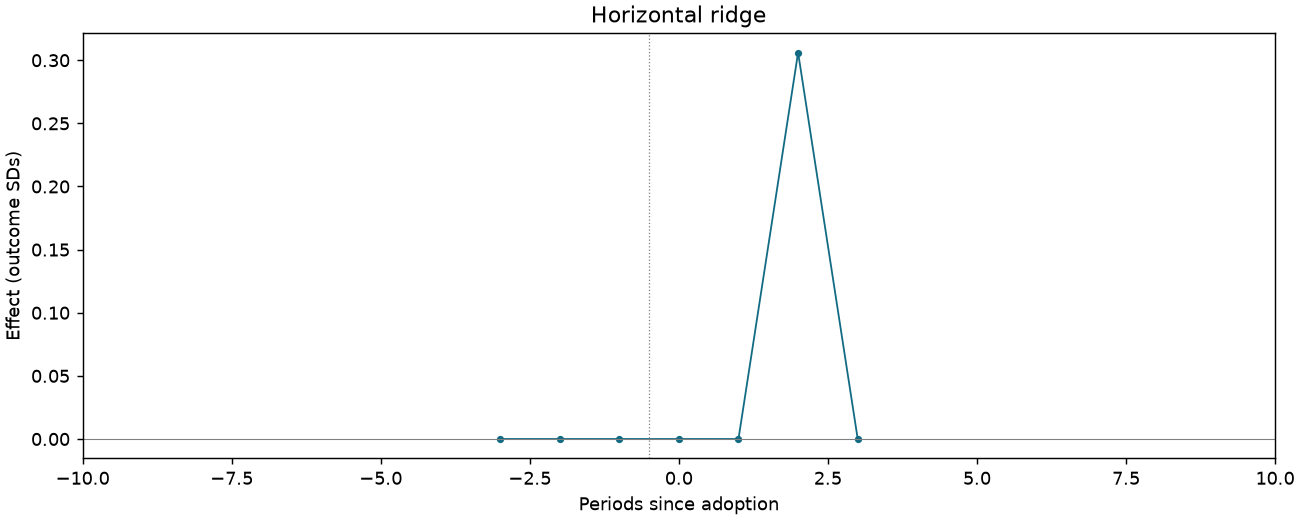
REXER-T6-PB-OTHER-C6-HOLD
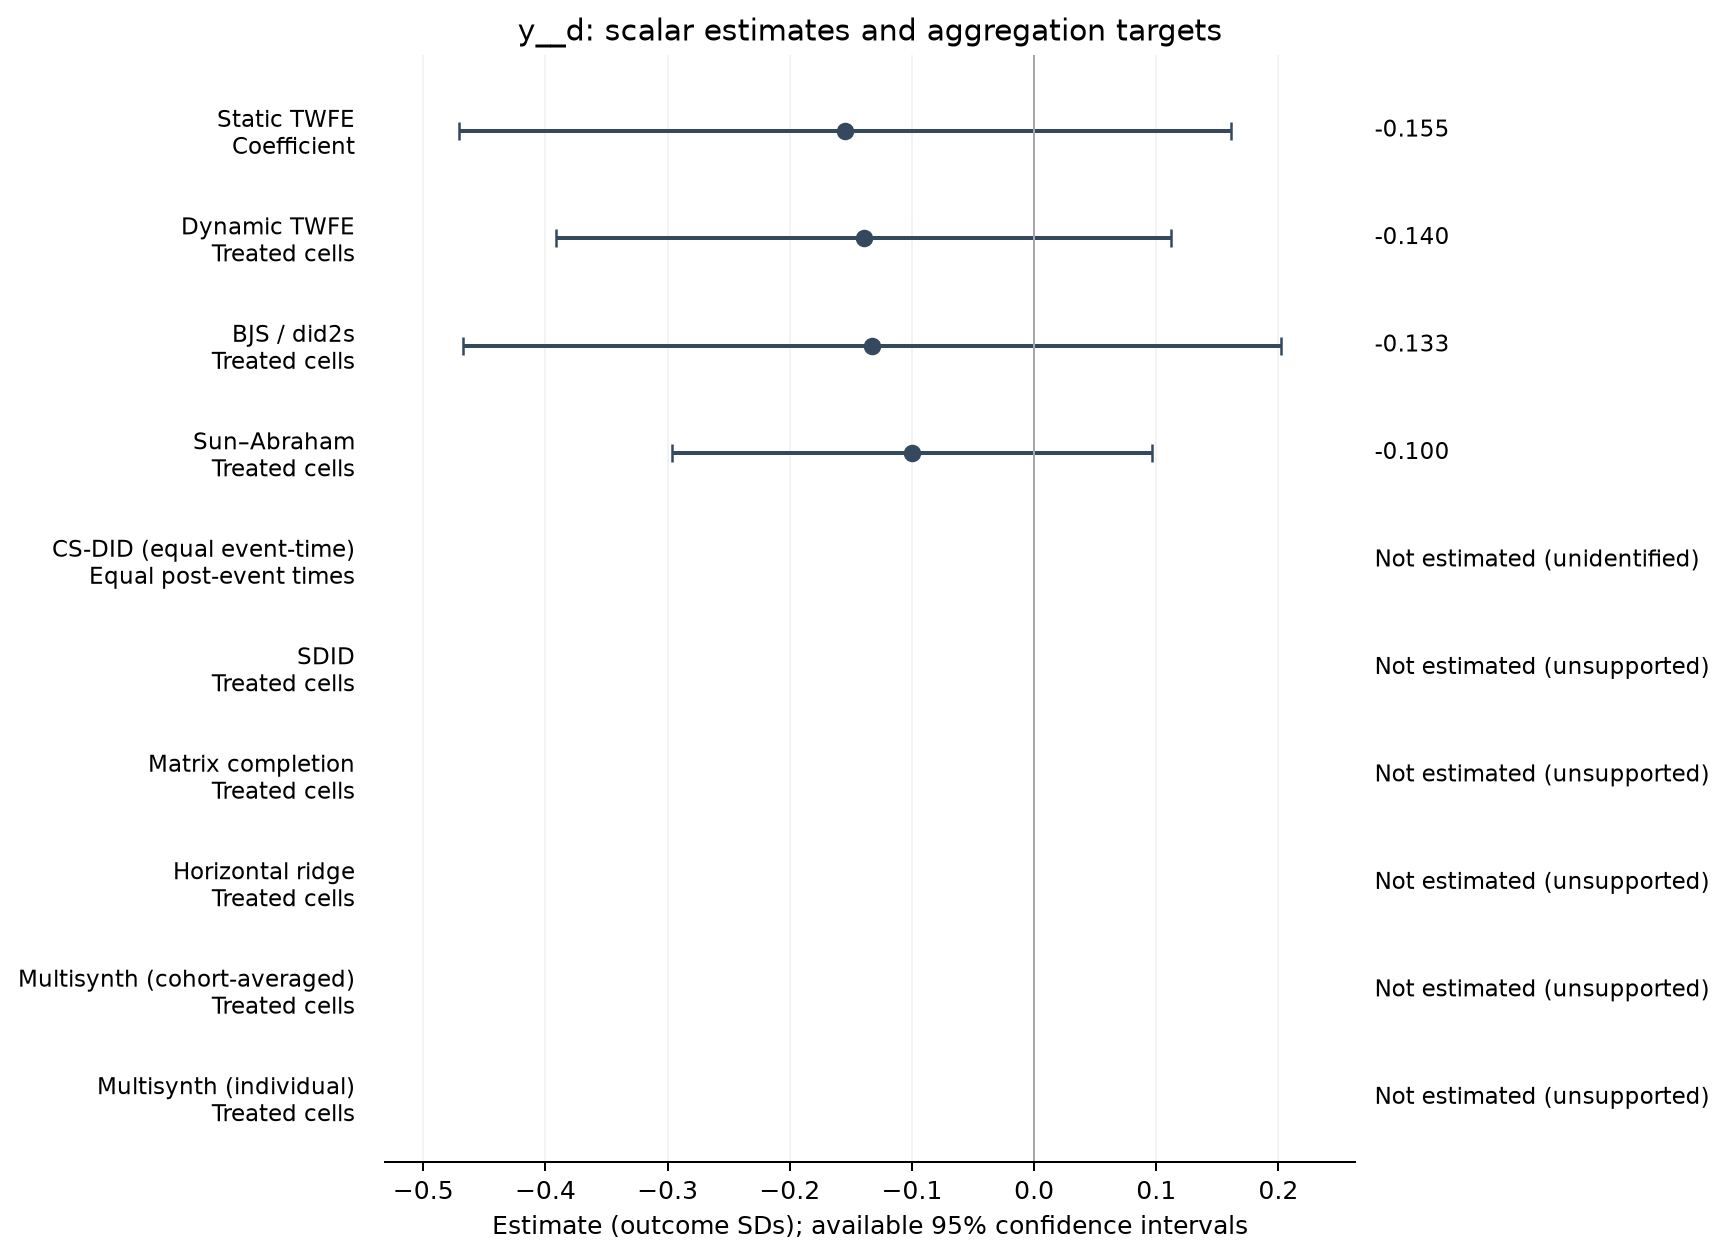
546 observations · 56 units · 56 clusters · 3 treated / 53 control units.
Estimate comparison
| Estimator | Estimate (SDs) | SE | 95% CI | Averaging |
|---|---|---|---|---|
| Static TWFE | -0.155 | 0.158 | [-0.471, 0.161] | Coefficient |
| Dynamic TWFE | -0.140 | 0.126 | [-0.392, 0.112] | Treated cells |
| BJS / did2s | -0.133 | 0.167 | [-0.468, 0.202] | Treated cells |
| Sun–Abraham | -0.100 | 0.098 | [-0.297, 0.097] | Treated cells |
Event studies
Periods −10 to +10; pointwise 95% intervals where available.
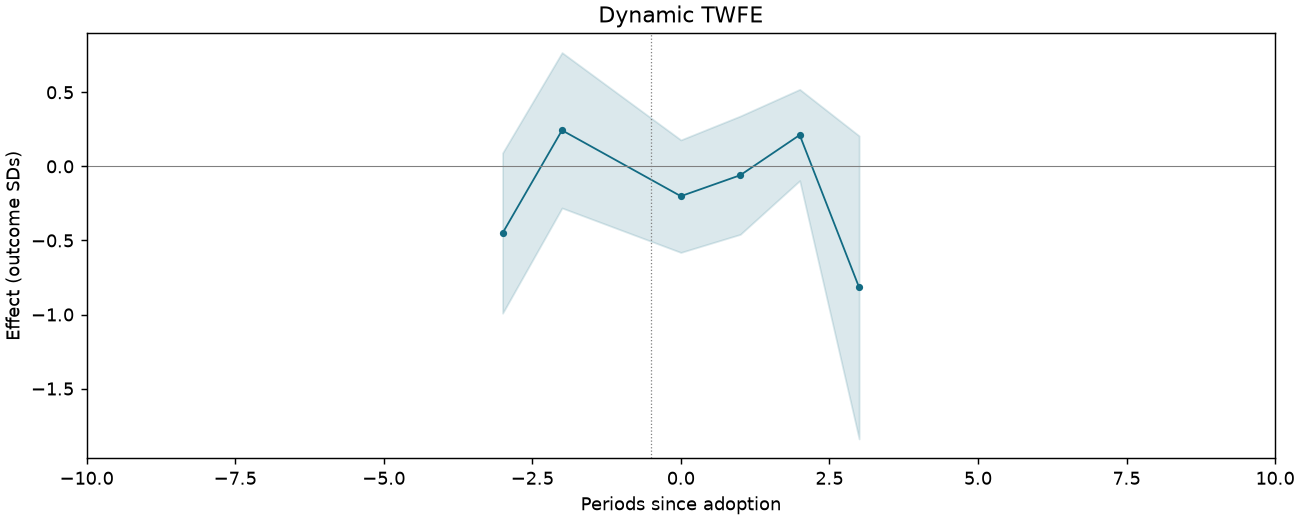
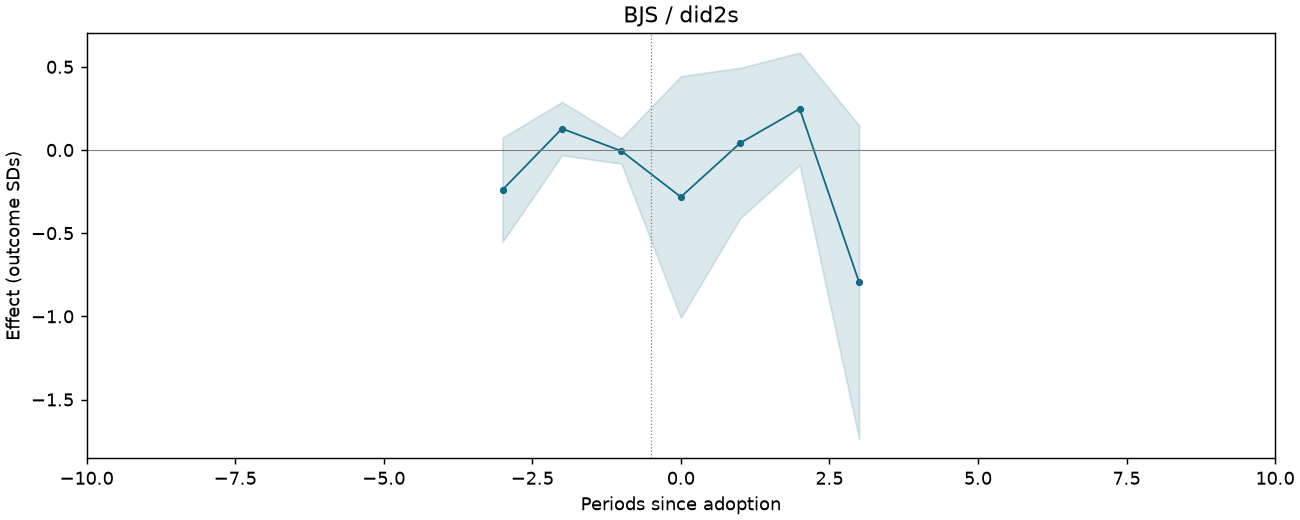
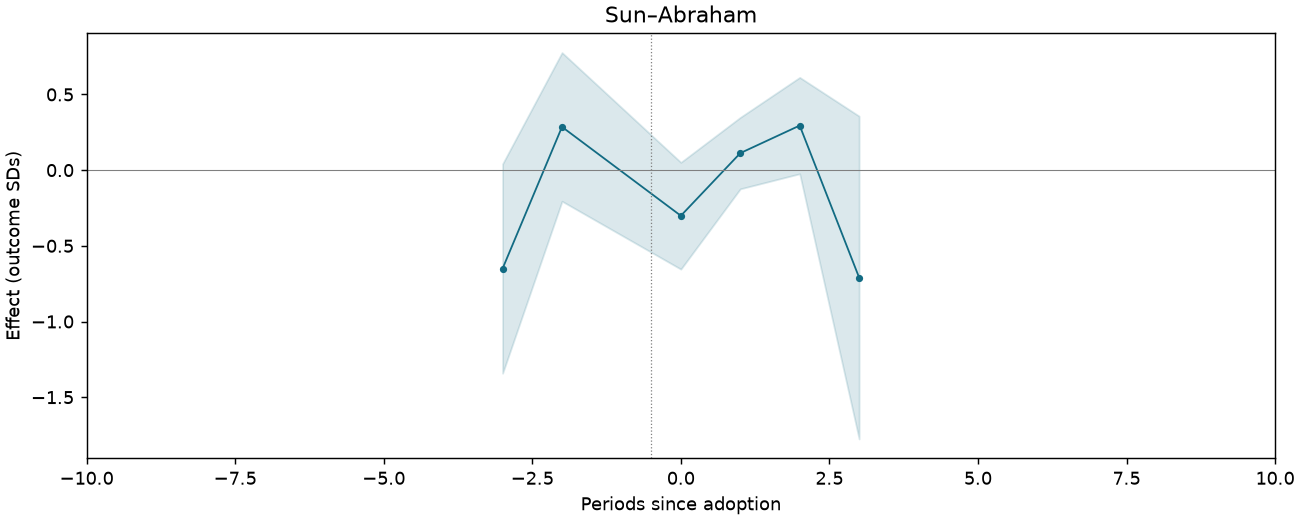
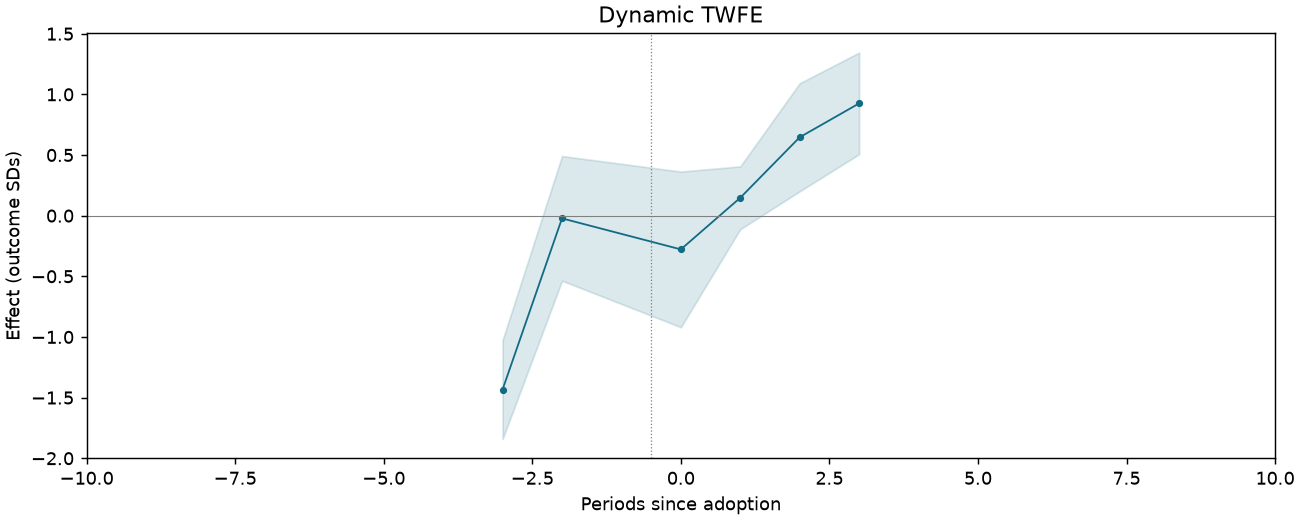
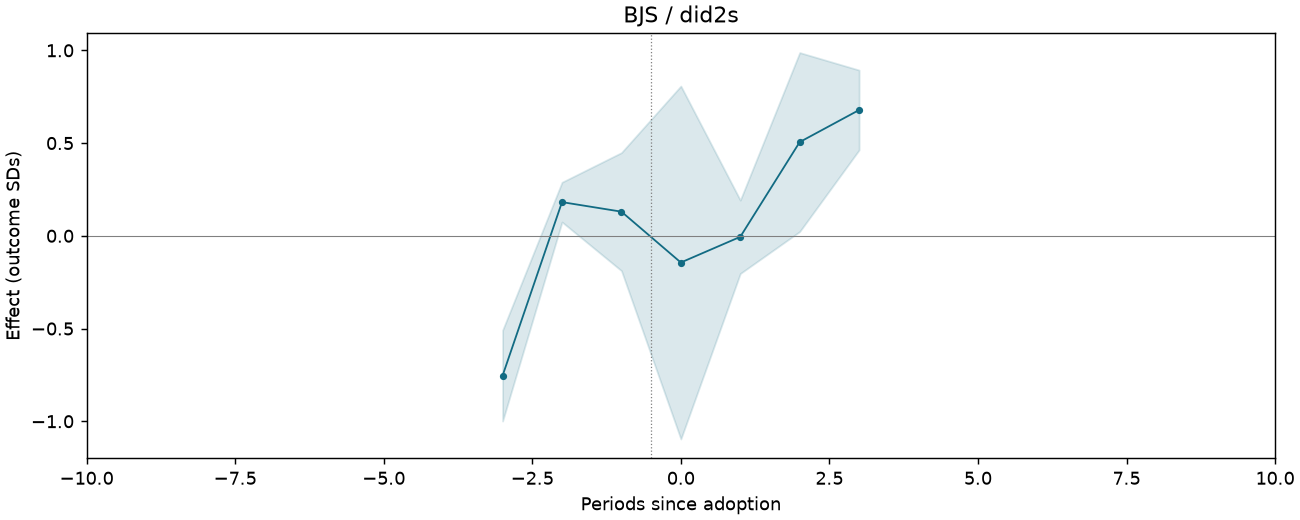
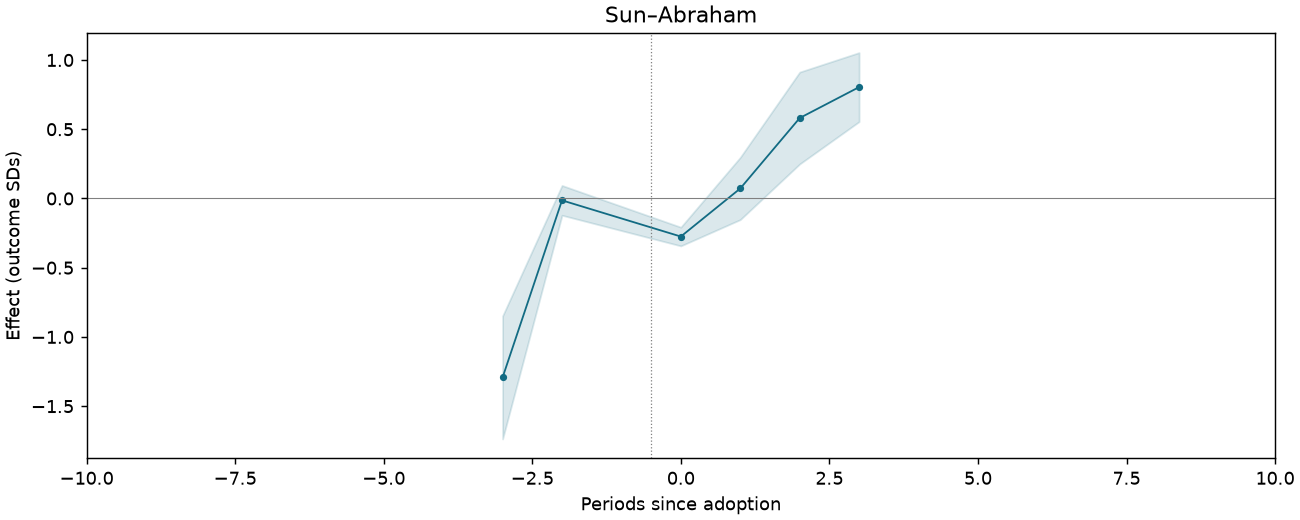
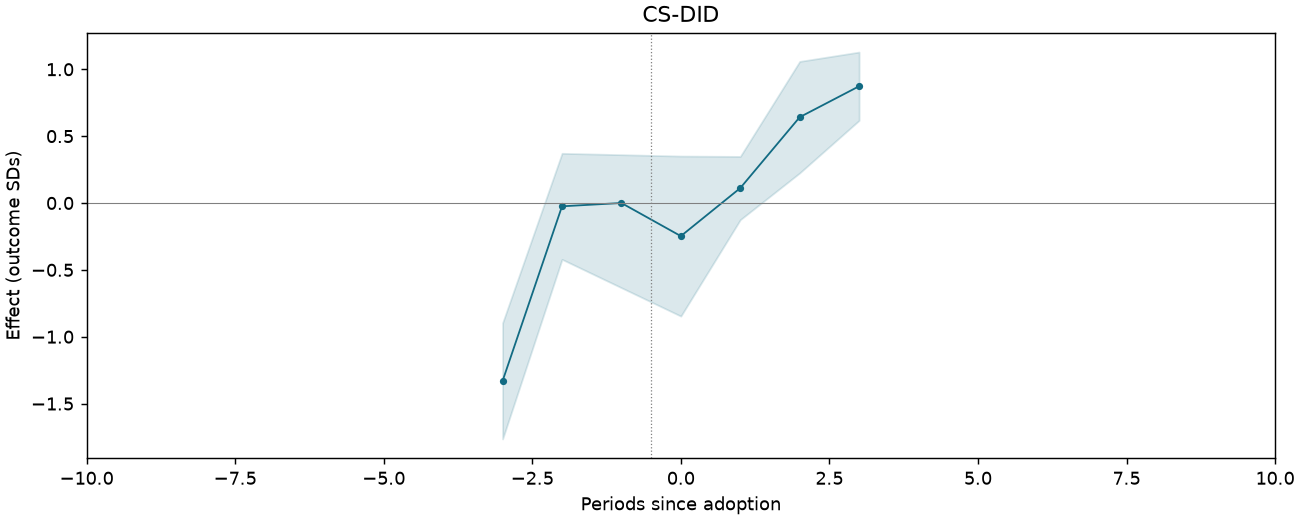
REXER-T6-PB-OTHER-C7-HOLD
546 observations · 56 units · 56 clusters · 3 treated / 53 control units.
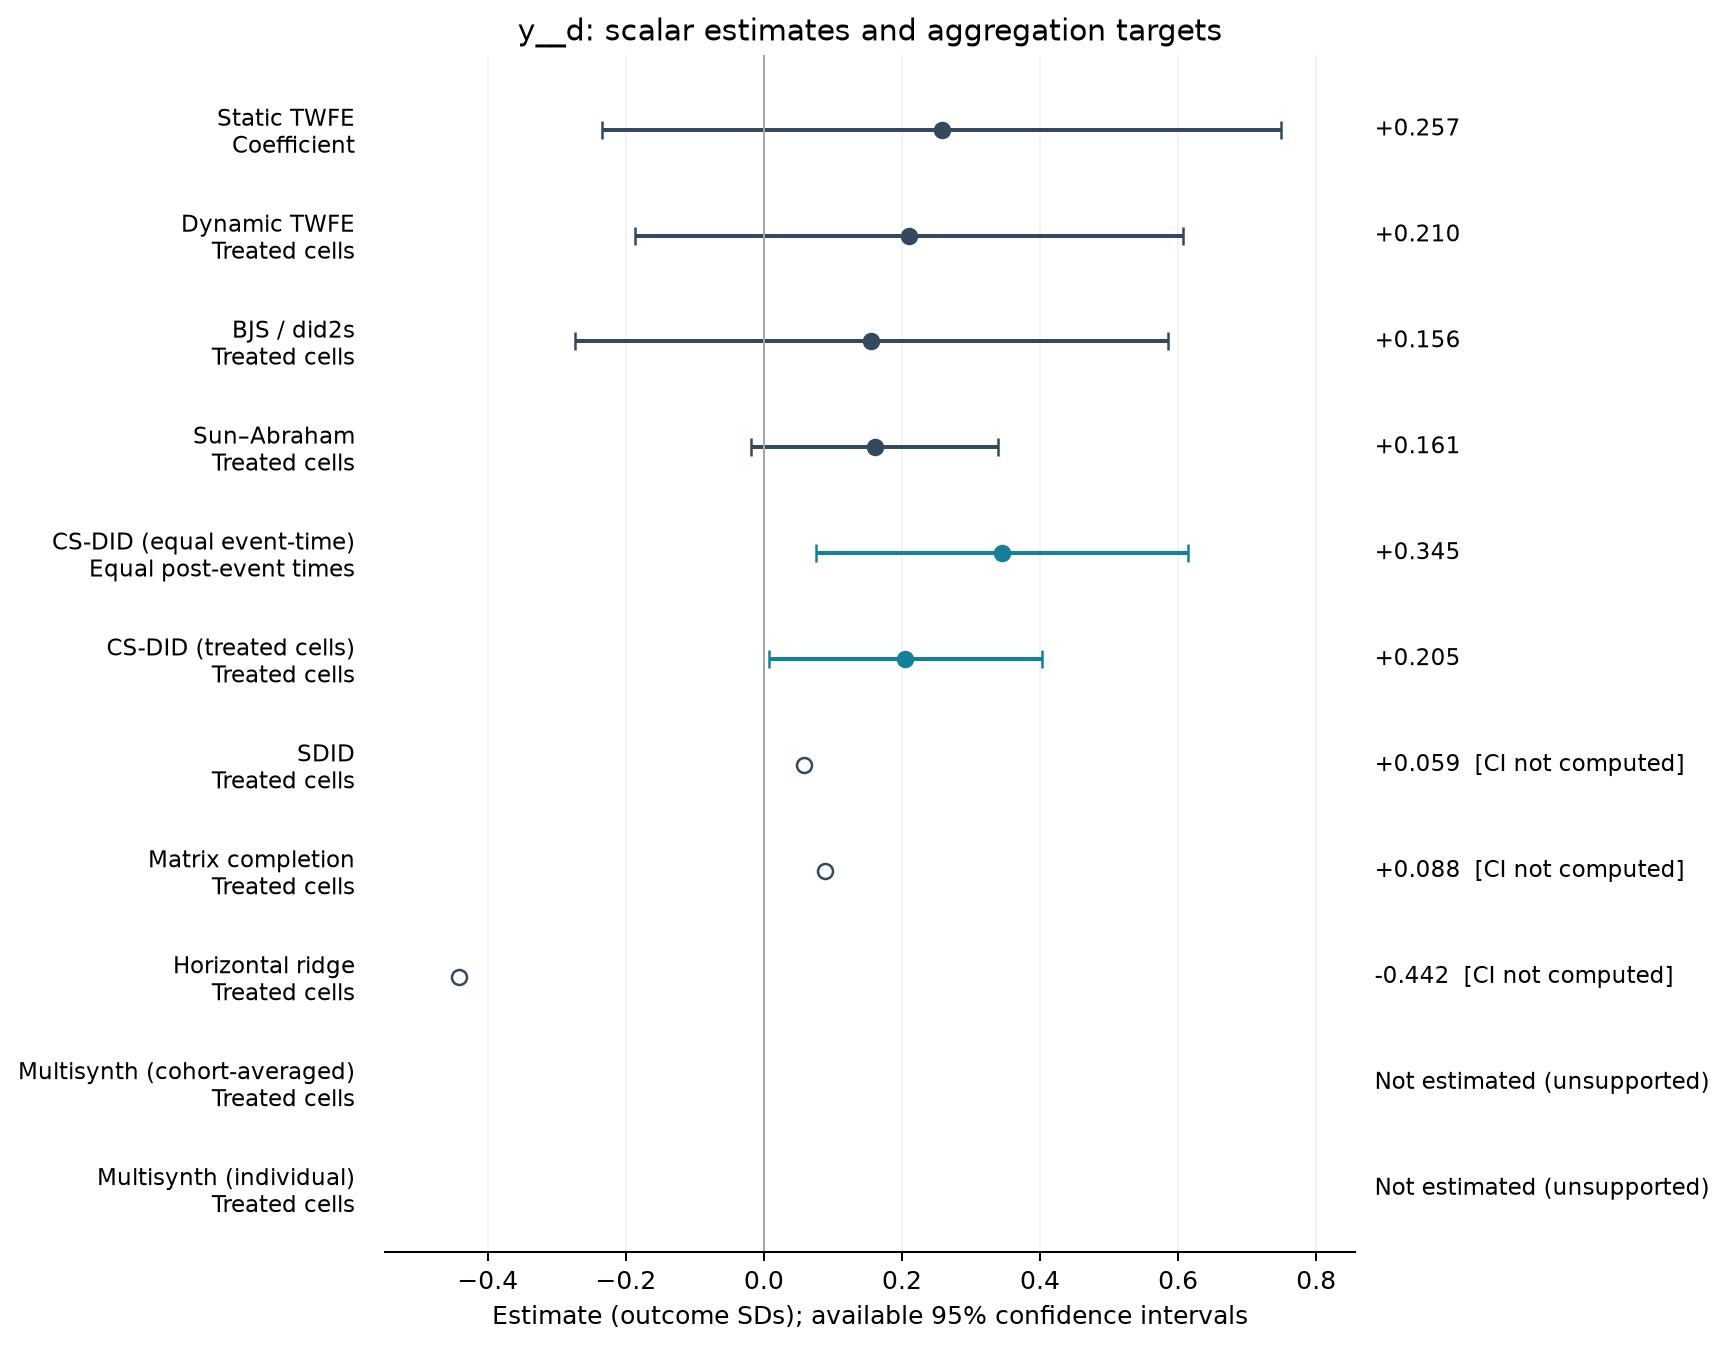
Estimate comparison
| Estimator | Estimate (SDs) | SE | 95% CI | Averaging |
|---|---|---|---|---|
| Static TWFE | 0.257 | 0.245 | [-0.234, 0.749] | Coefficient |
| Dynamic TWFE | 0.210 | 0.198 | [-0.187, 0.607] | Treated cells |
| BJS / did2s | 0.156 | 0.215 | [-0.274, 0.586] | Treated cells |
| Sun–Abraham | 0.161 | 0.089 | [-0.018, 0.340] | Treated cells |
| CS-DID (equal event-time) | 0.345 | 0.138 | [0.075, 0.615] | Equal post-event times |
| CS-DID (treated cells) | 0.205 | 0.101 | [0.007, 0.402] | Treated cells |
| SDID | 0.059 | — | — | Treated cells |
| Matrix completion | 0.088 | — | — | Treated cells |
| Horizontal ridge | -0.442 | — | — | Treated cells |
Event studies
Periods −10 to +10; pointwise 95% intervals where available.
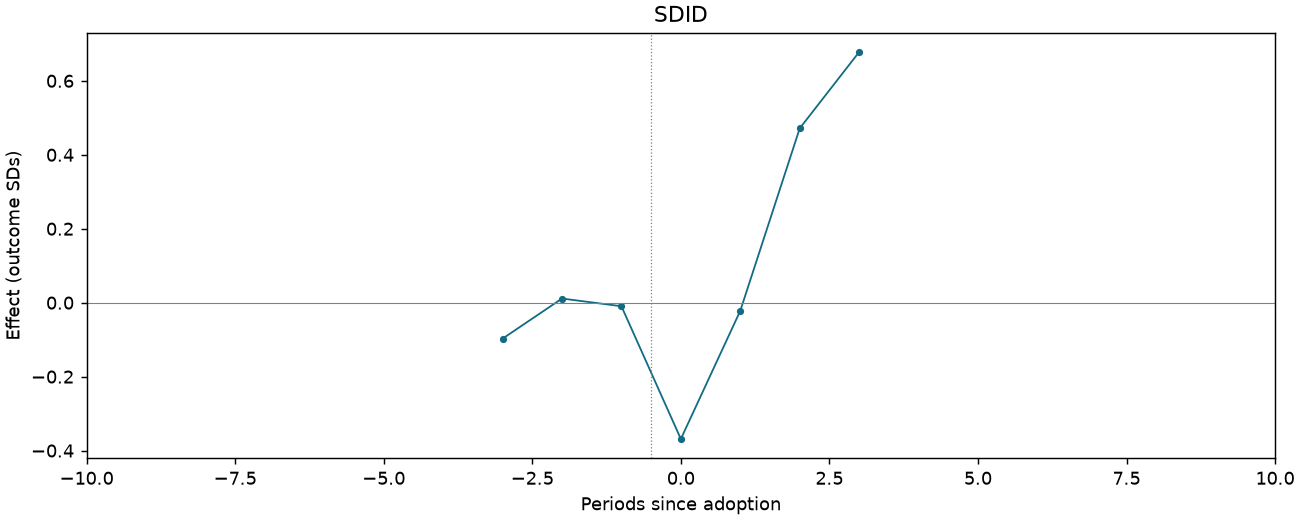
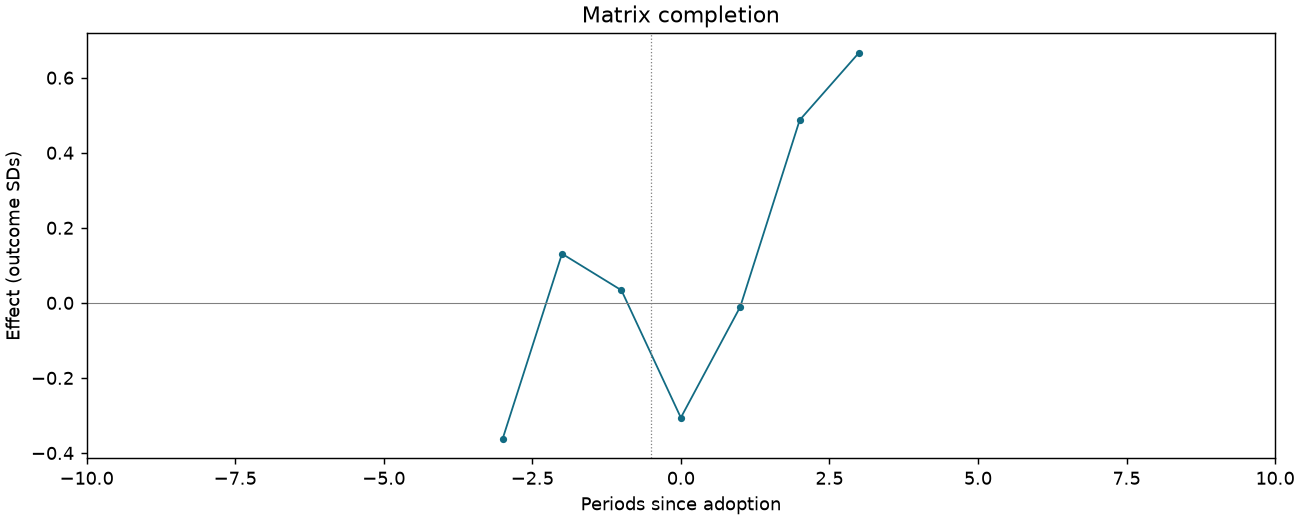
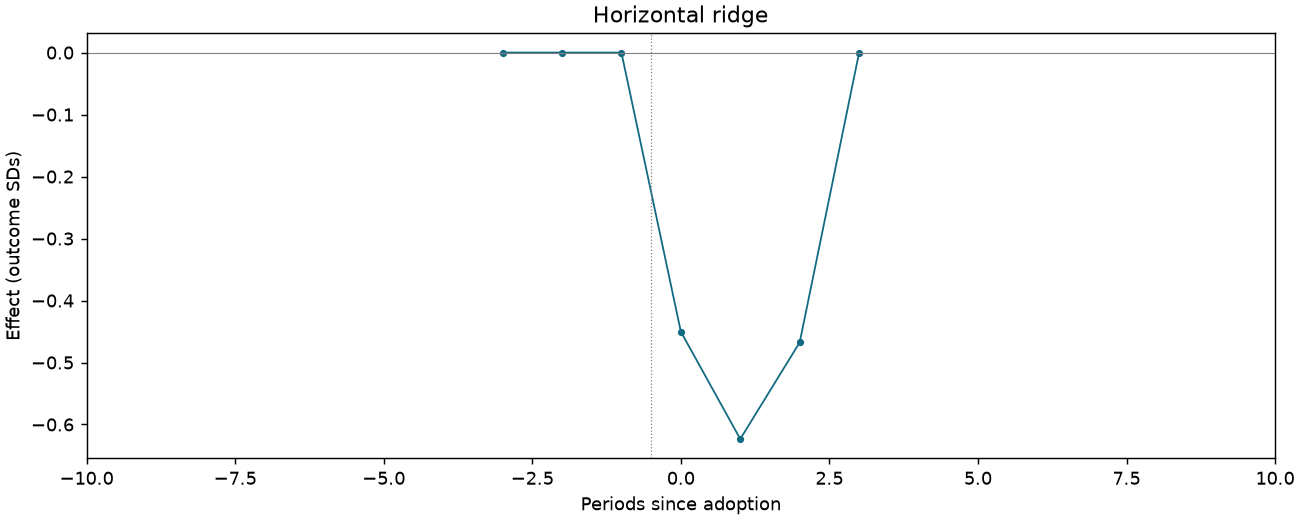
REXER-T6-PB-OTHER-C8-HOLD
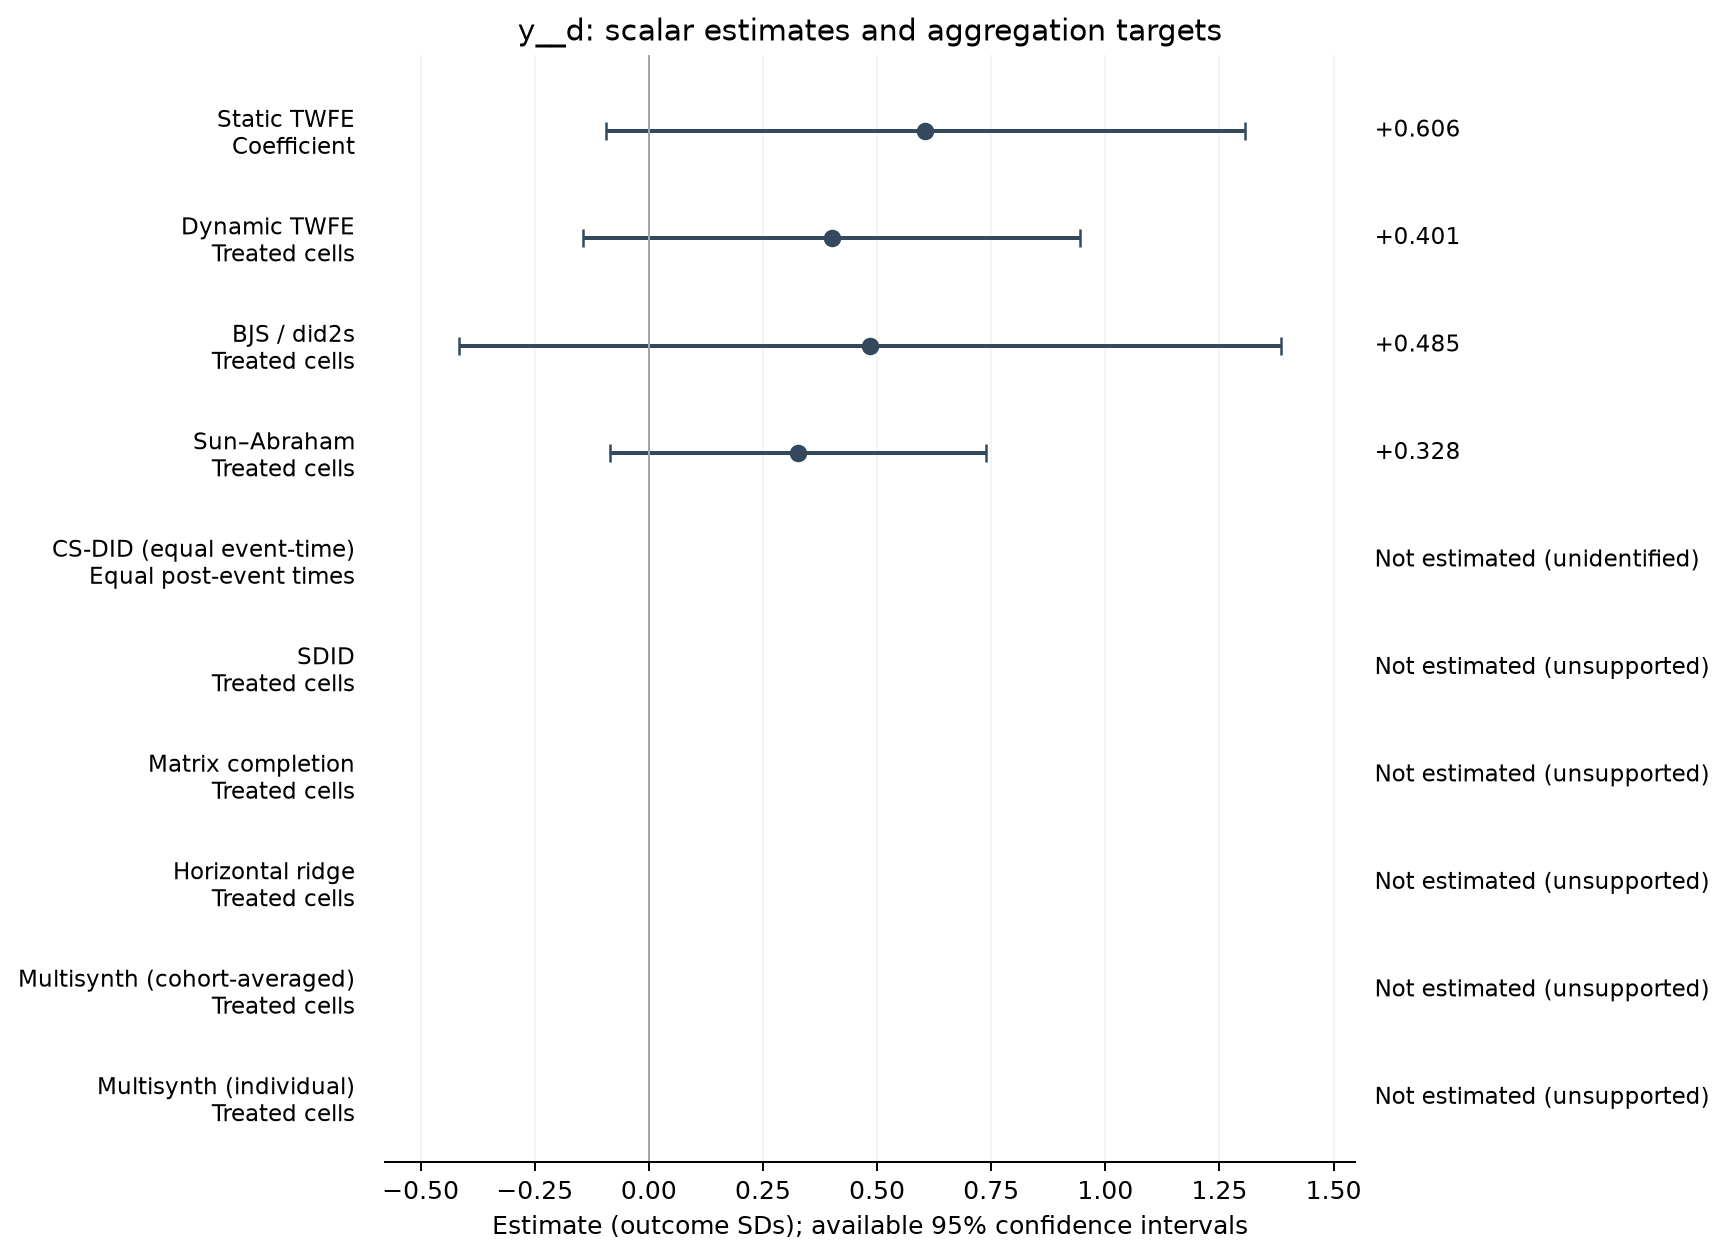
546 observations · 56 units · 56 clusters · 3 treated / 53 control units.
Estimate comparison
| Estimator | Estimate (SDs) | SE | 95% CI | Averaging |
|---|---|---|---|---|
| Static TWFE | 0.606 | 0.349 | [-0.095, 1.306] | Coefficient |
| Dynamic TWFE | 0.401 | 0.272 | [-0.144, 0.945] | Treated cells |
| BJS / did2s | 0.485 | 0.449 | [-0.416, 1.385] | Treated cells |
| Sun–Abraham | 0.328 | 0.205 | [-0.084, 0.739] | Treated cells |
Event studies
Periods −10 to +10; pointwise 95% intervals where available.
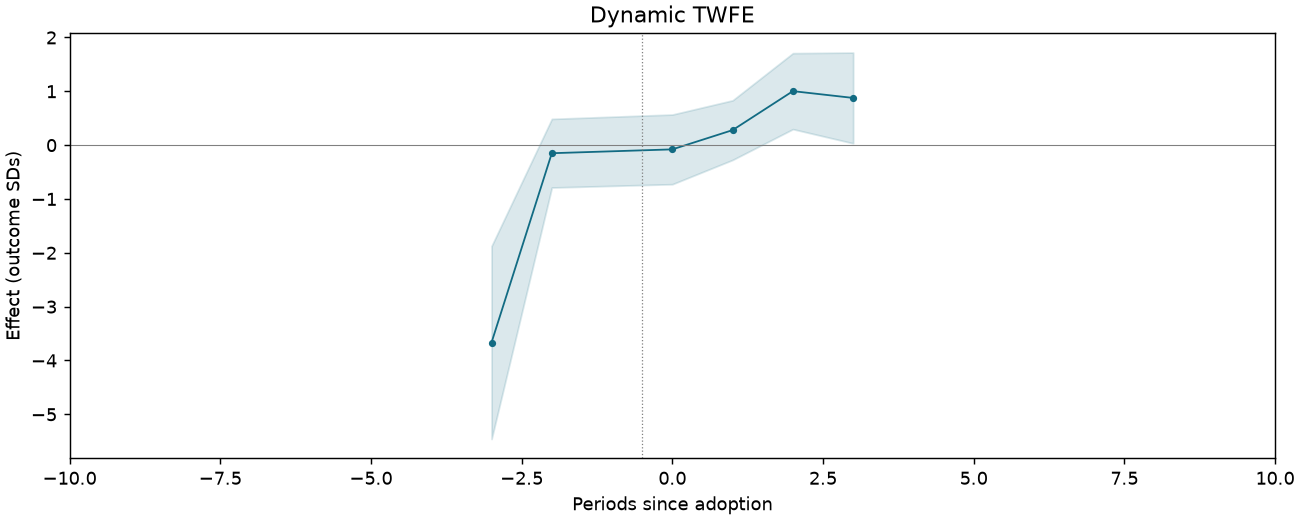
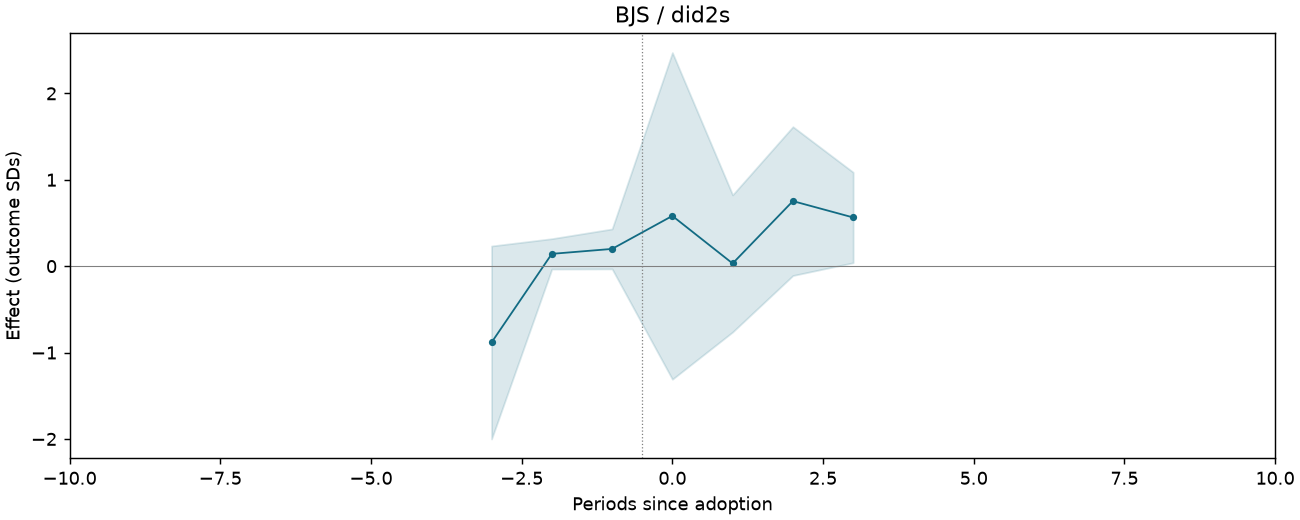
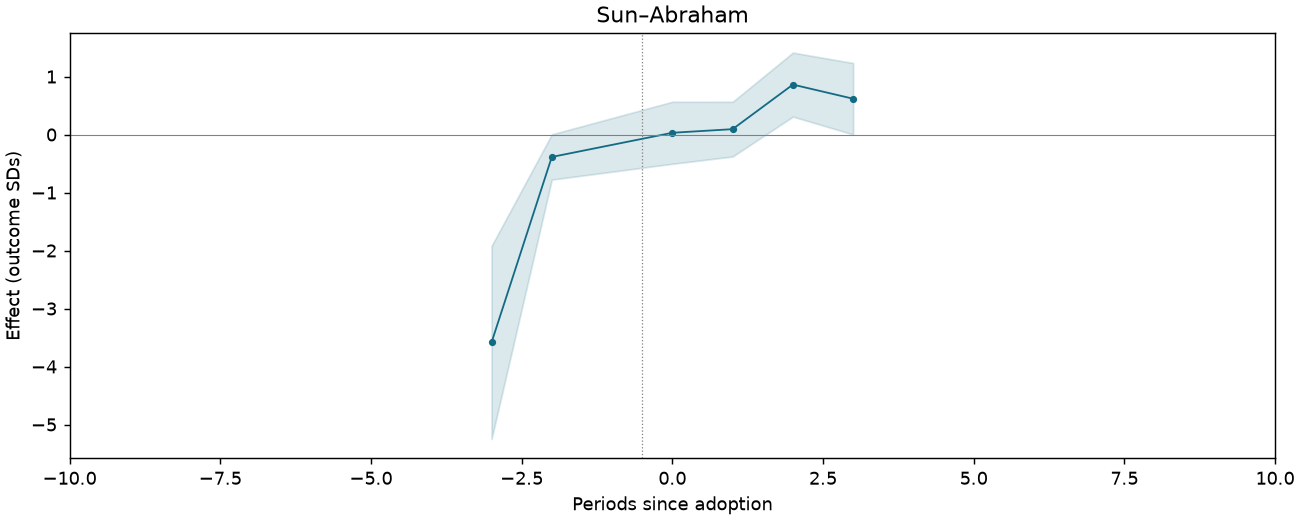
NNPC revenue (millions of 2016 US dollars)
The archive supplies frozen estimates but not this specification’s input sample or required outcome/controls.
Royalty revenue (millions of 2016 US dollars)
The archive supplies frozen estimates but not this specification’s input sample or required outcome/controls.
Government revenue: NNPC plus royalty revenue (millions of 2016 US dollars)
The archive supplies frozen estimates but not this specification’s input sample or required outcome/controls.
Operator revenue (millions of 2016 US dollars)
The archive supplies frozen estimates but not this specification’s input sample or required outcome/controls.
Total oil-field revenue (millions of 2016 US dollars)
The archive supplies frozen estimates but not this specification’s input sample or required outcome/controls.