Landmines and Spatial Development — expanded estimators
Archive index · Regression tests · Results & settings (JSON) · Methods & code
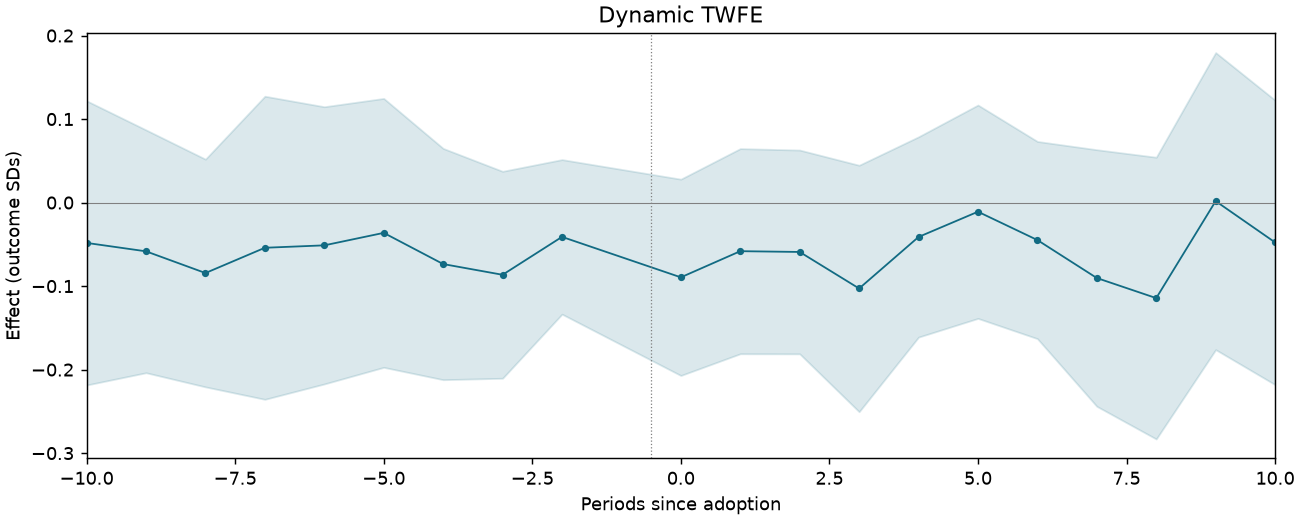
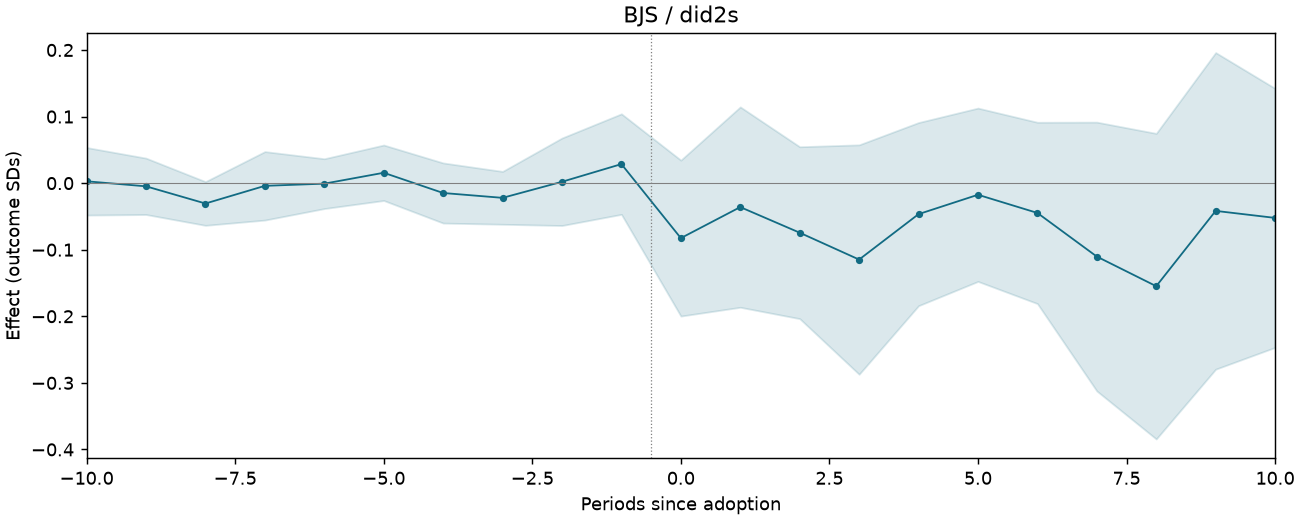
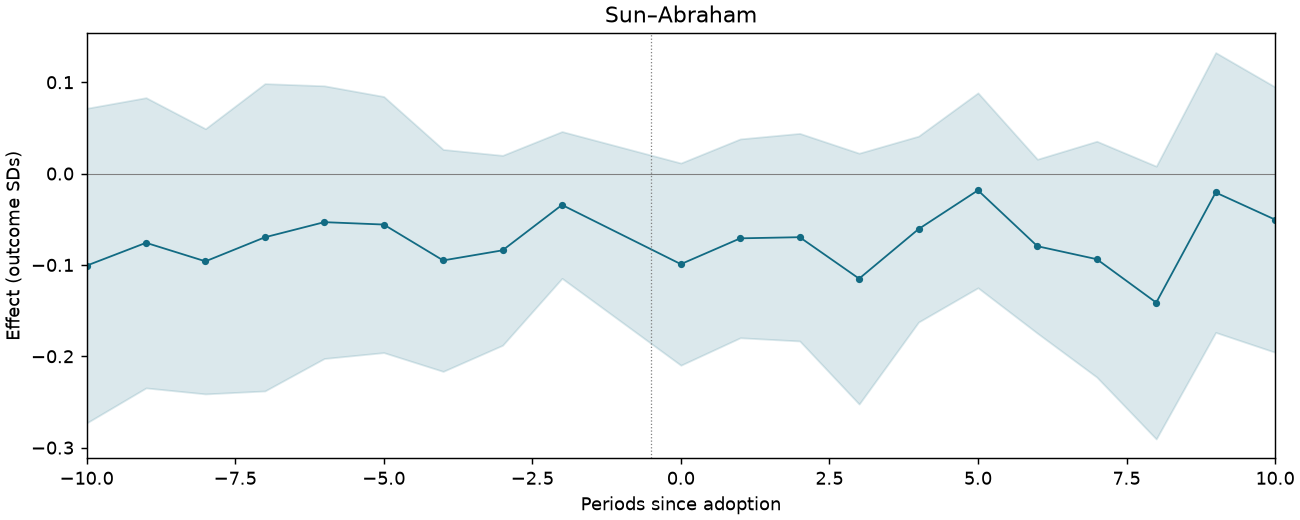
11 specifications. Effects are in outcome standard deviations; intervals are 95%.
Treatment adoption

S21-P003: seeded sample of 100 of 1,184 eligible units. Purple untreated; yellow treated; white unobserved.
LANDMINES-F10B-WB-INITIAL
The included native sample lacks act_proj_d (World Bank project outcome) required by this figure.
LANDMINES-F10C-WB-FULL
The included native sample lacks act_proj_d (World Bank project outcome) required by this figure.
LANDMINES-F8A-INITIAL
25,734 observations · 1,184 units · 140 clusters · 886 treated / 298 control units.
Estimate comparison
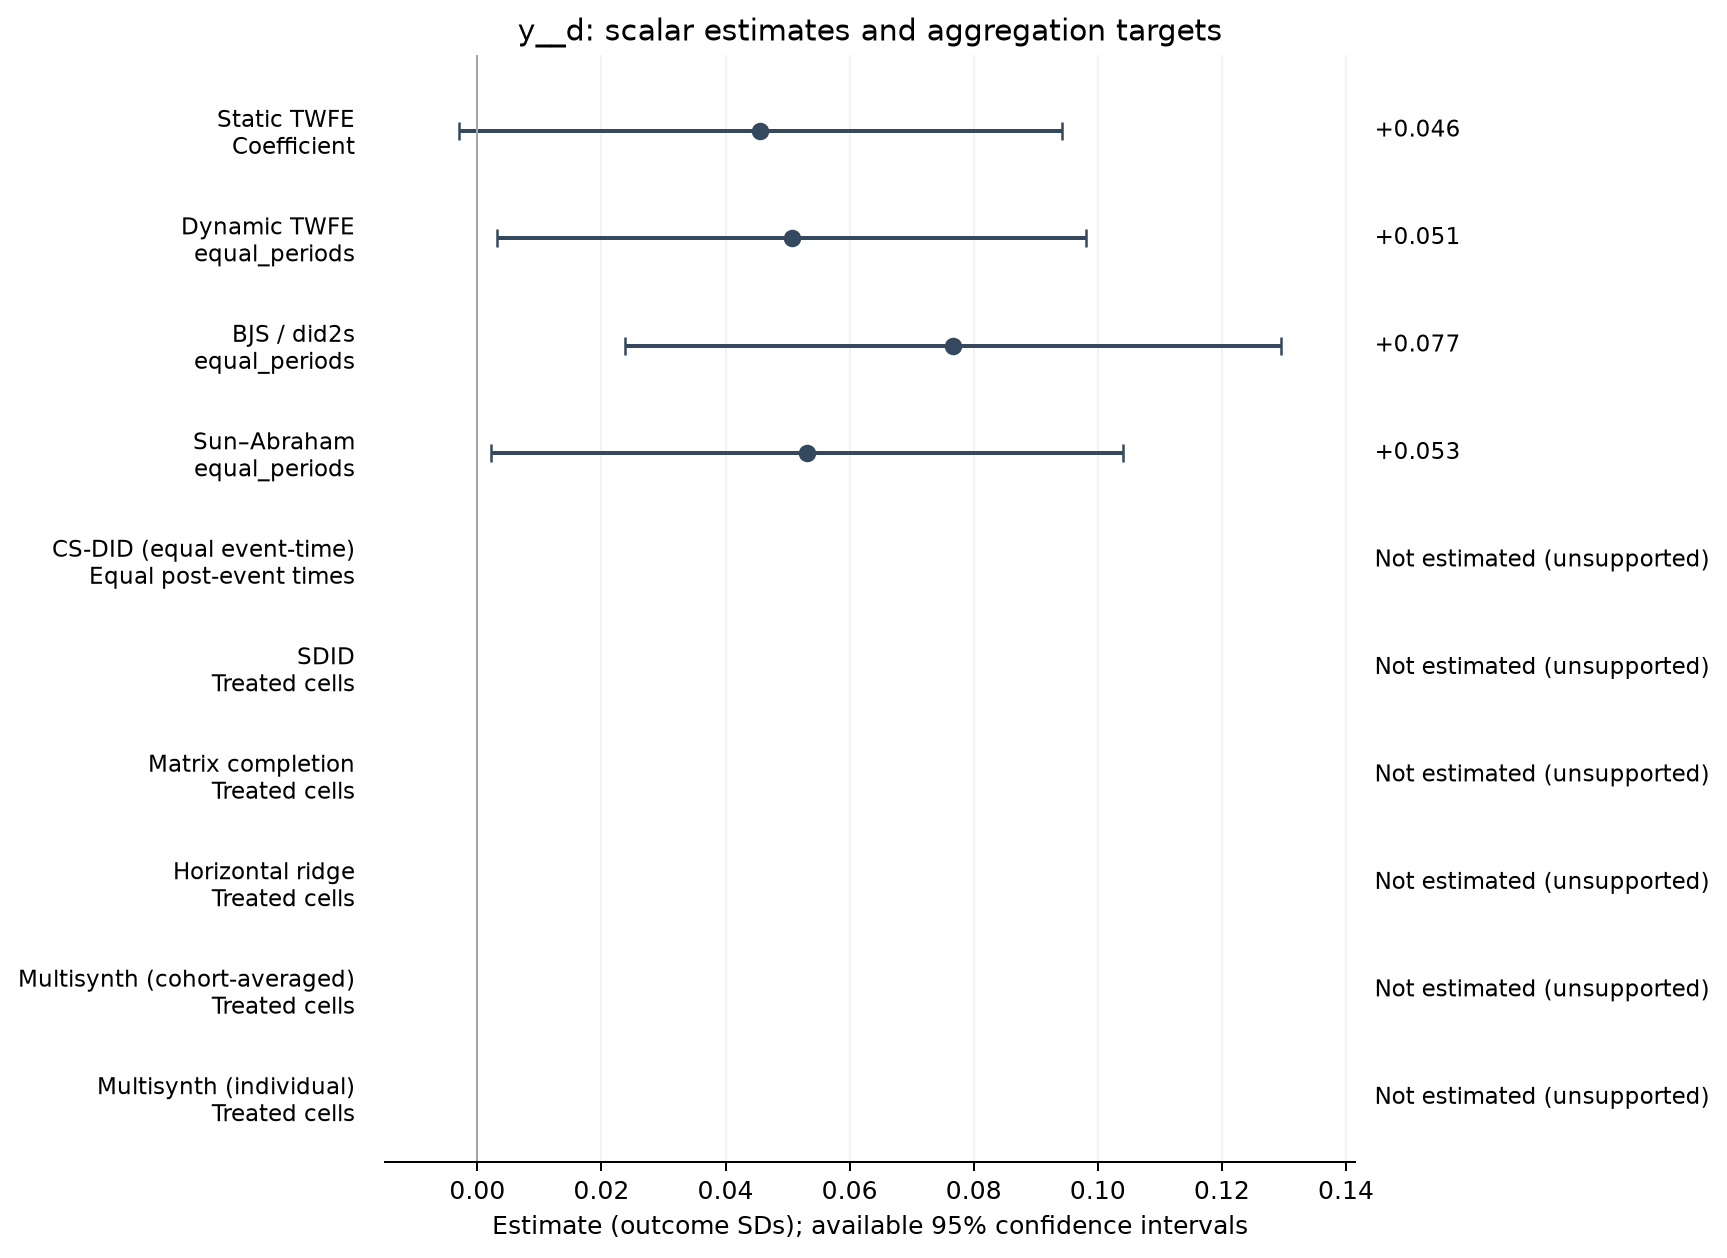
| Estimator | Estimate (SDs) | SE | 95% CI | Averaging |
|---|---|---|---|---|
| Static TWFE | 0.046 | 0.025 | [-0.003, 0.094] | Coefficient |
| Dynamic TWFE | 0.051 | 0.024 | [0.003, 0.098] | equal_periods |
| BJS / did2s | 0.077 | 0.027 | [0.024, 0.130] | equal_periods |
| Sun–Abraham | 0.053 | 0.026 | [0.002, 0.104] | equal_periods |
Event studies
Periods −10 to +10; pointwise 95% intervals where available.
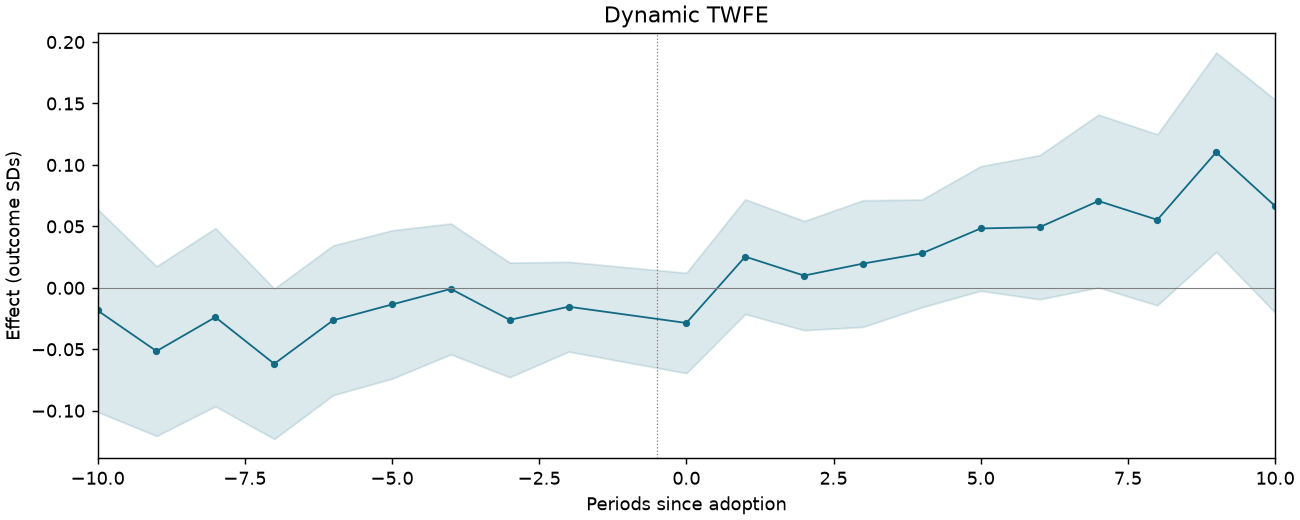
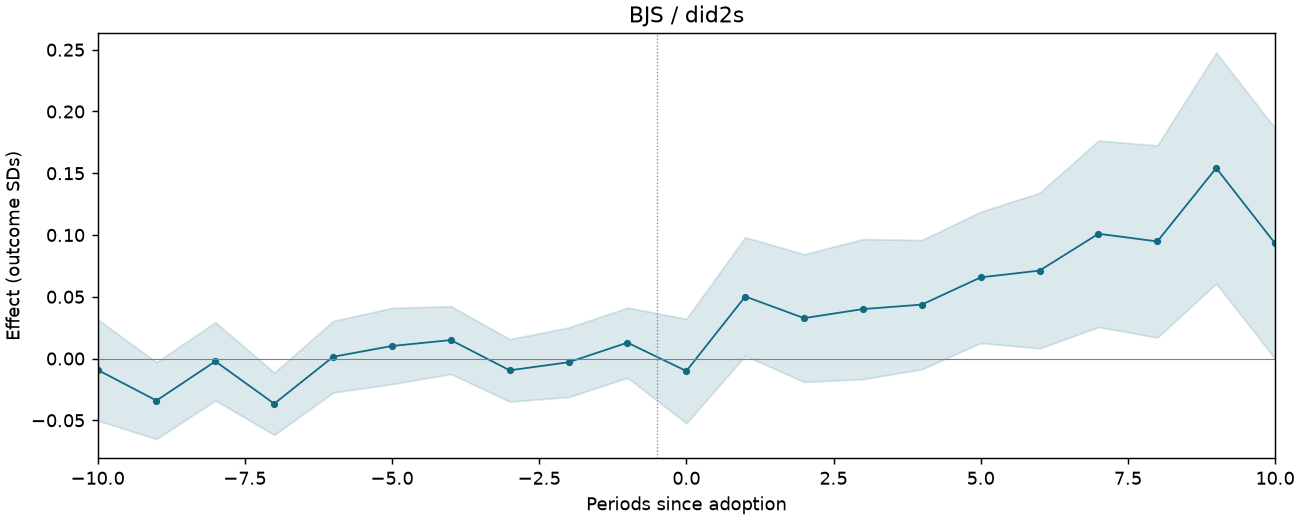
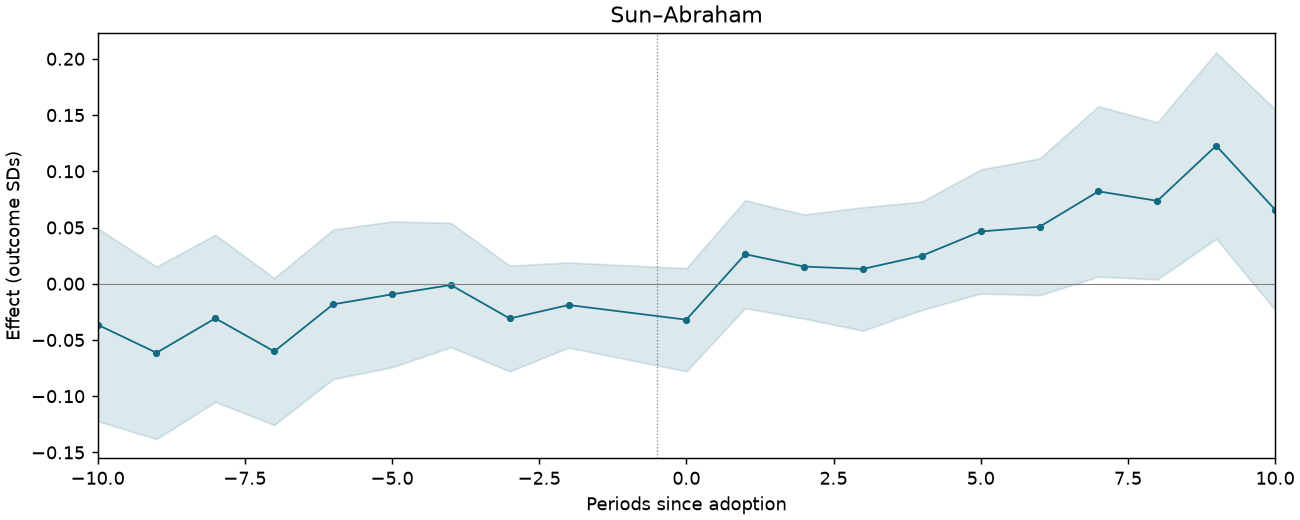
LANDMINES-F8B-FULL
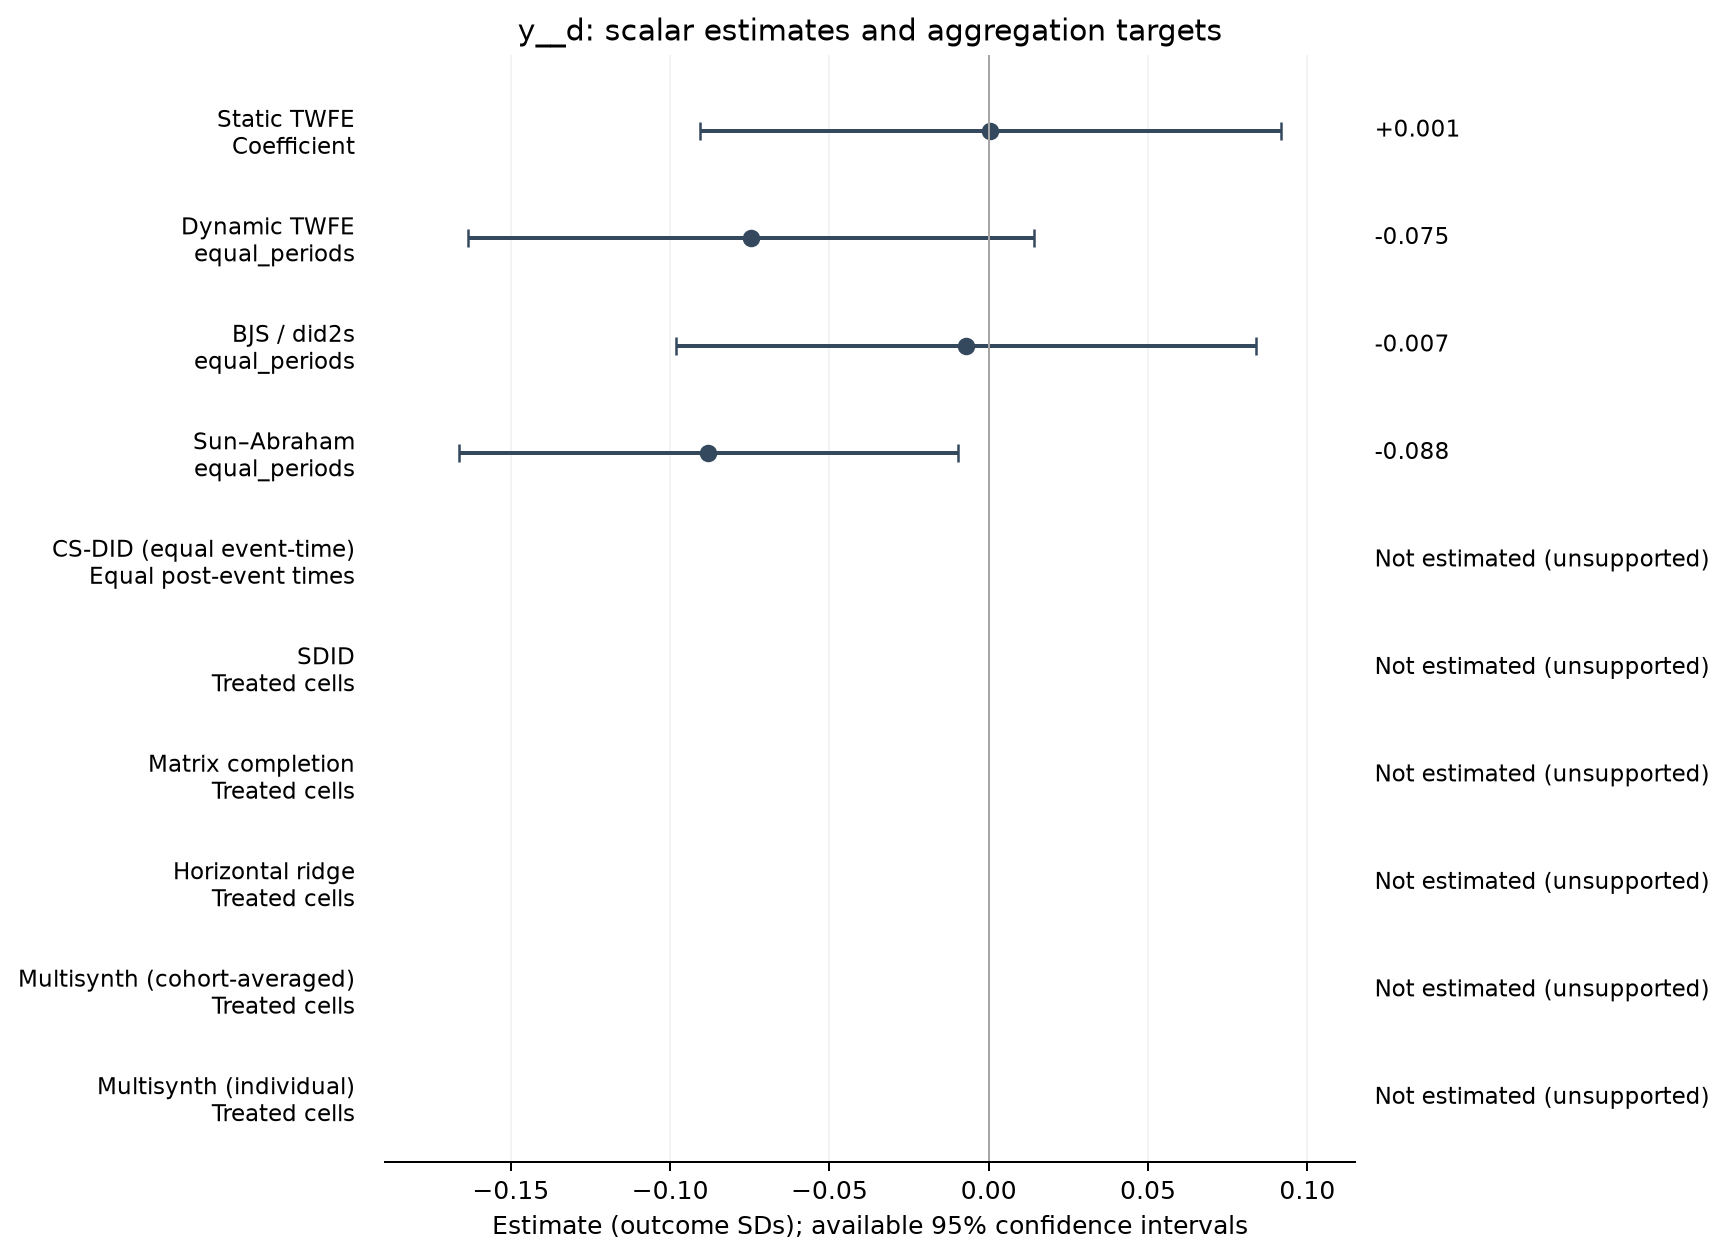
12,279 observations · 491 units · 115 clusters · 193 treated / 298 control units.
Estimate comparison
| Estimator | Estimate (SDs) | SE | 95% CI | Averaging |
|---|---|---|---|---|
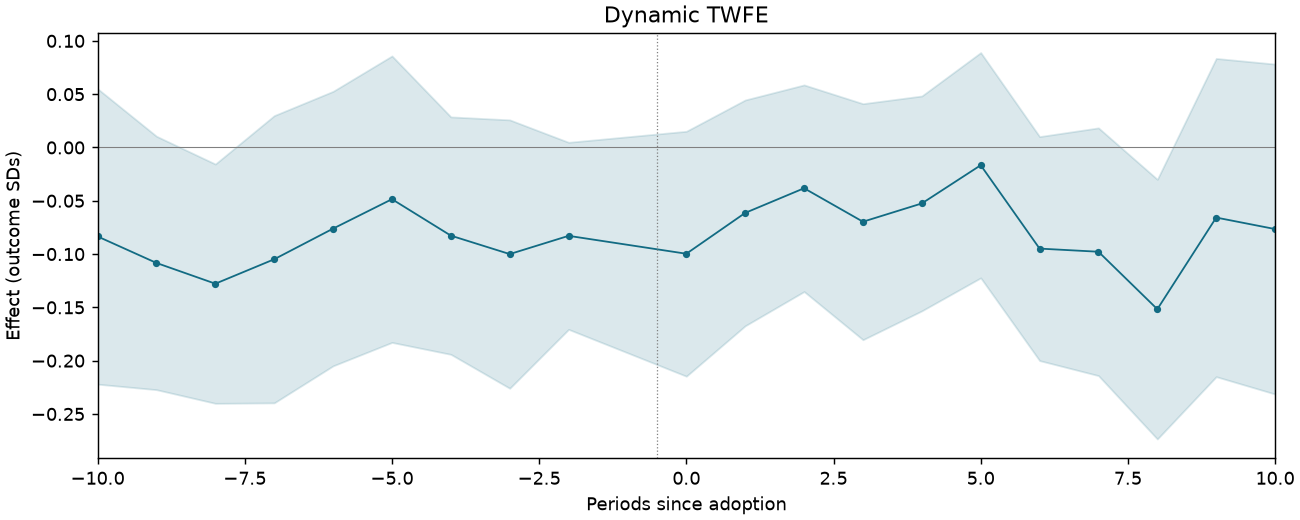
| Static TWFE | 0.001 | 0.046 | [-0.091, 0.092] | Coefficient |
| Dynamic TWFE | -0.075 | 0.045 | [-0.163, 0.014] | equal_periods |
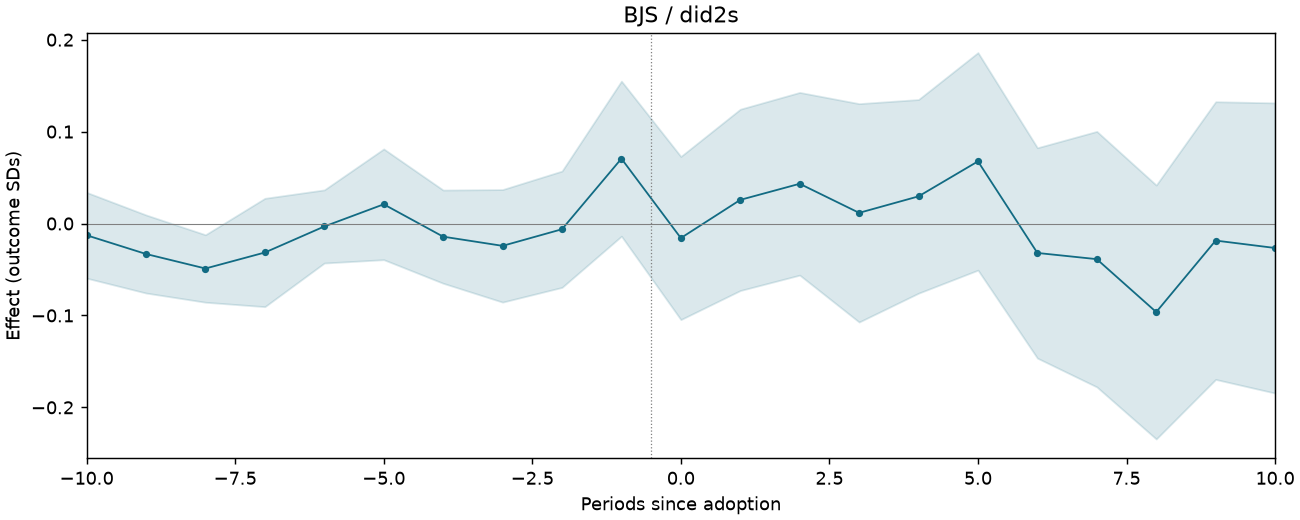
| BJS / did2s | -0.007 | 0.046 | [-0.098, 0.084] | equal_periods |
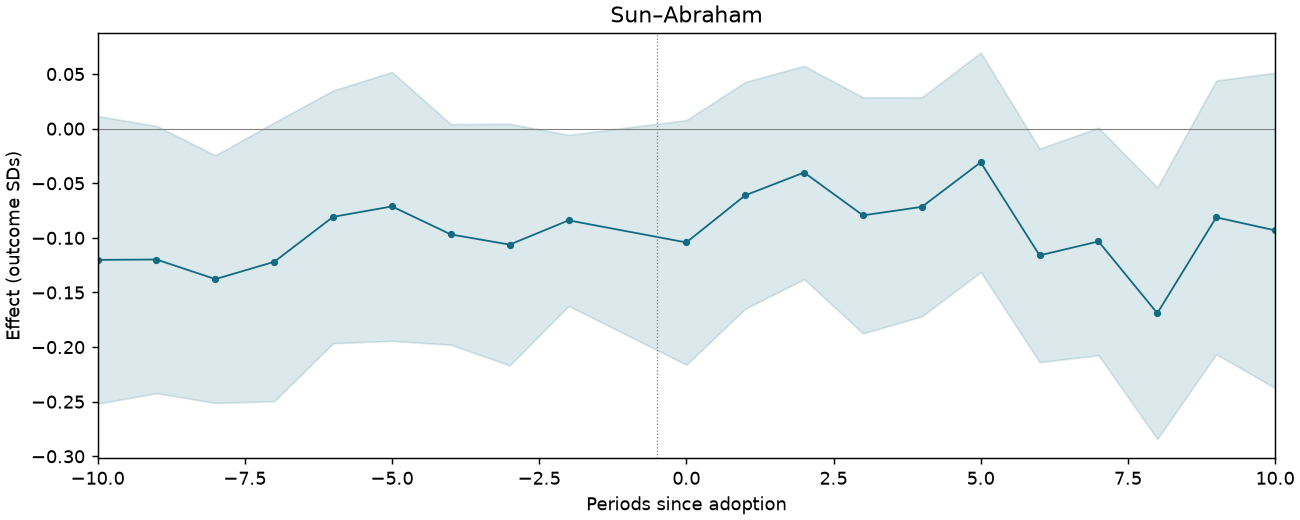
| Sun–Abraham | -0.088 | 0.040 | [-0.166, -0.010] | equal_periods |
Event studies
Periods −10 to +10; pointwise 95% intervals where available.
LANDMINES-F9B-CANCELLATION
The included native sample lacks firstyear_sha_st (cancellation timing) required by this figure.
LANDMINES-T2-C1-INITIAL
30,784 observations · 1,184 units · 140 clusters · 886 treated / 298 control units.
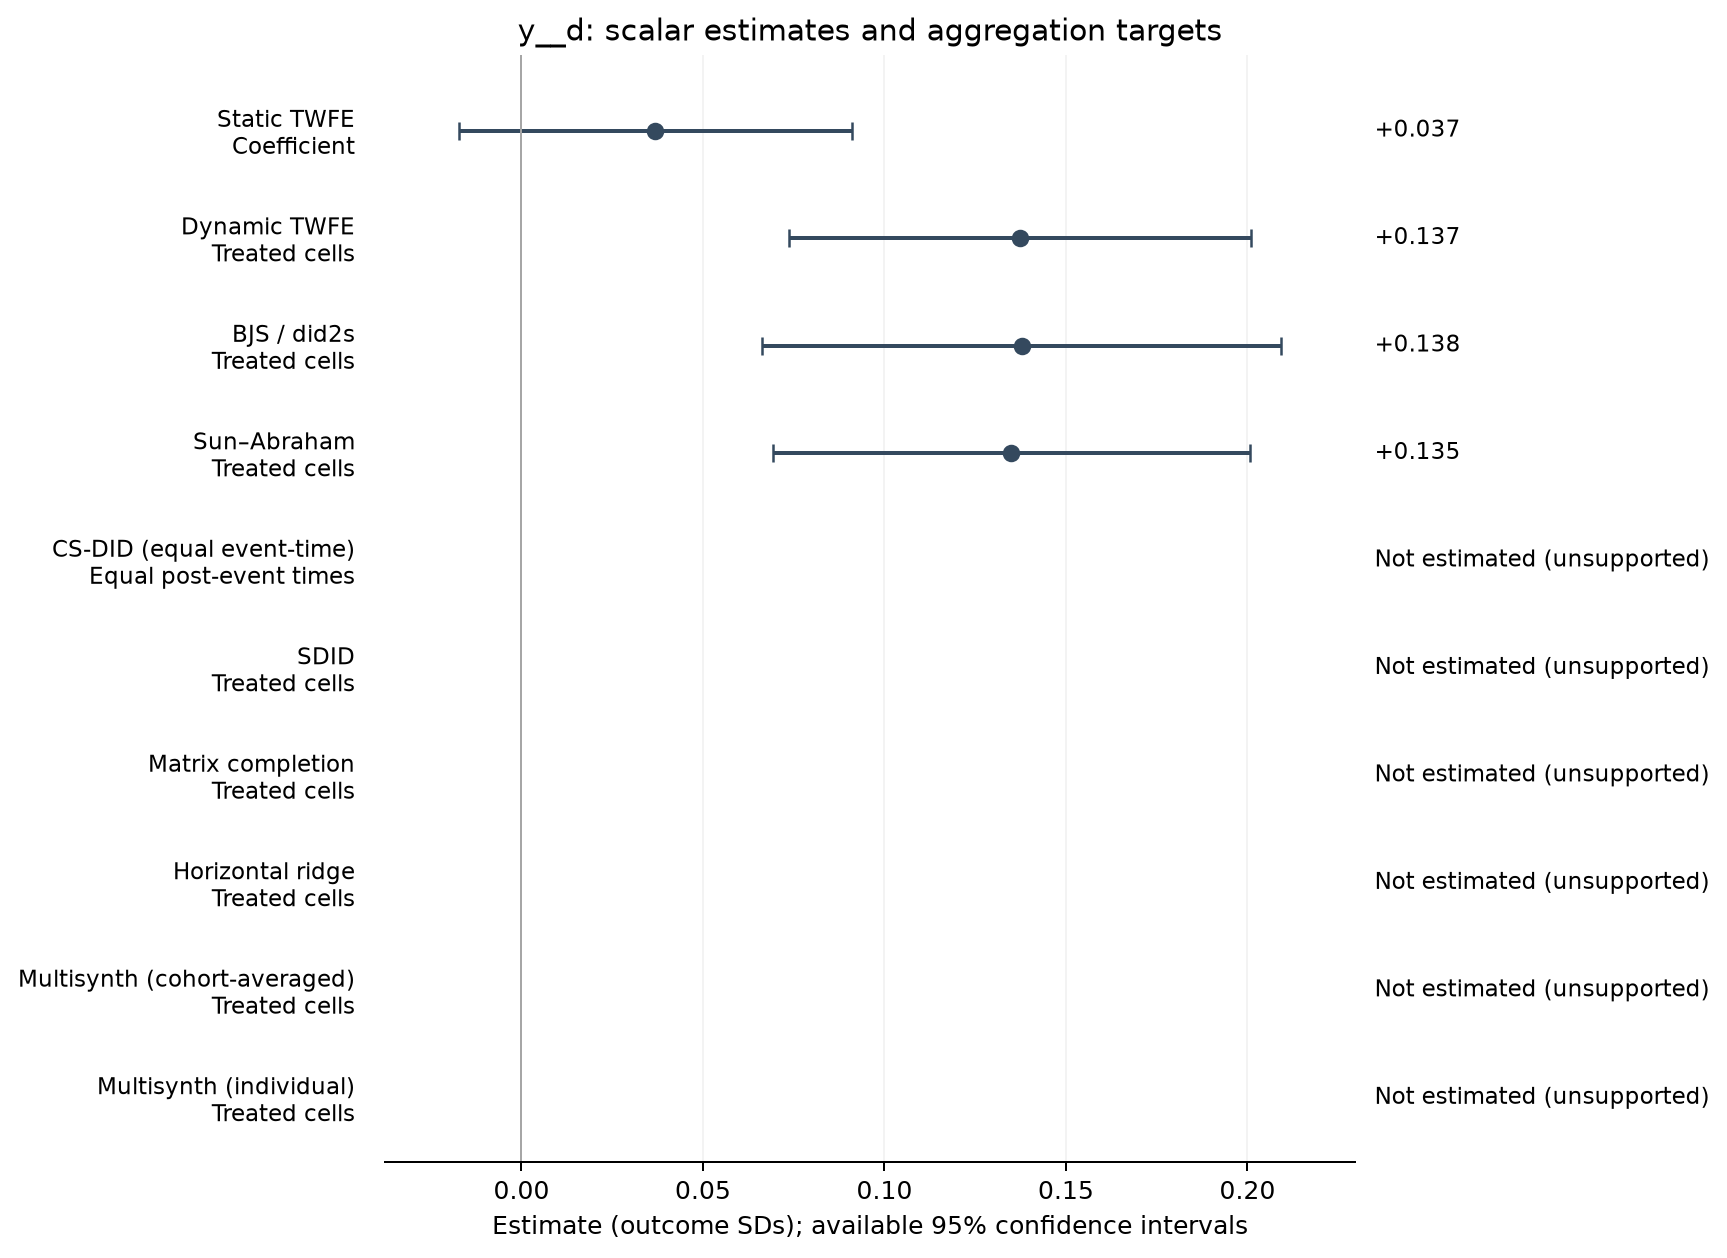
Estimate comparison
| Estimator | Estimate (SDs) | SE | 95% CI | Averaging |
|---|---|---|---|---|
| Static TWFE | 0.037 | 0.027 | [-0.017, 0.091] | Coefficient |
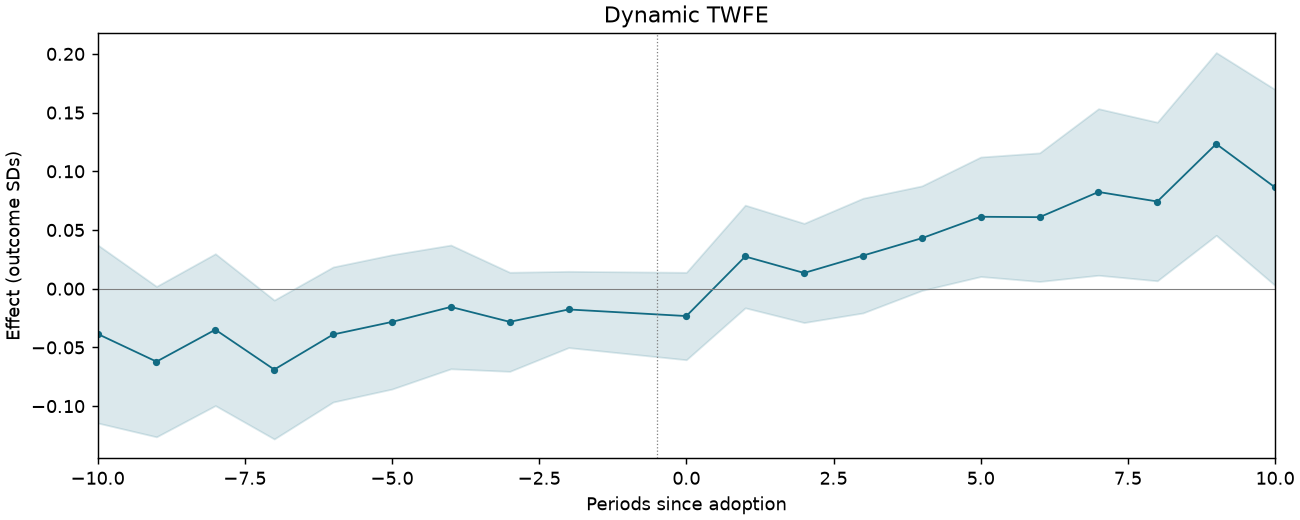
| Dynamic TWFE | 0.137 | 0.032 | [0.074, 0.201] | Treated cells |
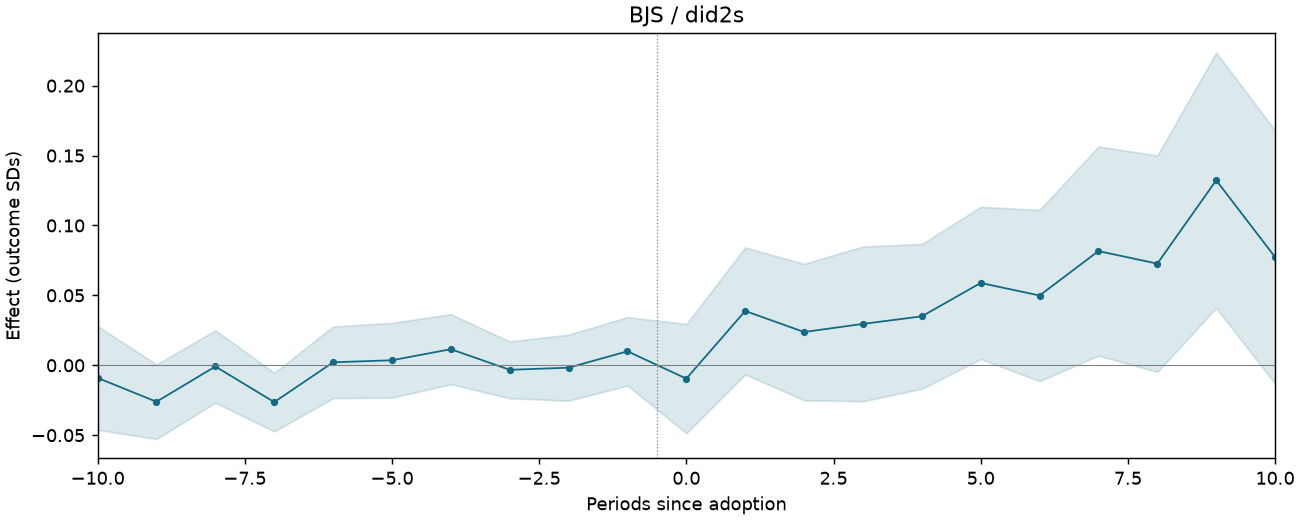
| BJS / did2s | 0.138 | 0.036 | [0.066, 0.209] | Treated cells |
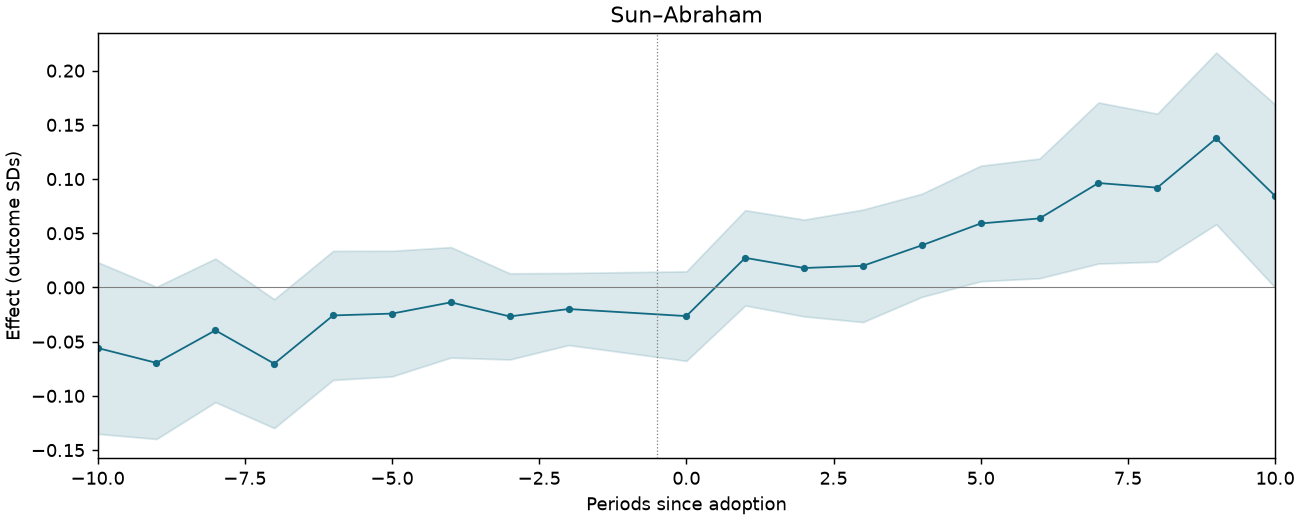
| Sun–Abraham | 0.135 | 0.033 | [0.069, 0.201] | Treated cells |
Event studies
Periods −10 to +10; pointwise 95% intervals where available.
LANDMINES-T2-C2-FULL-EXCL-PARTIAL
12,766 observations · 491 units · 115 clusters · 193 treated / 298 control units.
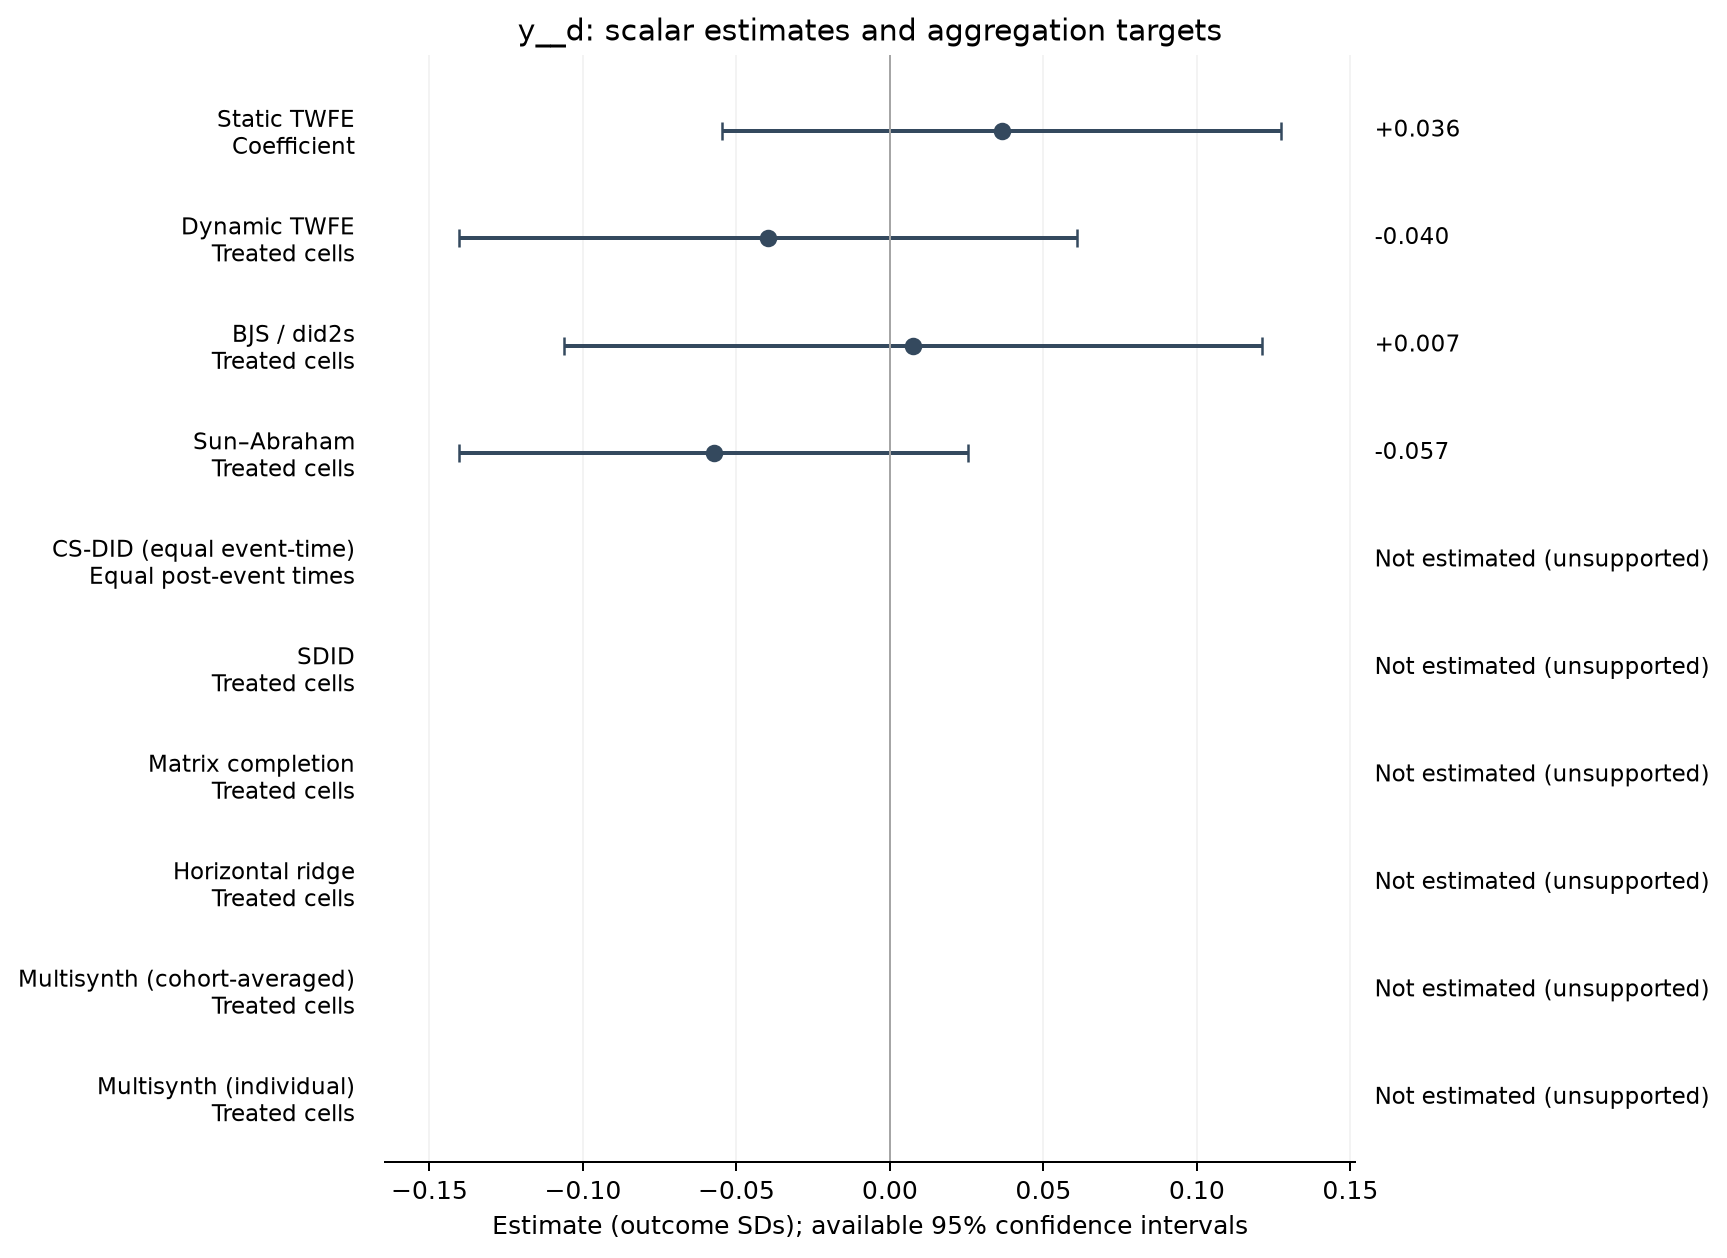
Estimate comparison
| Estimator | Estimate (SDs) | SE | 95% CI | Averaging |
|---|---|---|---|---|
| Static TWFE | 0.036 | 0.046 | [-0.055, 0.127] | Coefficient |
| Dynamic TWFE | -0.040 | 0.051 | [-0.140, 0.061] | Treated cells |
| BJS / did2s | 0.007 | 0.057 | [-0.106, 0.121] | Treated cells |
| Sun–Abraham | -0.057 | 0.042 | [-0.140, 0.025] | Treated cells |
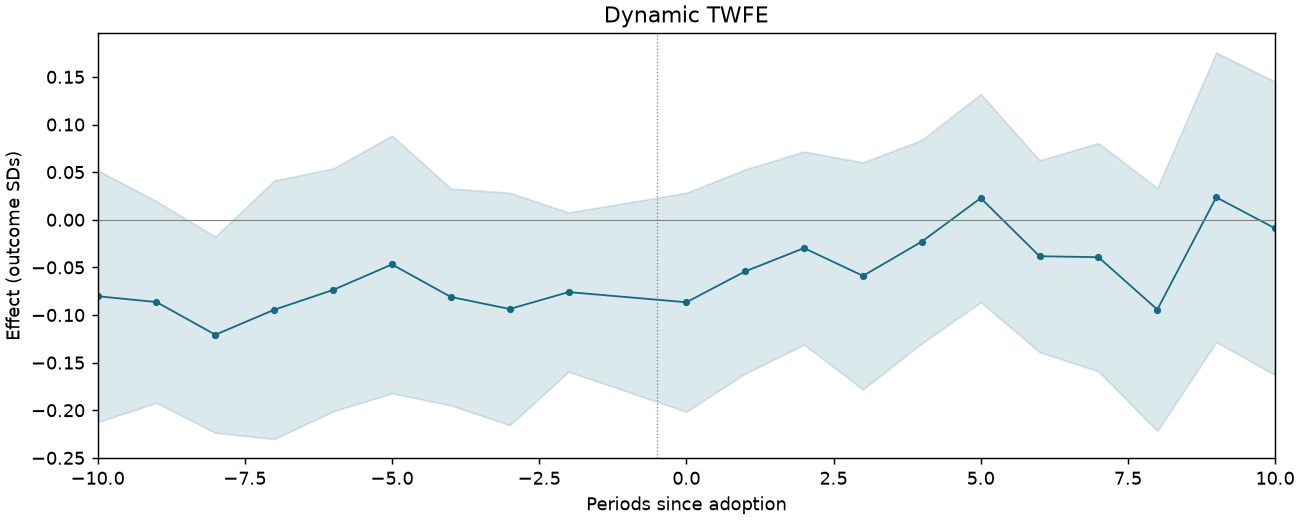
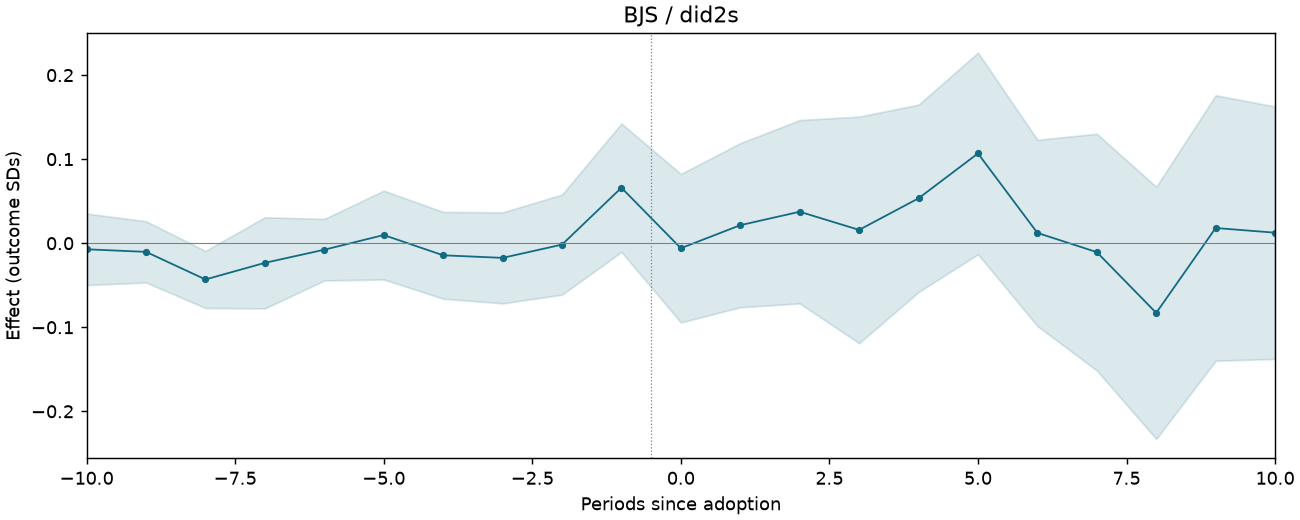
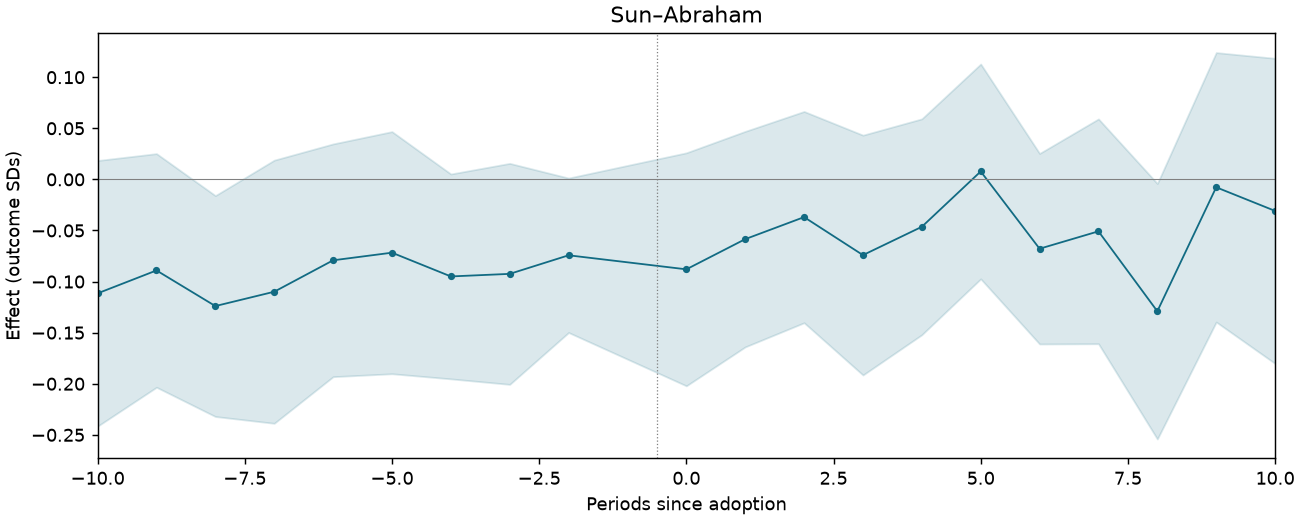
Event studies
Periods −10 to +10; pointwise 95% intervals where available.
LANDMINES-T2-C3-FULL-DROP-LIMITED
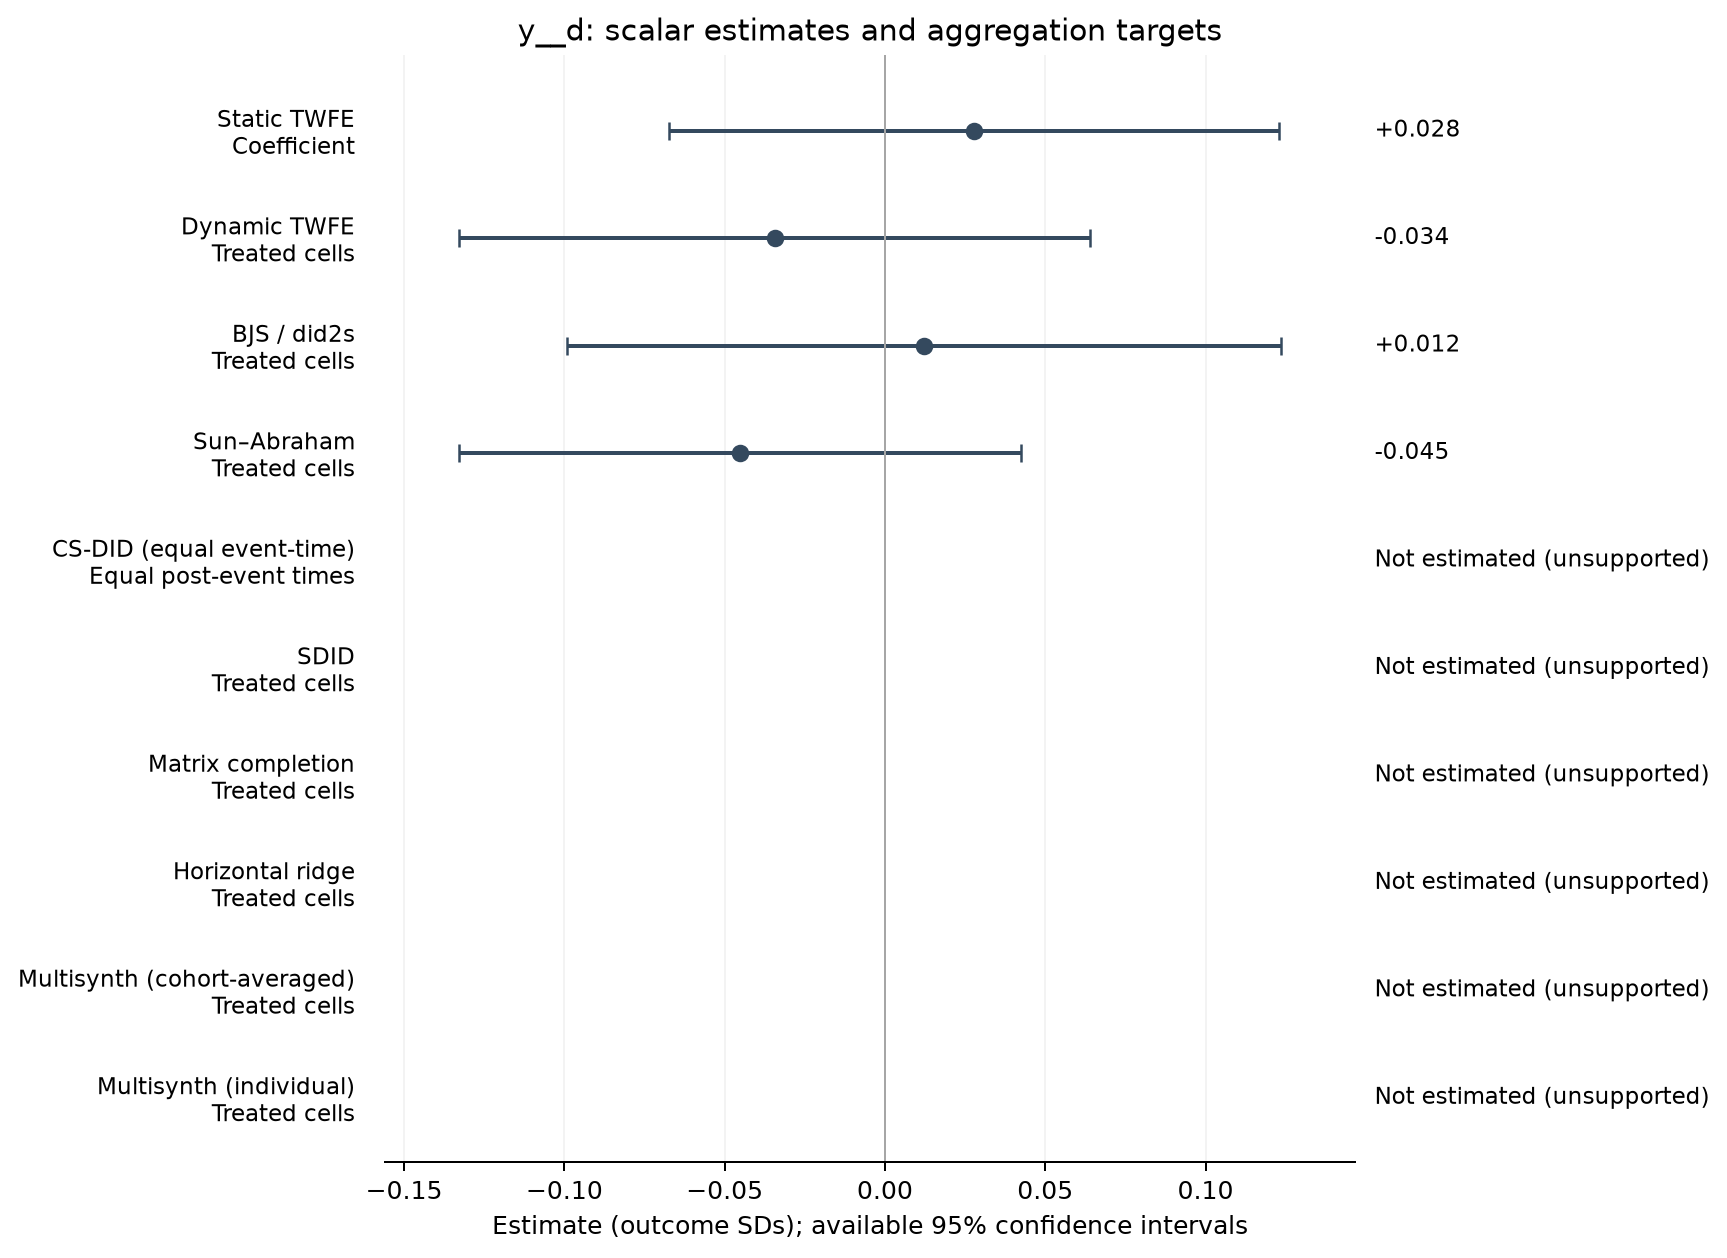
13,780 observations · 530 units · 117 clusters · 204 treated / 326 control units.
Estimate comparison
| Estimator | Estimate (SDs) | SE | 95% CI | Averaging |
|---|---|---|---|---|
| Static TWFE | 0.028 | 0.048 | [-0.067, 0.123] | Coefficient |
| Dynamic TWFE | -0.034 | 0.050 | [-0.133, 0.064] | Treated cells |
| BJS / did2s | 0.012 | 0.056 | [-0.099, 0.124] | Treated cells |
| Sun–Abraham | -0.045 | 0.044 | [-0.133, 0.043] | Treated cells |
Event studies
Periods −10 to +10; pointwise 95% intervals where available.
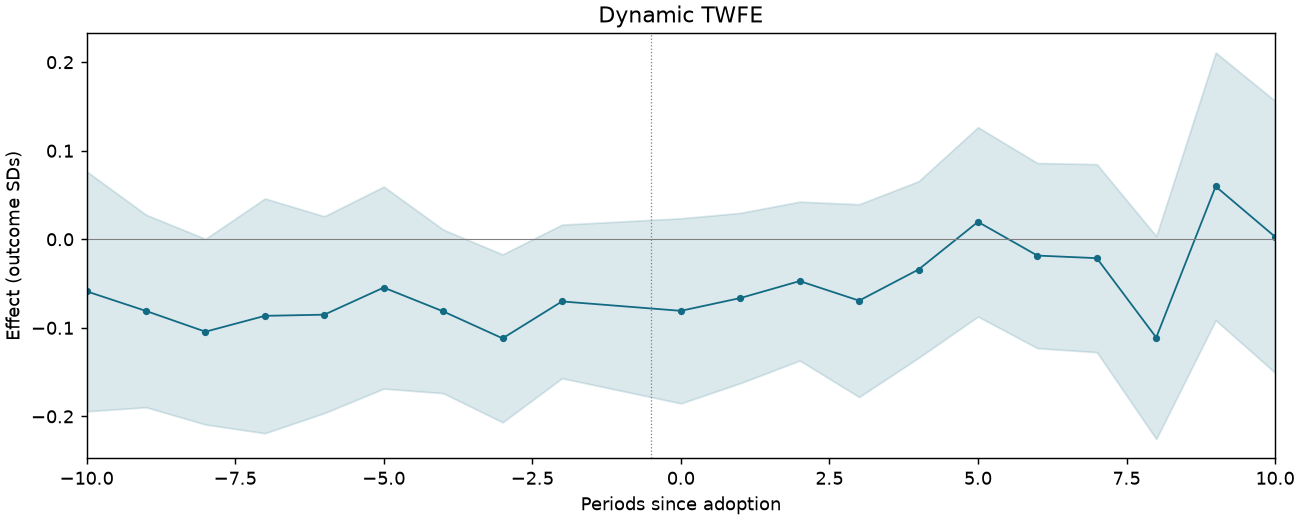
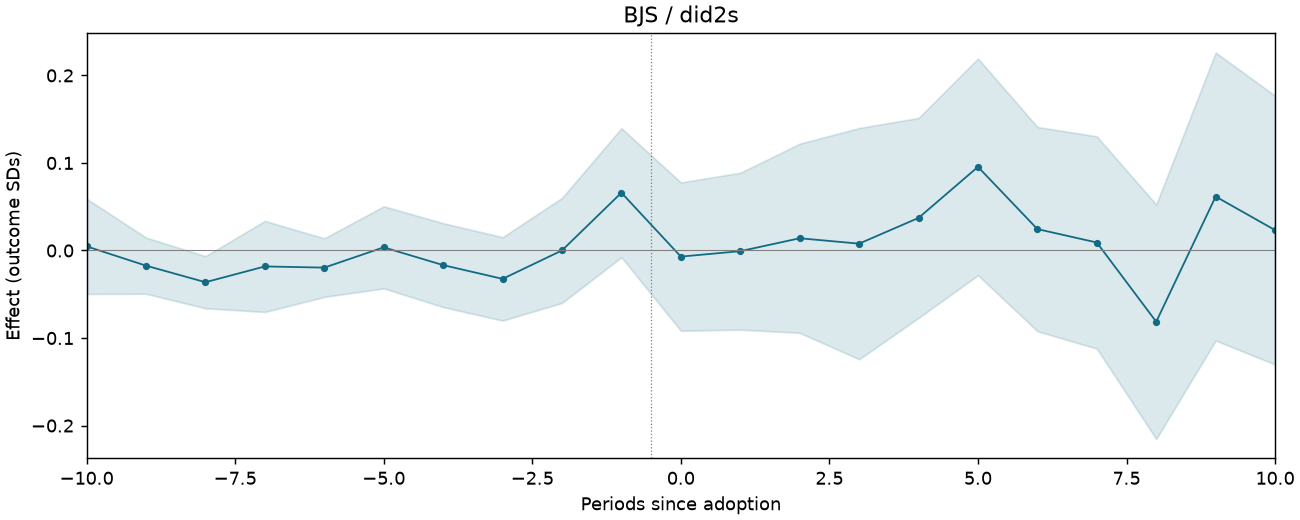
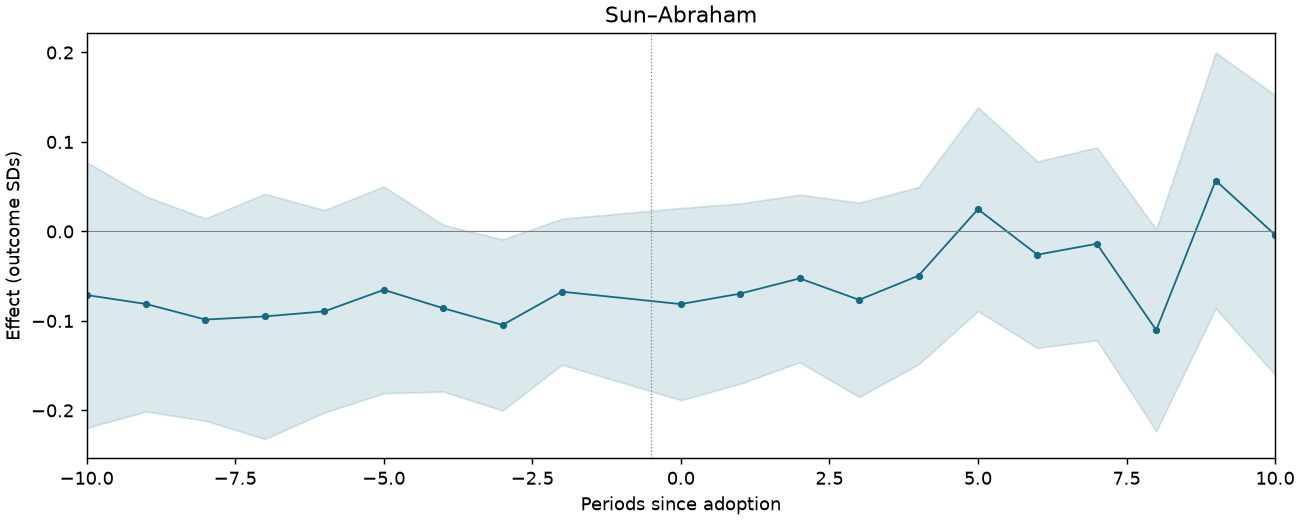
LANDMINES-T2-C4-FULL-DMSP-2013
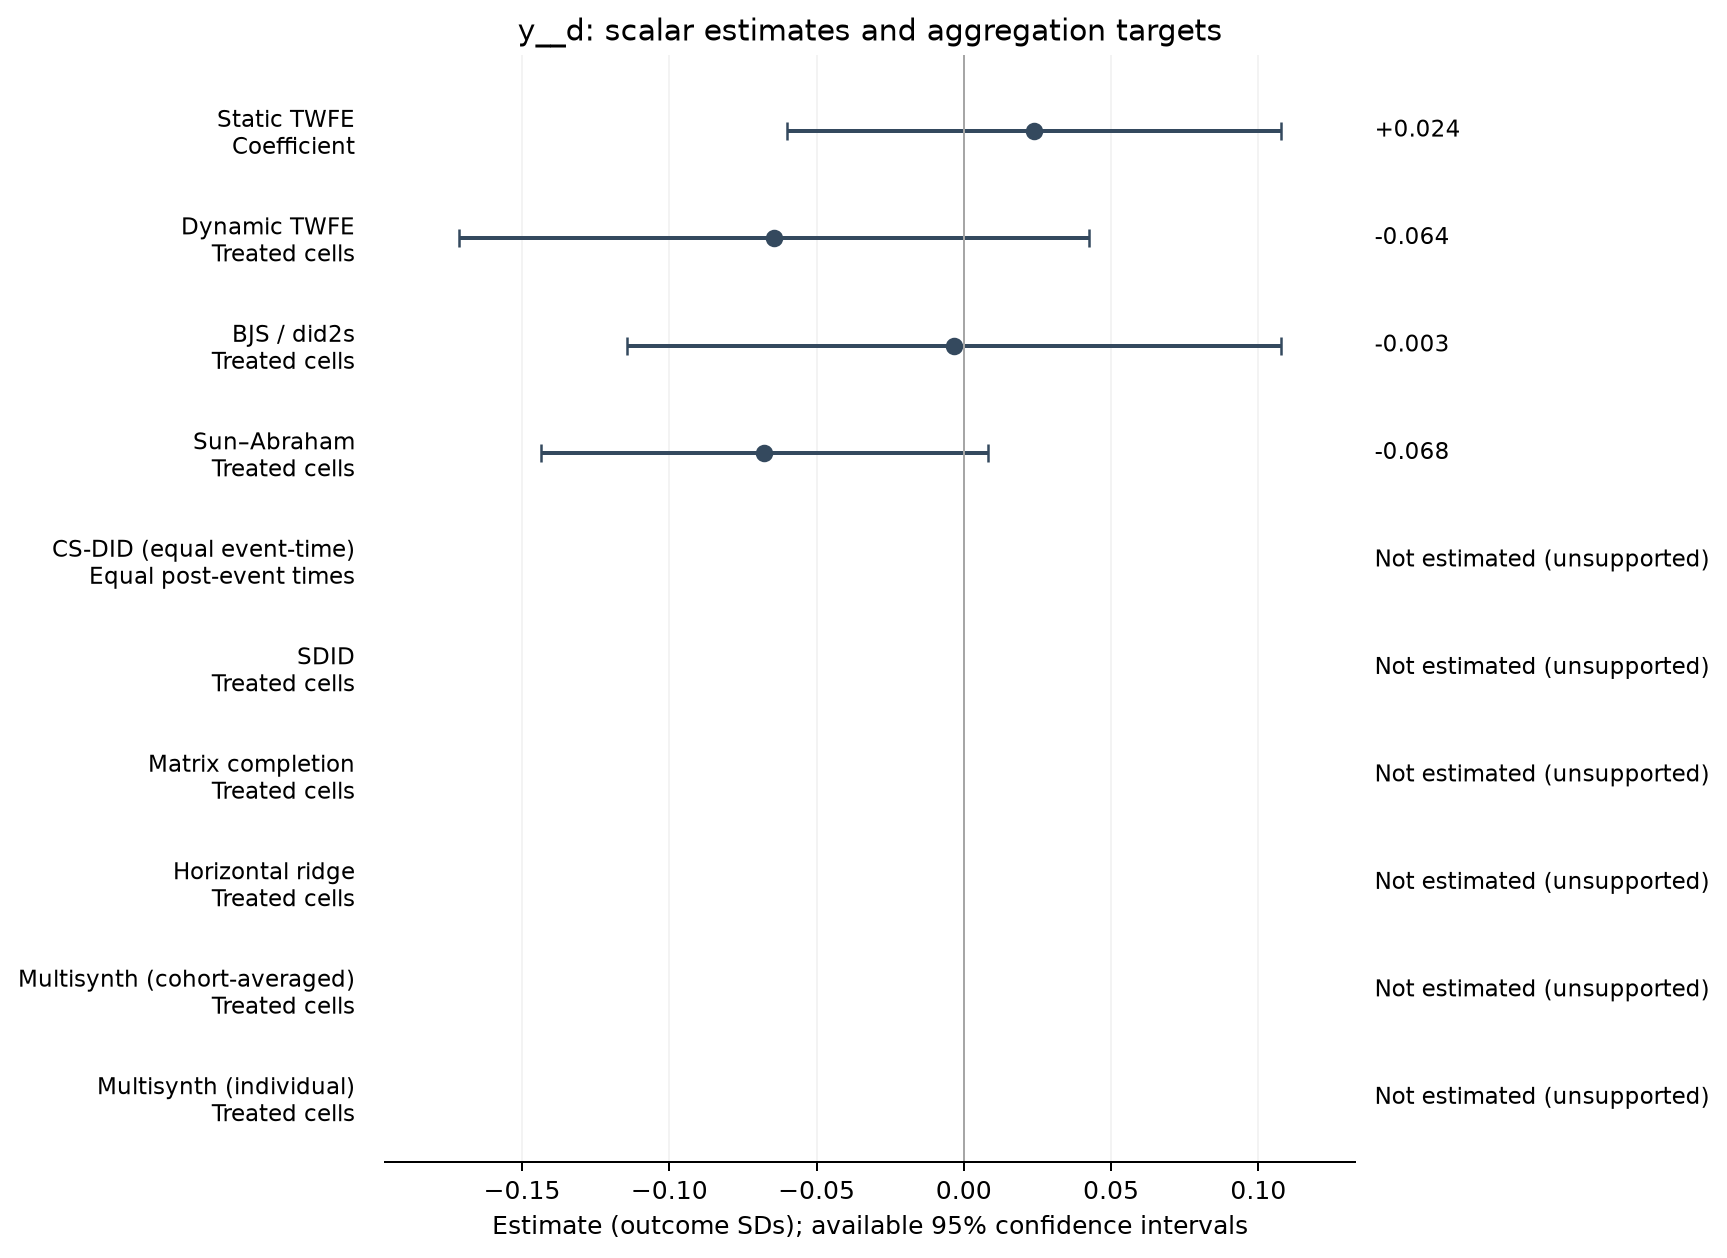
11,536 observations · 575 units · 127 clusters · 189 treated / 386 control units.
Estimate comparison
| Estimator | Estimate (SDs) | SE | 95% CI | Averaging |
|---|---|---|---|---|
| Static TWFE | 0.024 | 0.042 | [-0.060, 0.108] | Coefficient |
| Dynamic TWFE | -0.064 | 0.054 | [-0.171, 0.043] | Treated cells |
| BJS / did2s | -0.003 | 0.056 | [-0.114, 0.108] | Treated cells |
| Sun–Abraham | -0.068 | 0.038 | [-0.144, 0.008] | Treated cells |
Event studies
Periods −10 to +10; pointwise 95% intervals where available.
LANDMINES-T2-C5-FULL-DMSP-RAW
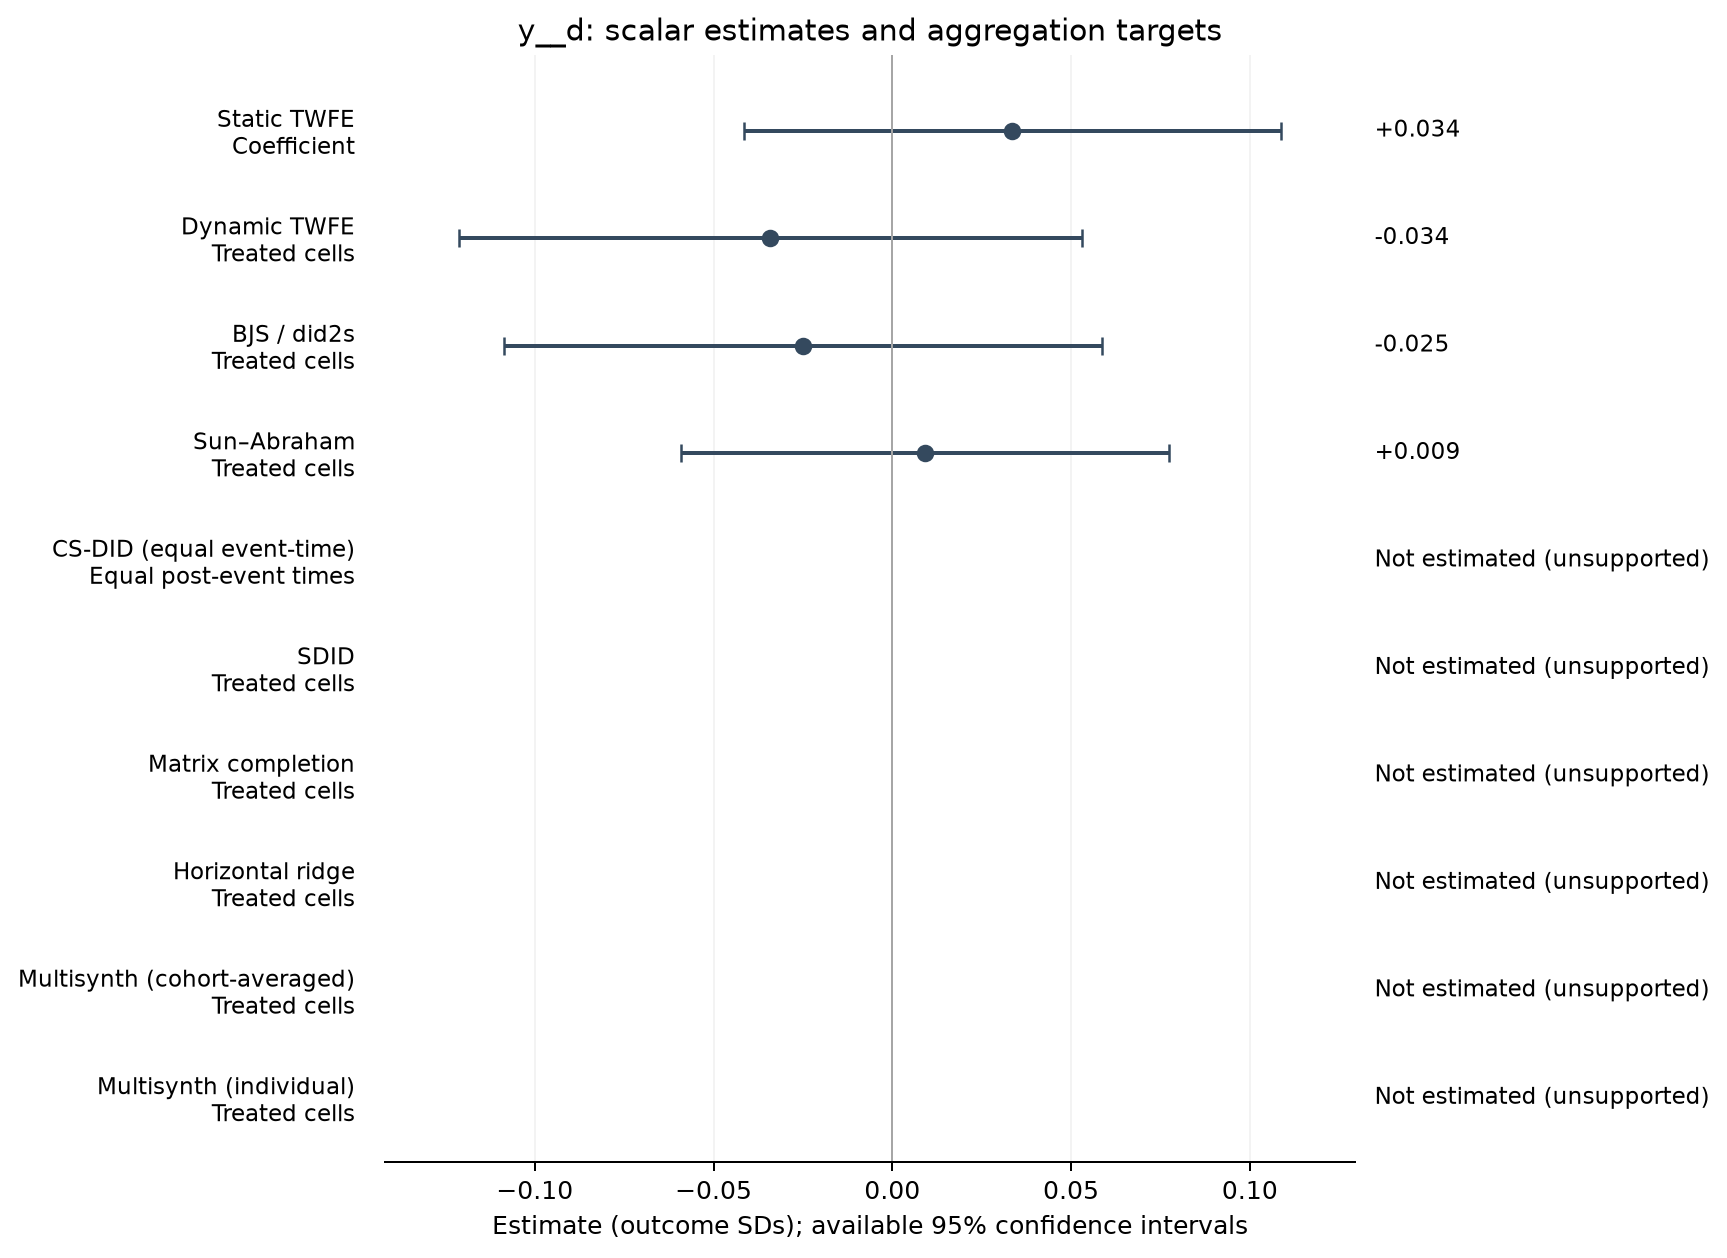
11,536 observations · 575 units · 127 clusters · 189 treated / 386 control units.
Estimate comparison
| Estimator | Estimate (SDs) | SE | 95% CI | Averaging |
|---|---|---|---|---|
| Static TWFE | 0.034 | 0.038 | [-0.042, 0.109] | Coefficient |
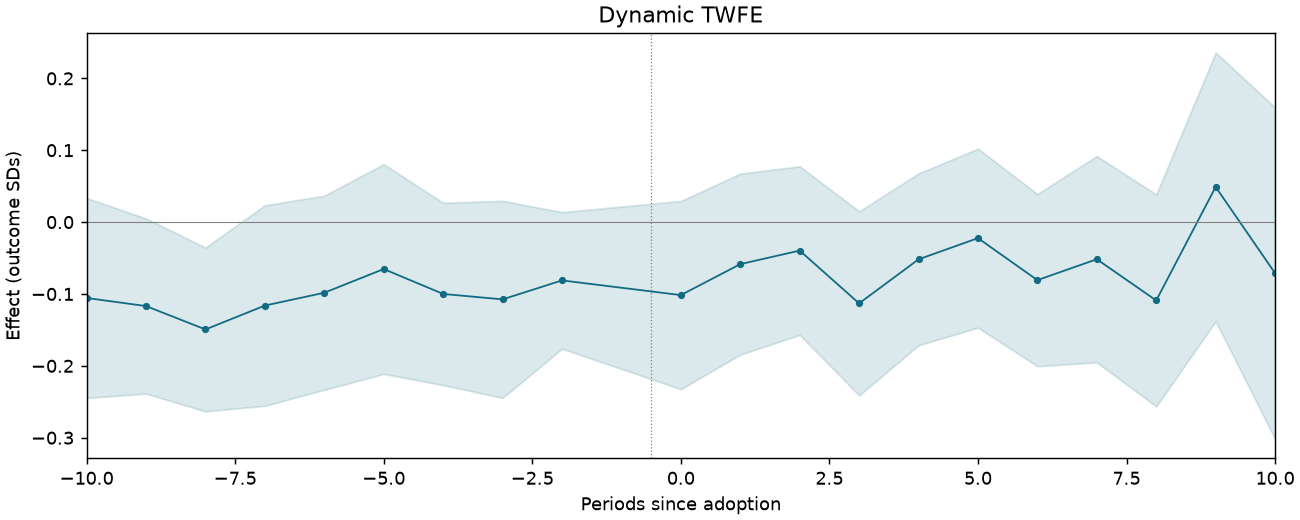
| Dynamic TWFE | -0.034 | 0.044 | [-0.121, 0.053] | Treated cells |
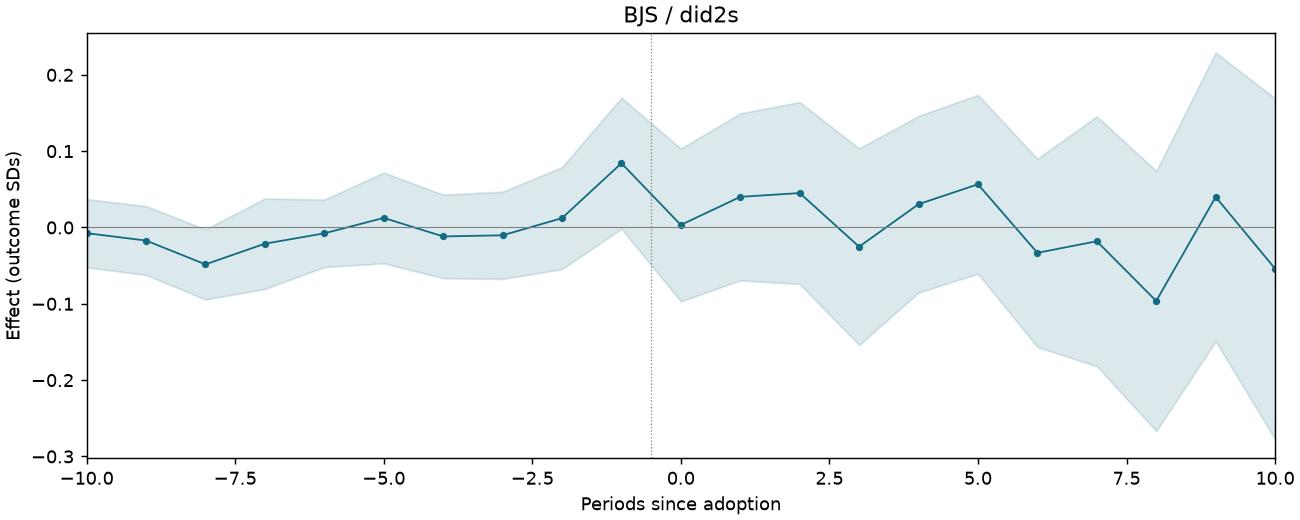
| BJS / did2s | -0.025 | 0.042 | [-0.109, 0.059] | Treated cells |
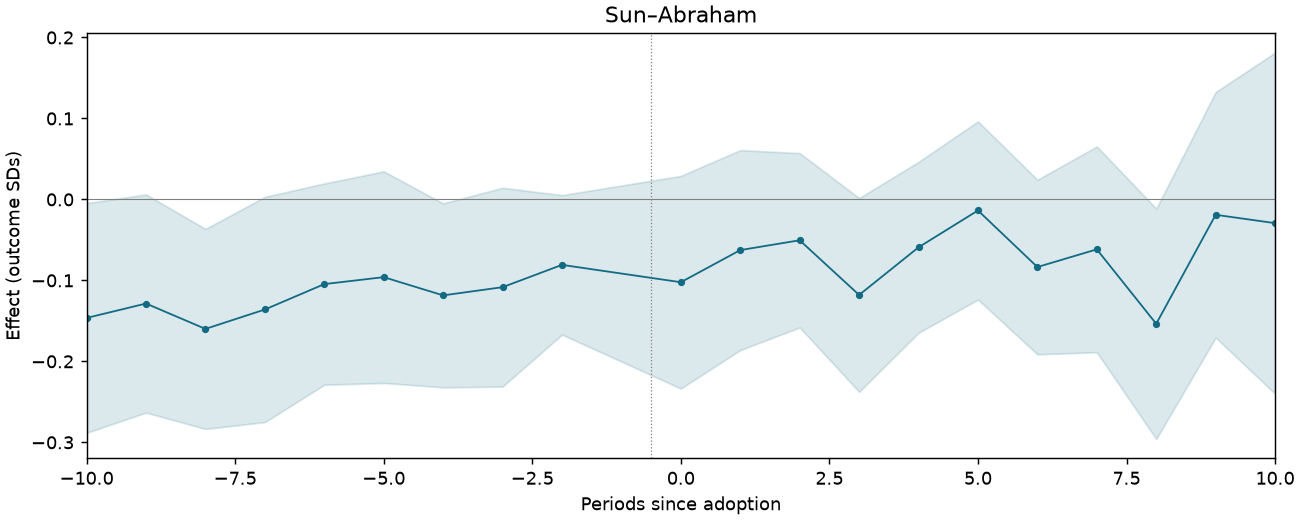
| Sun–Abraham | 0.009 | 0.034 | [-0.059, 0.077] | Treated cells |
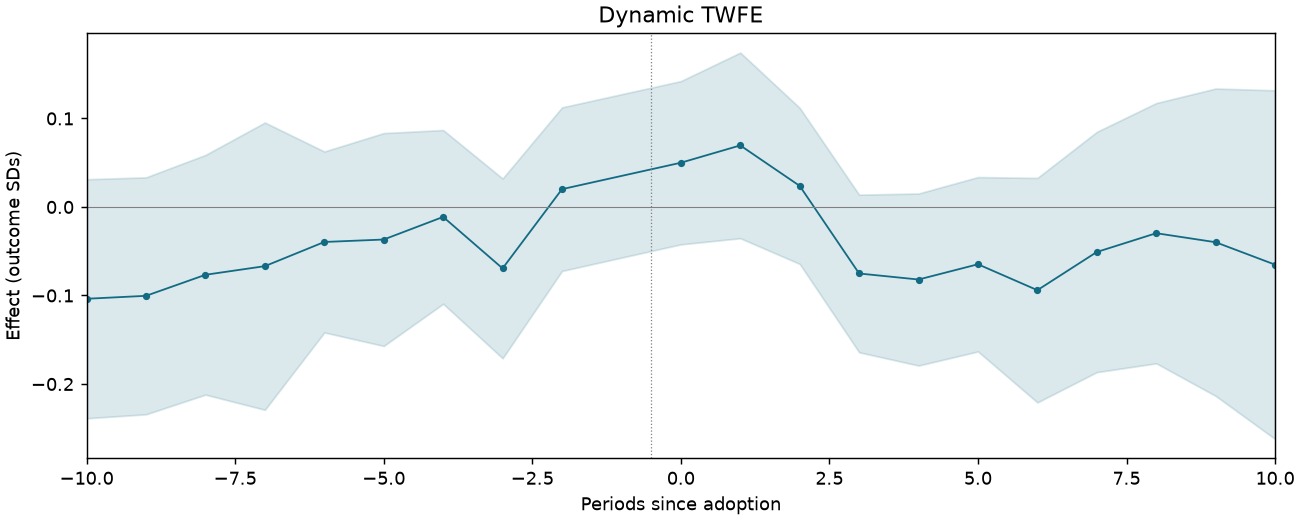
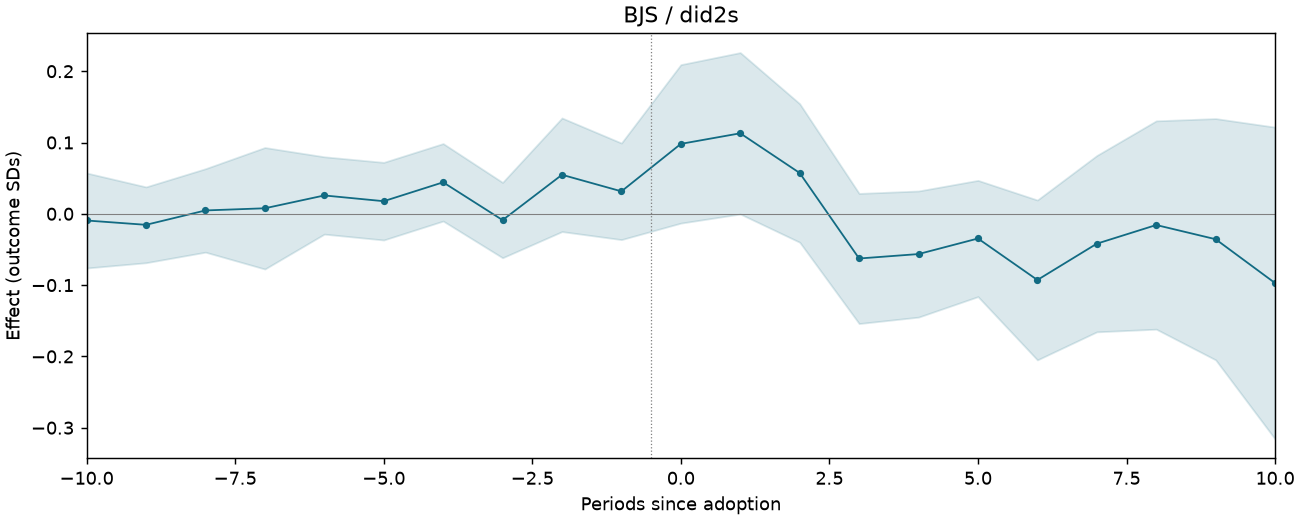
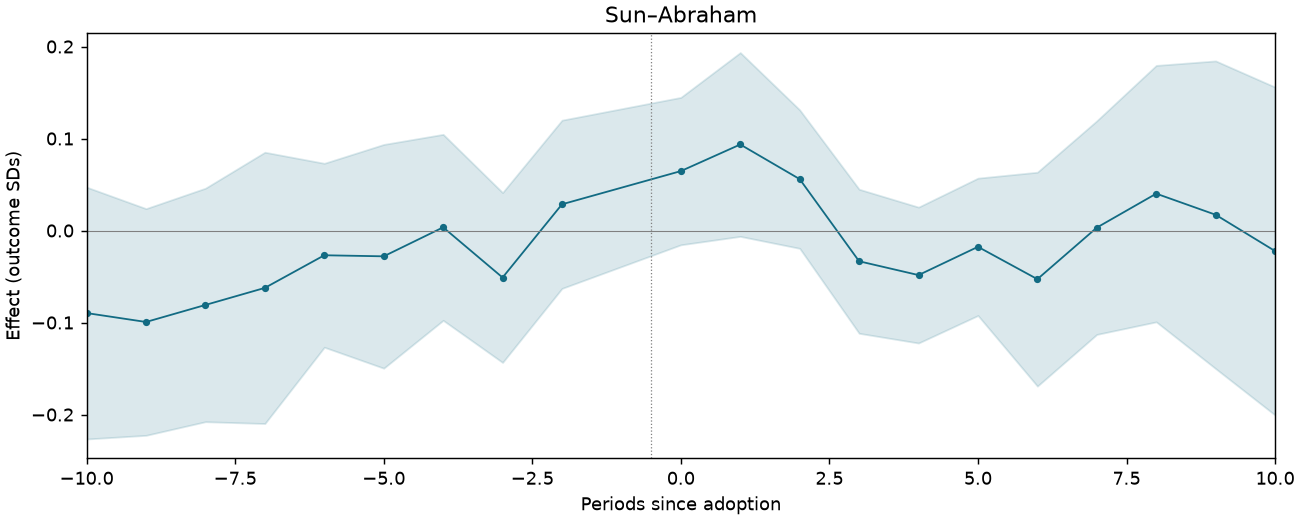
Event studies
Periods −10 to +10; pointwise 95% intervals where available.
LANDMINES-T2-C7-FULL-DISTRICT-YEAR
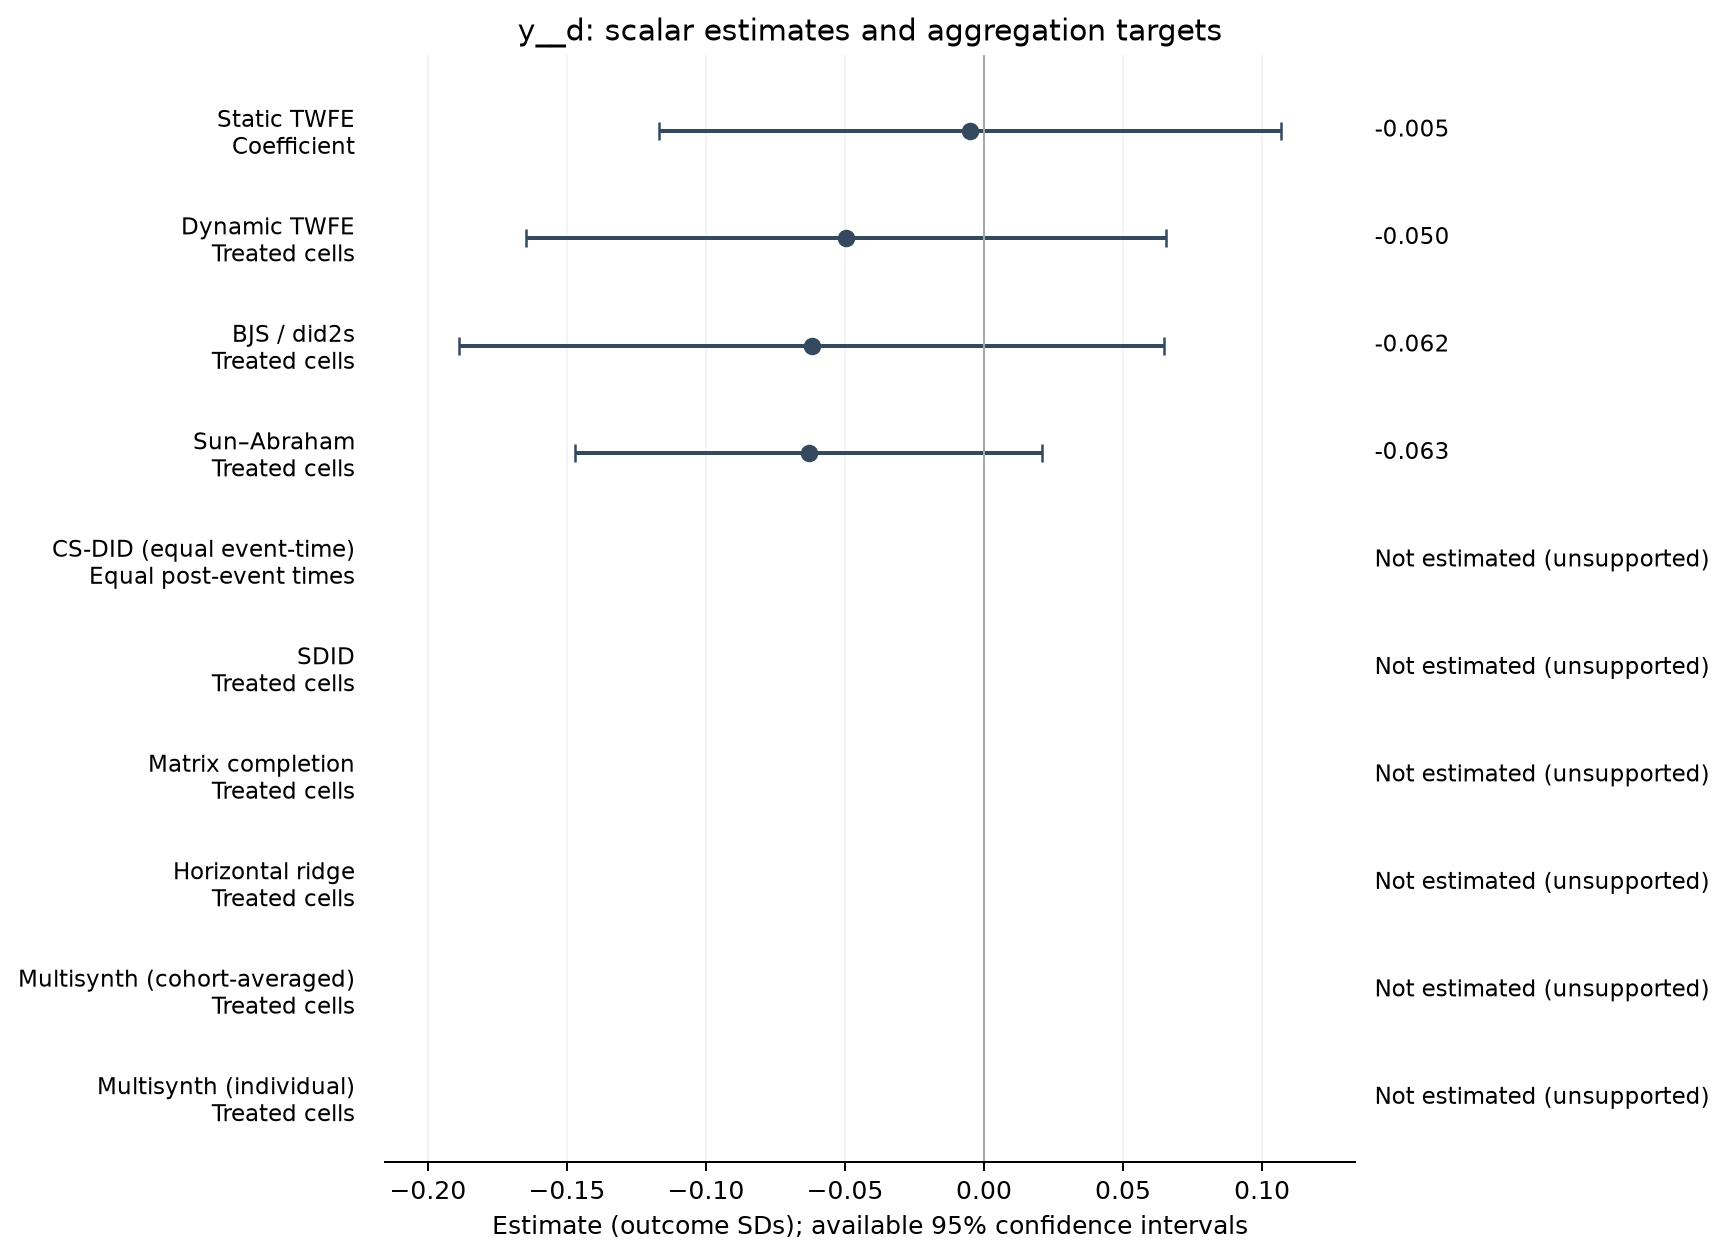
13,190 observations · 646 units · 117 clusters · 171 treated / 475 control units.
Estimate comparison
| Estimator | Estimate (SDs) | SE | 95% CI | Averaging |
|---|---|---|---|---|
| Static TWFE | -0.005 | 0.056 | [-0.117, 0.107] | Coefficient |
| Dynamic TWFE | -0.050 | 0.058 | [-0.165, 0.065] | Treated cells |
| BJS / did2s | -0.062 | 0.064 | [-0.189, 0.065] | Treated cells |
| Sun–Abraham | -0.063 | 0.042 | [-0.147, 0.021] | Treated cells |
Event studies
Periods −10 to +10; pointwise 95% intervals where available.