Curriculum and Ideology — expanded estimators
Archive index · Regression tests · Results & settings (JSON) · Methods & code
Cantoni et al. (2017), JPE. https://doi.org/10.1086/690951
103 specifications. Effects are in outcome standard deviations; intervals are 95%.
Treatment adoption

S01-P066: seeded sample of 16 of 16 eligible units. Purple untreated; yellow treated; white unobserved.
CI-F4-A-DYNAMIC
1,106 observations · 19 units · 19 clusters · 13 treated / 6 control units.
Estimate comparison
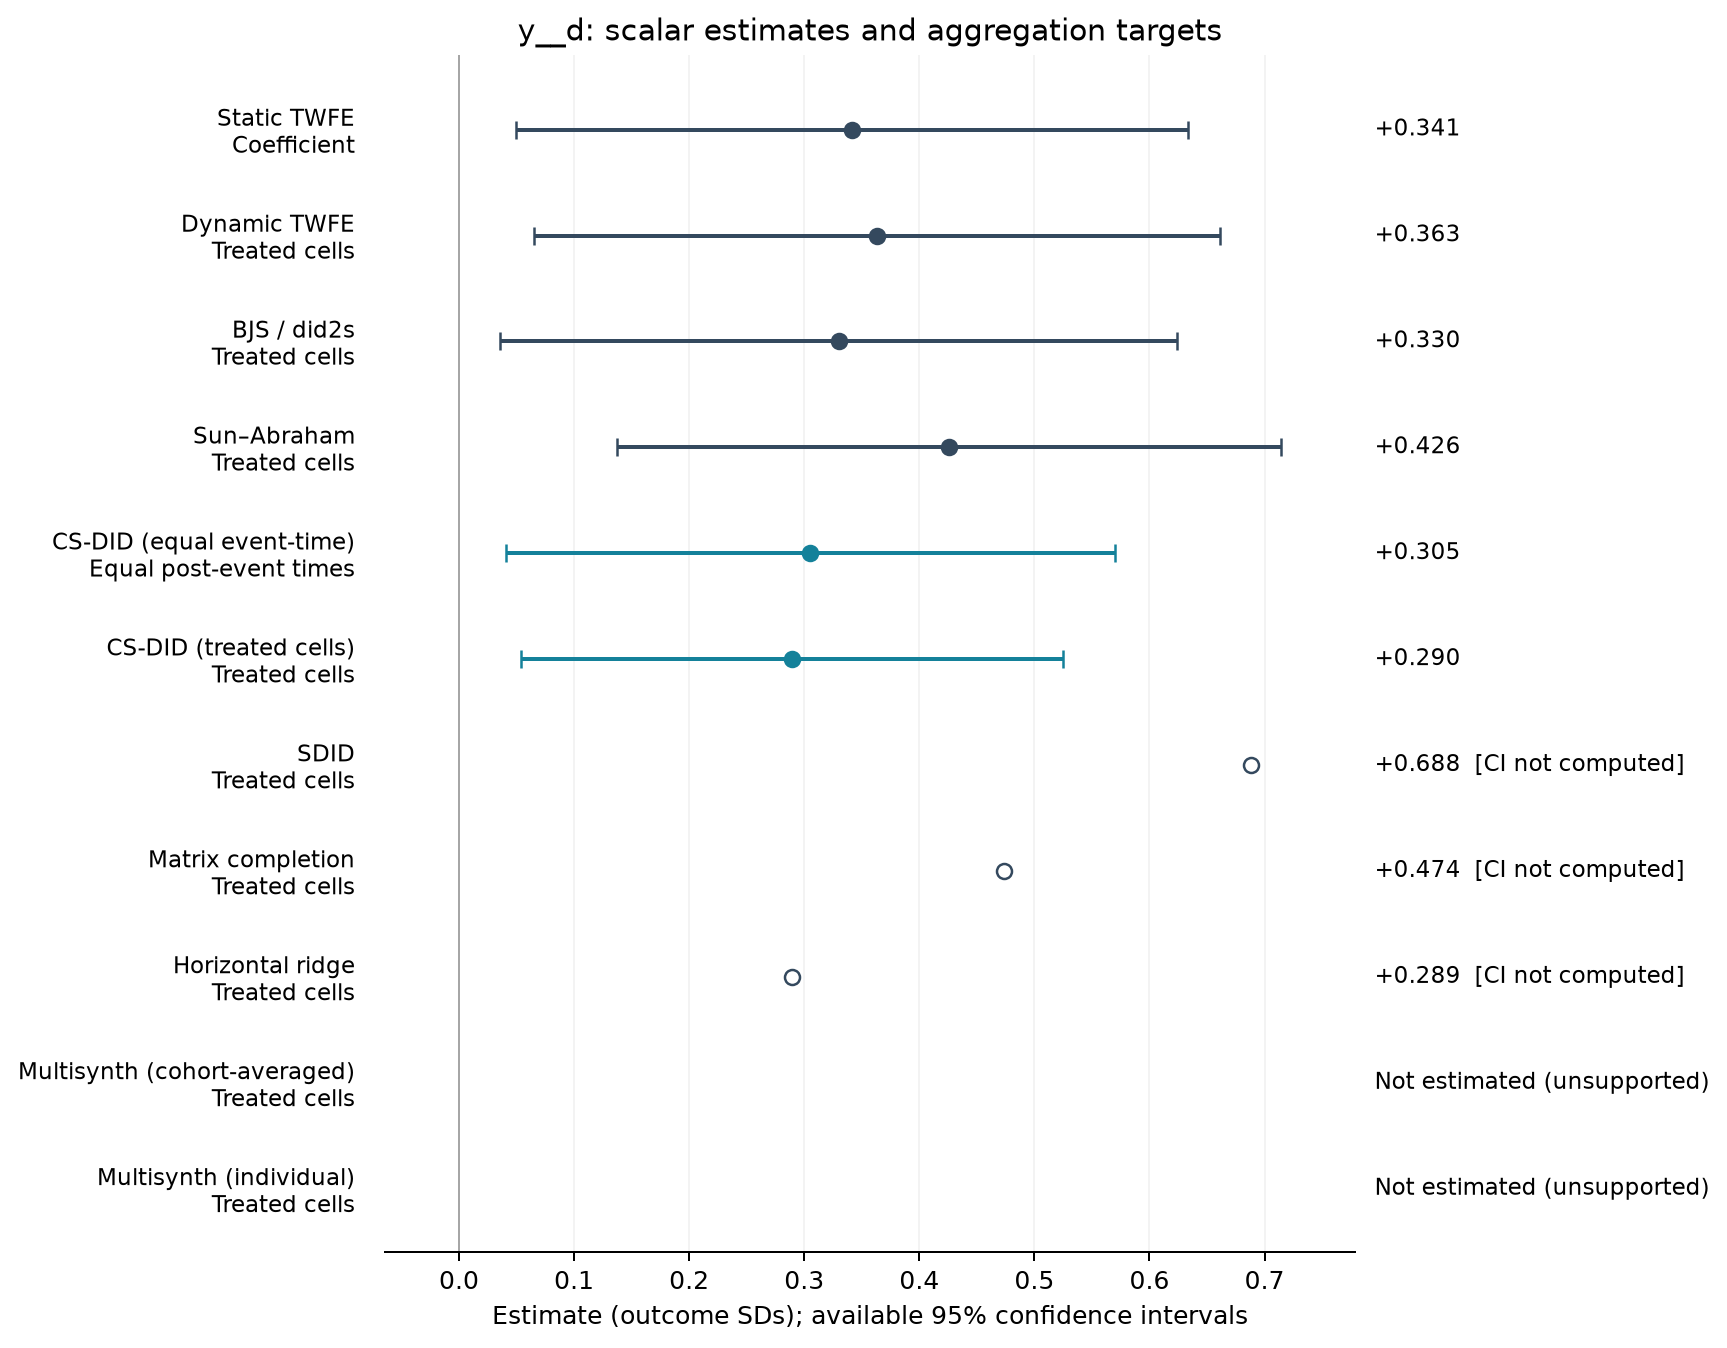
| Estimator | Estimate (SDs) | SE | 95% CI | Averaging |
|---|---|---|---|---|
| Static TWFE | 0.341 | 0.139 | [0.049, 0.634] | Coefficient |
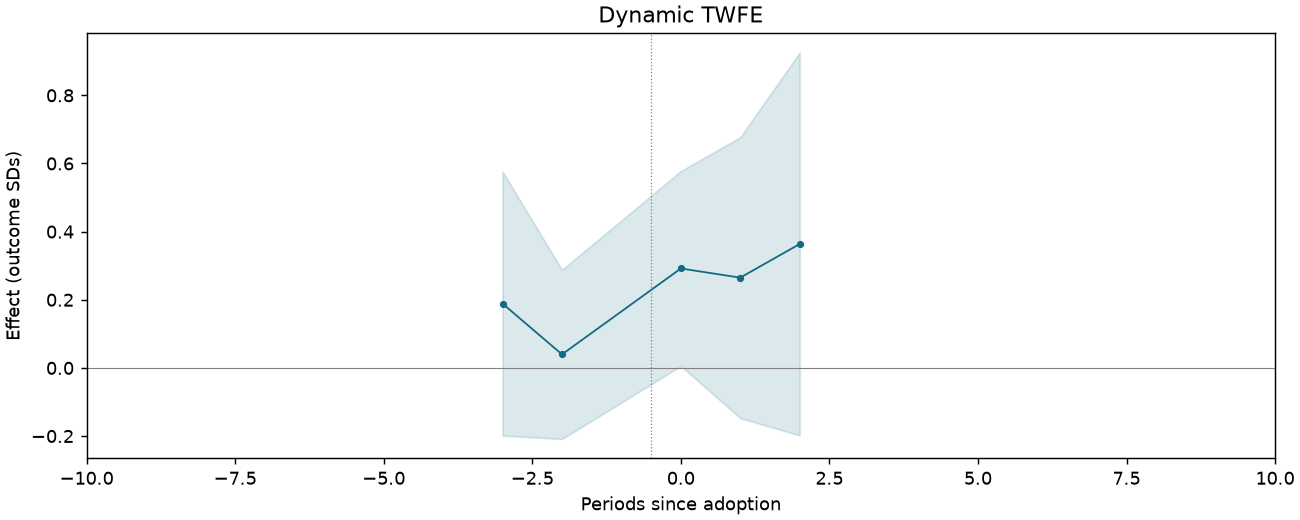
| Dynamic TWFE | 0.363 | 0.142 | [0.065, 0.661] | Treated cells |
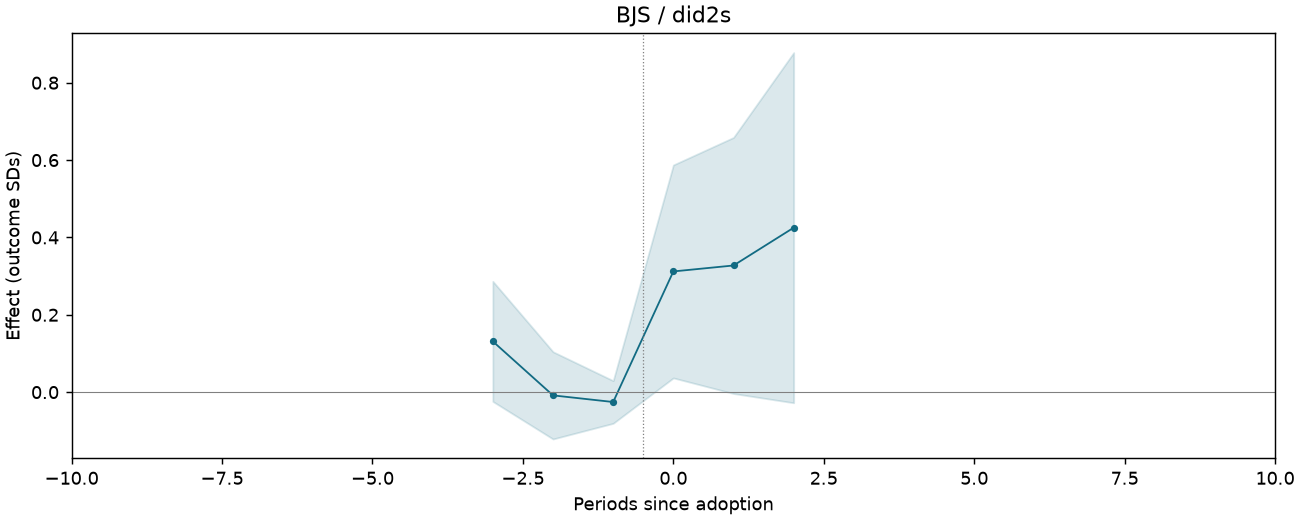
| BJS / did2s | 0.330 | 0.140 | [0.036, 0.624] | Treated cells |
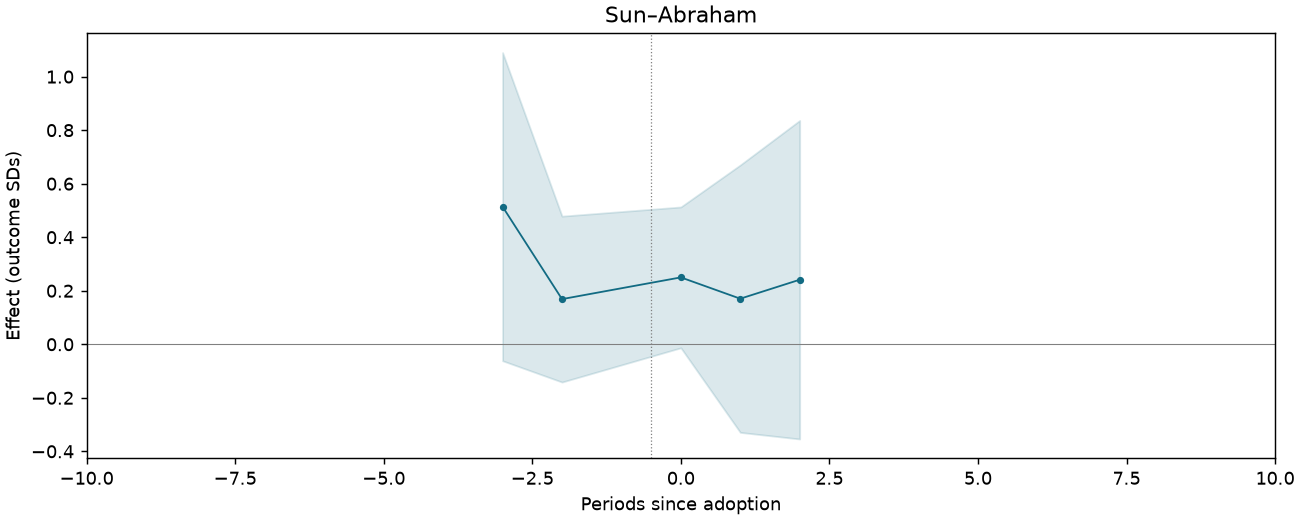
| Sun–Abraham | 0.426 | 0.137 | [0.137, 0.714] | Treated cells |
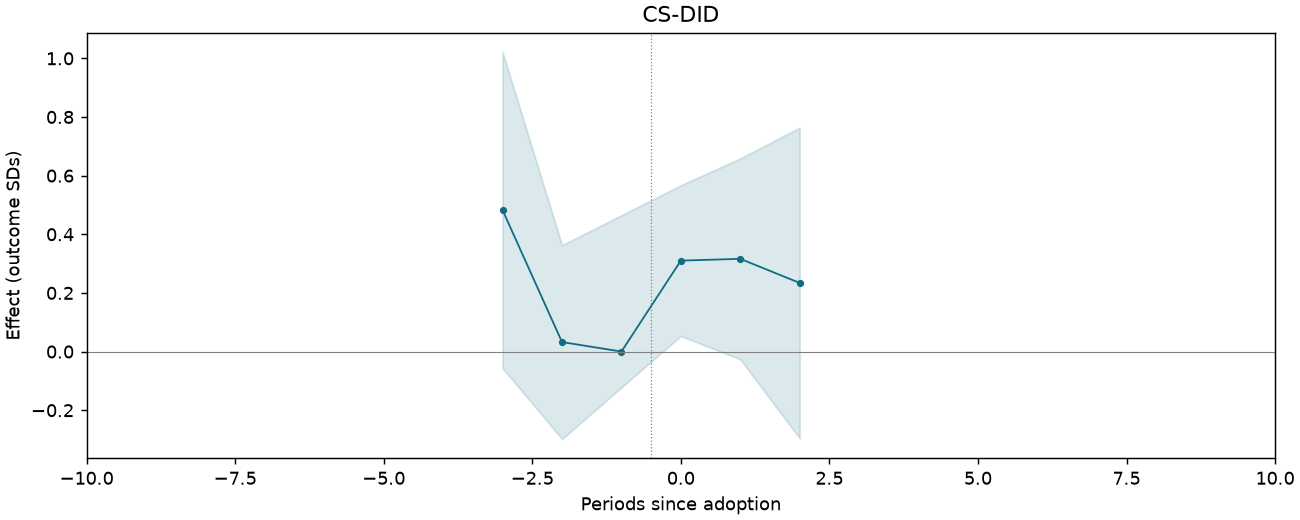
| CS-DID (equal event-time) | 0.305 | 0.135 | [0.041, 0.570] | Equal post-event times |
| CS-DID (treated cells) | 0.290 | 0.120 | [0.054, 0.525] | Treated cells |
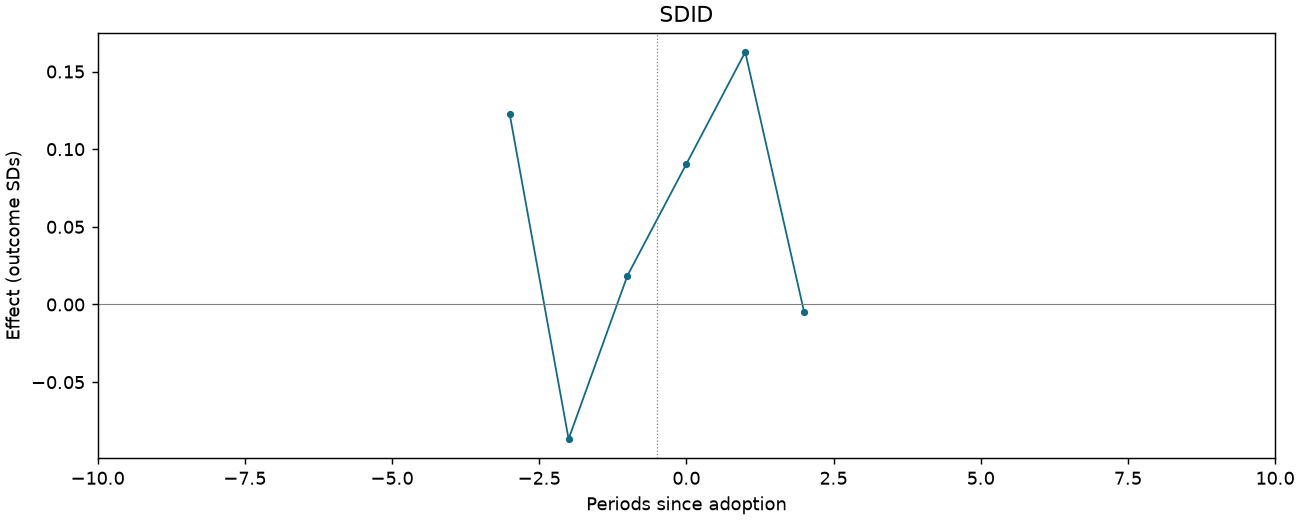
| SDID | 0.688 | — | — | Treated cells |
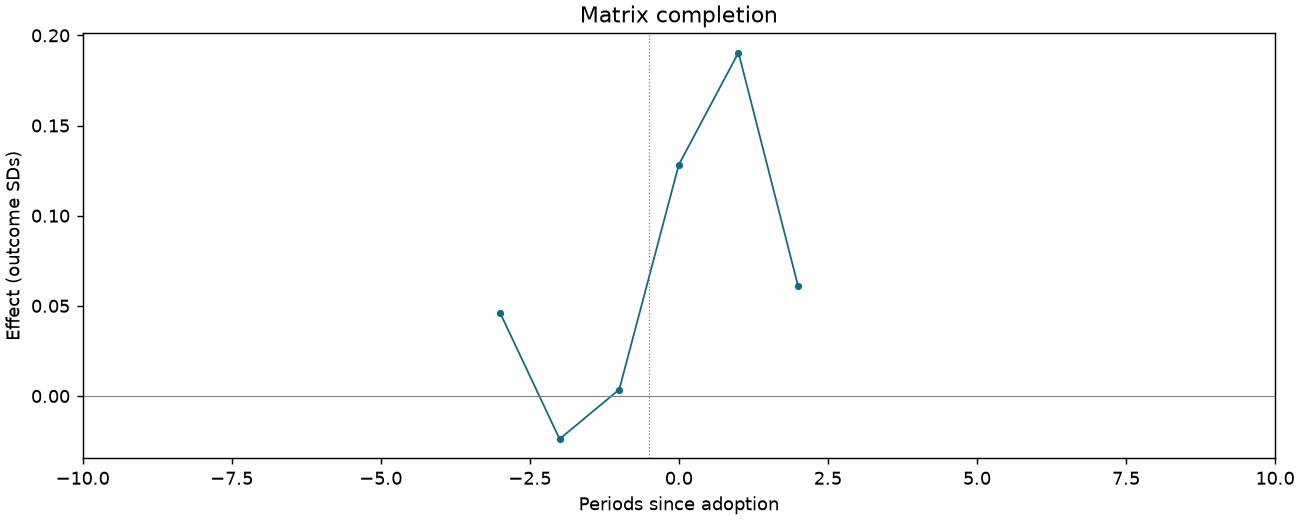
| Matrix completion | 0.474 | — | — | Treated cells |
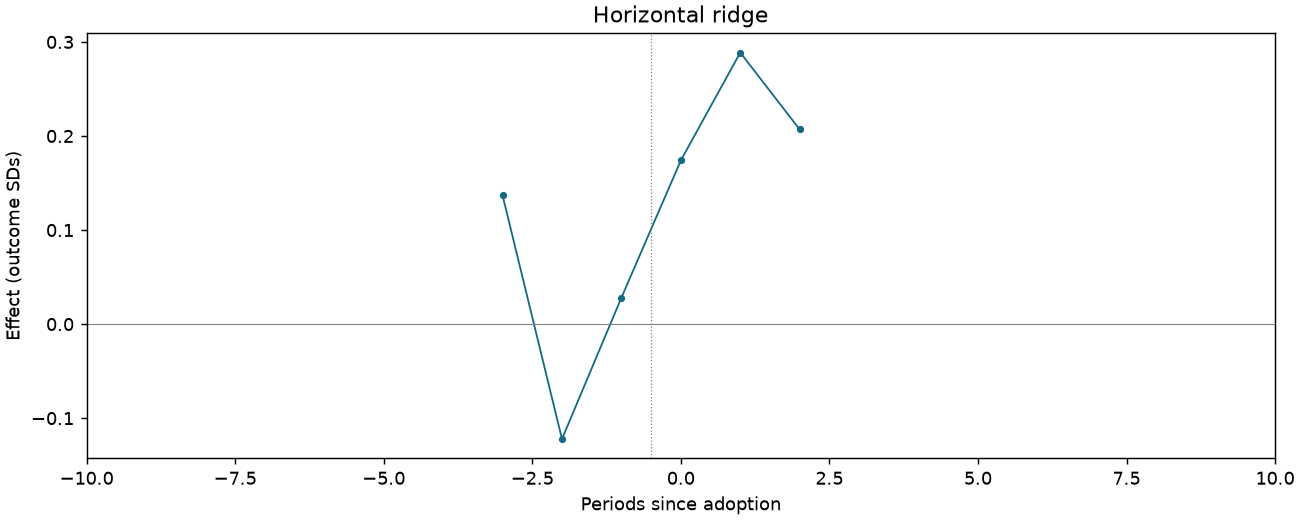
| Horizontal ridge | 0.289 | — | — | Treated cells |
Event studies
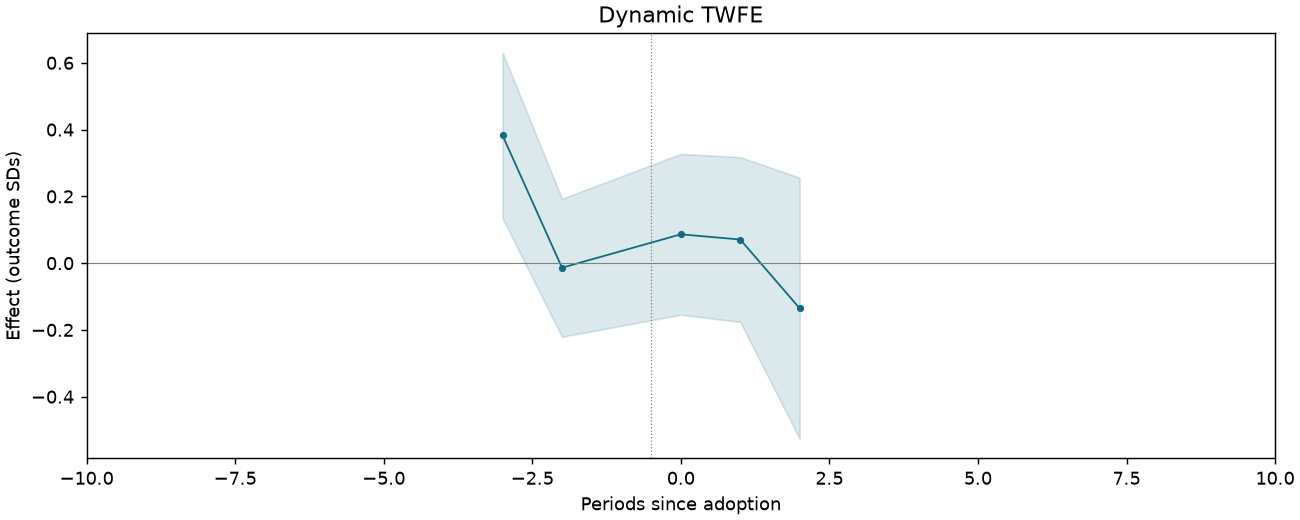
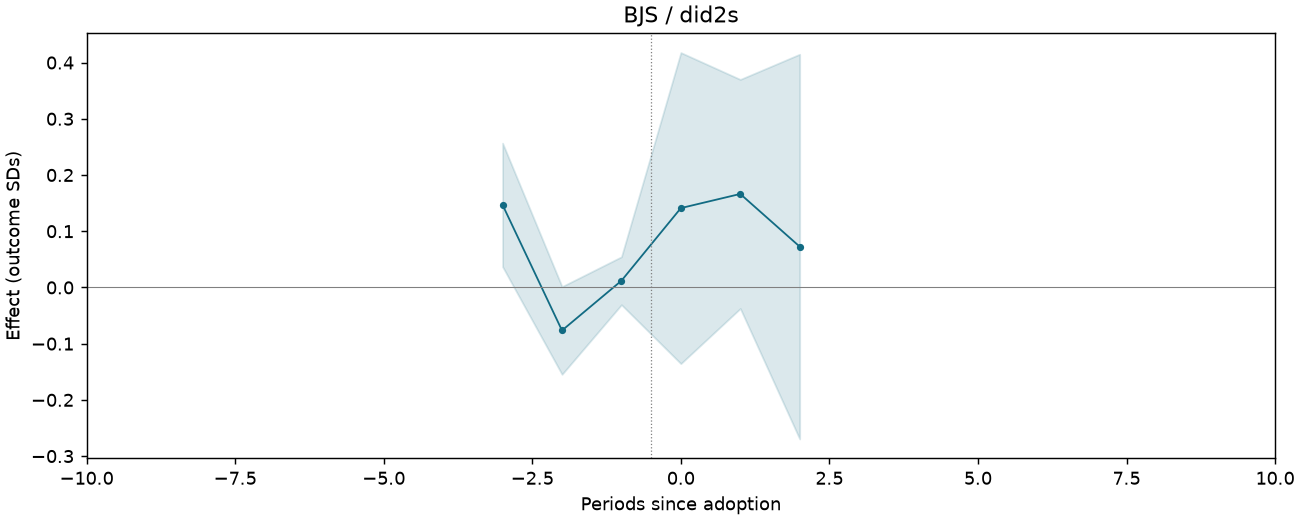
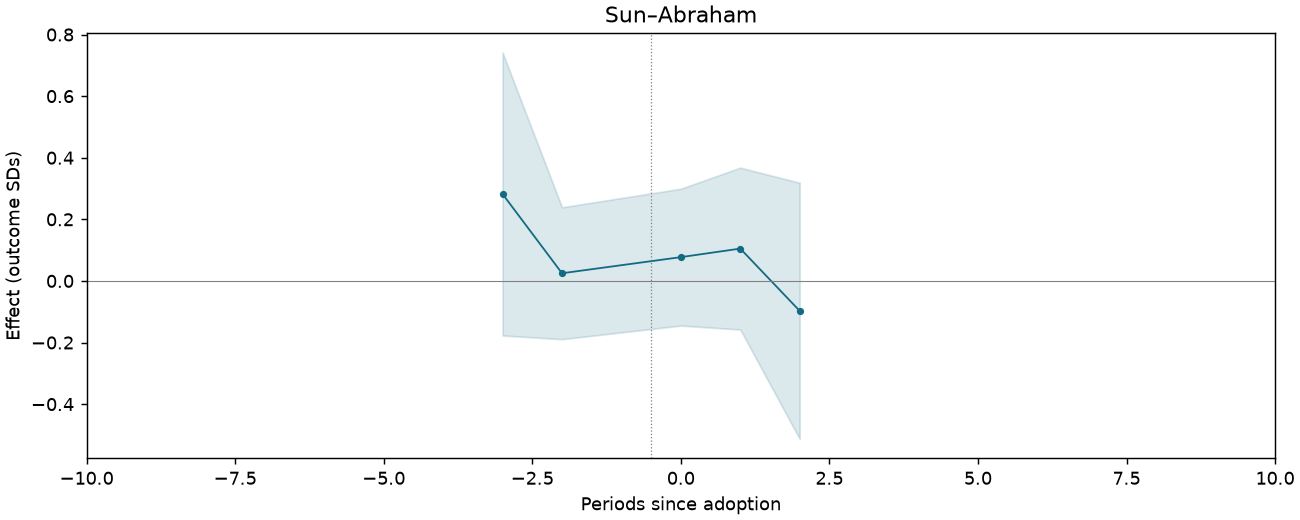
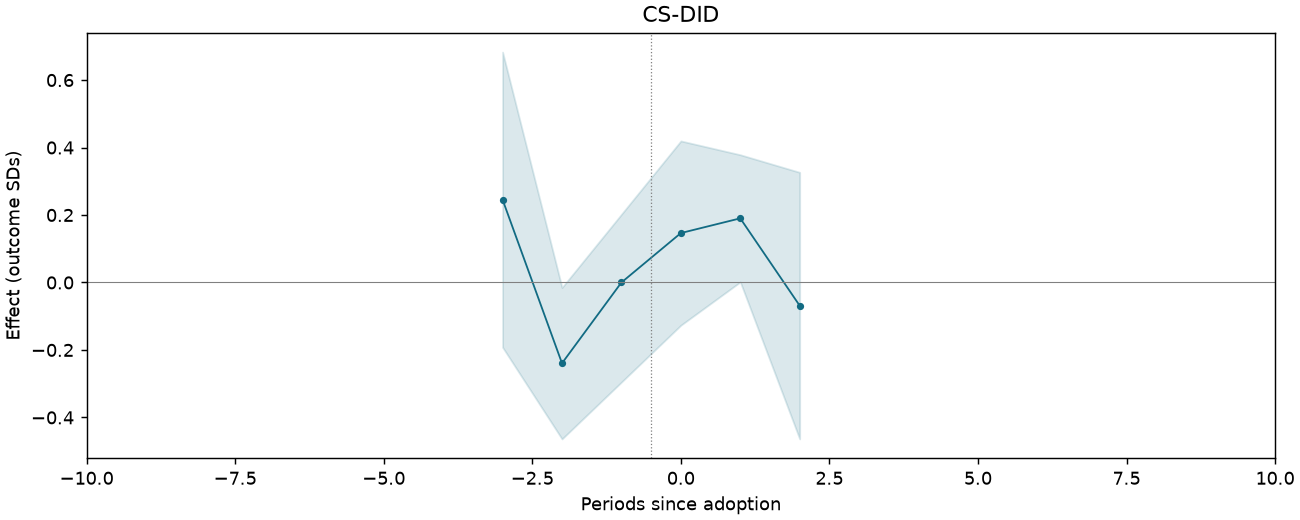
Periods −10 to +10; pointwise 95% intervals where available.
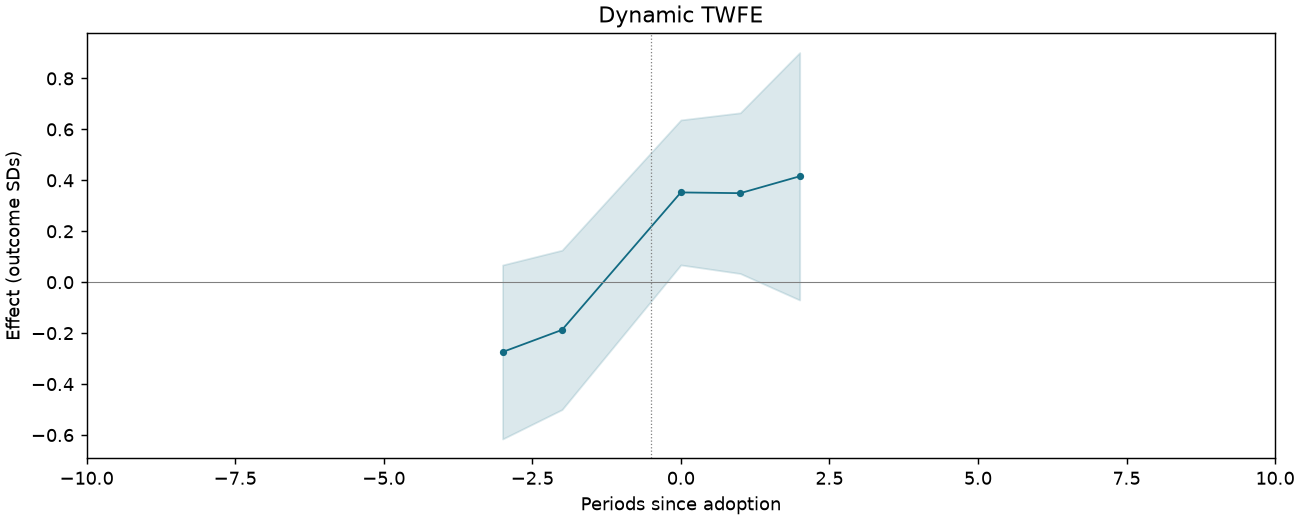
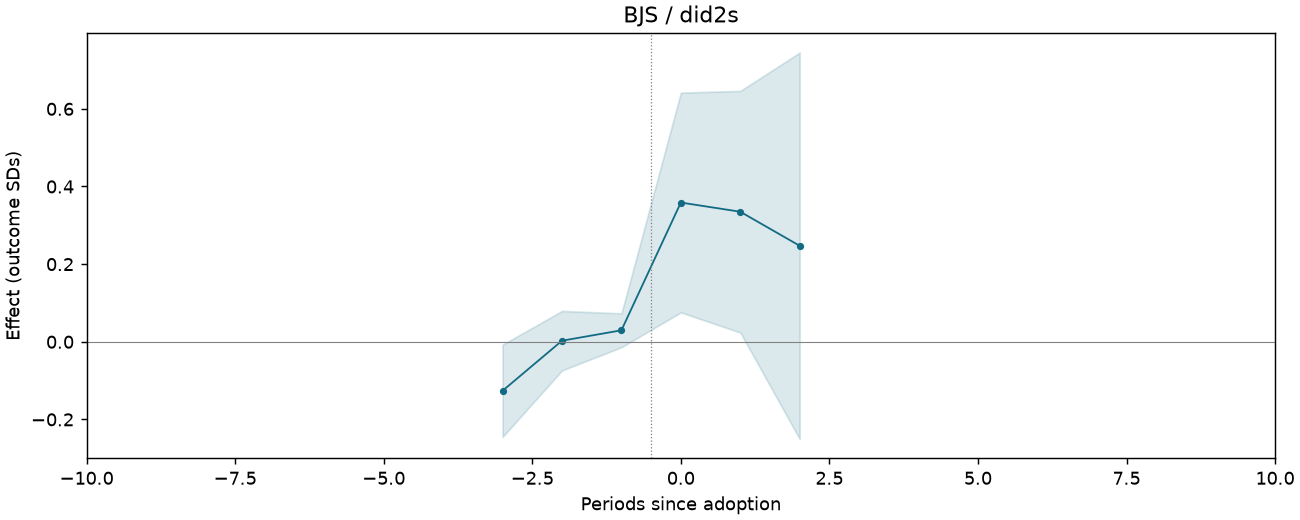
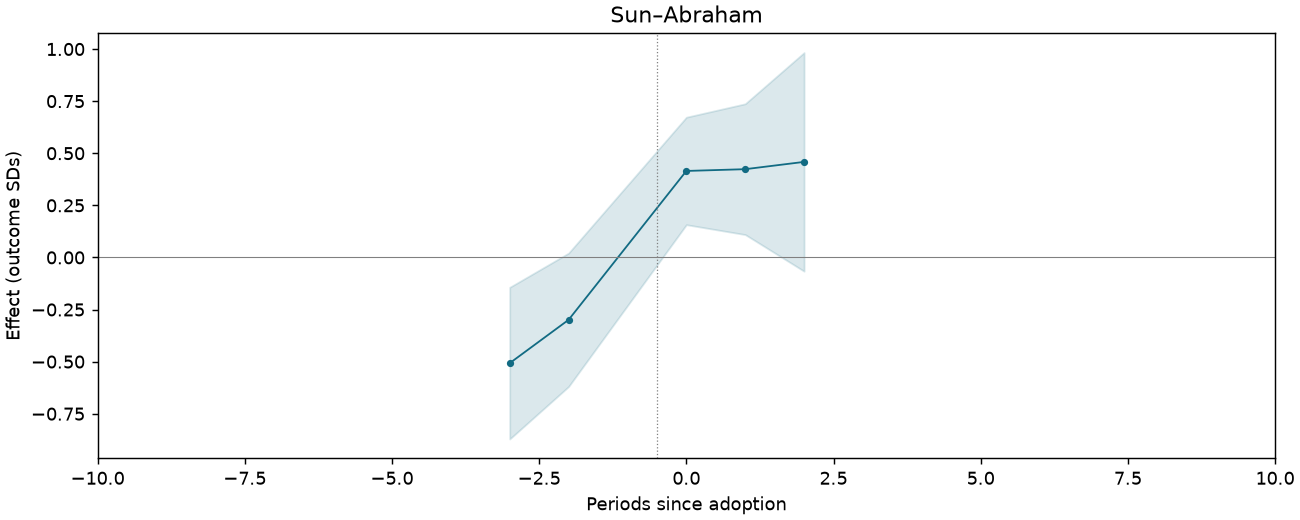
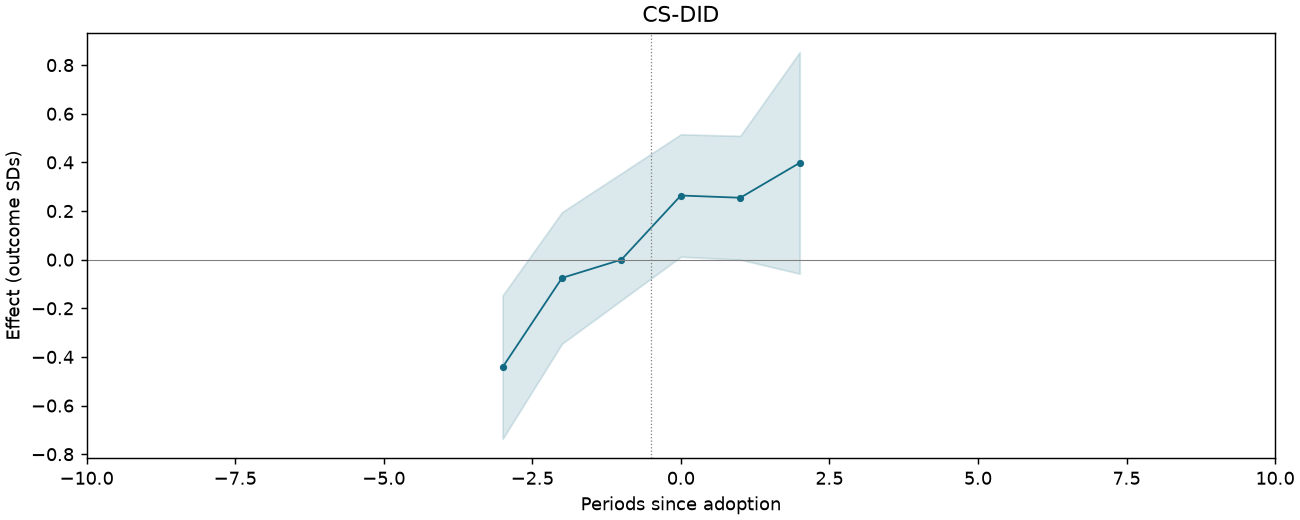
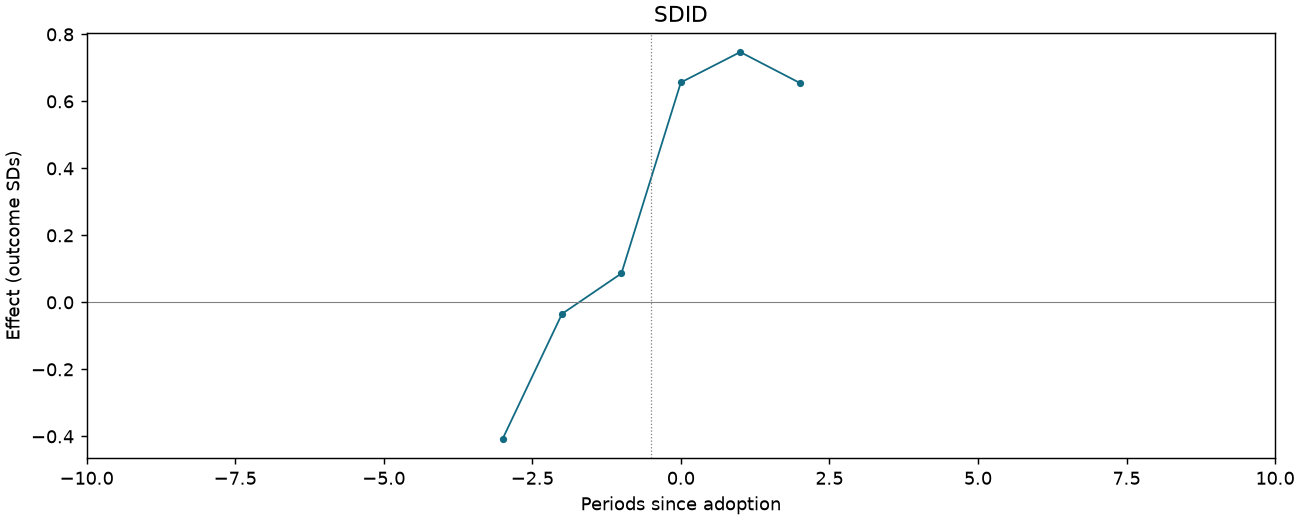
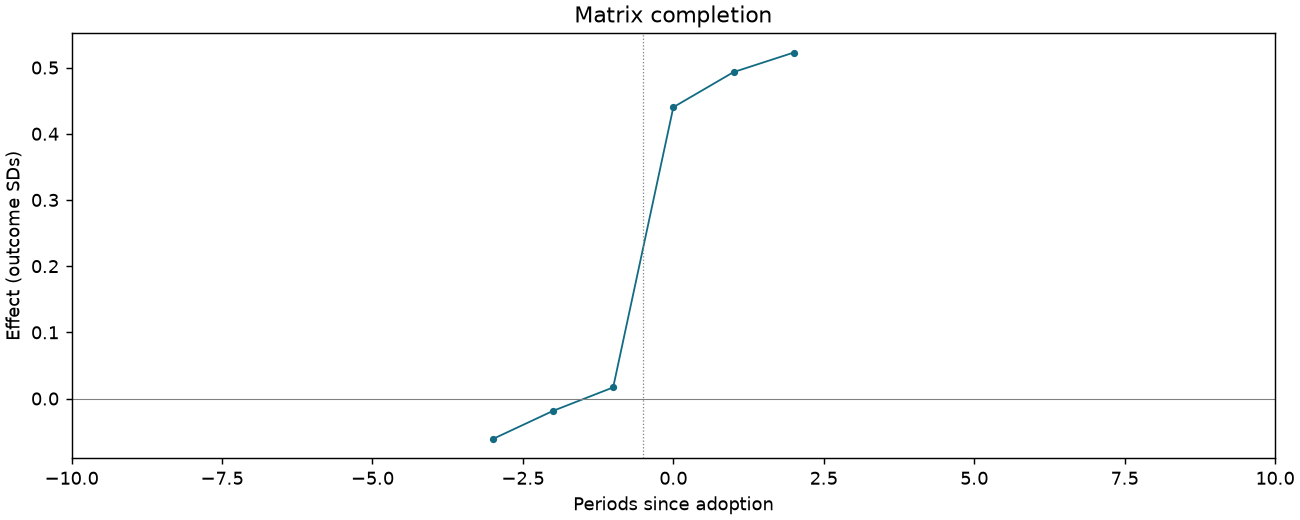
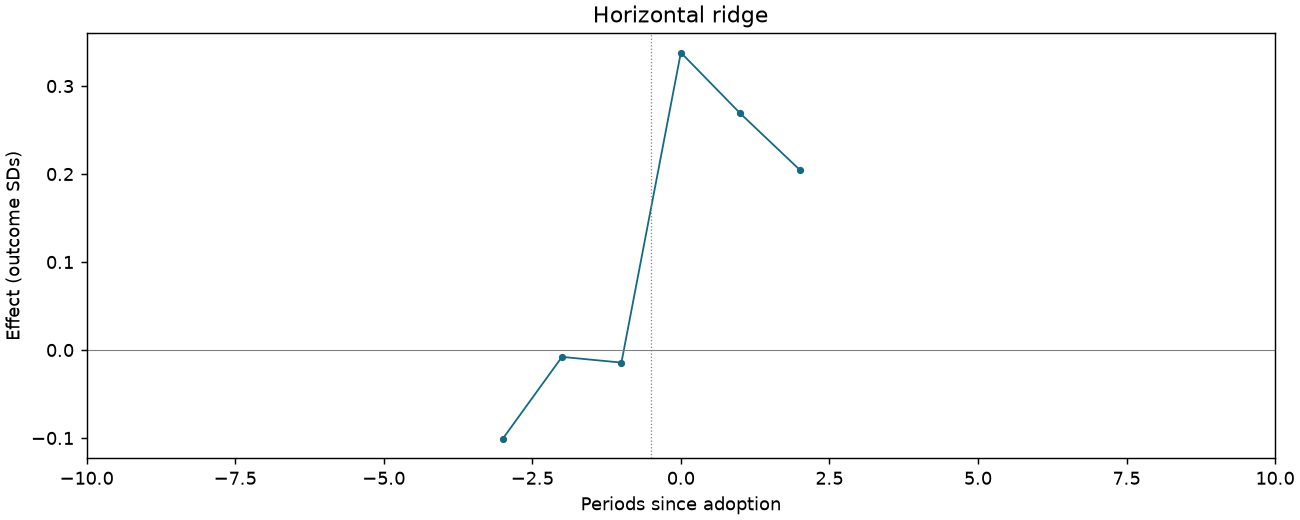
CI-F4-B-DYNAMIC
1,090 observations · 19 units · 19 clusters · 13 treated / 6 control units.
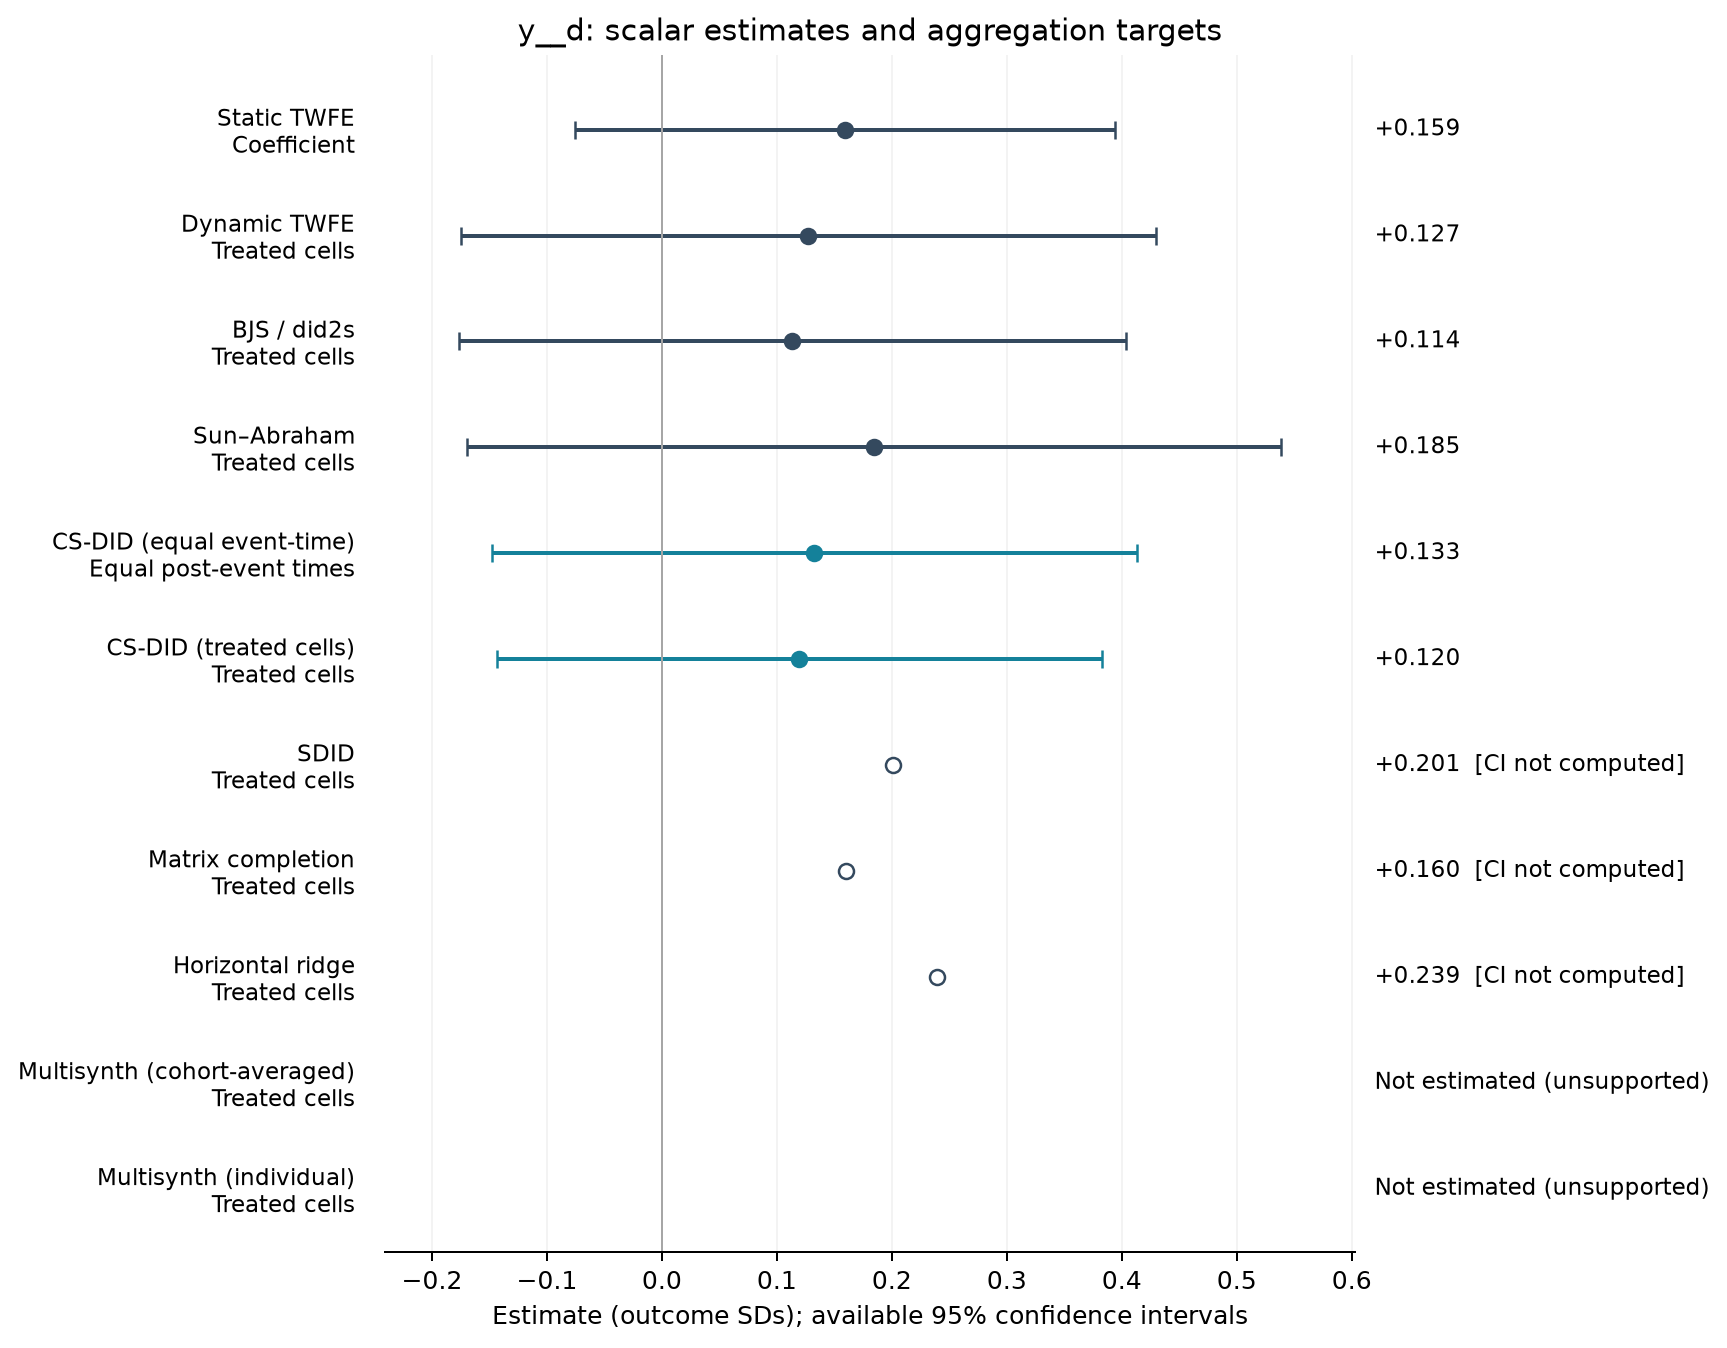
Estimate comparison
| Estimator | Estimate (SDs) | SE | 95% CI | Averaging |
|---|---|---|---|---|
| Static TWFE | 0.159 | 0.112 | [-0.076, 0.394] | Coefficient |
| Dynamic TWFE | 0.127 | 0.144 | [-0.175, 0.429] | Treated cells |
| BJS / did2s | 0.114 | 0.138 | [-0.176, 0.404] | Treated cells |
| Sun–Abraham | 0.185 | 0.168 | [-0.169, 0.539] | Treated cells |
| CS-DID (equal event-time) | 0.133 | 0.143 | [-0.148, 0.413] | Equal post-event times |
| CS-DID (treated cells) | 0.120 | 0.134 | [-0.143, 0.382] | Treated cells |
| SDID | 0.201 | — | — | Treated cells |
| Matrix completion | 0.160 | — | — | Treated cells |
| Horizontal ridge | 0.239 | — | — | Treated cells |
Event studies
Periods −10 to +10; pointwise 95% intervals where available.
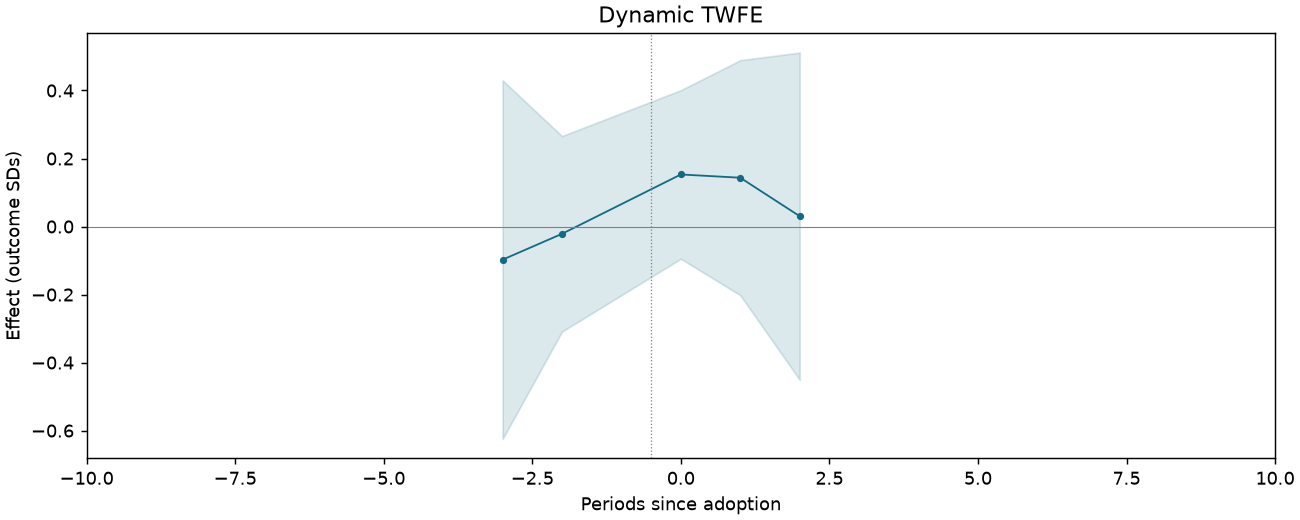
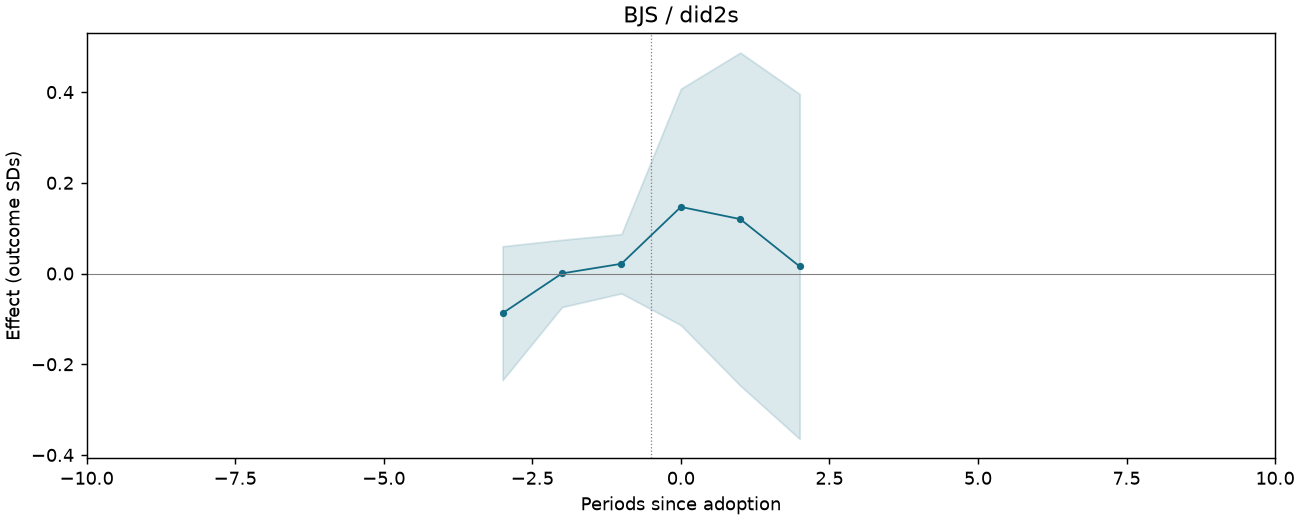
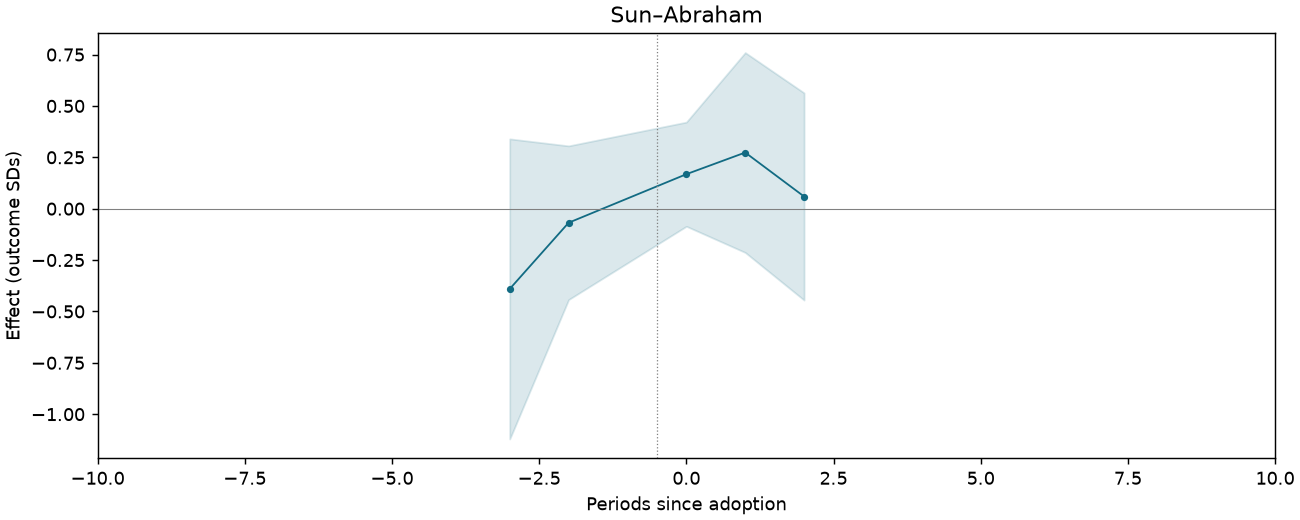
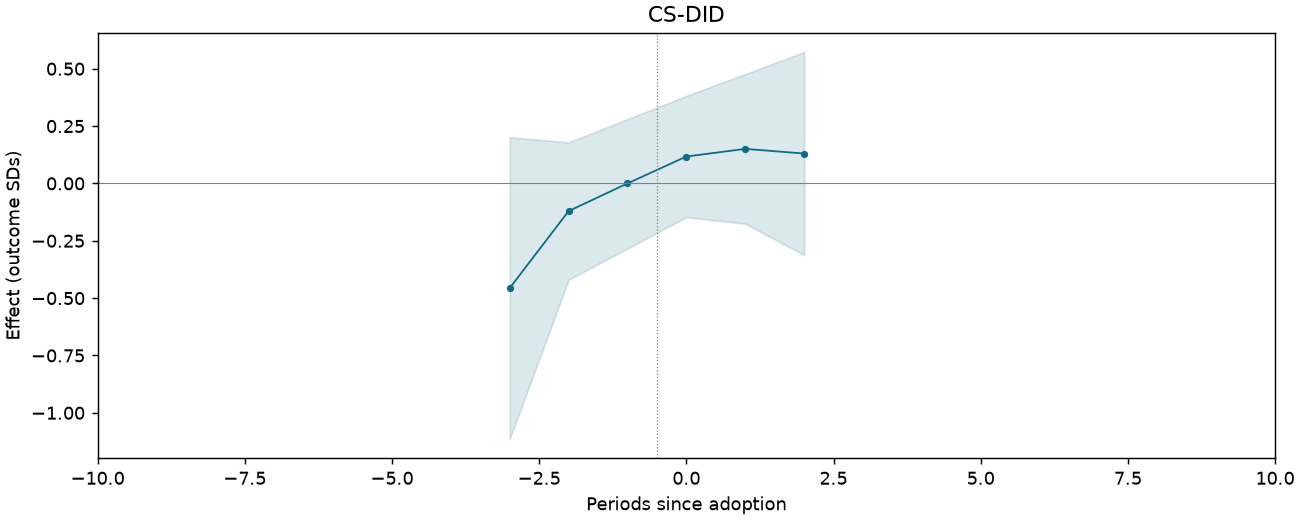
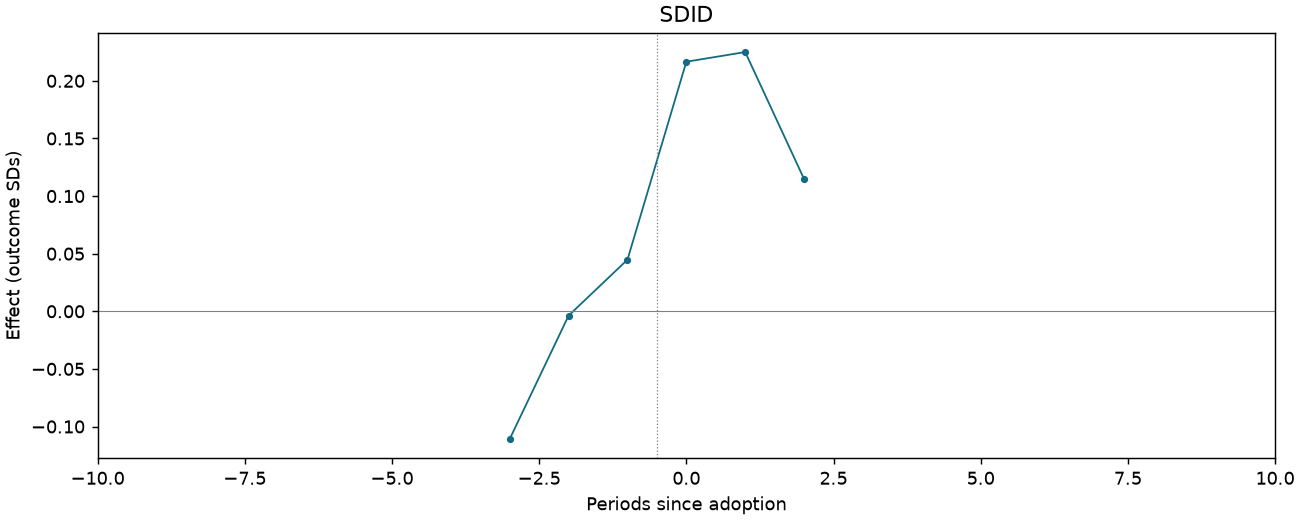
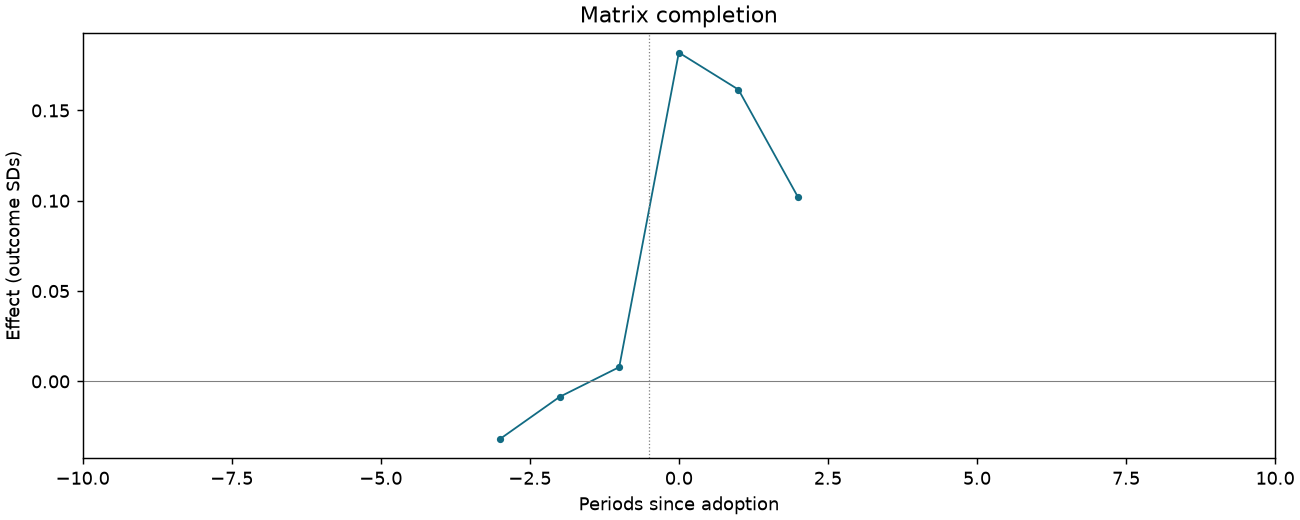
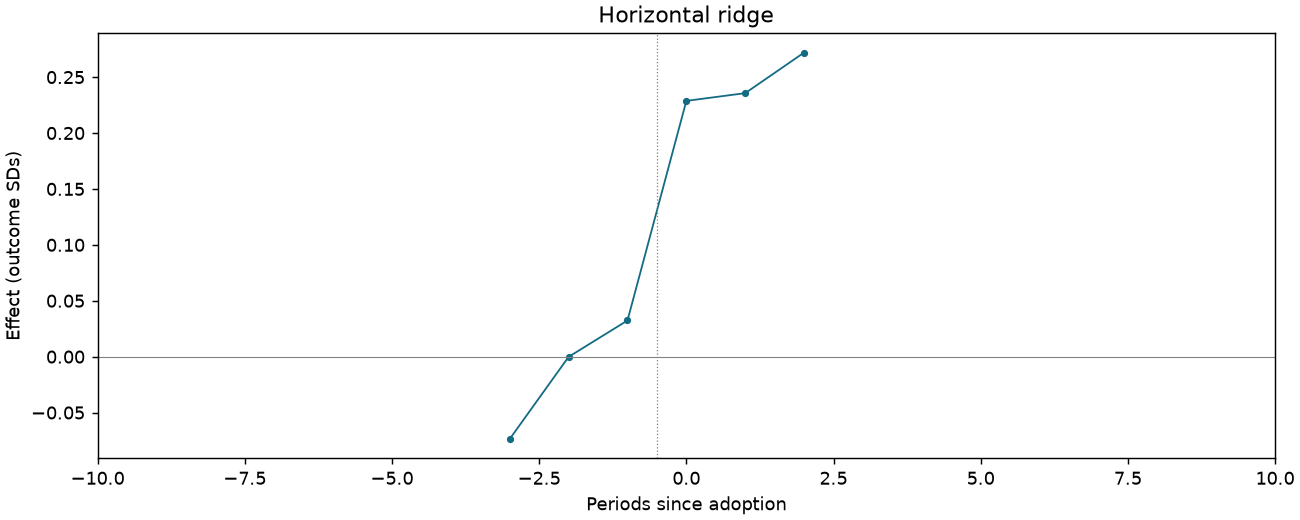
CI-F4-C-DYNAMIC
1,083 observations · 19 units · 19 clusters · 13 treated / 6 control units.
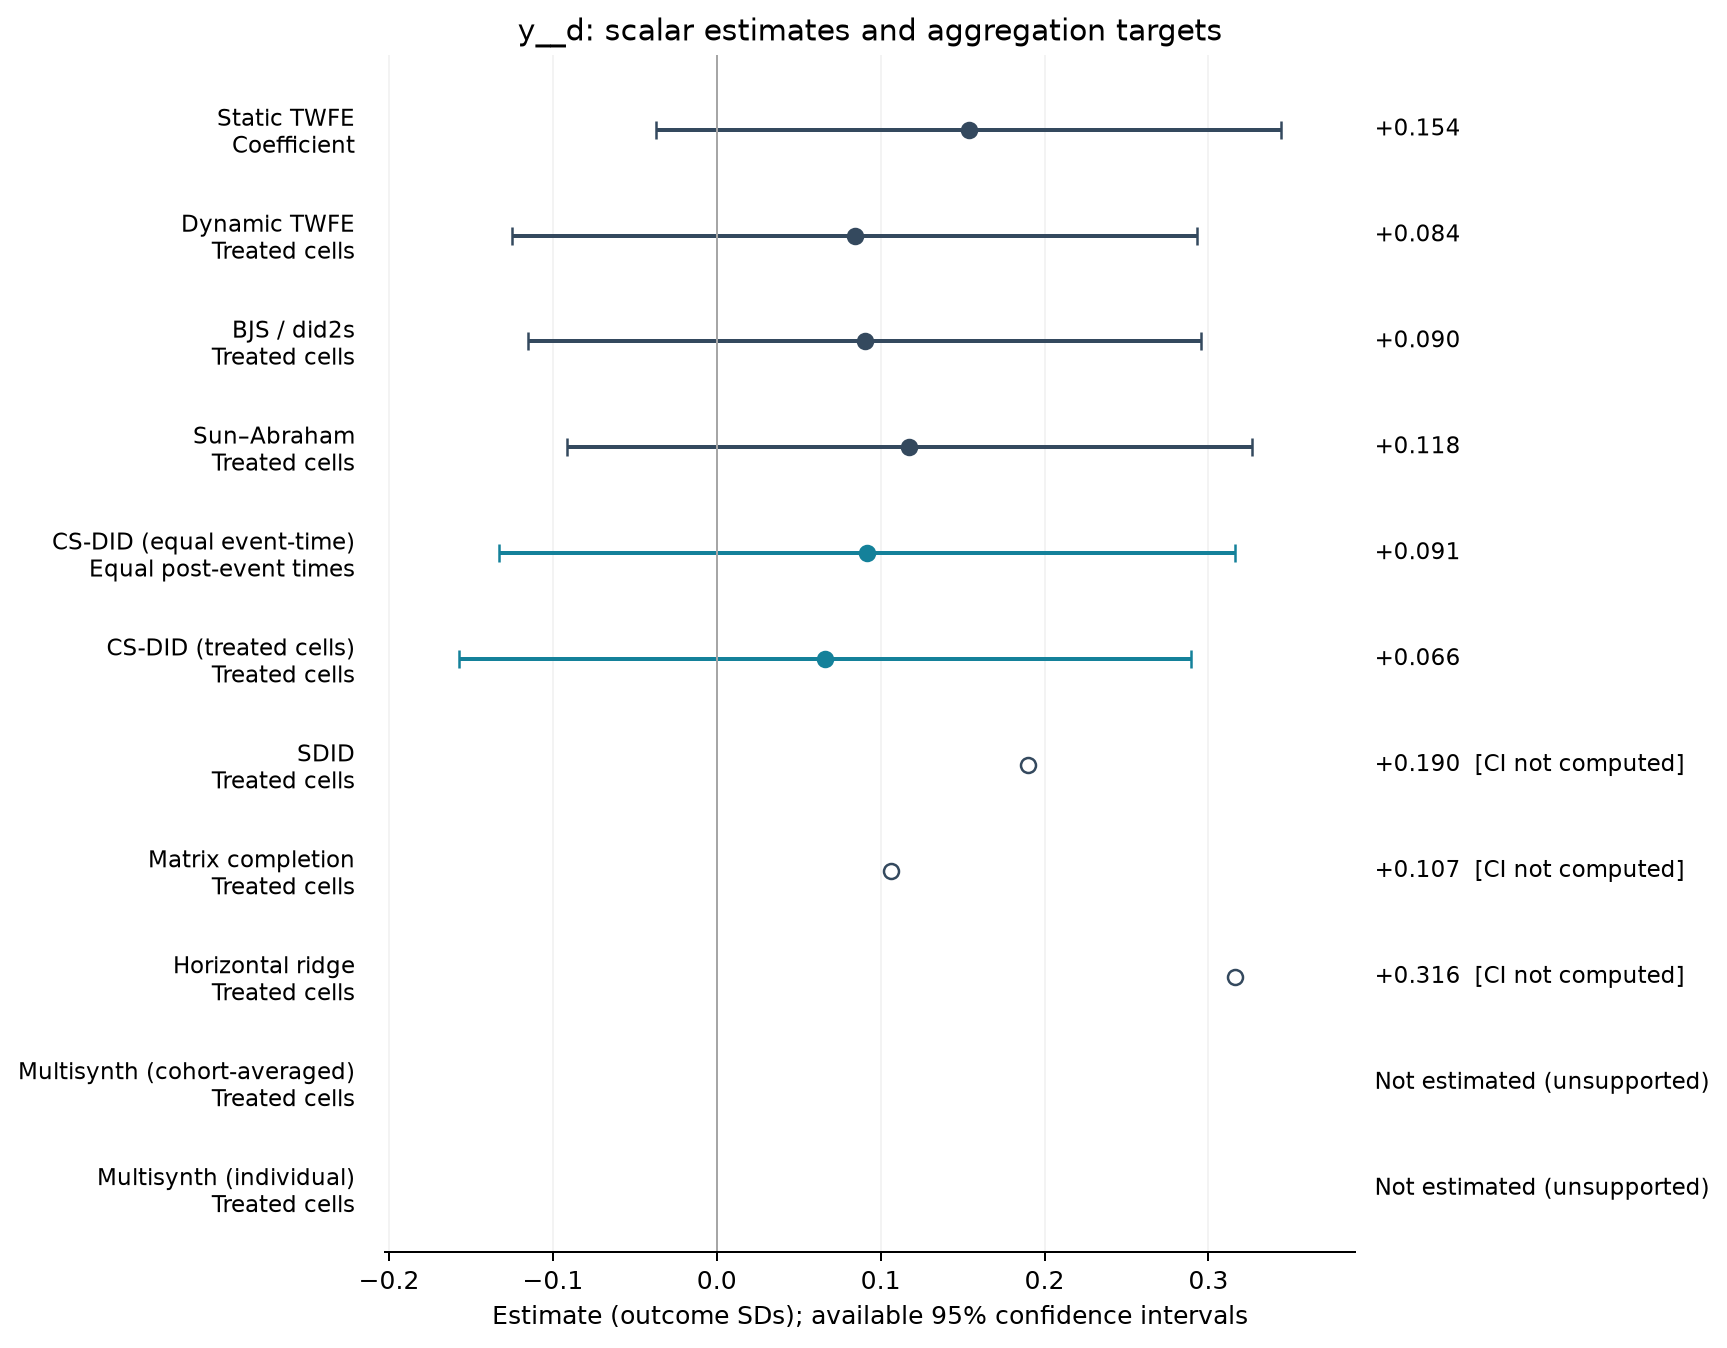
Estimate comparison
| Estimator | Estimate (SDs) | SE | 95% CI | Averaging |
|---|---|---|---|---|
| Static TWFE | 0.154 | 0.091 | [-0.037, 0.344] | Coefficient |
| Dynamic TWFE | 0.084 | 0.099 | [-0.125, 0.293] | Treated cells |
| BJS / did2s | 0.090 | 0.098 | [-0.115, 0.296] | Treated cells |
| Sun–Abraham | 0.118 | 0.099 | [-0.091, 0.326] | Treated cells |
| CS-DID (equal event-time) | 0.091 | 0.115 | [-0.133, 0.316] | Equal post-event times |
| CS-DID (treated cells) | 0.066 | 0.114 | [-0.157, 0.290] | Treated cells |
| SDID | 0.190 | — | — | Treated cells |
| Matrix completion | 0.107 | — | — | Treated cells |
| Horizontal ridge | 0.316 | — | — | Treated cells |
Event studies
Periods −10 to +10; pointwise 95% intervals where available.
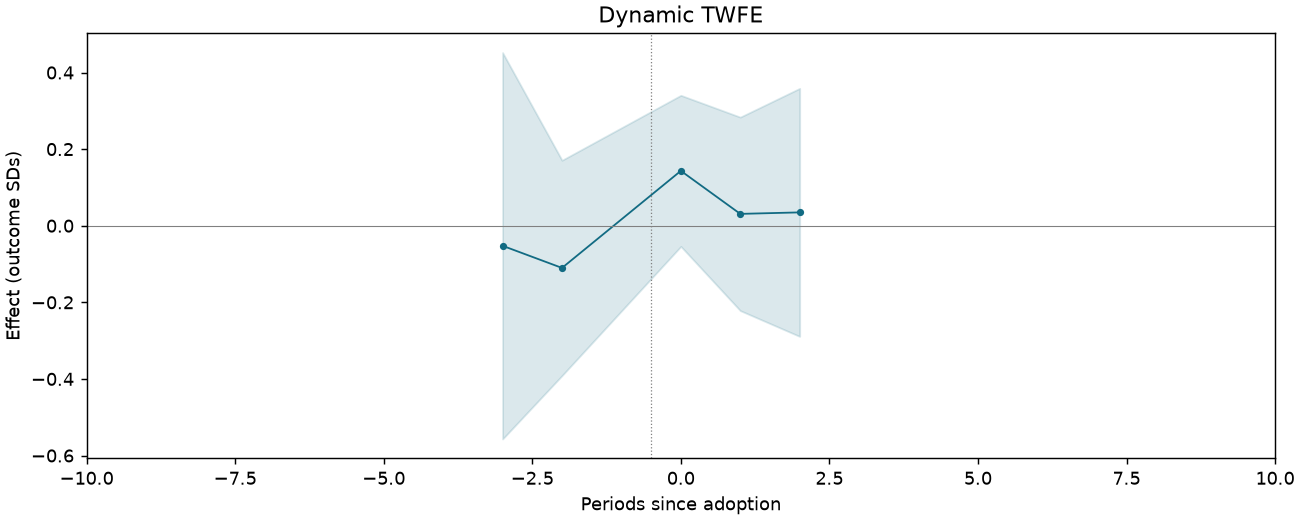
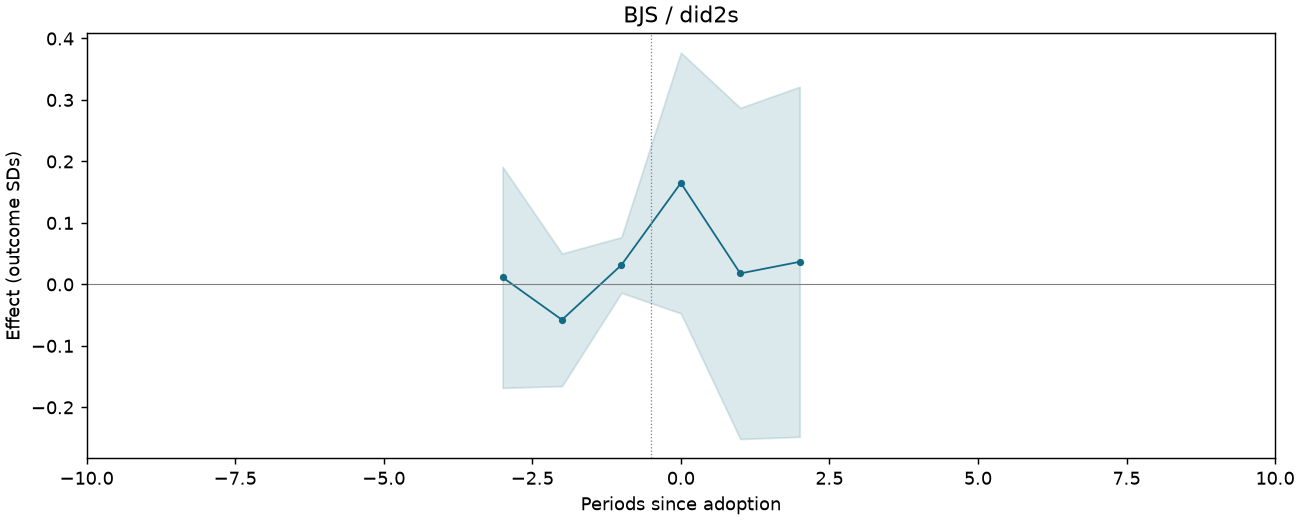
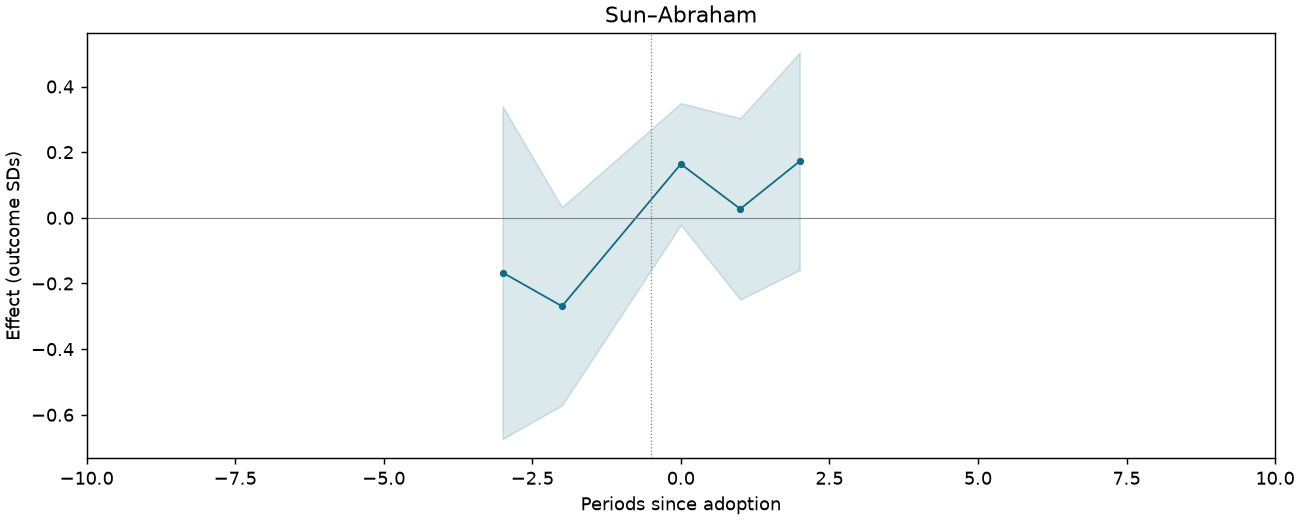
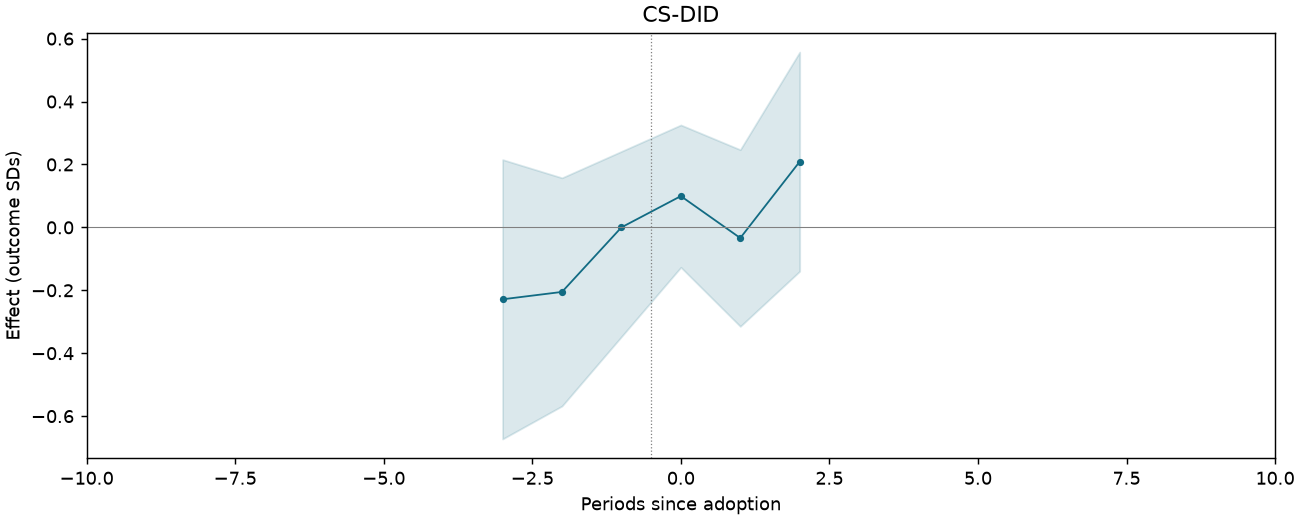
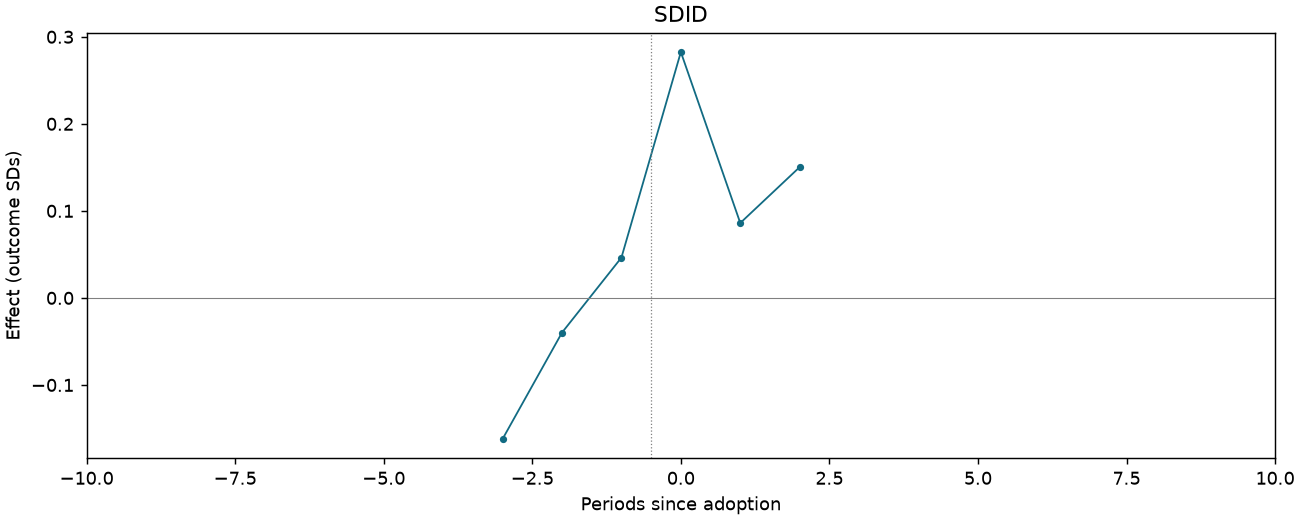
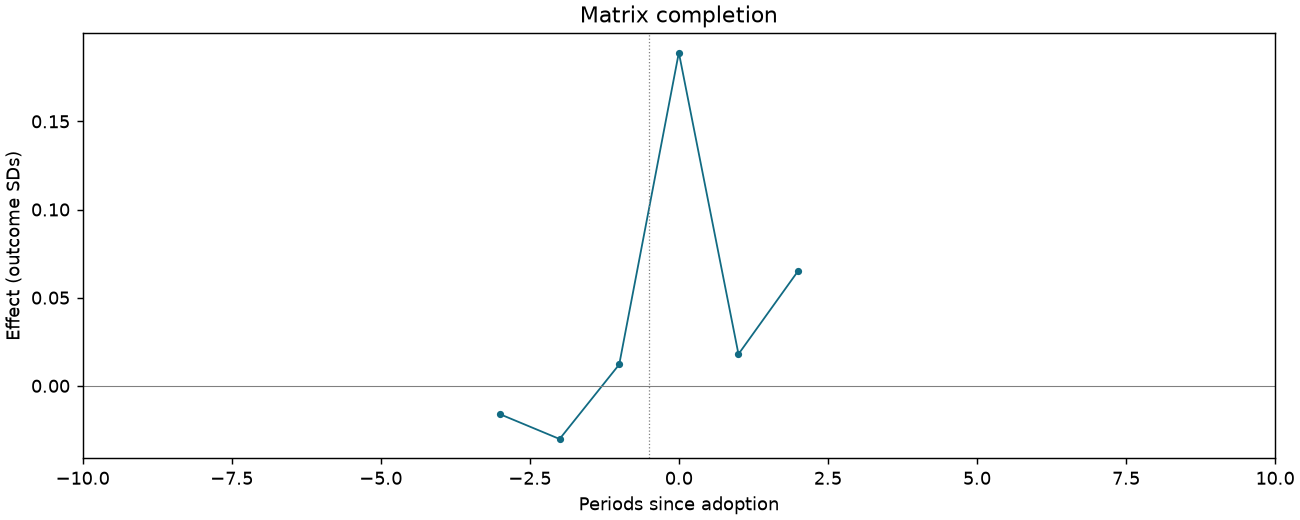
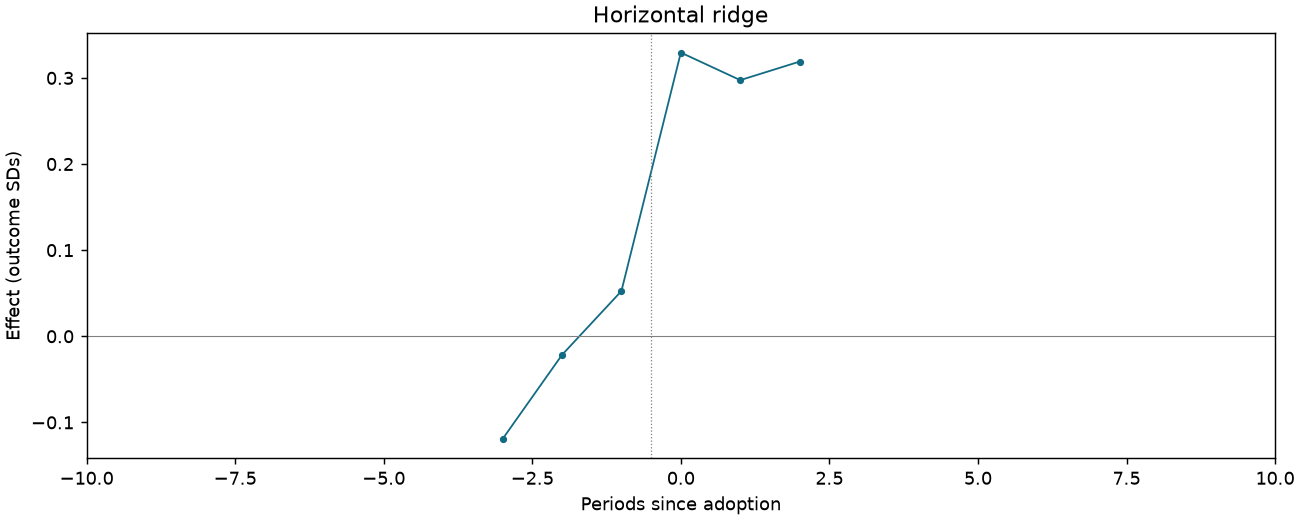
CI-F4-D-DYNAMIC
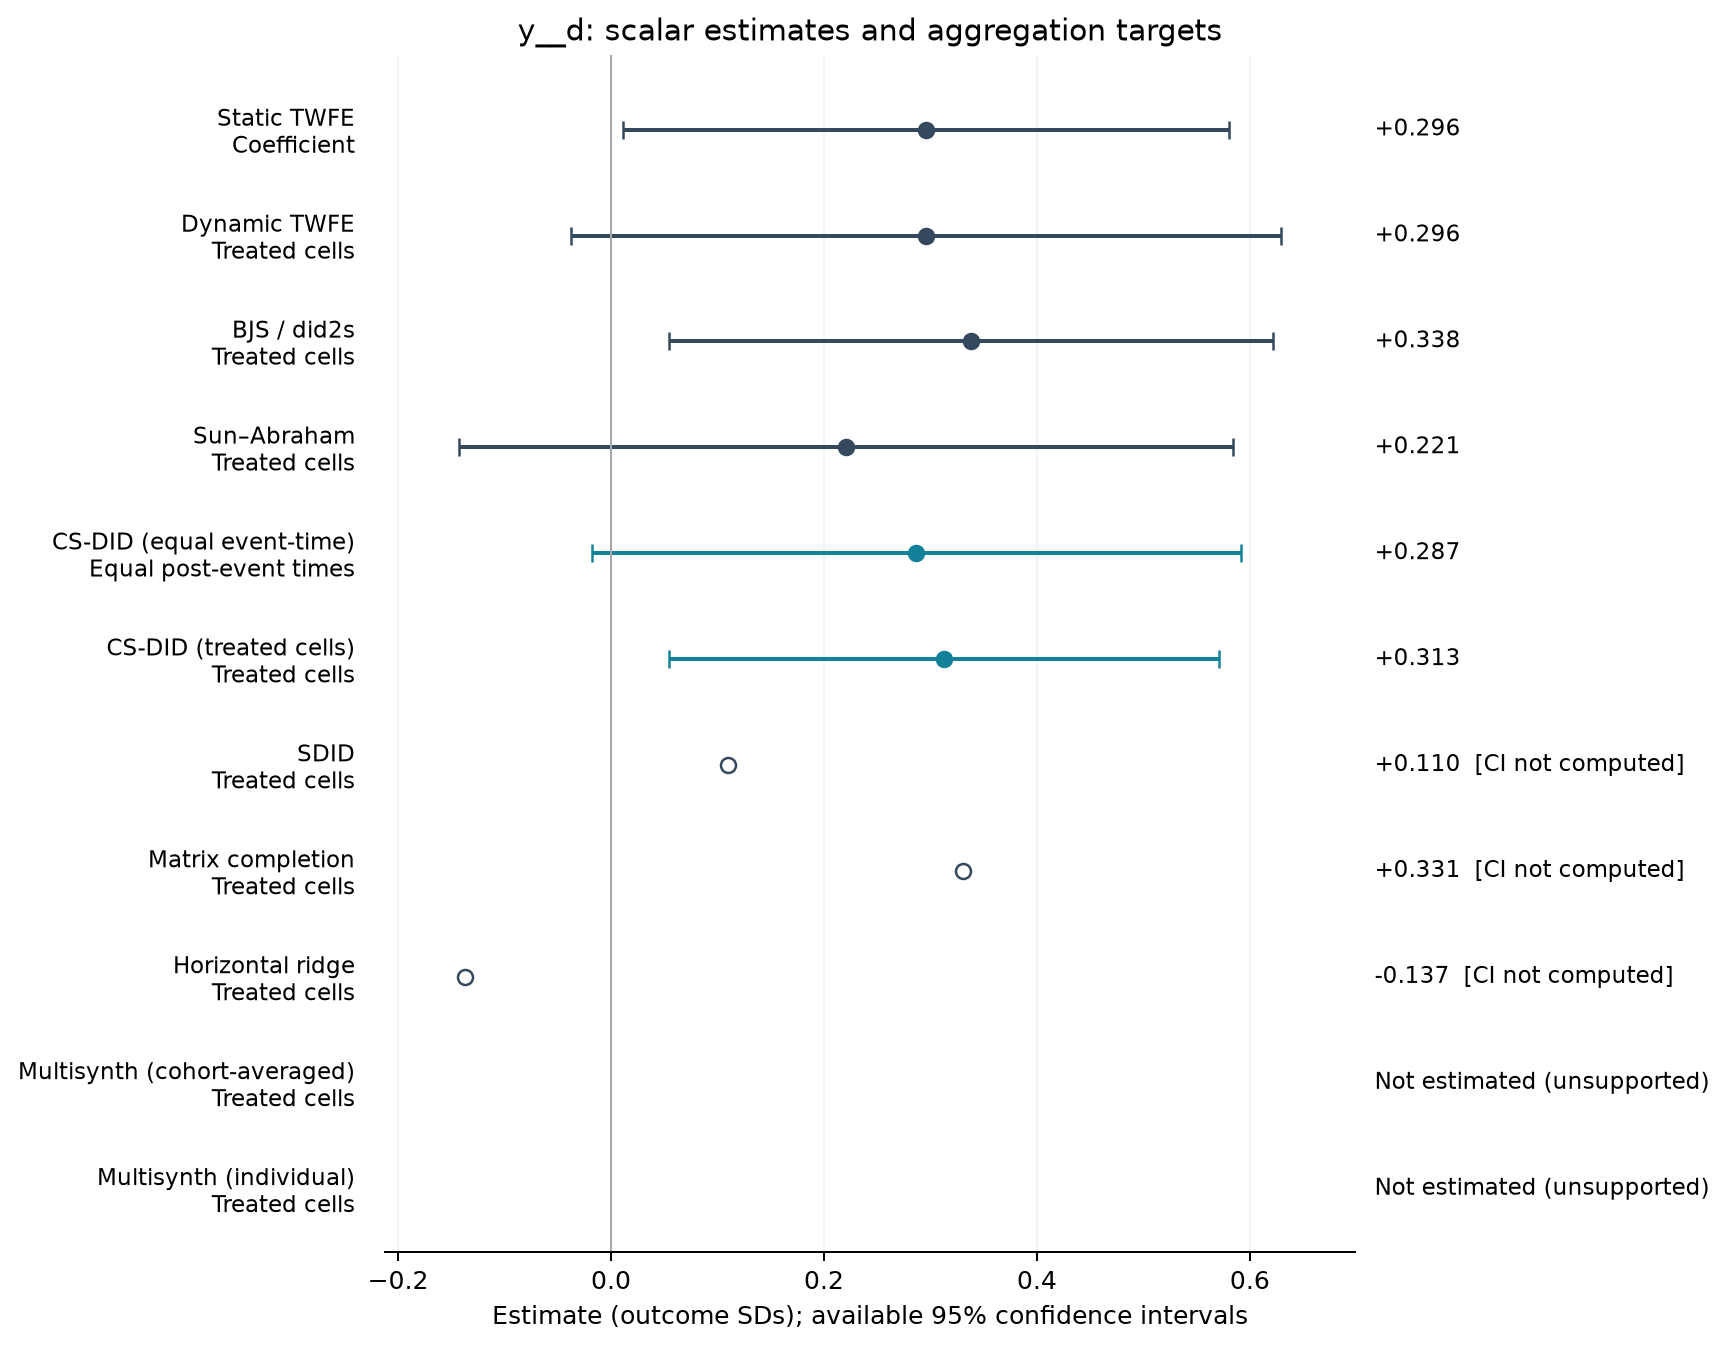
1,036 observations · 19 units · 19 clusters · 13 treated / 6 control units.
Estimate comparison
| Estimator | Estimate (SDs) | SE | 95% CI | Averaging |
|---|---|---|---|---|
| Static TWFE | 0.296 | 0.135 | [0.011, 0.580] | Coefficient |
| Dynamic TWFE | 0.296 | 0.159 | [-0.038, 0.629] | Treated cells |
| BJS / did2s | 0.338 | 0.135 | [0.054, 0.622] | Treated cells |
| Sun–Abraham | 0.221 | 0.173 | [-0.143, 0.584] | Treated cells |
| CS-DID (equal event-time) | 0.287 | 0.155 | [-0.018, 0.591] | Equal post-event times |
| CS-DID (treated cells) | 0.313 | 0.132 | [0.055, 0.571] | Treated cells |
| SDID | 0.110 | — | — | Treated cells |
| Matrix completion | 0.331 | — | — | Treated cells |
| Horizontal ridge | -0.137 | — | — | Treated cells |
Event studies
Periods −10 to +10; pointwise 95% intervals where available.
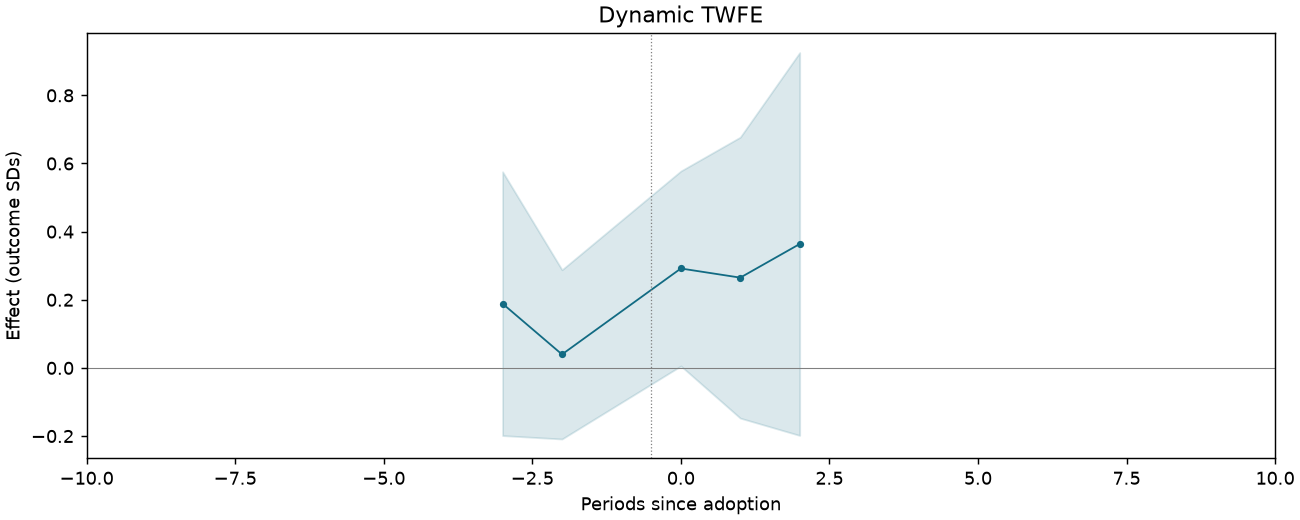
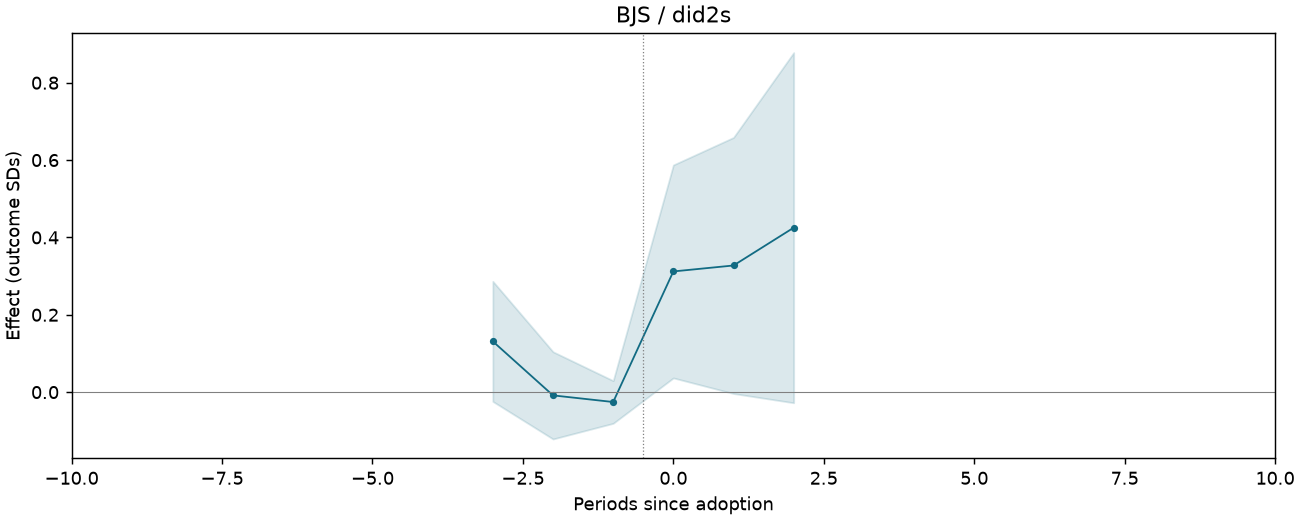
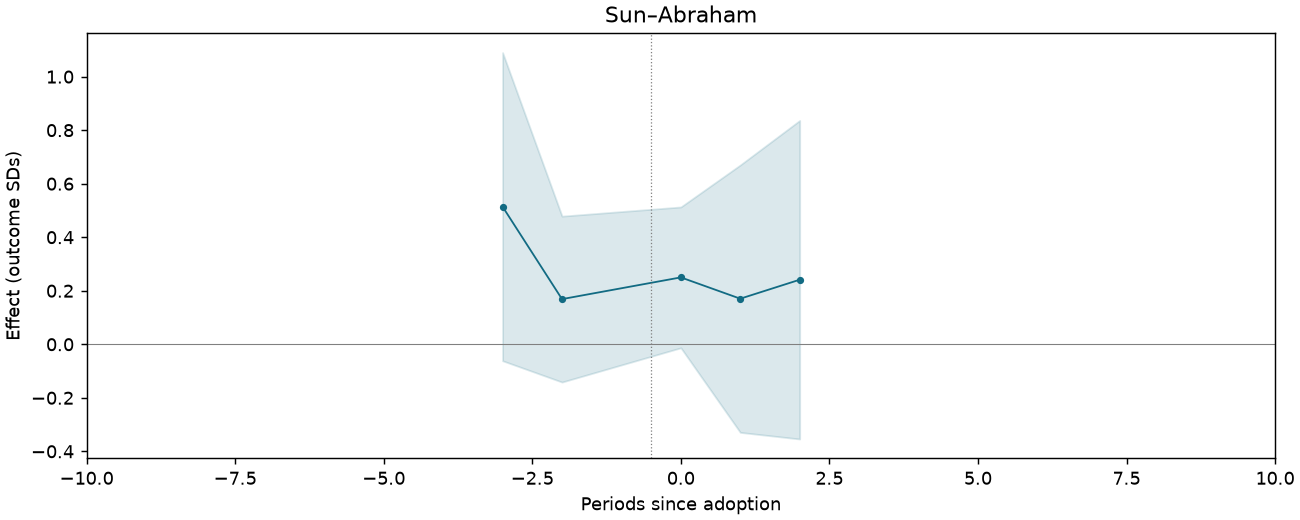
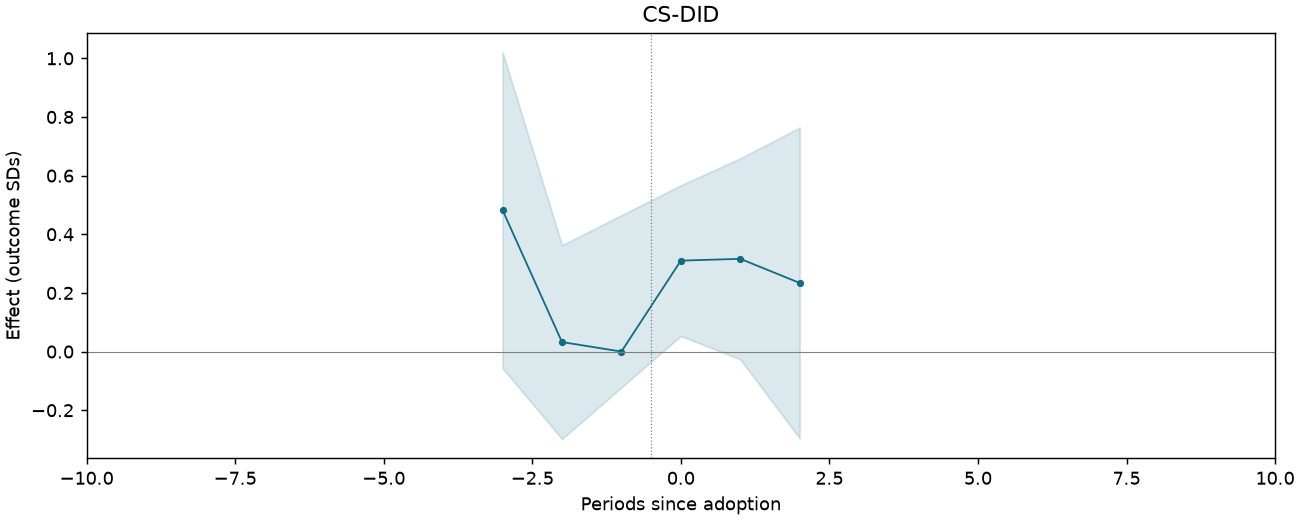
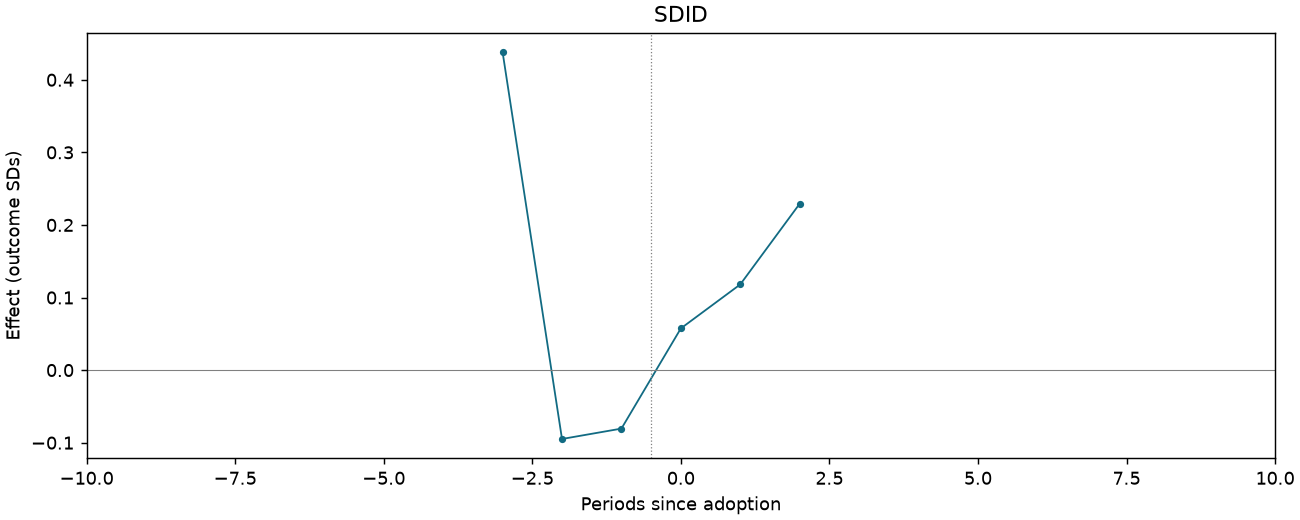
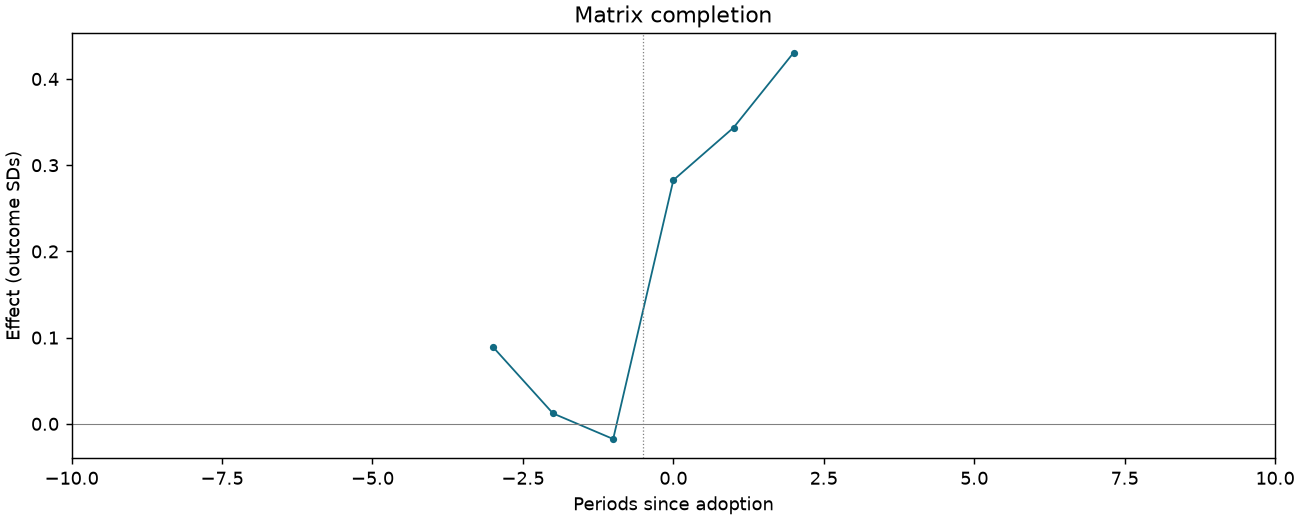
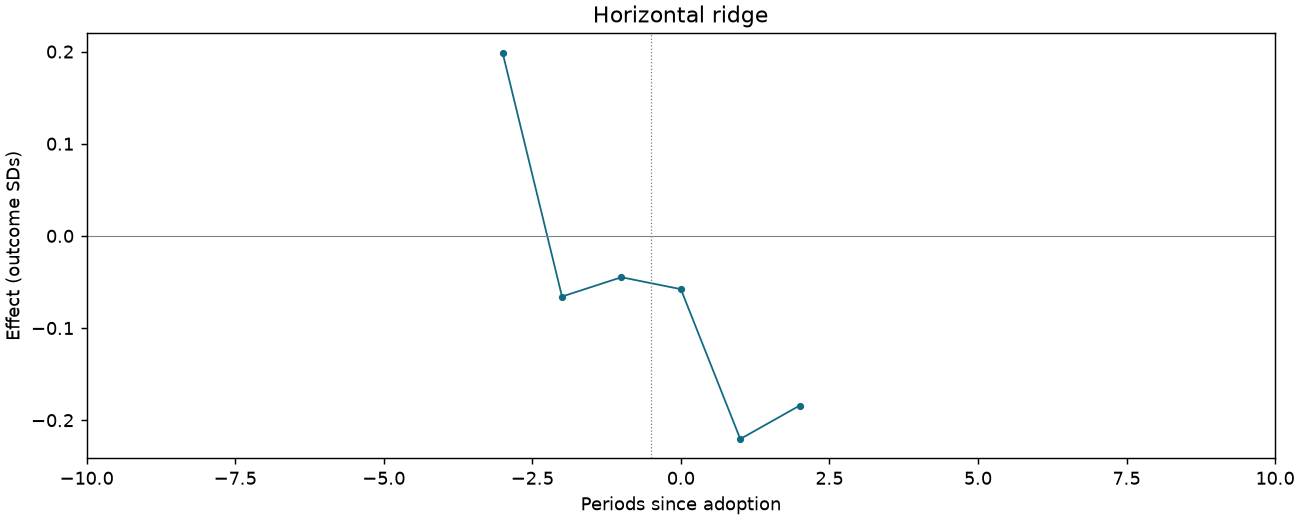
CI-F4-E-DYNAMIC
1,083 observations · 19 units · 19 clusters · 13 treated / 6 control units.
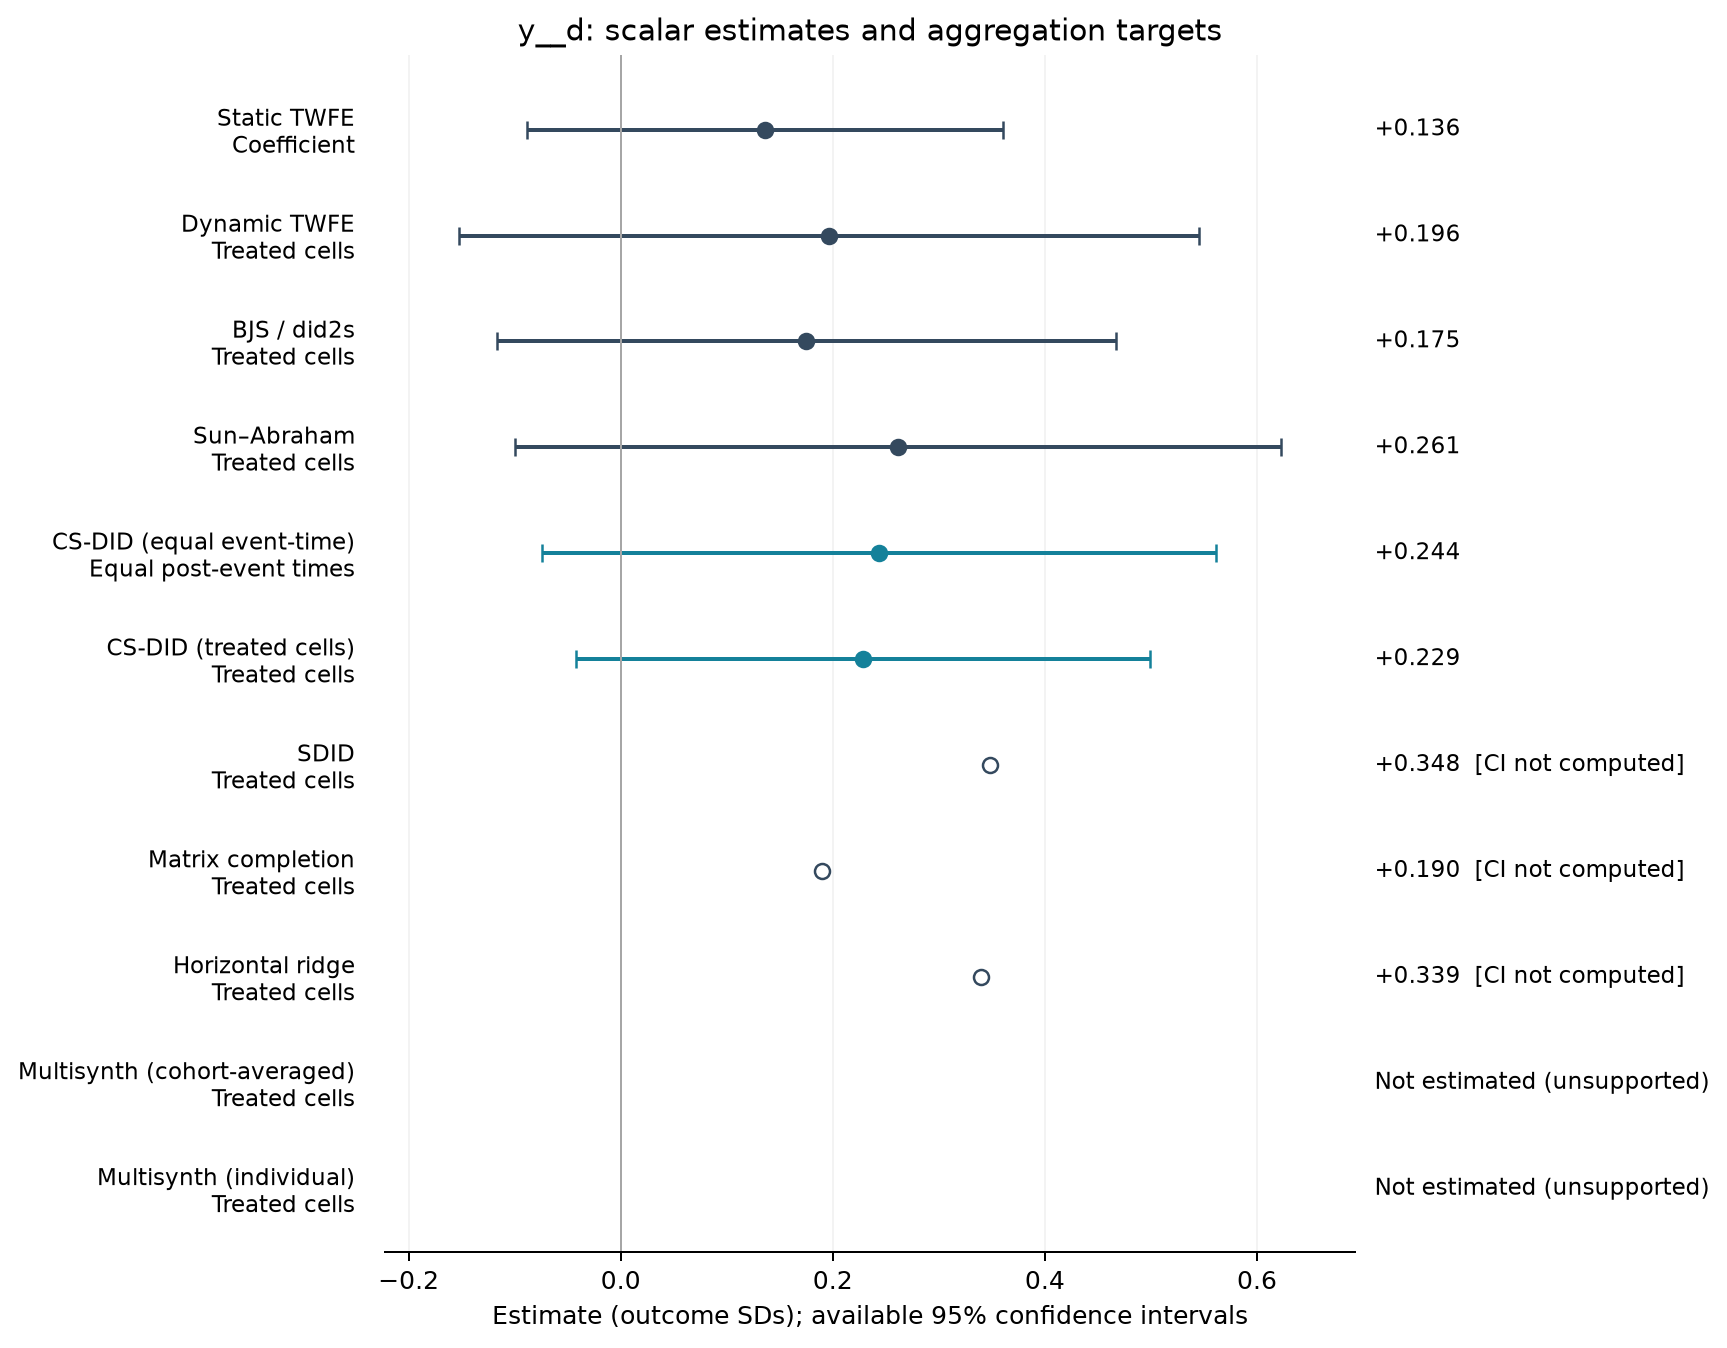
Estimate comparison
| Estimator | Estimate (SDs) | SE | 95% CI | Averaging |
|---|---|---|---|---|
| Static TWFE | 0.136 | 0.107 | [-0.088, 0.361] | Coefficient |
| Dynamic TWFE | 0.196 | 0.166 | [-0.152, 0.545] | Treated cells |
| BJS / did2s | 0.175 | 0.139 | [-0.117, 0.467] | Treated cells |
| Sun–Abraham | 0.261 | 0.172 | [-0.100, 0.623] | Treated cells |
| CS-DID (equal event-time) | 0.244 | 0.162 | [-0.074, 0.562] | Equal post-event times |
| CS-DID (treated cells) | 0.229 | 0.138 | [-0.042, 0.499] | Treated cells |
| SDID | 0.348 | — | — | Treated cells |
| Matrix completion | 0.190 | — | — | Treated cells |
| Horizontal ridge | 0.339 | — | — | Treated cells |
Event studies
Periods −10 to +10; pointwise 95% intervals where available.
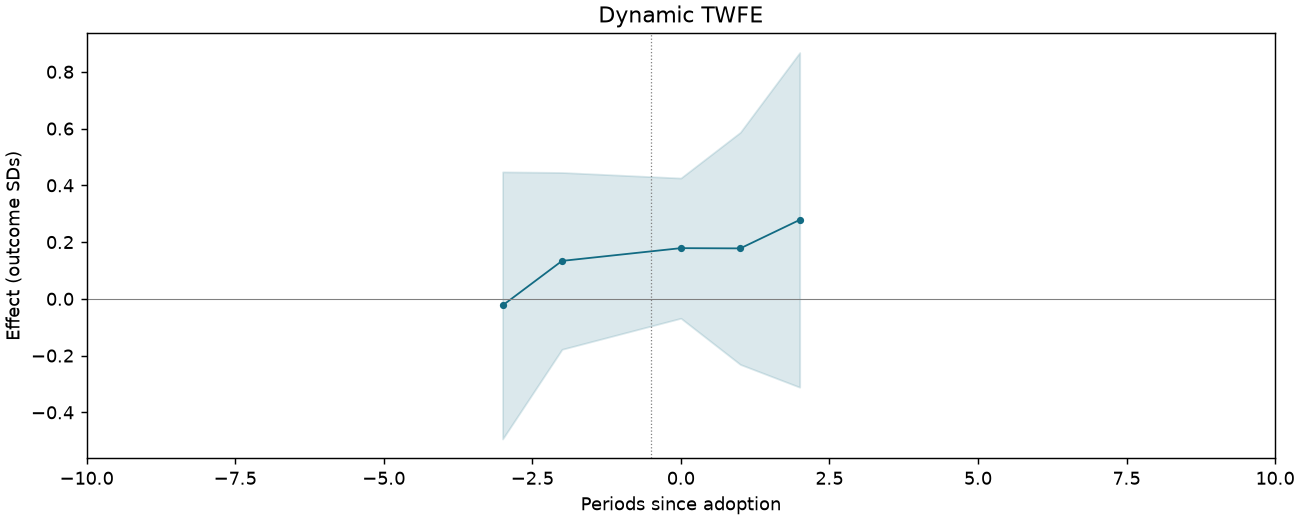
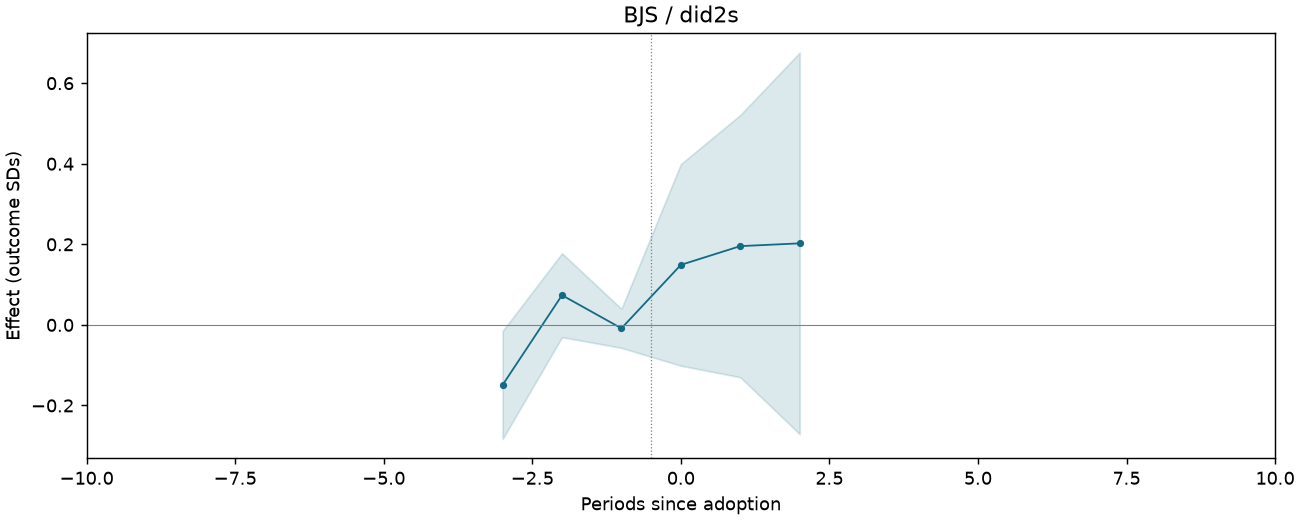
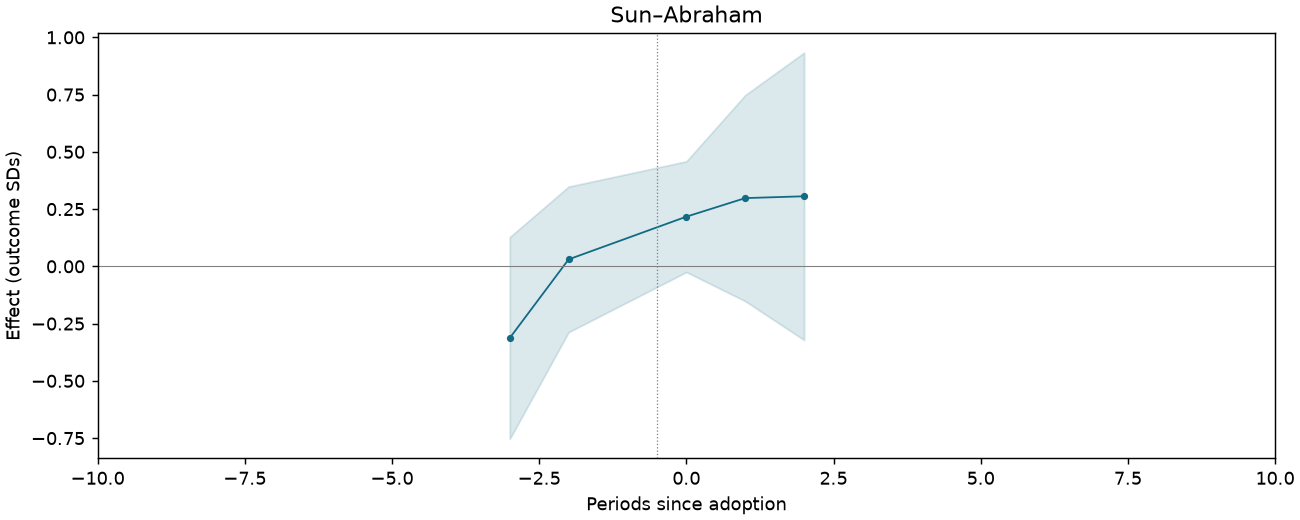
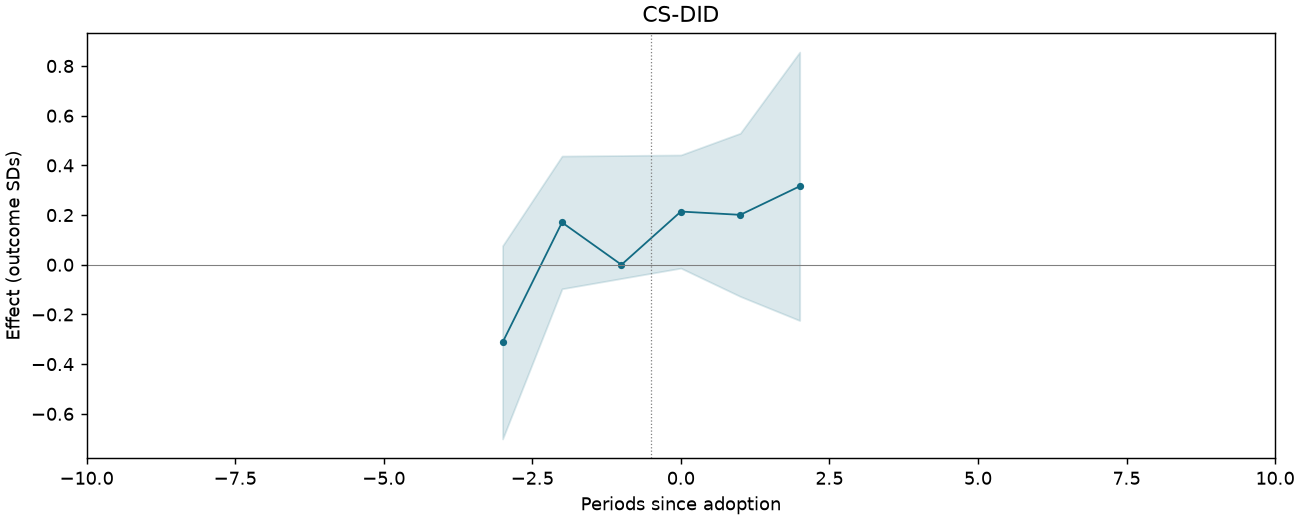
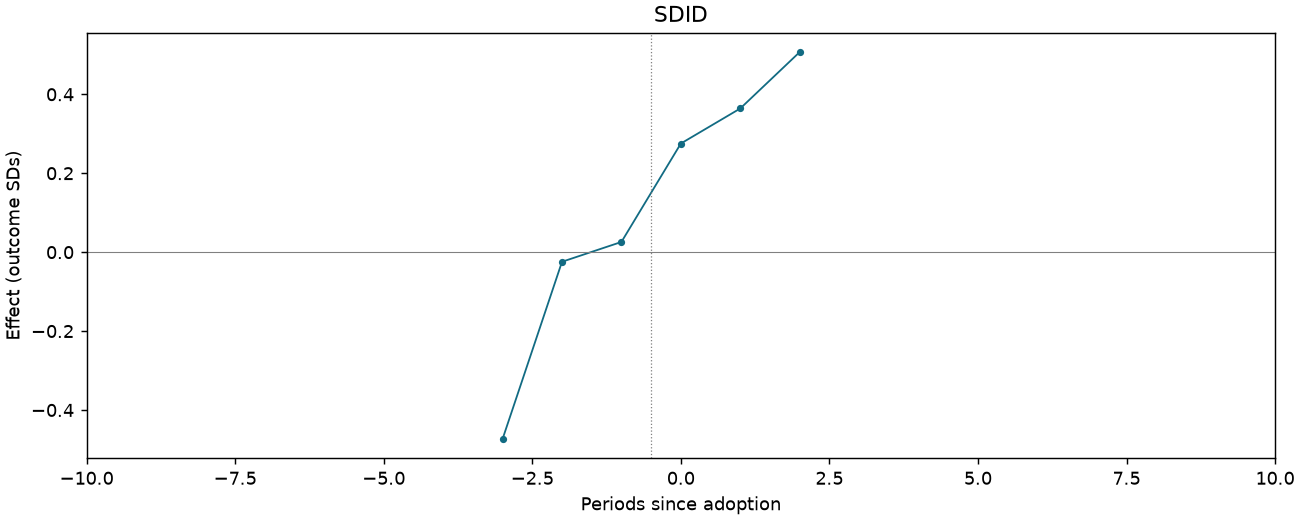
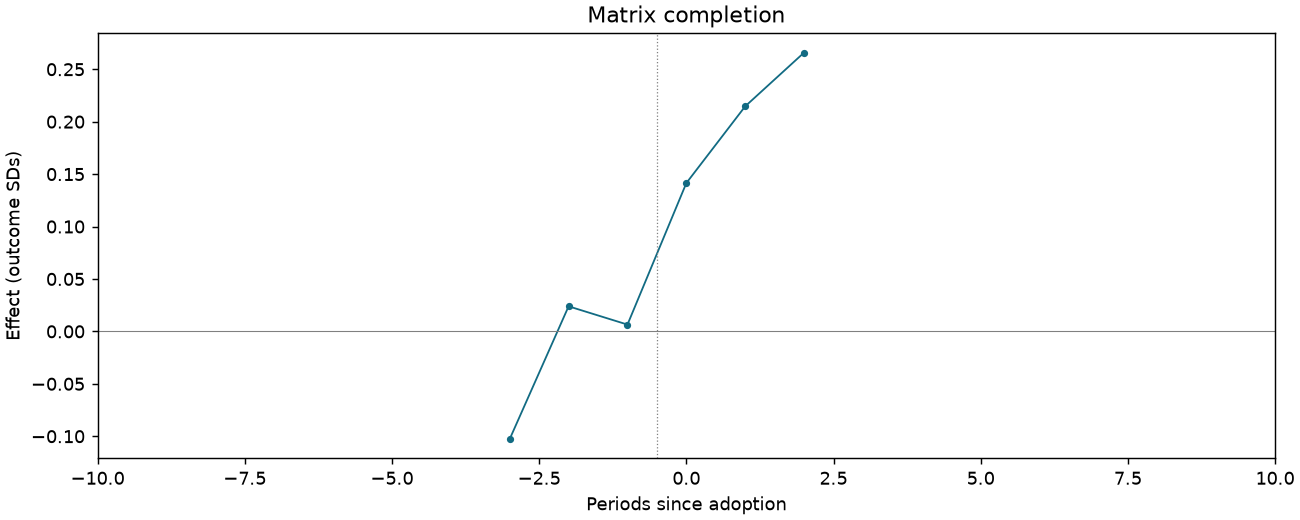
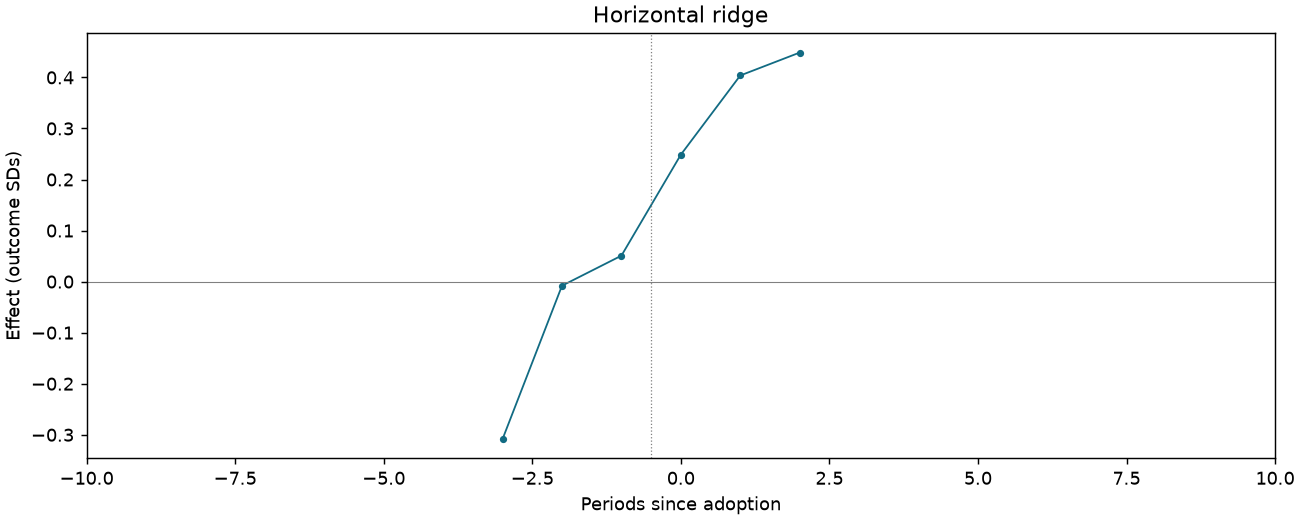
CI-F4-F-DYNAMIC
1,014 observations · 19 units · 19 clusters · 13 treated / 6 control units.
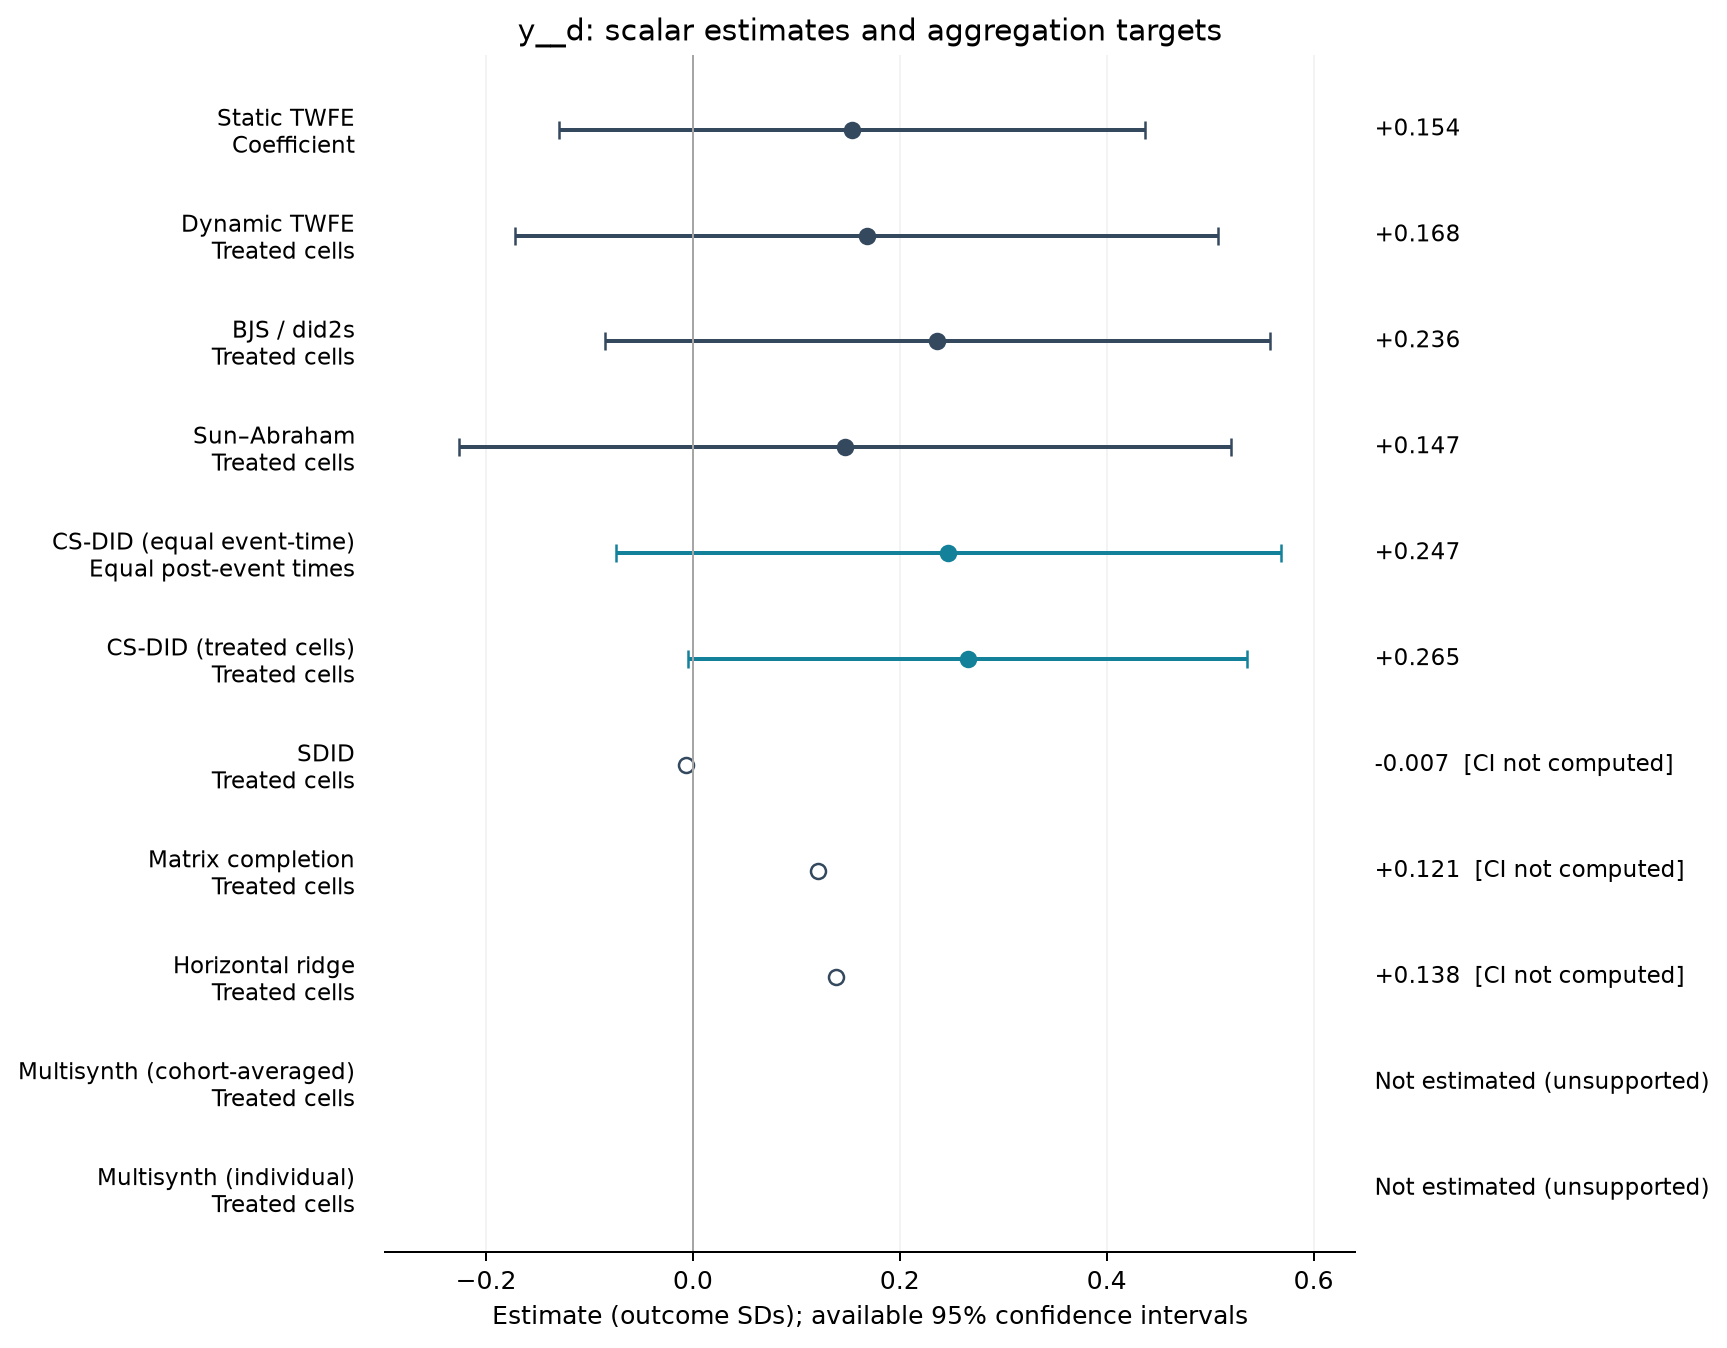
Estimate comparison
| Estimator | Estimate (SDs) | SE | 95% CI | Averaging |
|---|---|---|---|---|
| Static TWFE | 0.154 | 0.135 | [-0.130, 0.437] | Coefficient |
| Dynamic TWFE | 0.168 | 0.162 | [-0.172, 0.508] | Treated cells |
| BJS / did2s | 0.236 | 0.153 | [-0.085, 0.557] | Treated cells |
| Sun–Abraham | 0.147 | 0.178 | [-0.226, 0.520] | Treated cells |
| CS-DID (equal event-time) | 0.247 | 0.164 | [-0.075, 0.569] | Equal post-event times |
| CS-DID (treated cells) | 0.265 | 0.138 | [-0.004, 0.535] | Treated cells |
| SDID | -0.007 | — | — | Treated cells |
| Matrix completion | 0.121 | — | — | Treated cells |
| Horizontal ridge | 0.138 | — | — | Treated cells |
Event studies
Periods −10 to +10; pointwise 95% intervals where available.
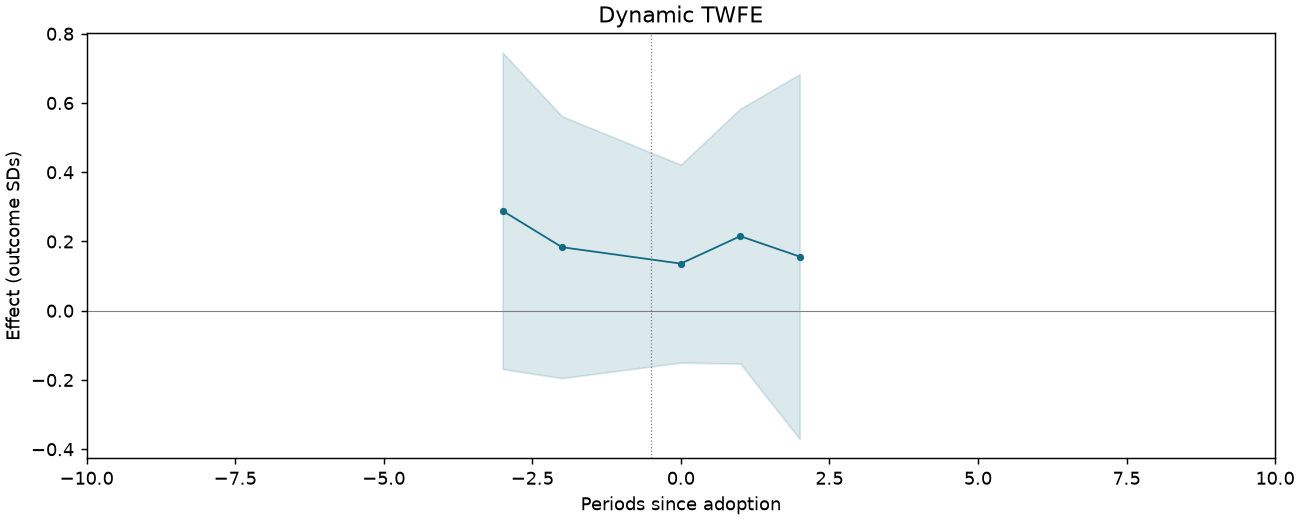
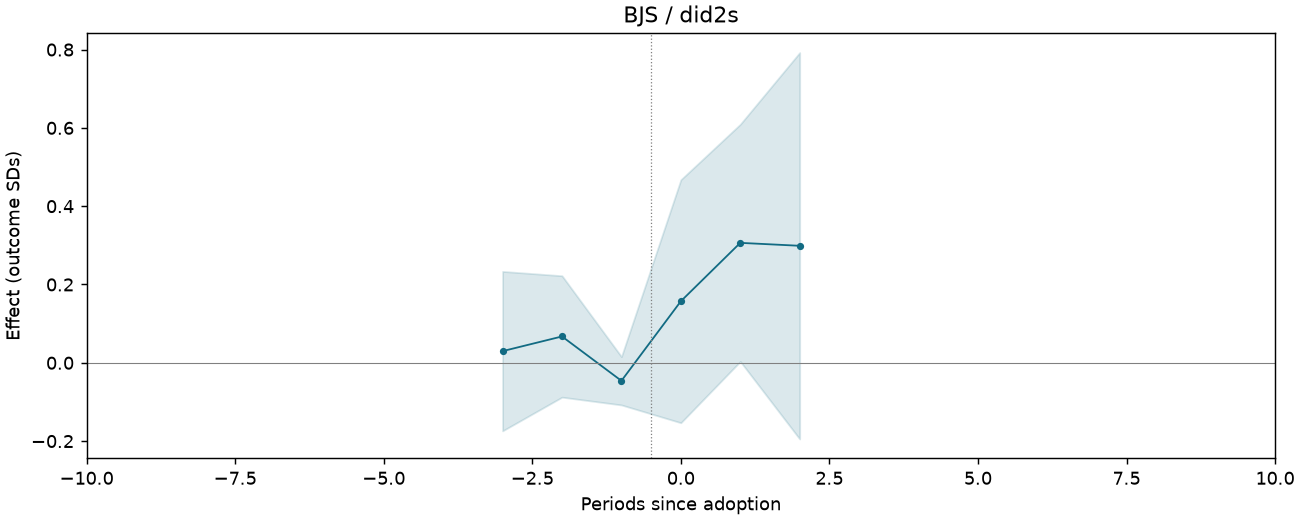
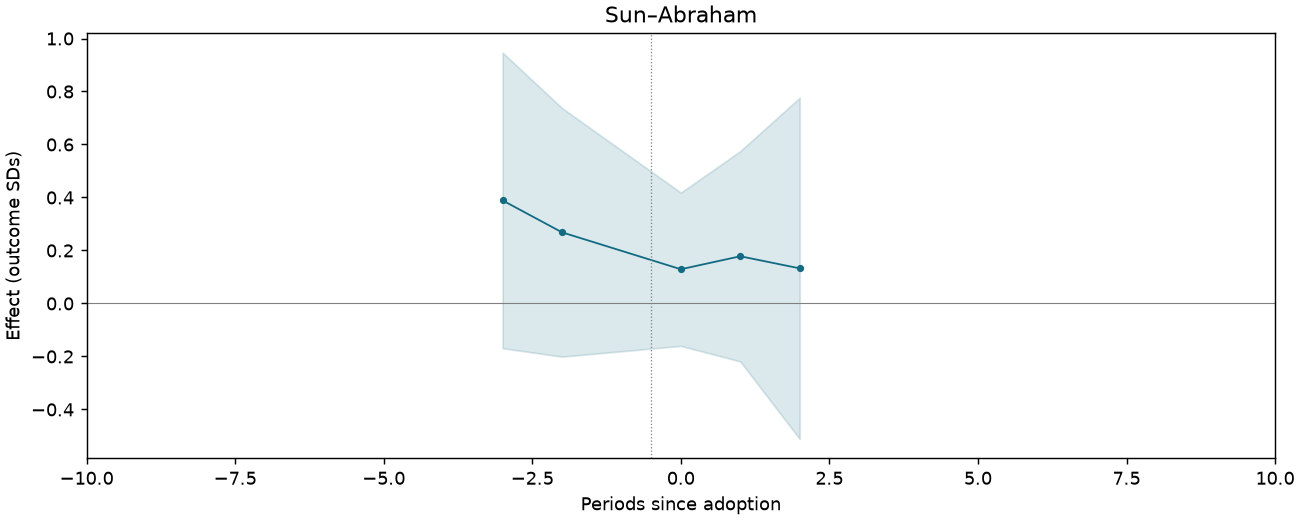
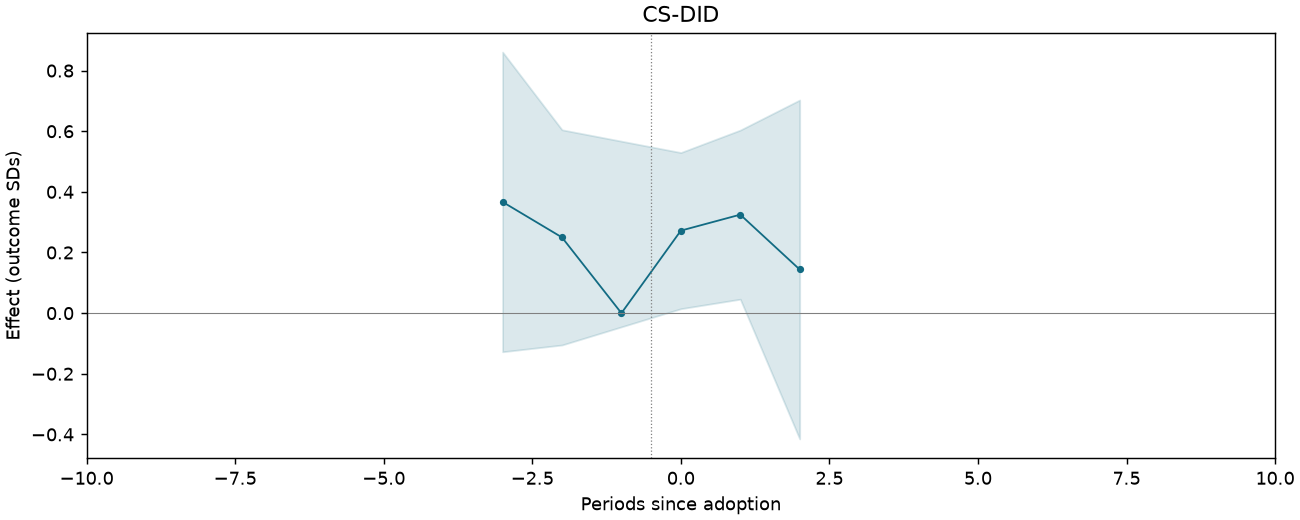
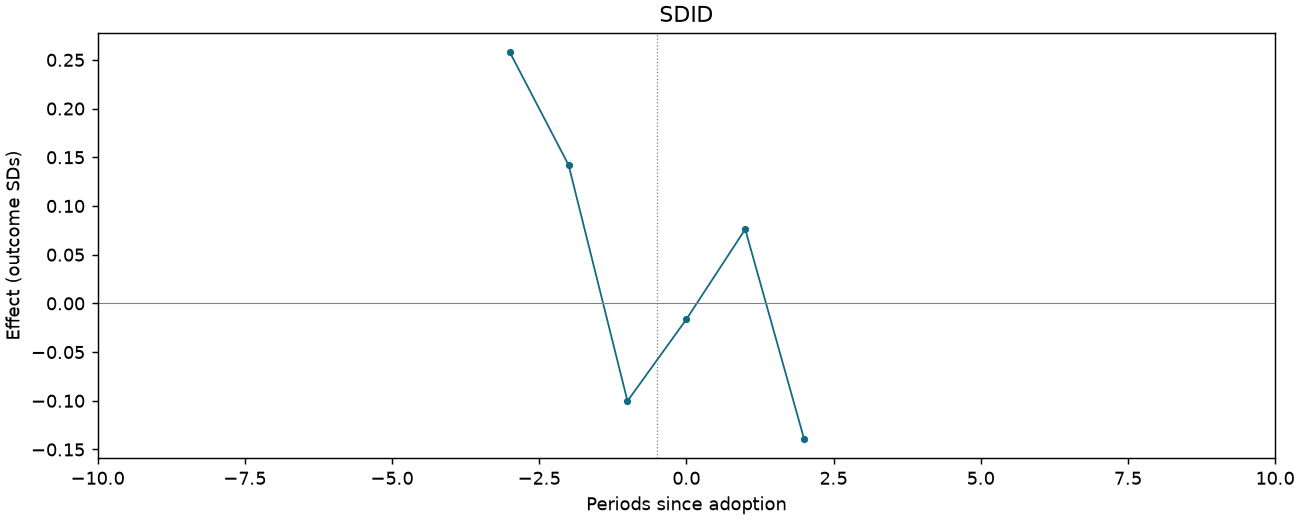
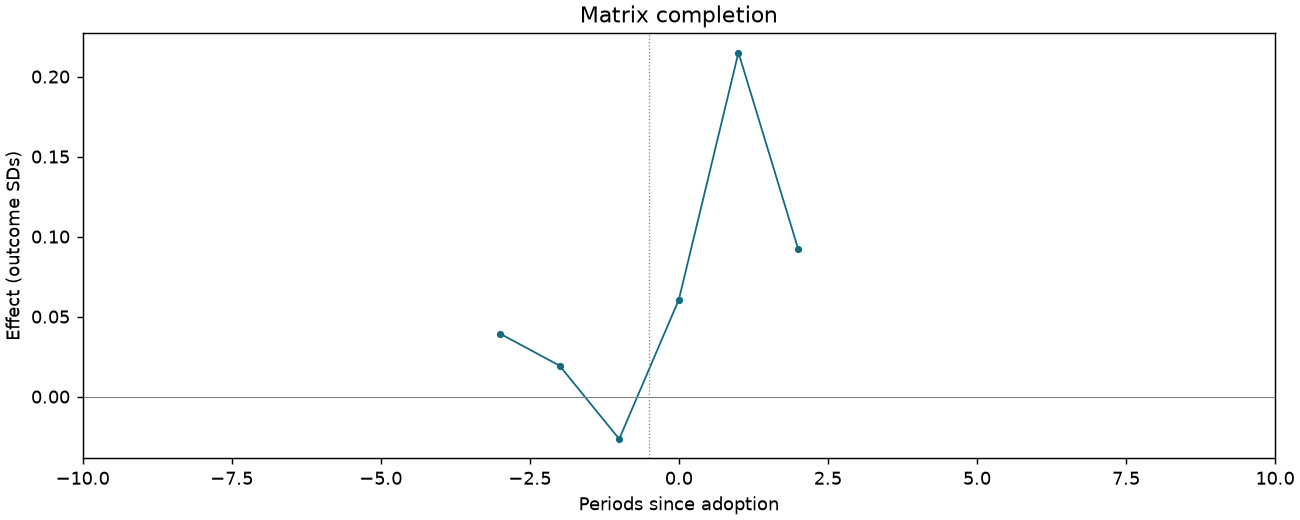
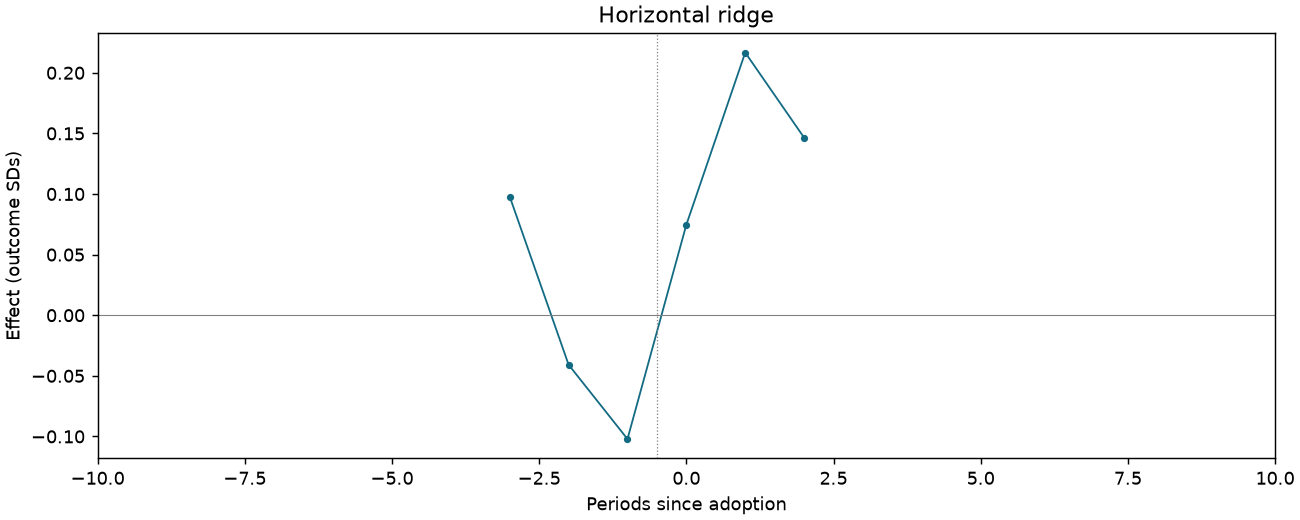
CI-F4-G-DYNAMIC
1,131 observations · 19 units · 19 clusters · 13 treated / 6 control units.
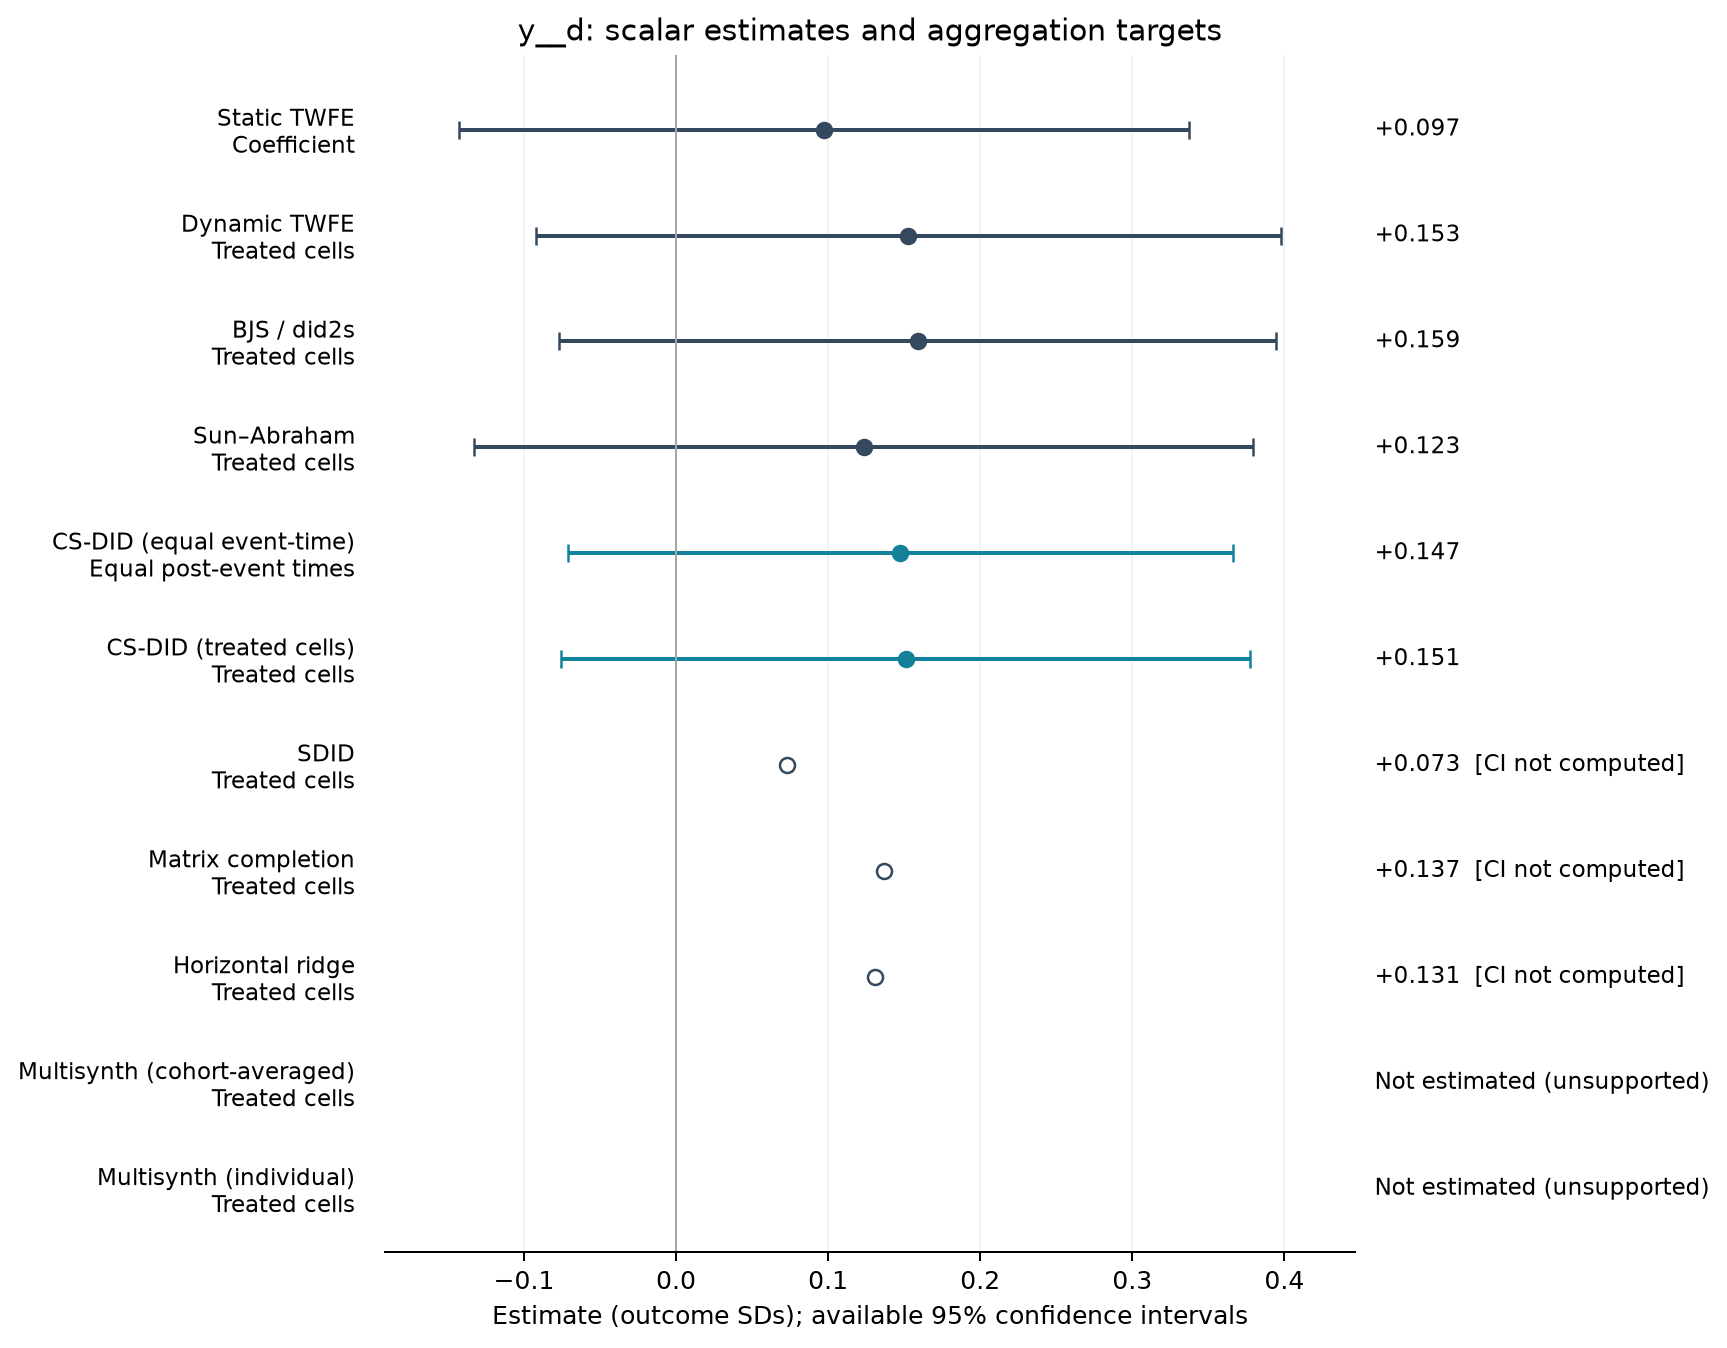
Estimate comparison
| Estimator | Estimate (SDs) | SE | 95% CI | Averaging |
|---|---|---|---|---|
| Static TWFE | 0.097 | 0.114 | [-0.143, 0.337] | Coefficient |
| Dynamic TWFE | 0.153 | 0.117 | [-0.092, 0.398] | Treated cells |
| BJS / did2s | 0.159 | 0.112 | [-0.077, 0.395] | Treated cells |
| Sun–Abraham | 0.123 | 0.122 | [-0.133, 0.380] | Treated cells |
| CS-DID (equal event-time) | 0.147 | 0.111 | [-0.071, 0.366] | Equal post-event times |
| CS-DID (treated cells) | 0.151 | 0.116 | [-0.075, 0.378] | Treated cells |
| SDID | 0.073 | — | — | Treated cells |
| Matrix completion | 0.137 | — | — | Treated cells |
| Horizontal ridge | 0.131 | — | — | Treated cells |
Event studies
Periods −10 to +10; pointwise 95% intervals where available.
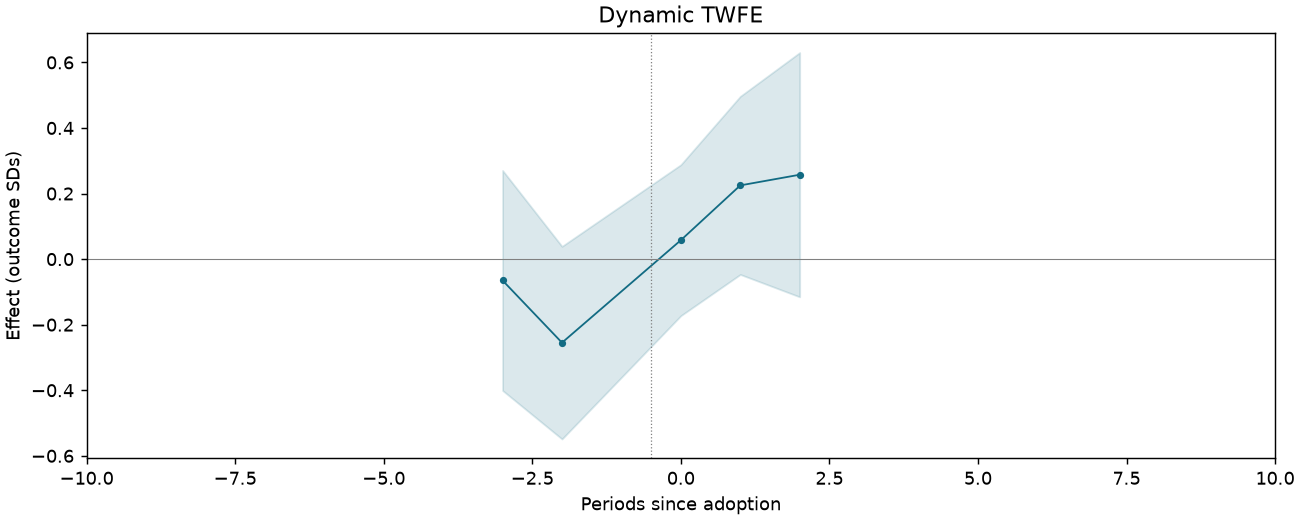
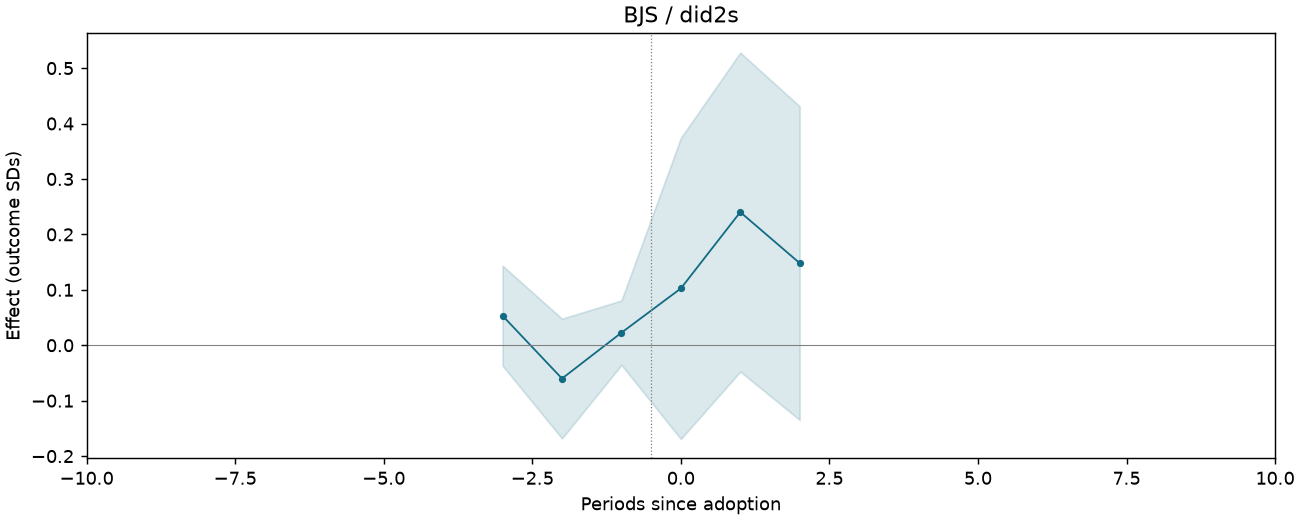
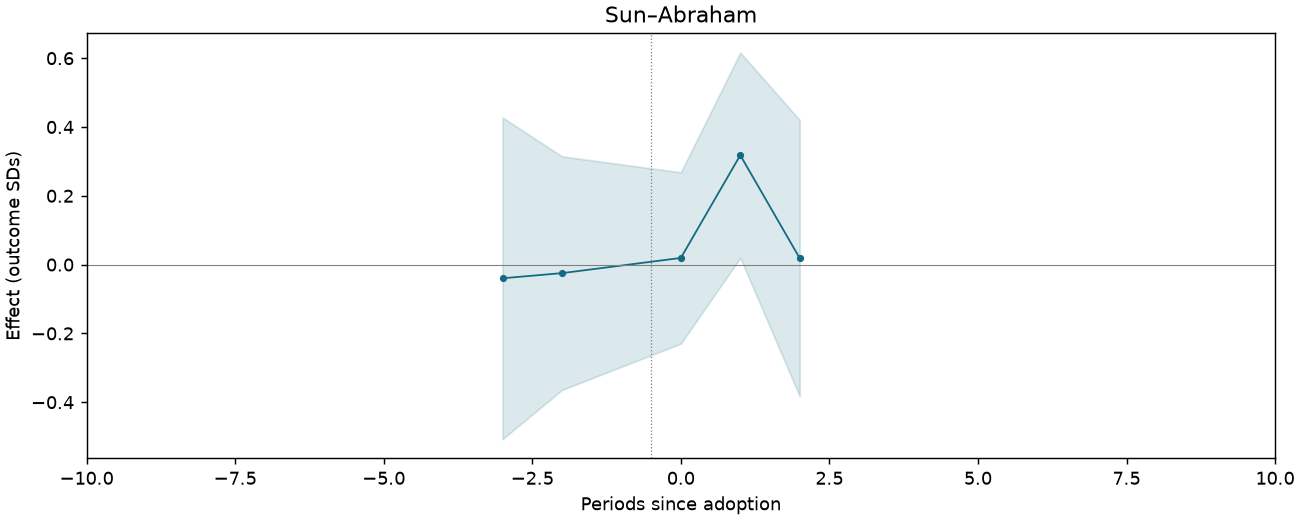
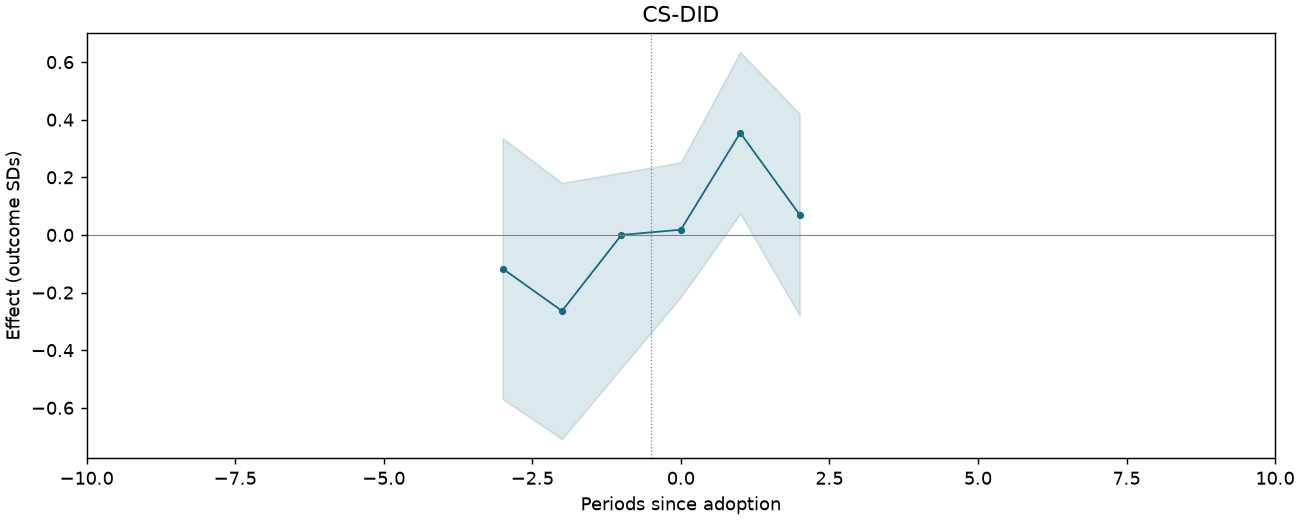
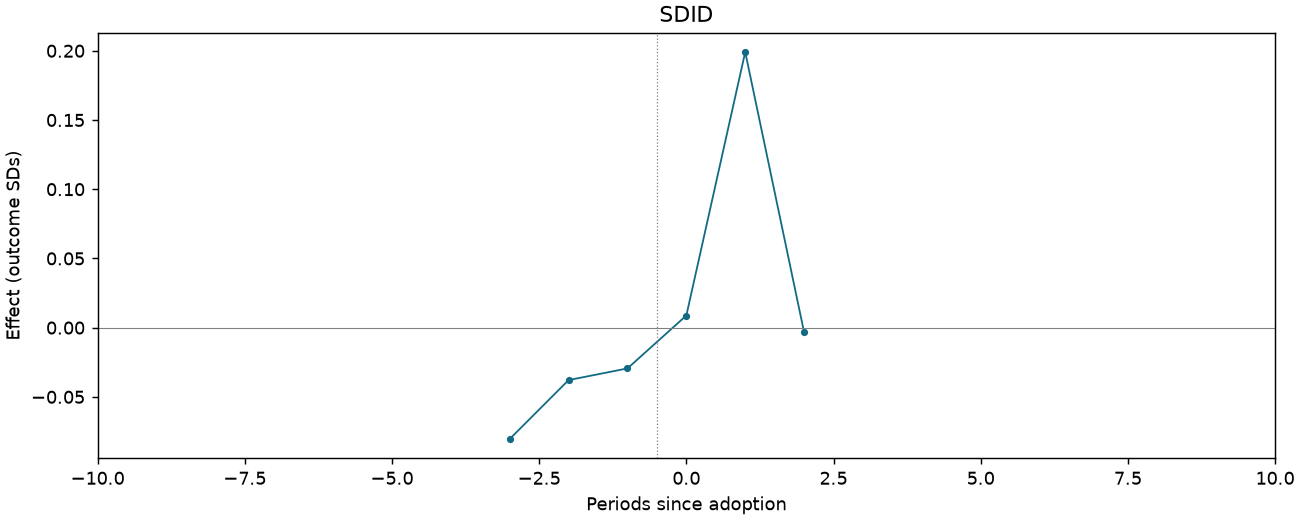
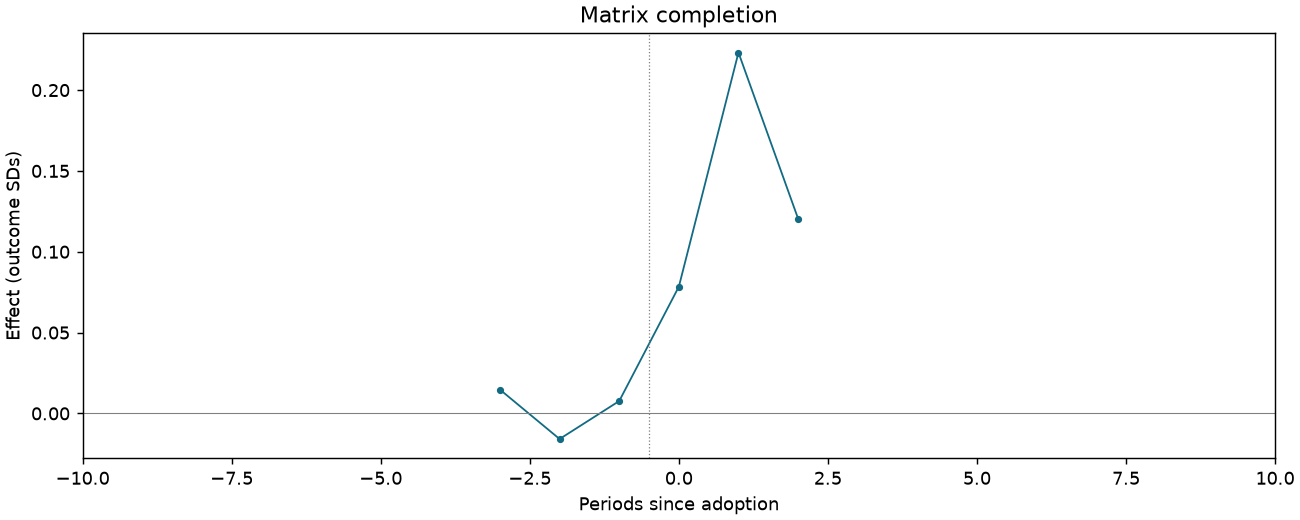
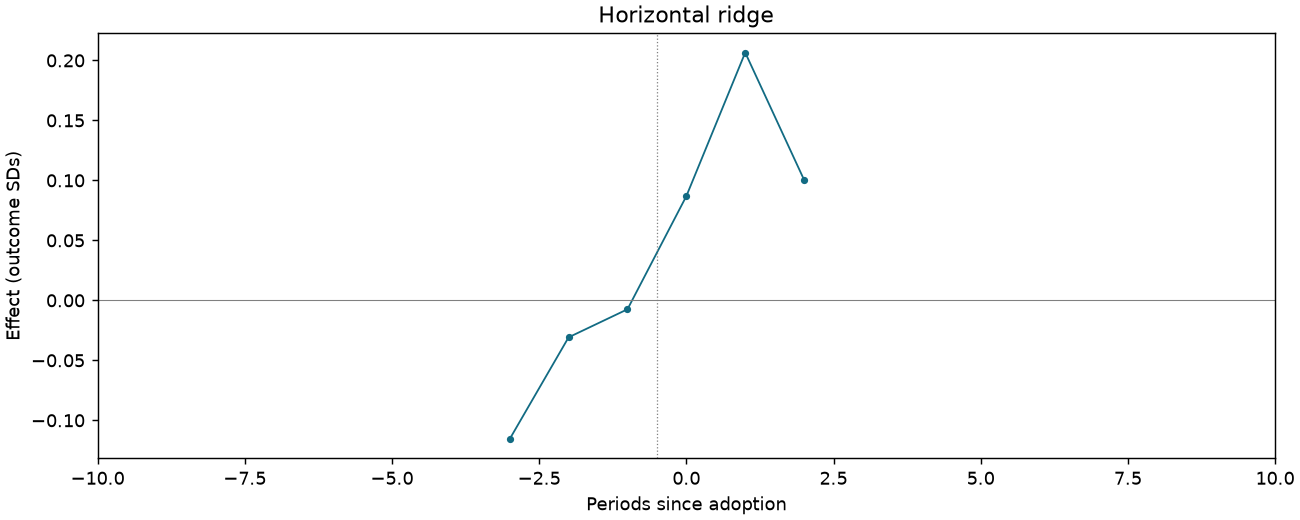
CI-F4-H-DYNAMIC
1,067 observations · 19 units · 19 clusters · 13 treated / 6 control units.
Estimate comparison
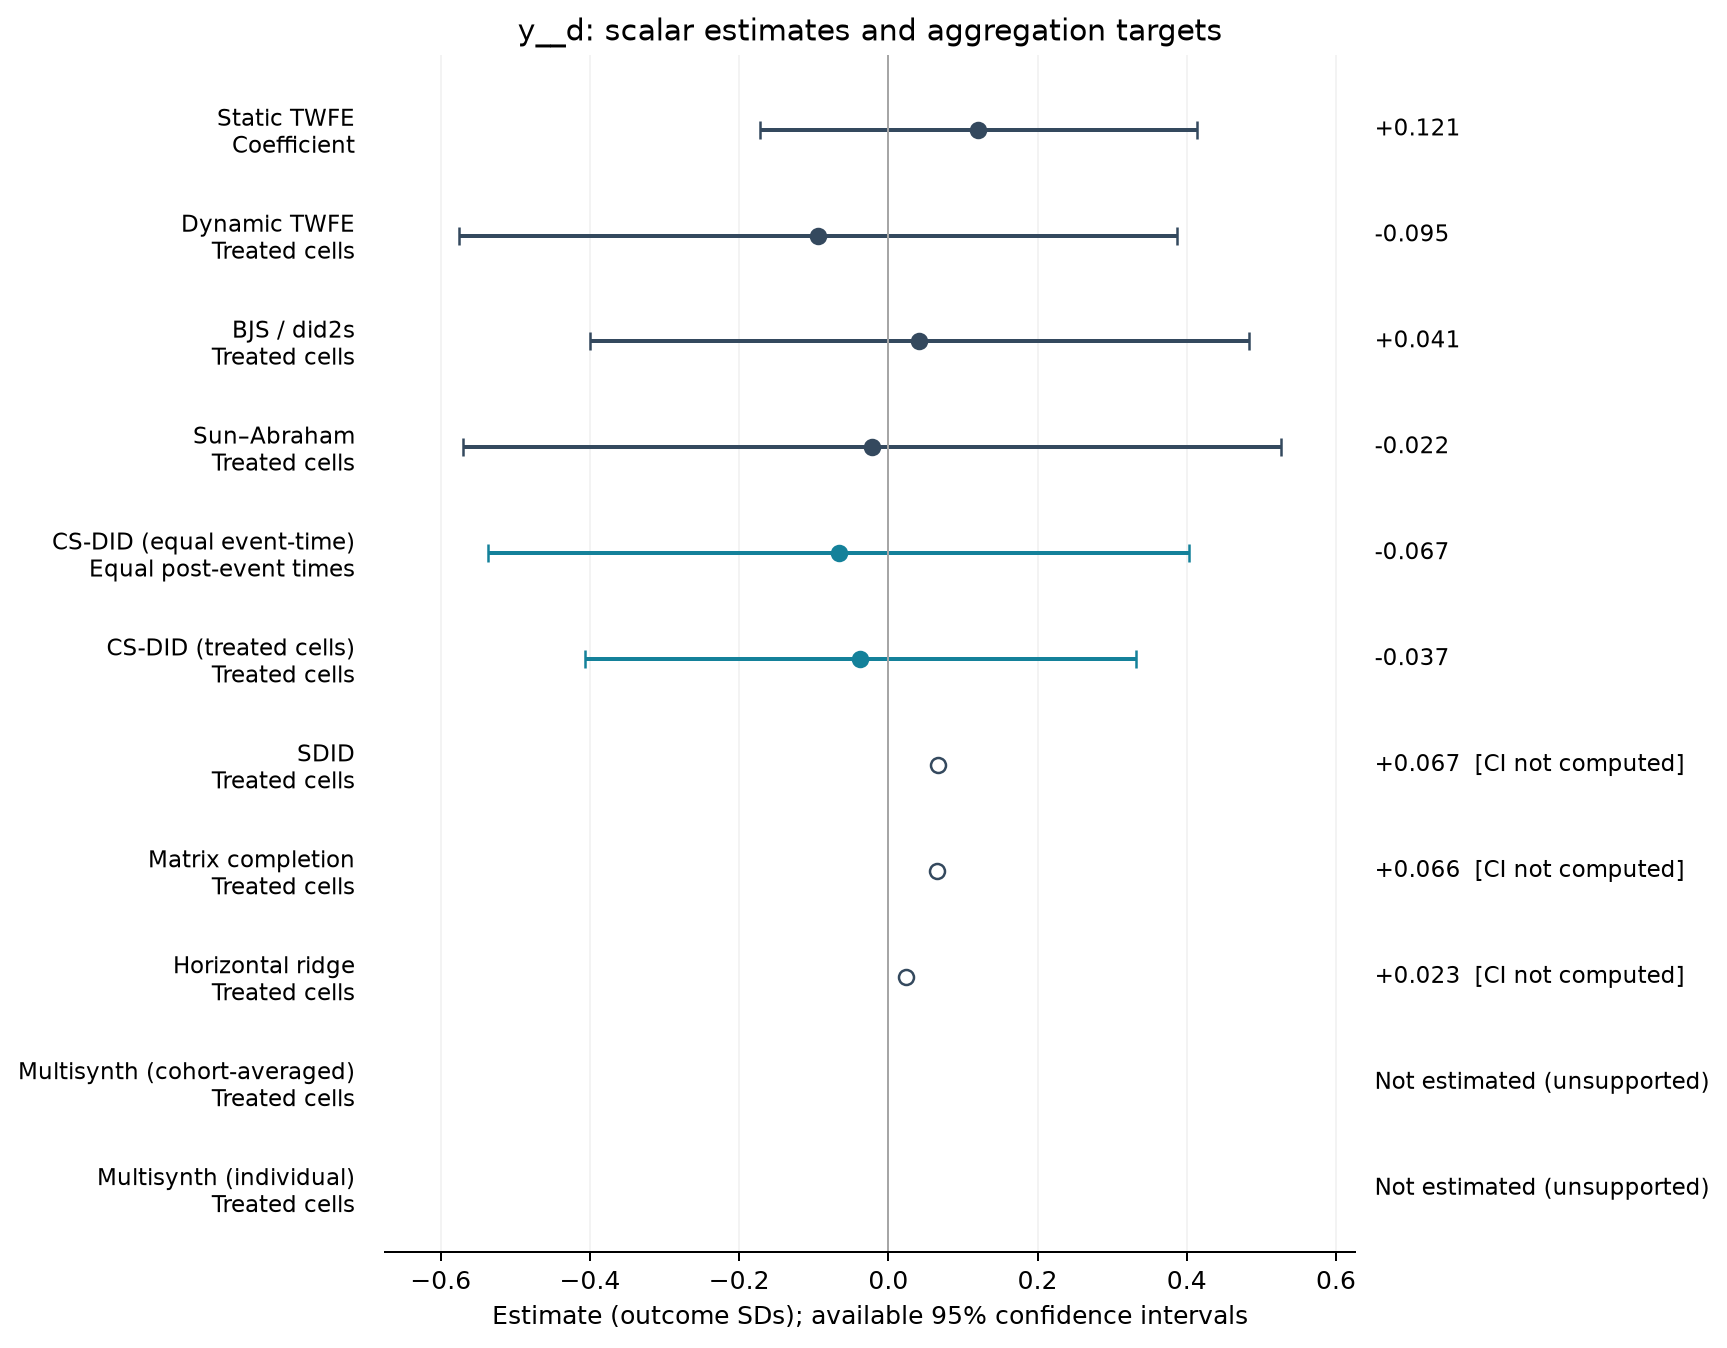
| Estimator | Estimate (SDs) | SE | 95% CI | Averaging |
|---|---|---|---|---|
| Static TWFE | 0.121 | 0.139 | [-0.172, 0.413] | Coefficient |
| Dynamic TWFE | -0.095 | 0.229 | [-0.575, 0.386] | Treated cells |
| BJS / did2s | 0.041 | 0.210 | [-0.401, 0.483] | Treated cells |
| Sun–Abraham | -0.022 | 0.261 | [-0.570, 0.527] | Treated cells |
| CS-DID (equal event-time) | -0.067 | 0.240 | [-0.537, 0.403] | Equal post-event times |
| CS-DID (treated cells) | -0.037 | 0.189 | [-0.407, 0.332] | Treated cells |
| SDID | 0.067 | — | — | Treated cells |
| Matrix completion | 0.066 | — | — | Treated cells |
| Horizontal ridge | 0.023 | — | — | Treated cells |
Event studies
Periods −10 to +10; pointwise 95% intervals where available.
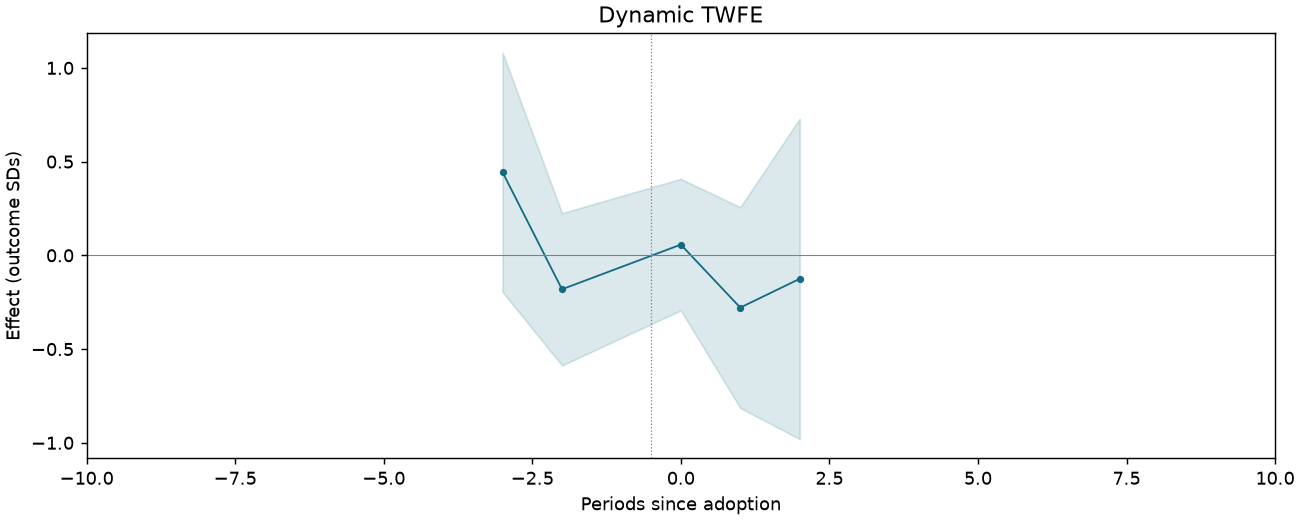
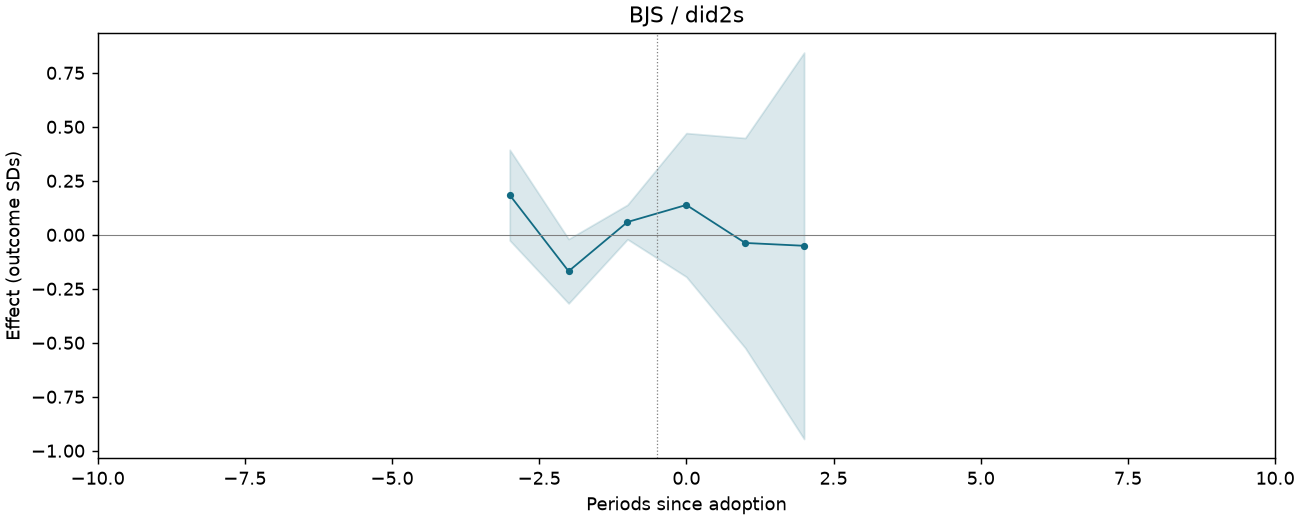
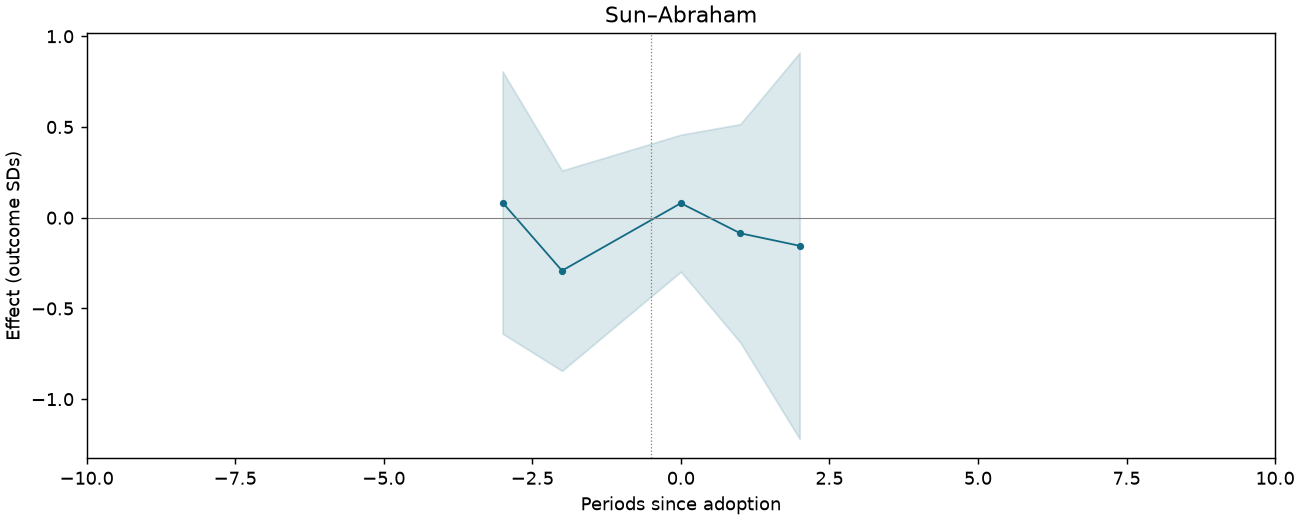
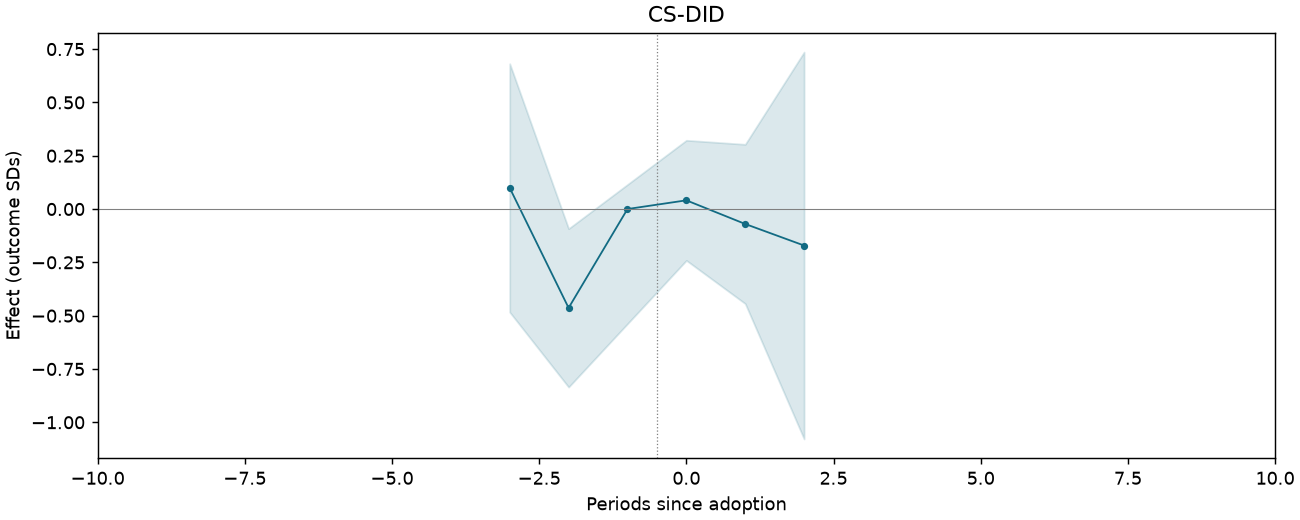
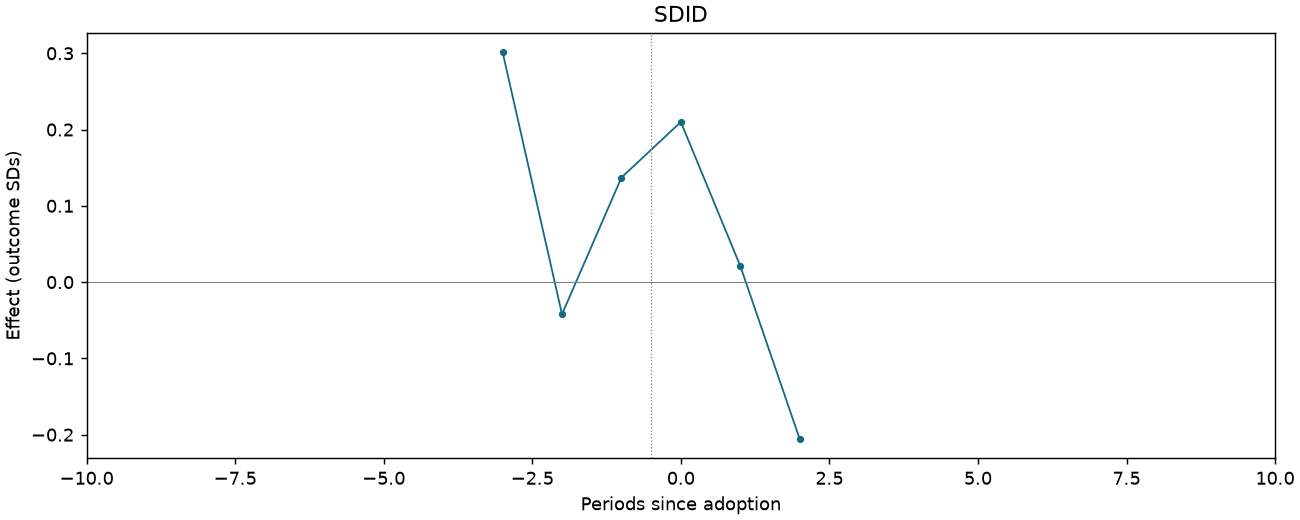
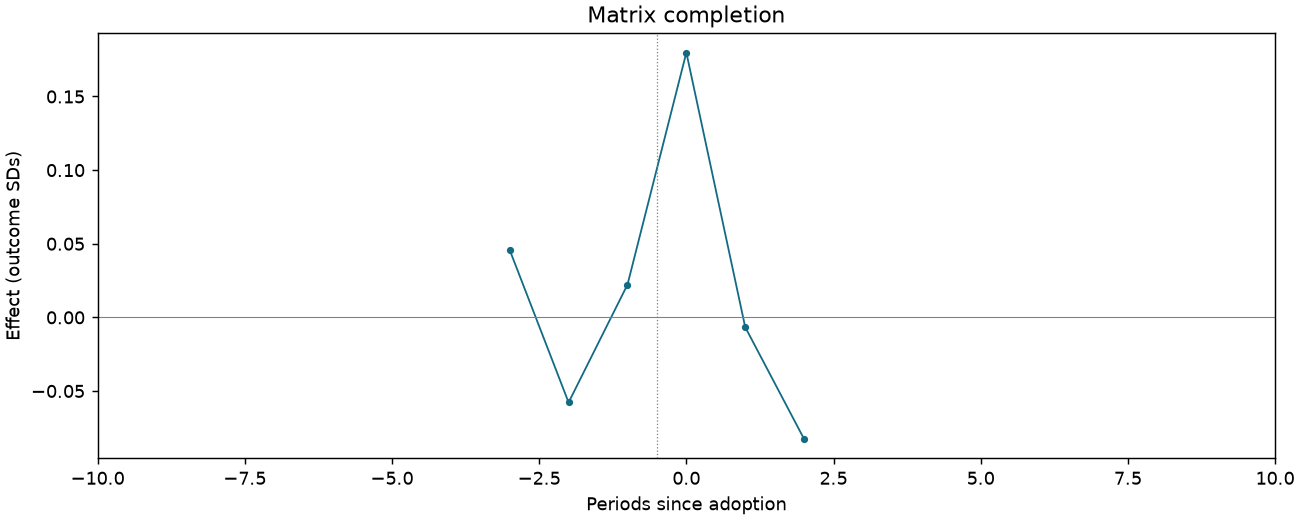
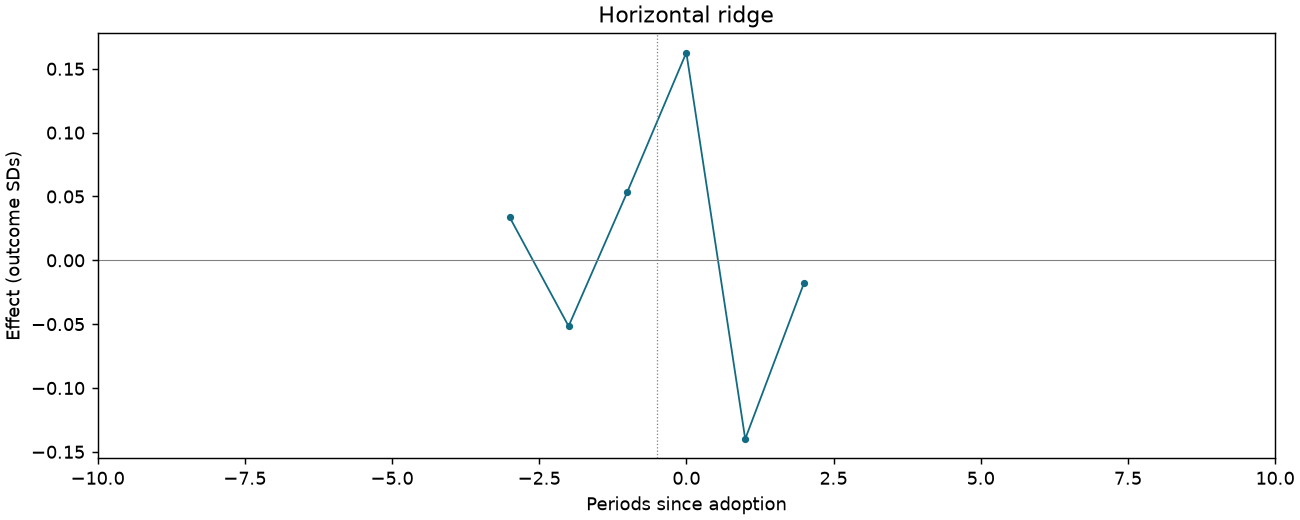
CI-F4-I-DYNAMIC
1,070 observations · 19 units · 19 clusters · 13 treated / 6 control units.
Estimate comparison
| Estimator | Estimate (SDs) | SE | 95% CI | Averaging |
|---|---|---|---|---|
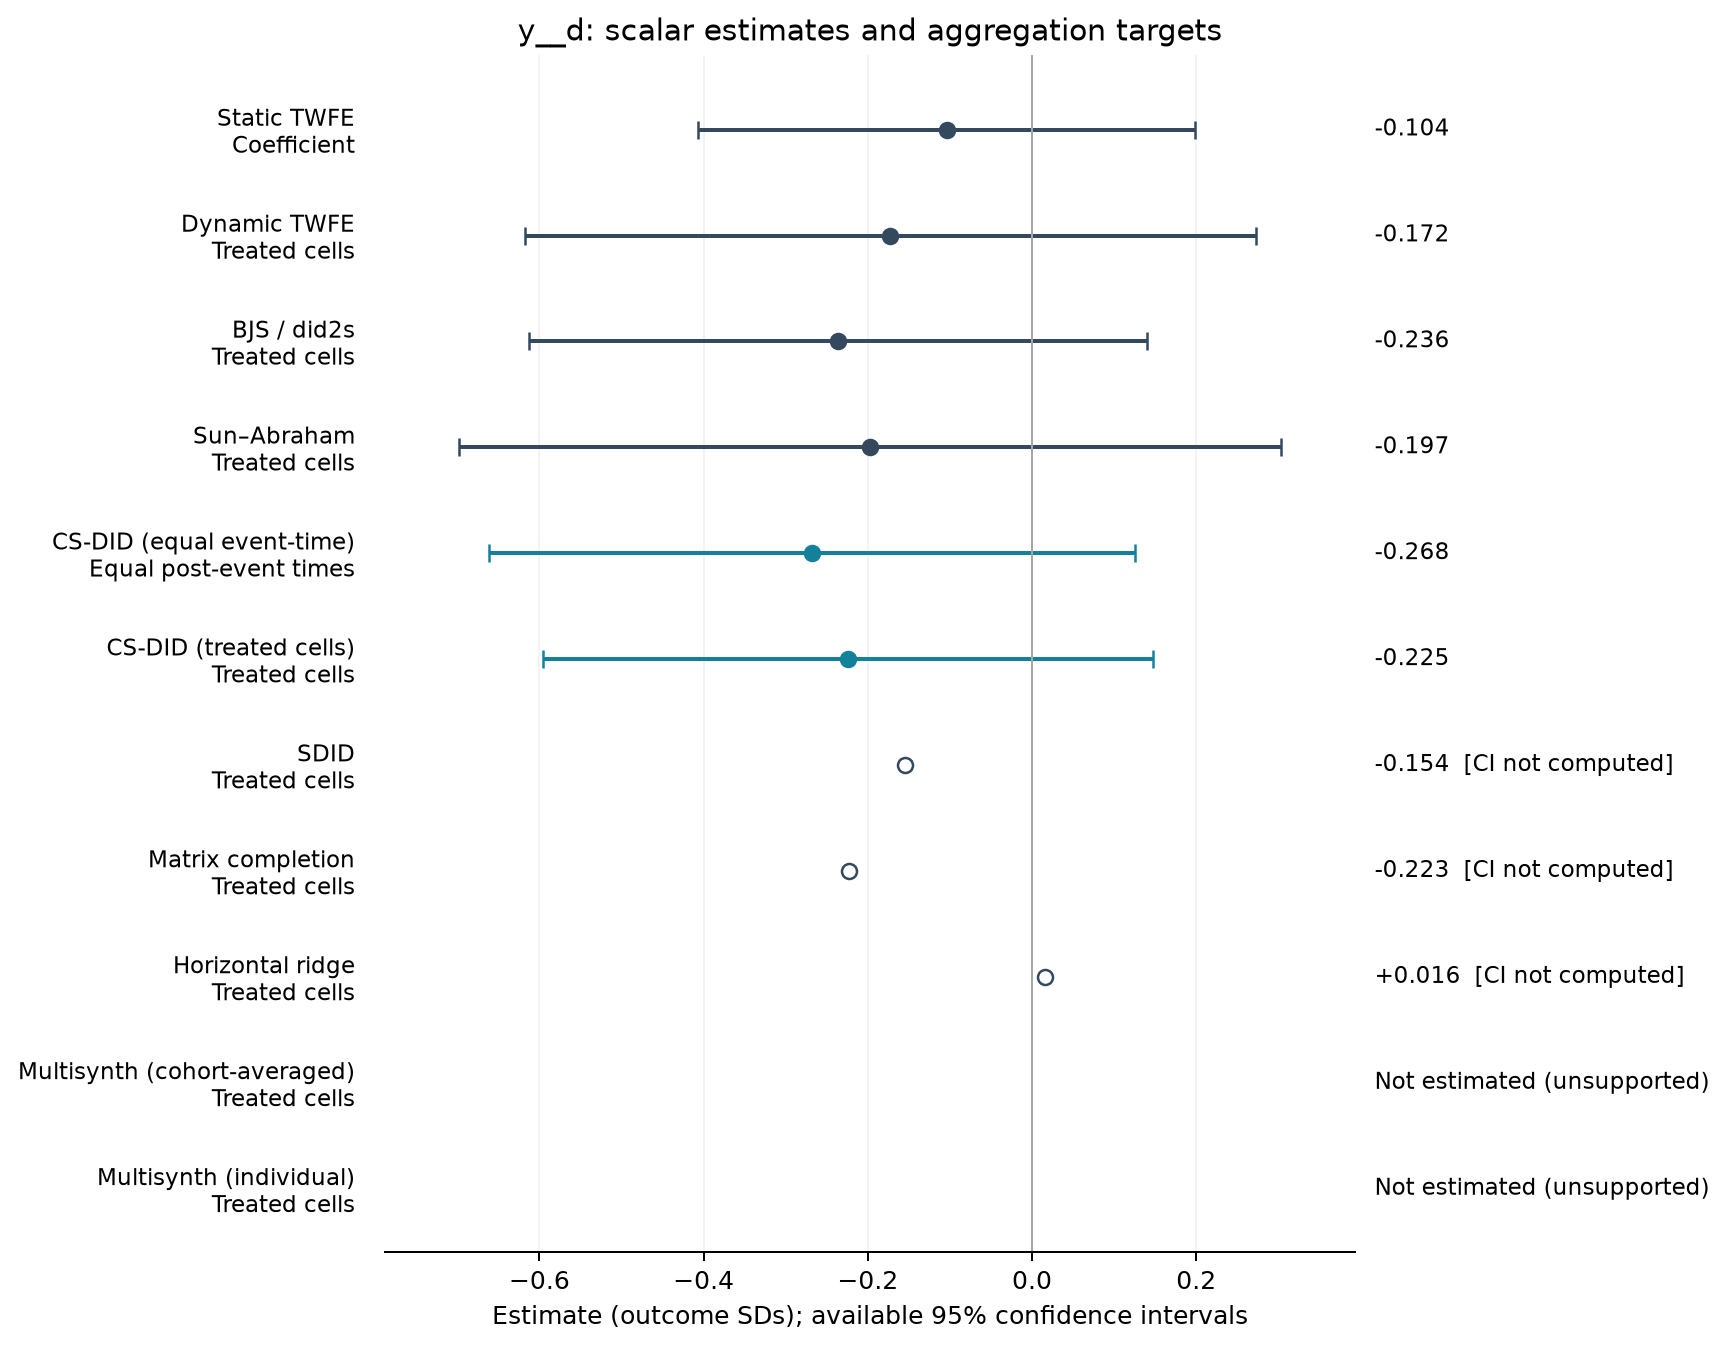
| Static TWFE | -0.104 | 0.144 | [-0.406, 0.199] | Coefficient |
| Dynamic TWFE | -0.172 | 0.212 | [-0.618, 0.273] | Treated cells |
| BJS / did2s | -0.236 | 0.179 | [-0.612, 0.140] | Treated cells |
| Sun–Abraham | -0.197 | 0.238 | [-0.698, 0.303] | Treated cells |
| CS-DID (equal event-time) | -0.268 | 0.201 | [-0.662, 0.125] | Equal post-event times |
| CS-DID (treated cells) | -0.225 | 0.190 | [-0.596, 0.147] | Treated cells |
| SDID | -0.154 | — | — | Treated cells |
| Matrix completion | -0.223 | — | — | Treated cells |
| Horizontal ridge | 0.016 | — | — | Treated cells |
Event studies
Periods −10 to +10; pointwise 95% intervals where available.
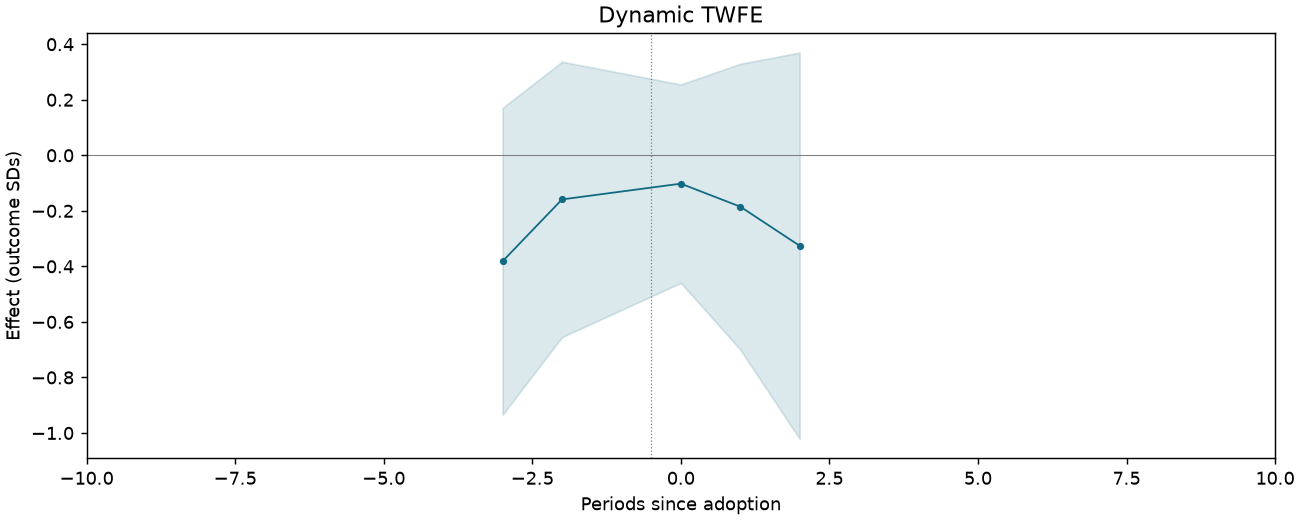
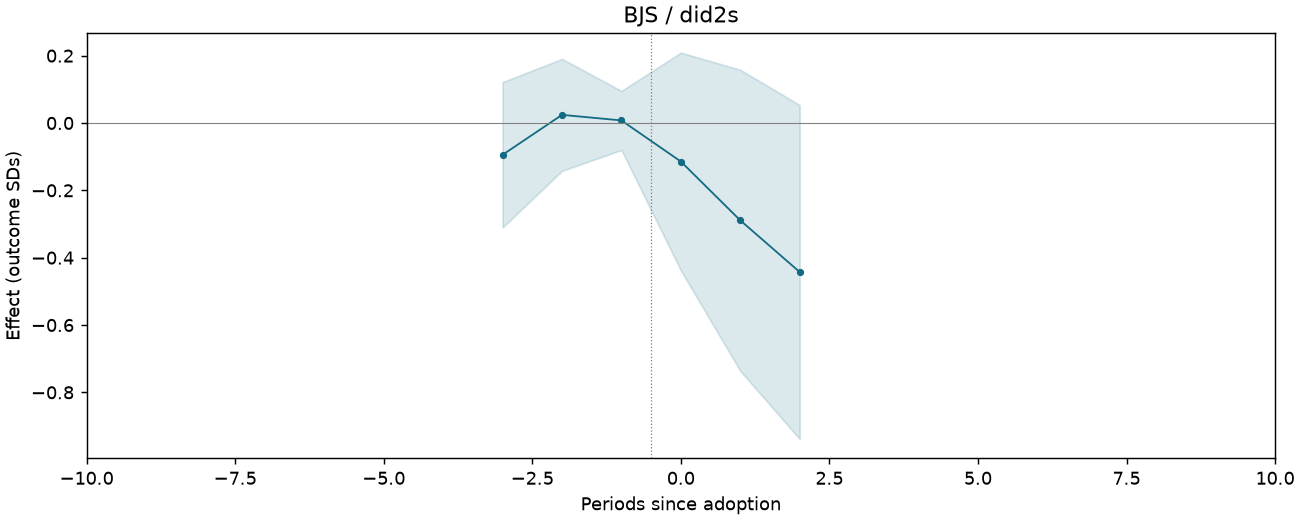
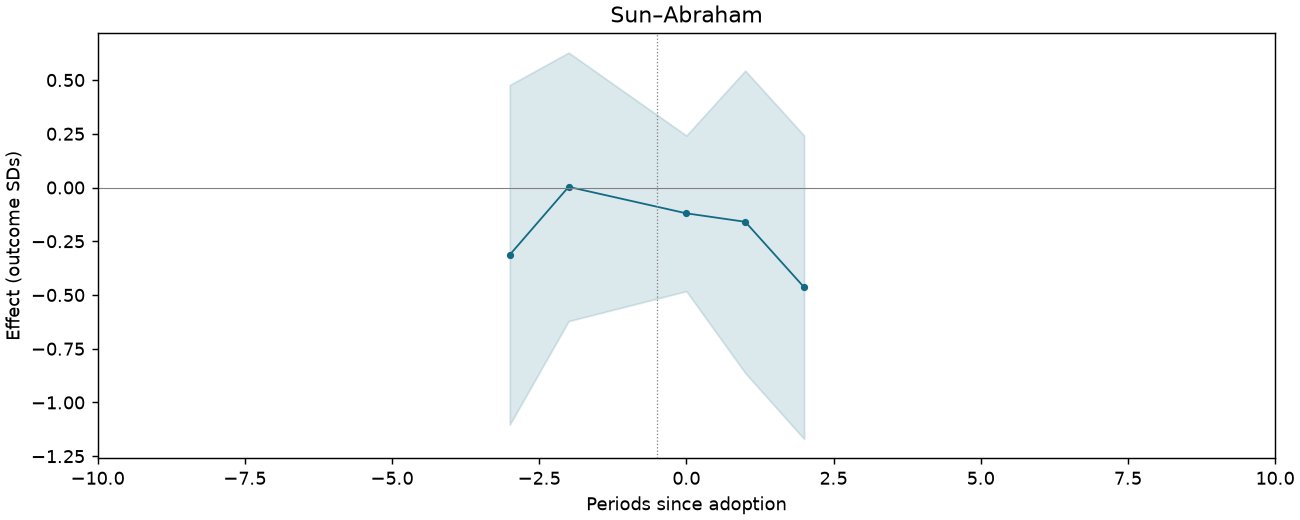
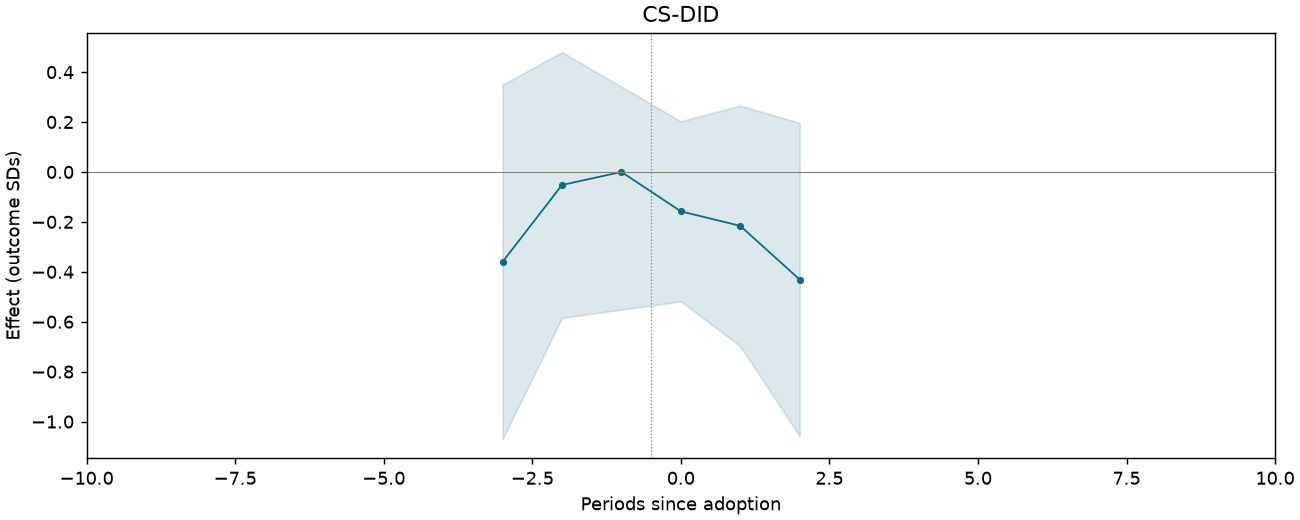
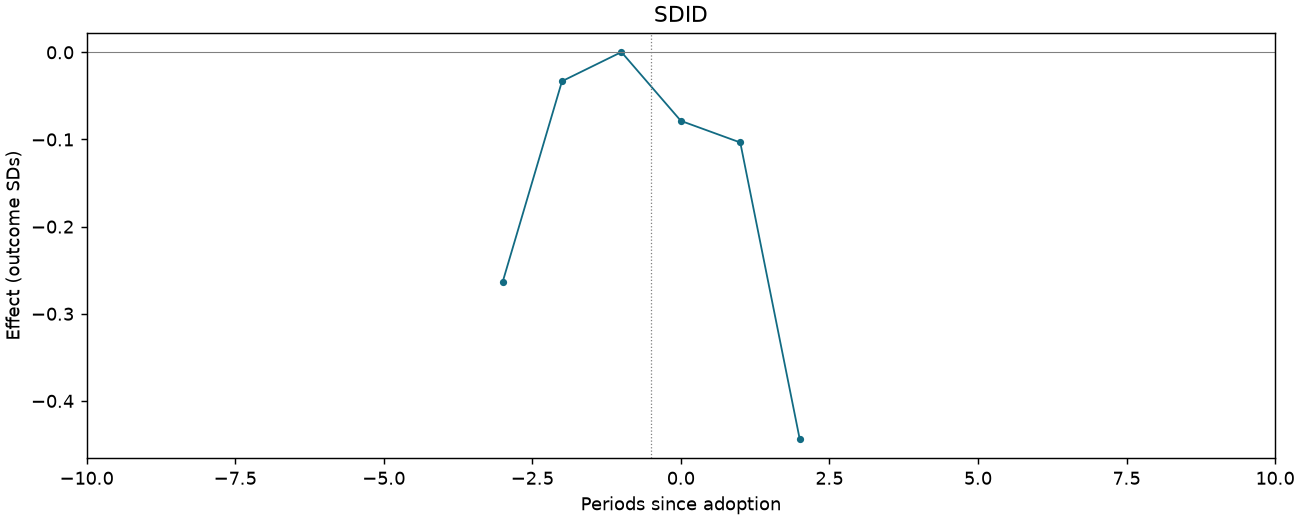
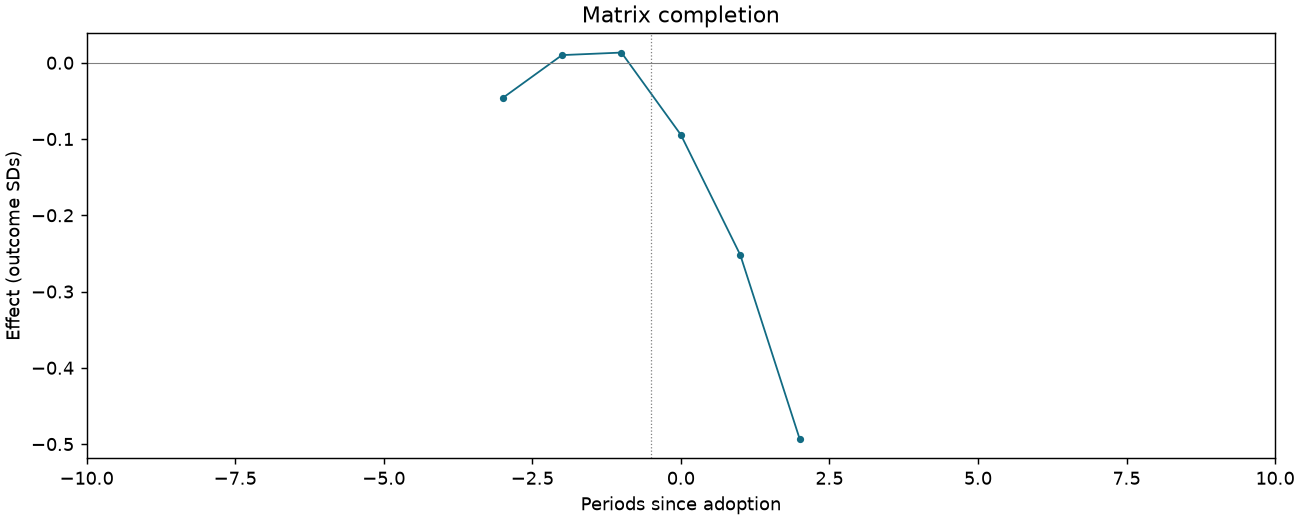
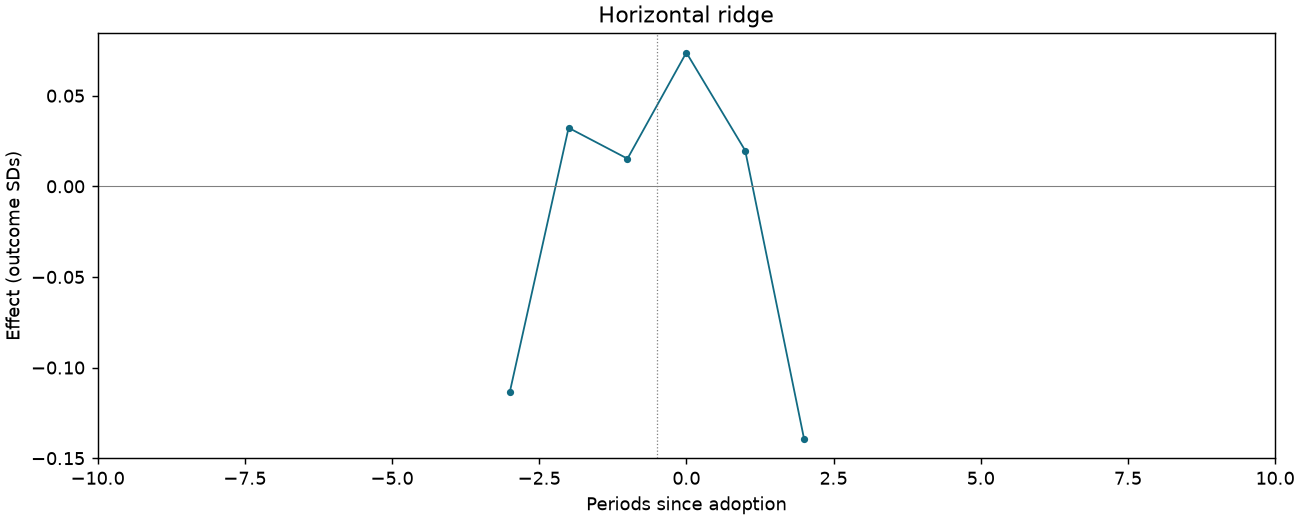
CI-F4-J-DYNAMIC
1,065 observations · 19 units · 19 clusters · 13 treated / 6 control units.
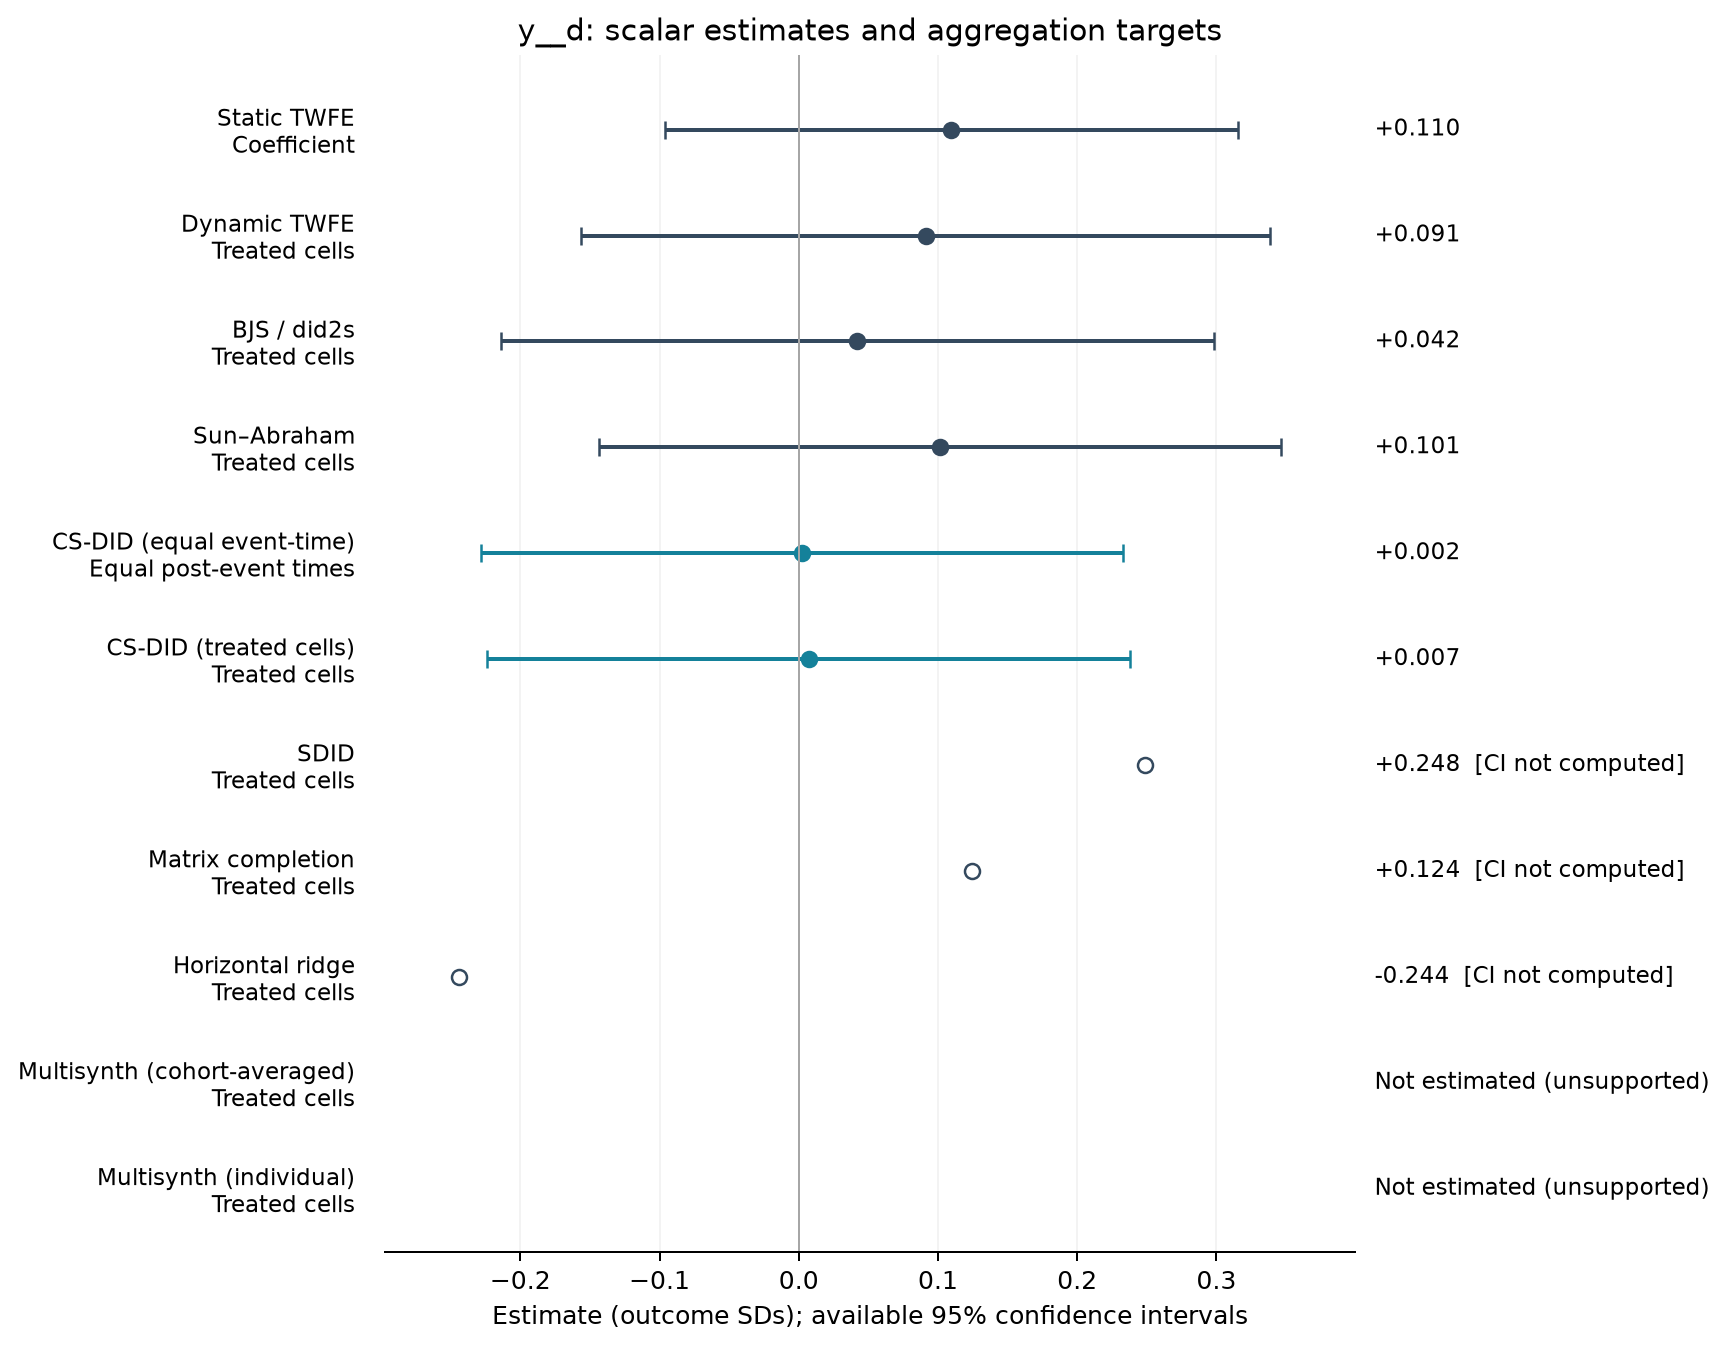
Estimate comparison
| Estimator | Estimate (SDs) | SE | 95% CI | Averaging |
|---|---|---|---|---|
| Static TWFE | 0.110 | 0.098 | [-0.096, 0.315] | Coefficient |
| Dynamic TWFE | 0.091 | 0.118 | [-0.156, 0.338] | Treated cells |
| BJS / did2s | 0.042 | 0.122 | [-0.214, 0.298] | Treated cells |
| Sun–Abraham | 0.101 | 0.117 | [-0.144, 0.347] | Treated cells |
| CS-DID (equal event-time) | 0.002 | 0.118 | [-0.228, 0.233] | Equal post-event times |
| CS-DID (treated cells) | 0.007 | 0.118 | [-0.224, 0.238] | Treated cells |
| SDID | 0.248 | — | — | Treated cells |
| Matrix completion | 0.124 | — | — | Treated cells |
| Horizontal ridge | -0.244 | — | — | Treated cells |
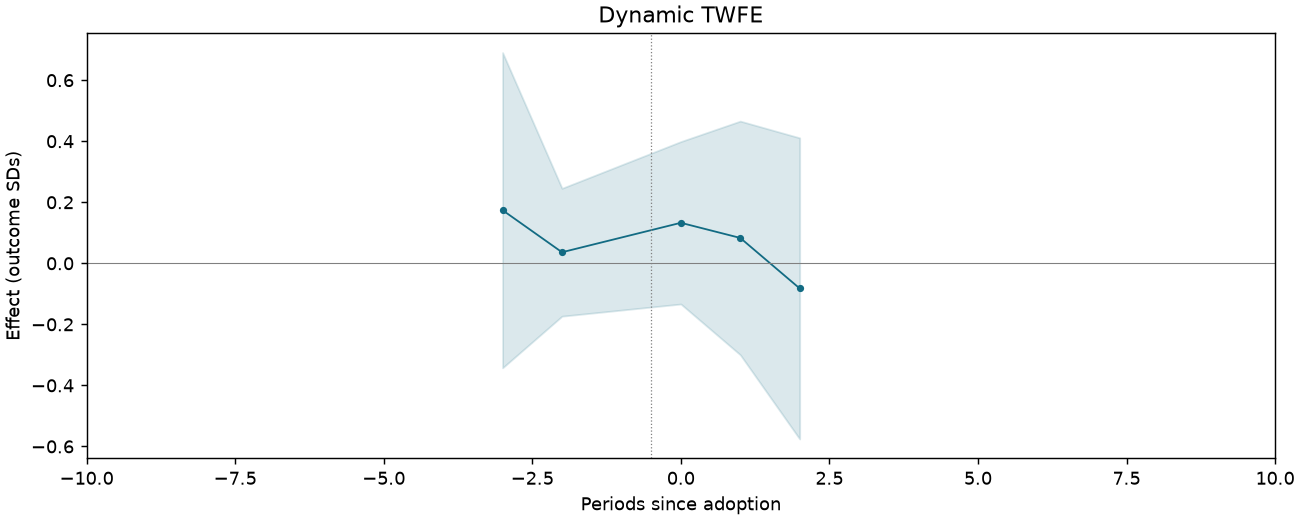
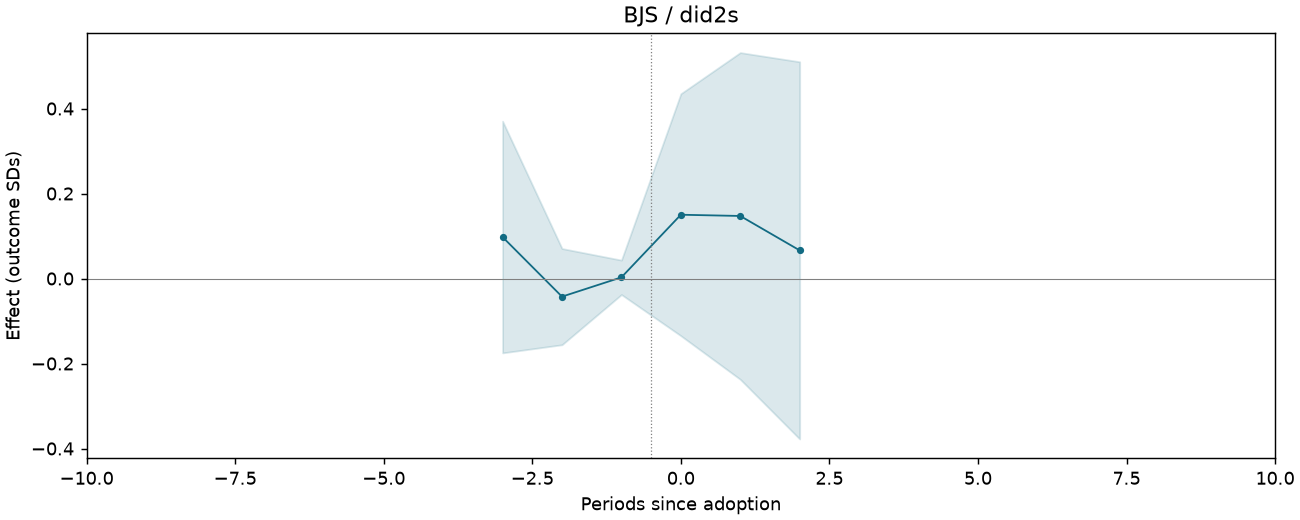
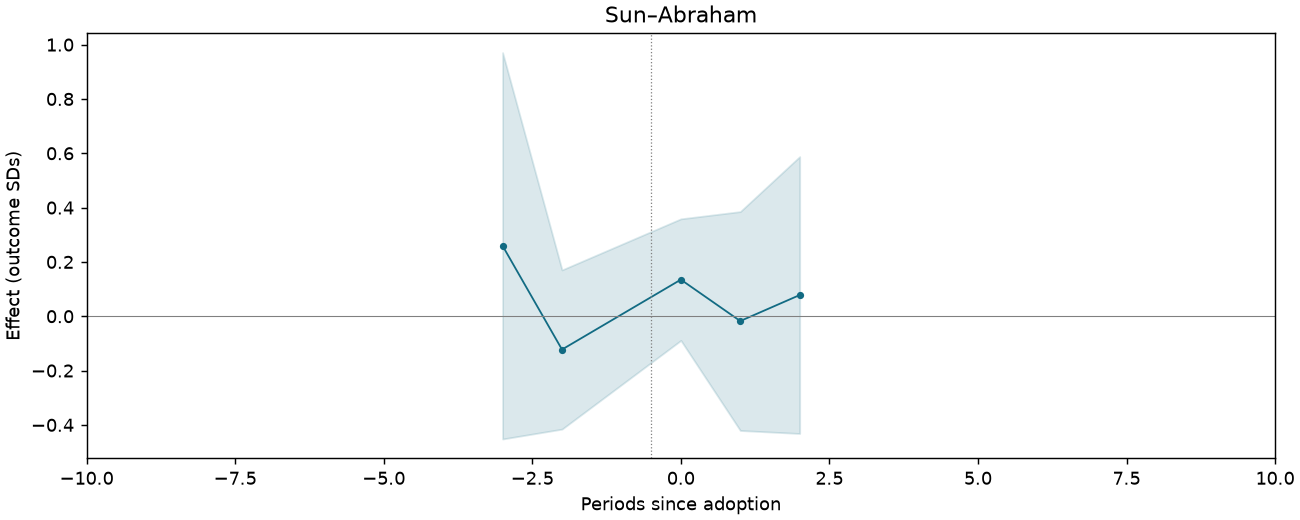
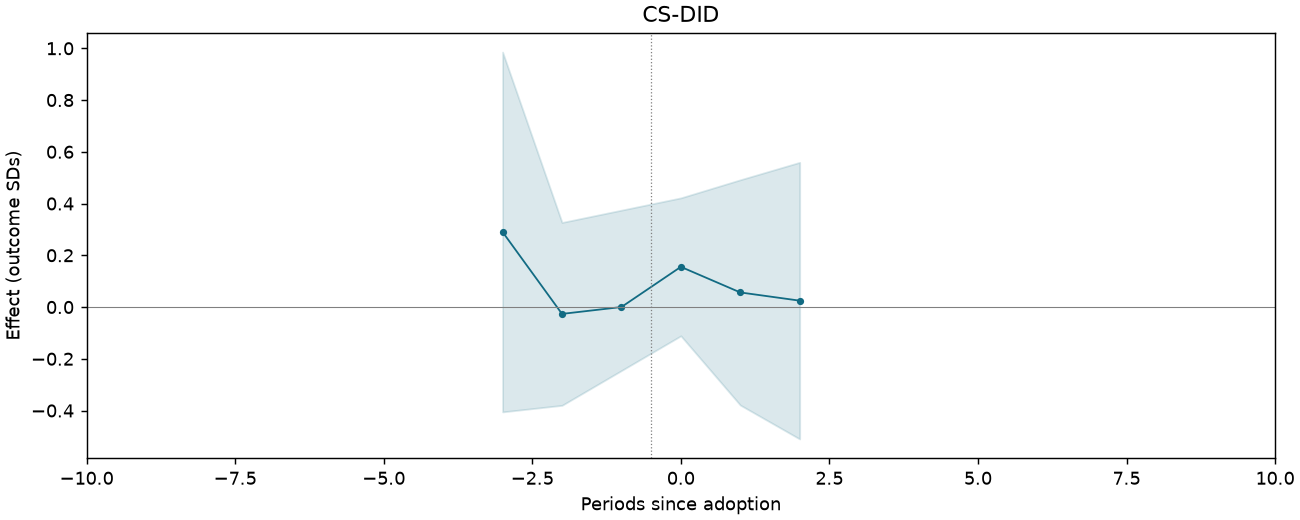
Event studies
Periods −10 to +10; pointwise 95% intervals where available.
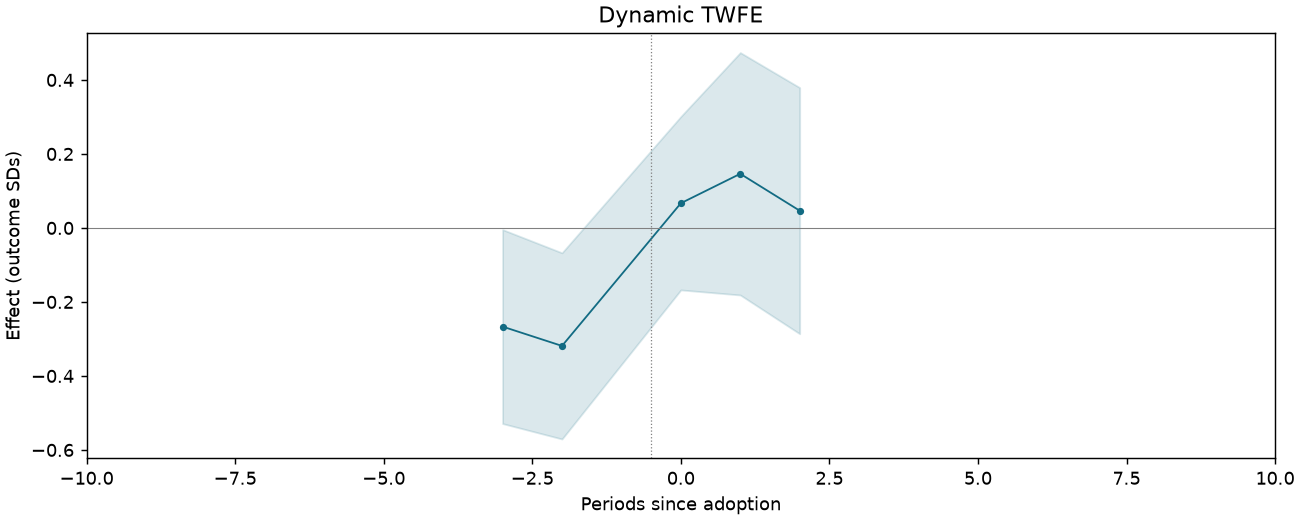
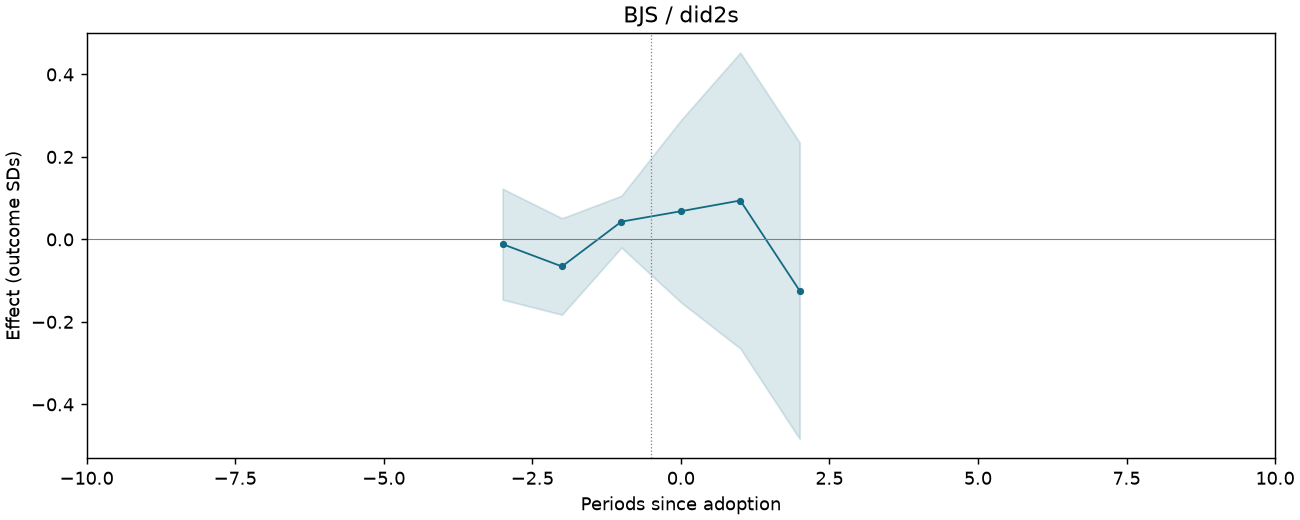
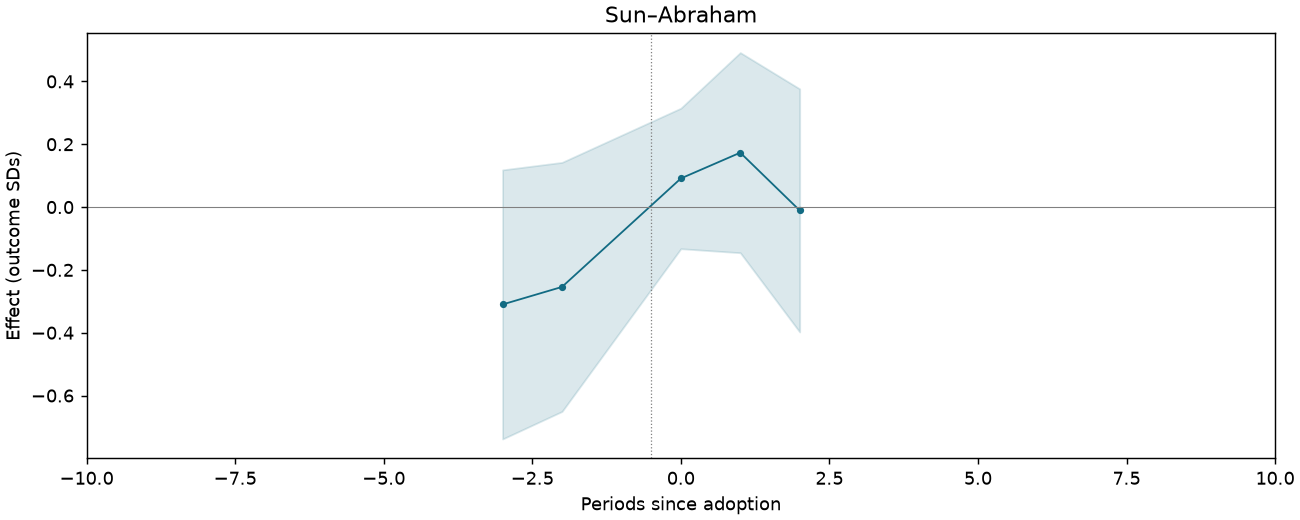
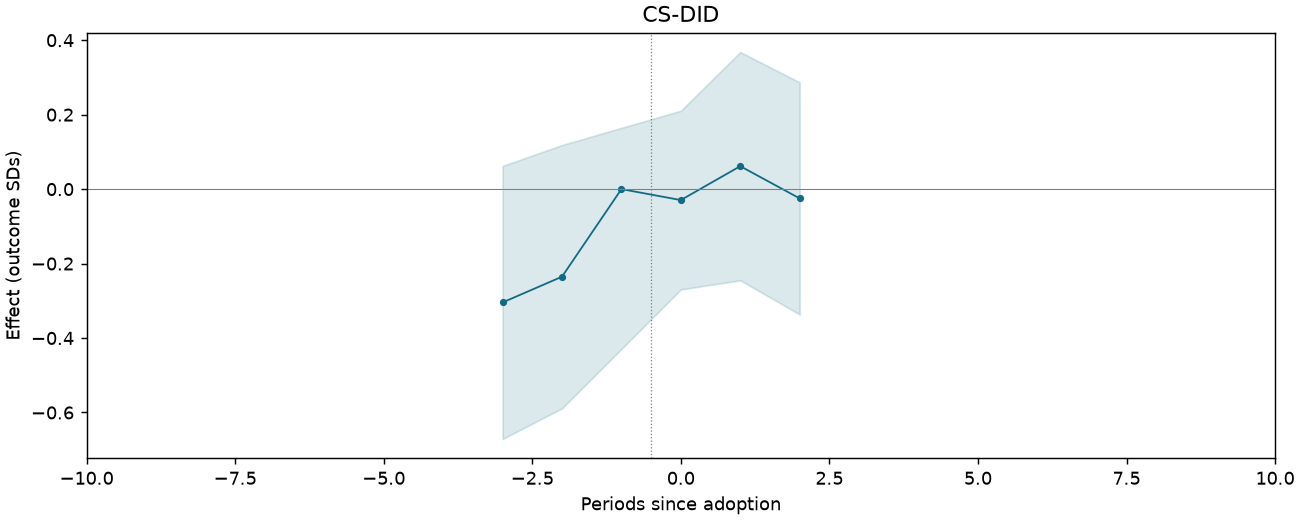
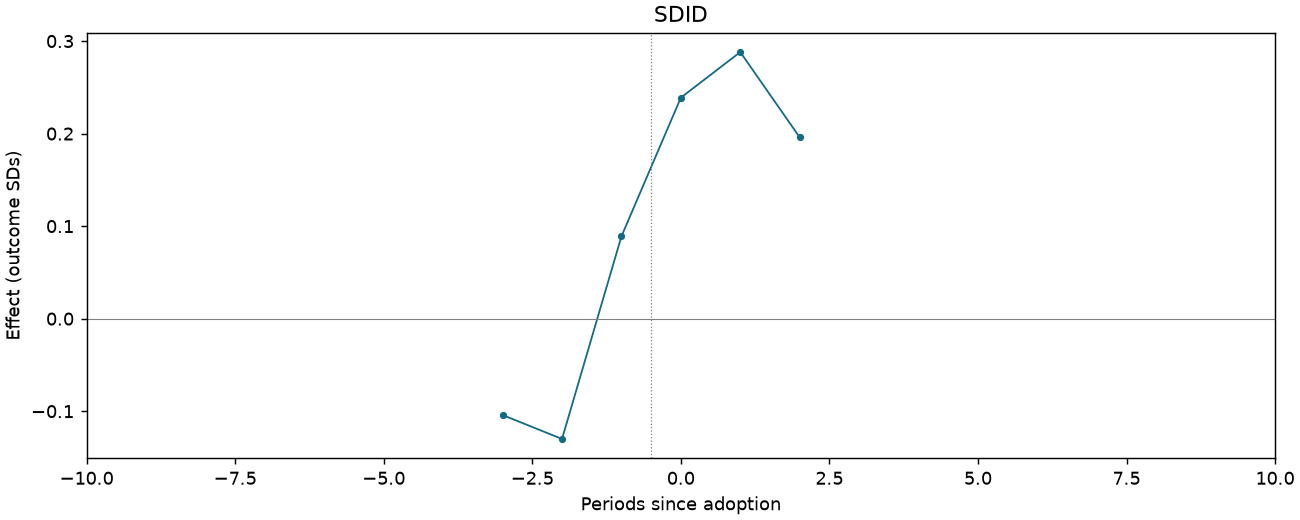
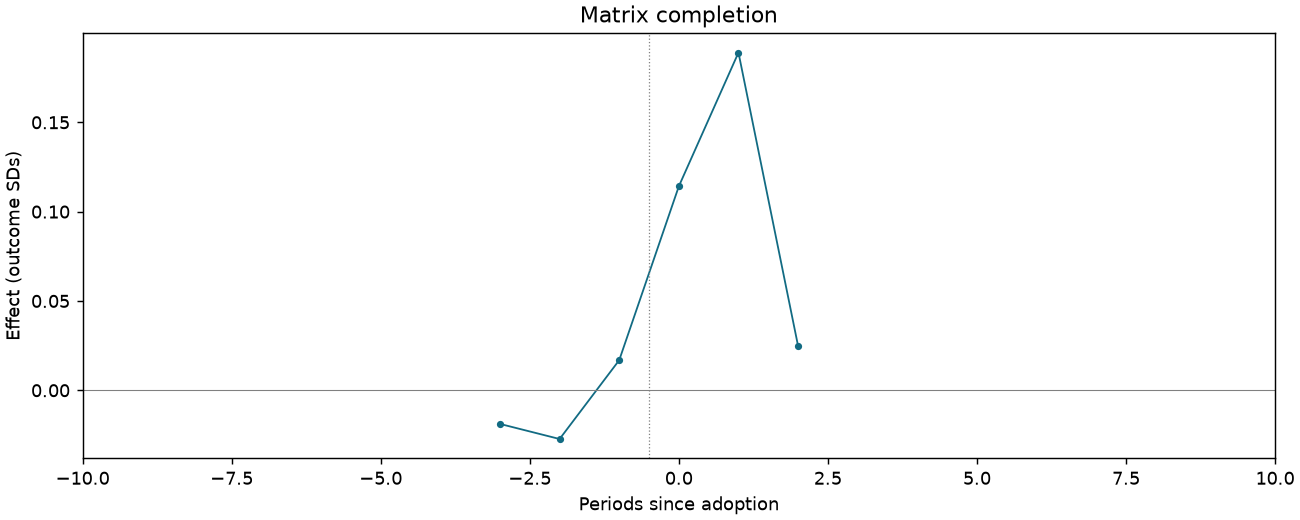
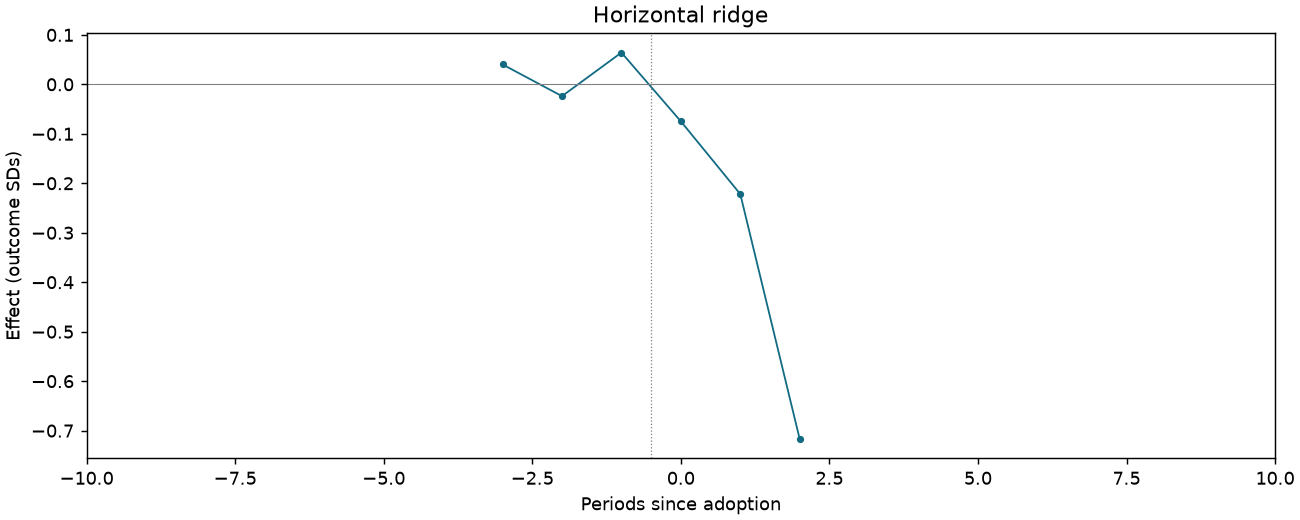
CI-F4-K-DYNAMIC
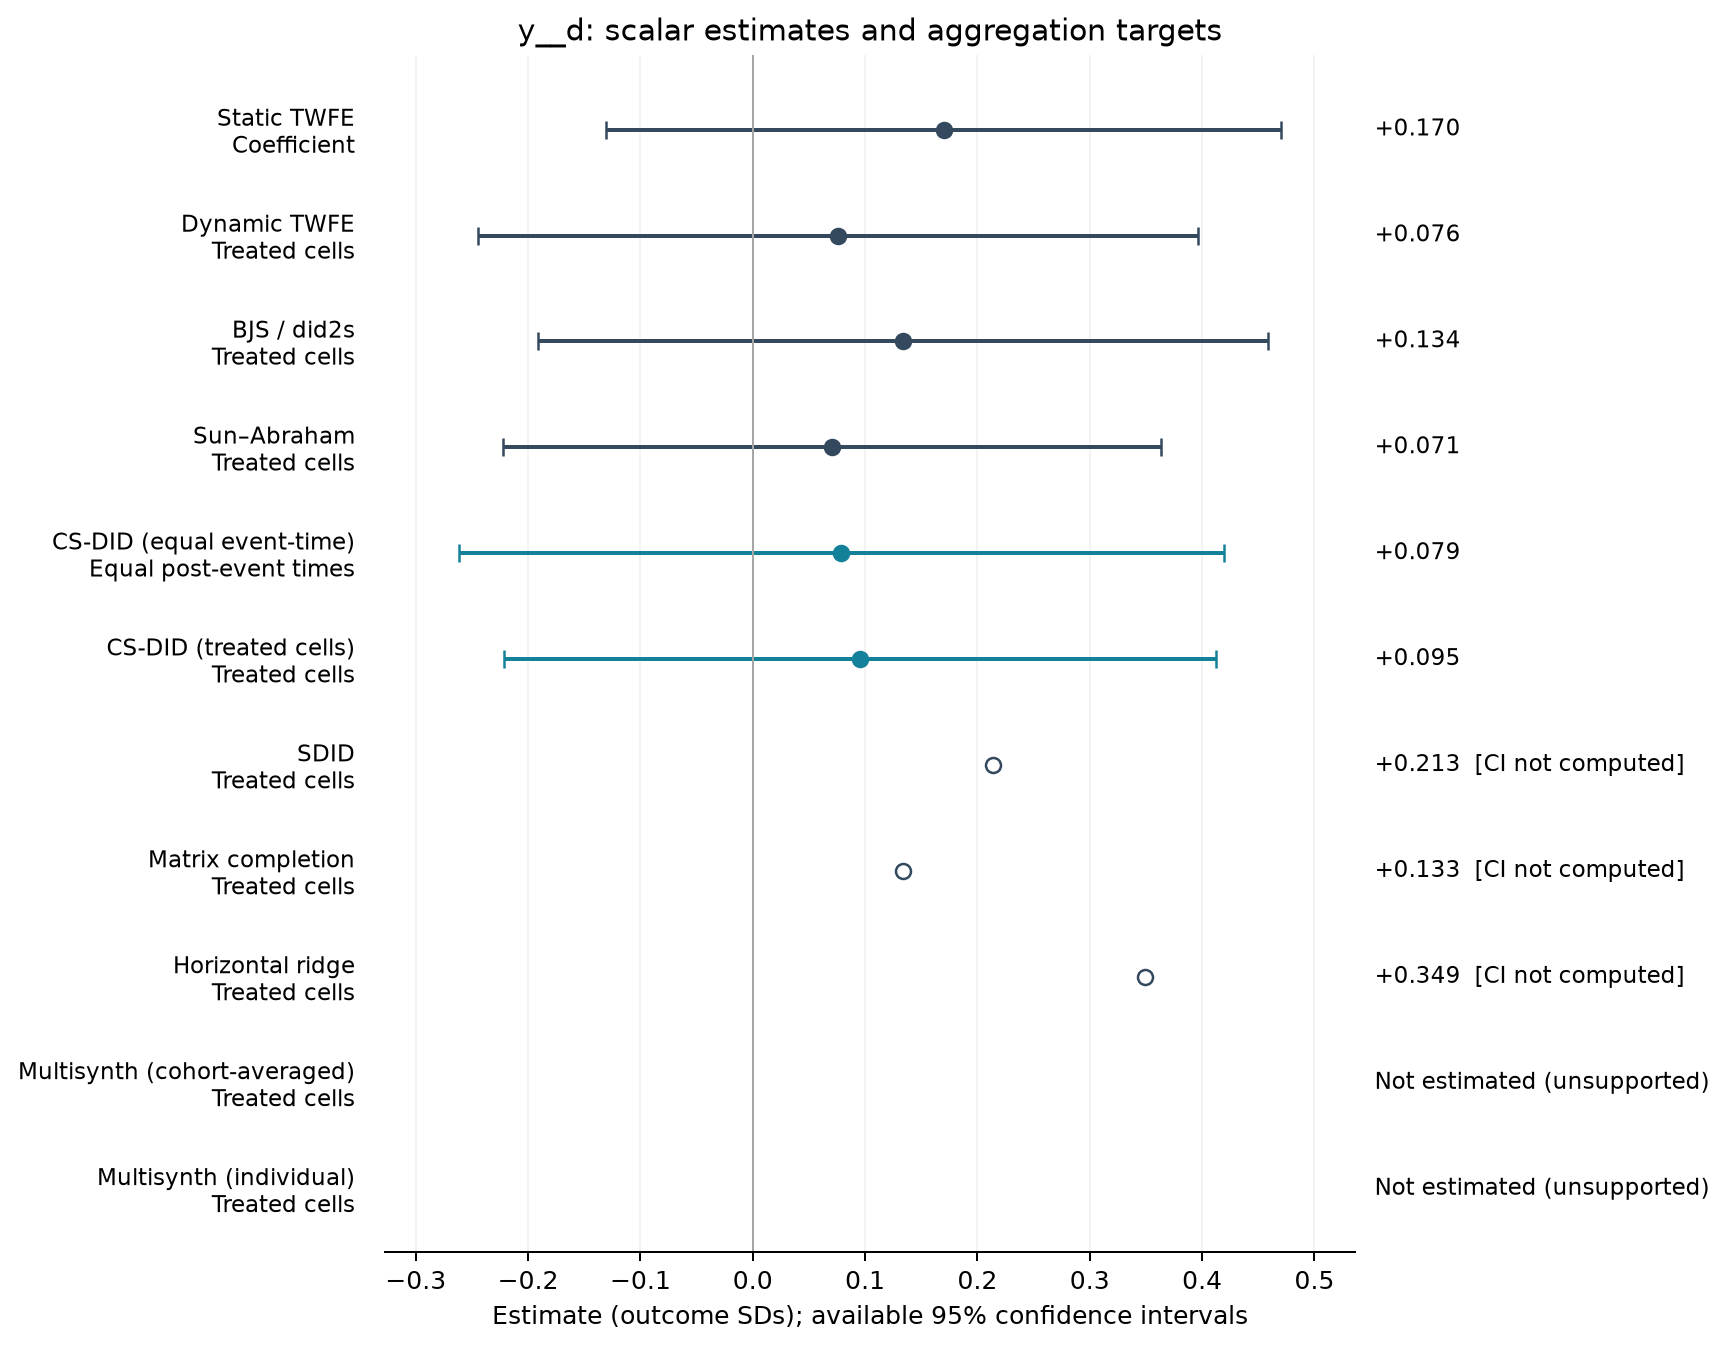
1,065 observations · 19 units · 19 clusters · 13 treated / 6 control units.
Estimate comparison
| Estimator | Estimate (SDs) | SE | 95% CI | Averaging |
|---|---|---|---|---|
| Static TWFE | 0.170 | 0.143 | [-0.131, 0.470] | Coefficient |
| Dynamic TWFE | 0.076 | 0.153 | [-0.245, 0.396] | Treated cells |
| BJS / did2s | 0.134 | 0.155 | [-0.191, 0.459] | Treated cells |
| Sun–Abraham | 0.071 | 0.139 | [-0.222, 0.364] | Treated cells |
| CS-DID (equal event-time) | 0.079 | 0.174 | [-0.261, 0.419] | Equal post-event times |
| CS-DID (treated cells) | 0.095 | 0.162 | [-0.221, 0.412] | Treated cells |
| SDID | 0.213 | — | — | Treated cells |
| Matrix completion | 0.133 | — | — | Treated cells |
| Horizontal ridge | 0.349 | — | — | Treated cells |
Event studies
Periods −10 to +10; pointwise 95% intervals where available.
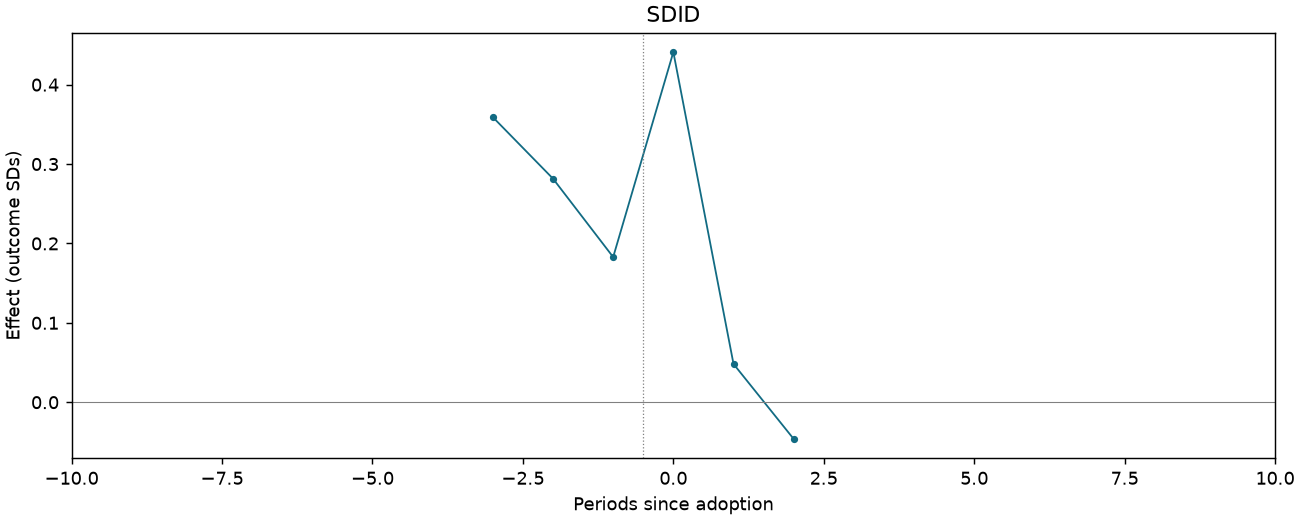
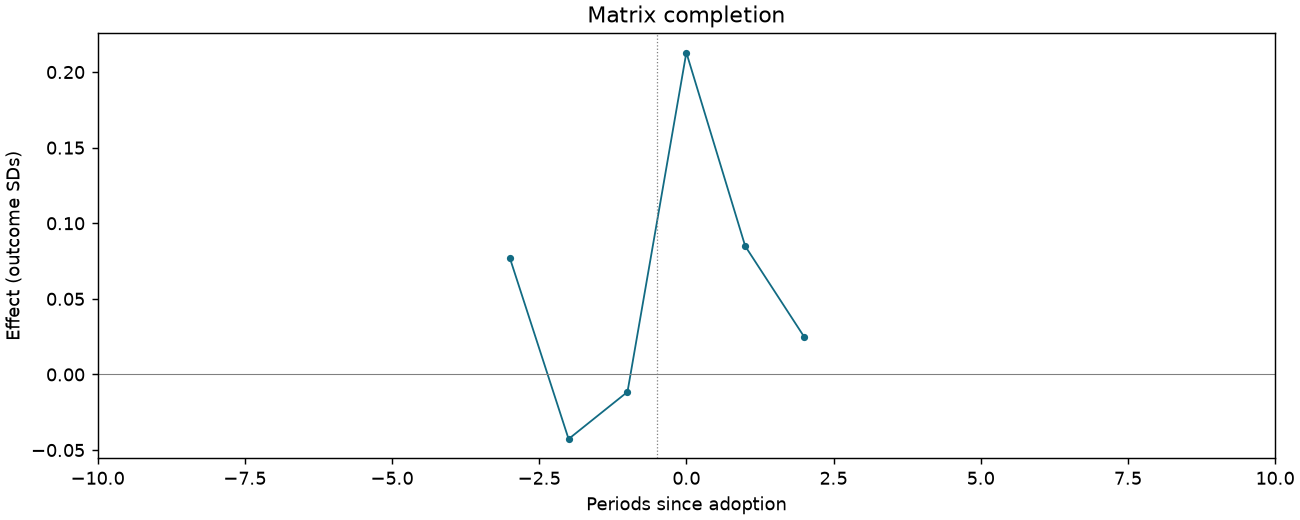
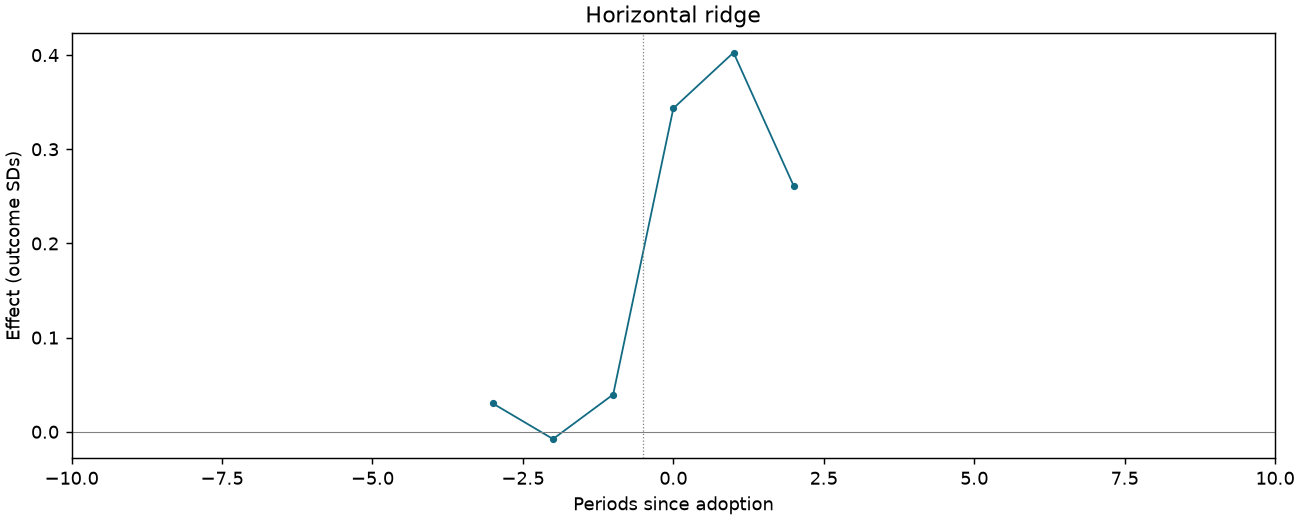
CI-F4-L-DYNAMIC
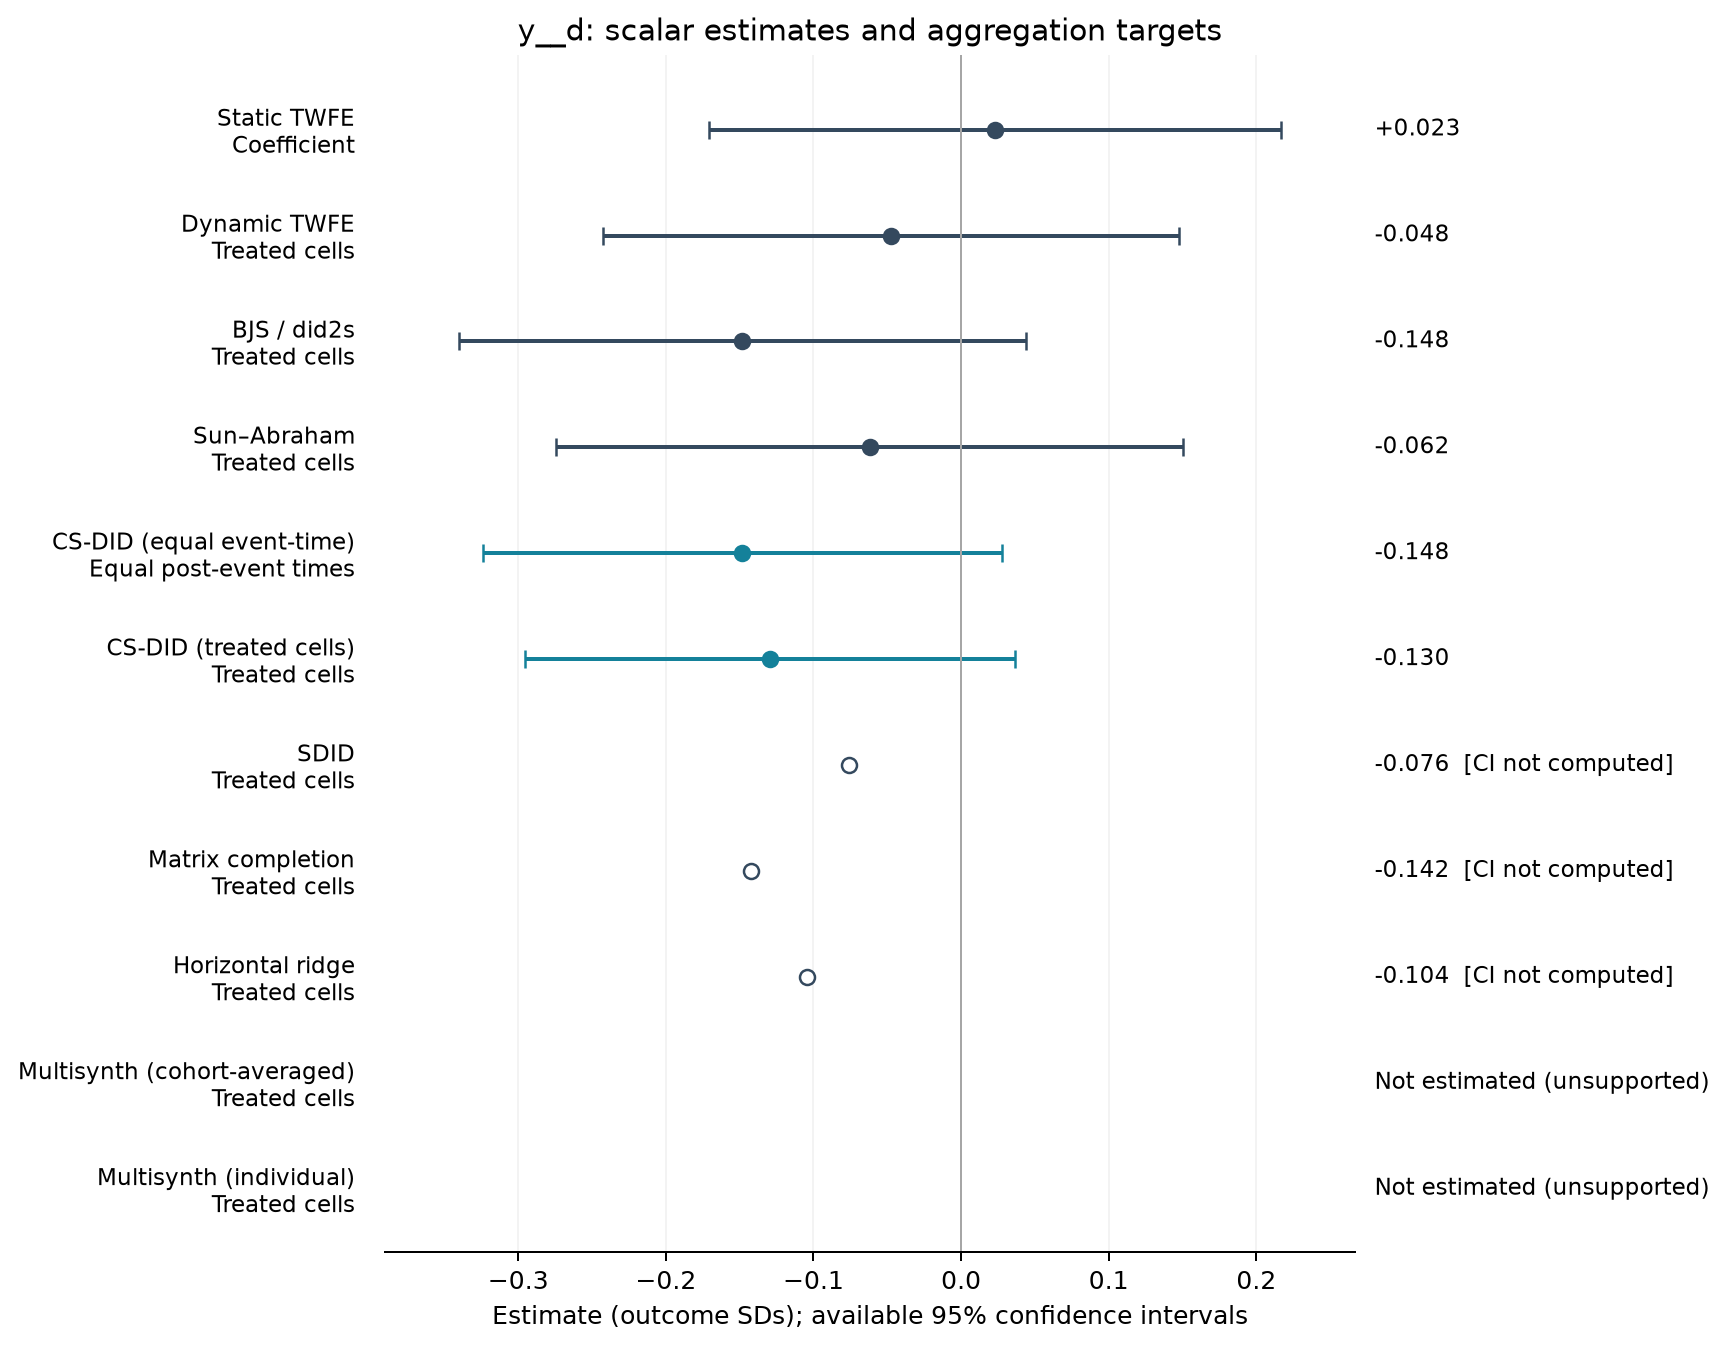
1,065 observations · 19 units · 19 clusters · 13 treated / 6 control units.
Estimate comparison
| Estimator | Estimate (SDs) | SE | 95% CI | Averaging |
|---|---|---|---|---|
| Static TWFE | 0.023 | 0.092 | [-0.171, 0.217] | Coefficient |
| Dynamic TWFE | -0.048 | 0.093 | [-0.243, 0.148] | Treated cells |
| BJS / did2s | -0.148 | 0.091 | [-0.340, 0.044] | Treated cells |
| Sun–Abraham | -0.062 | 0.101 | [-0.275, 0.151] | Treated cells |
| CS-DID (equal event-time) | -0.148 | 0.090 | [-0.324, 0.028] | Equal post-event times |
| CS-DID (treated cells) | -0.130 | 0.085 | [-0.295, 0.036] | Treated cells |
| SDID | -0.076 | — | — | Treated cells |
| Matrix completion | -0.142 | — | — | Treated cells |
| Horizontal ridge | -0.104 | — | — | Treated cells |
Event studies
Periods −10 to +10; pointwise 95% intervals where available.
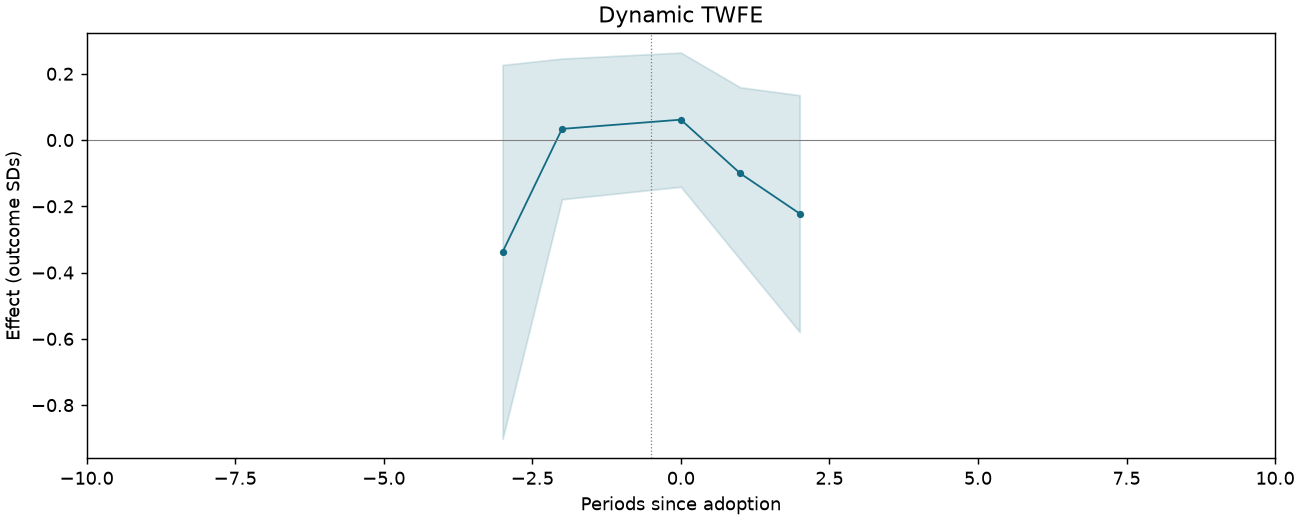
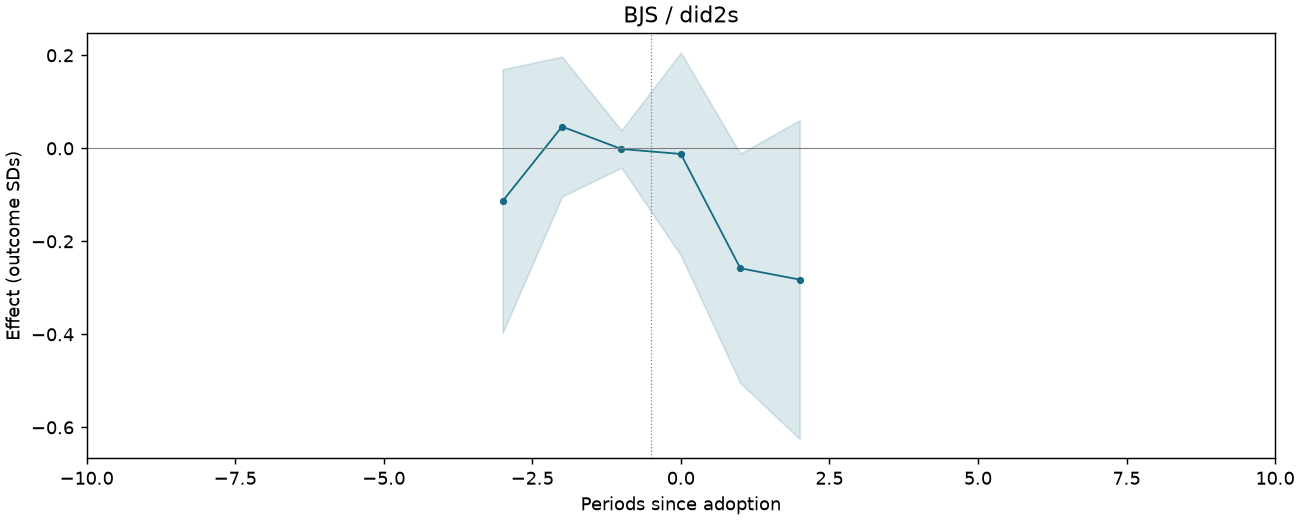
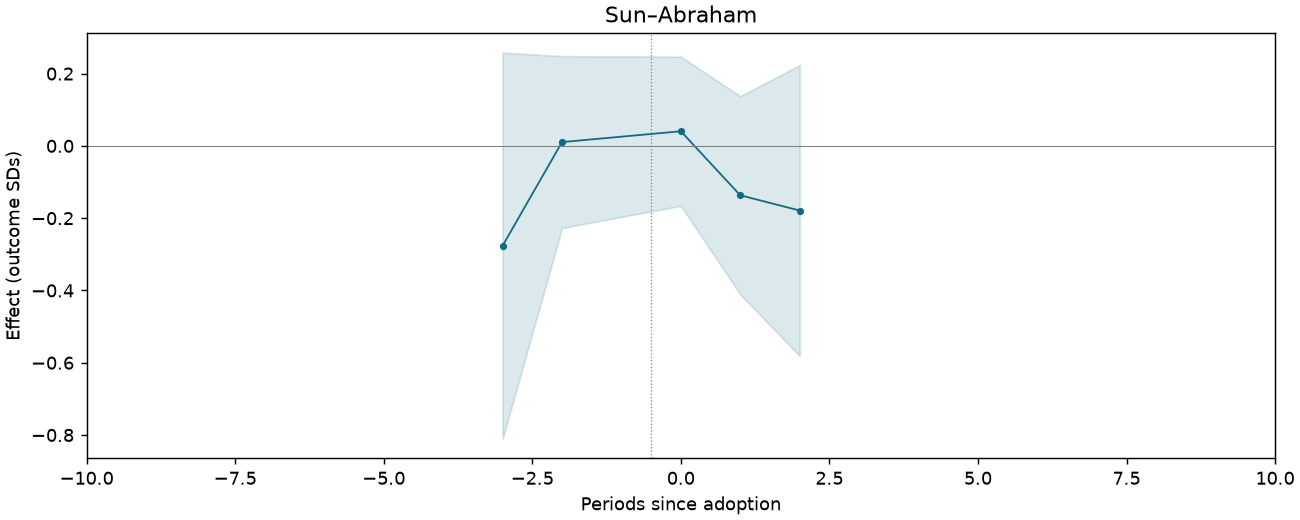
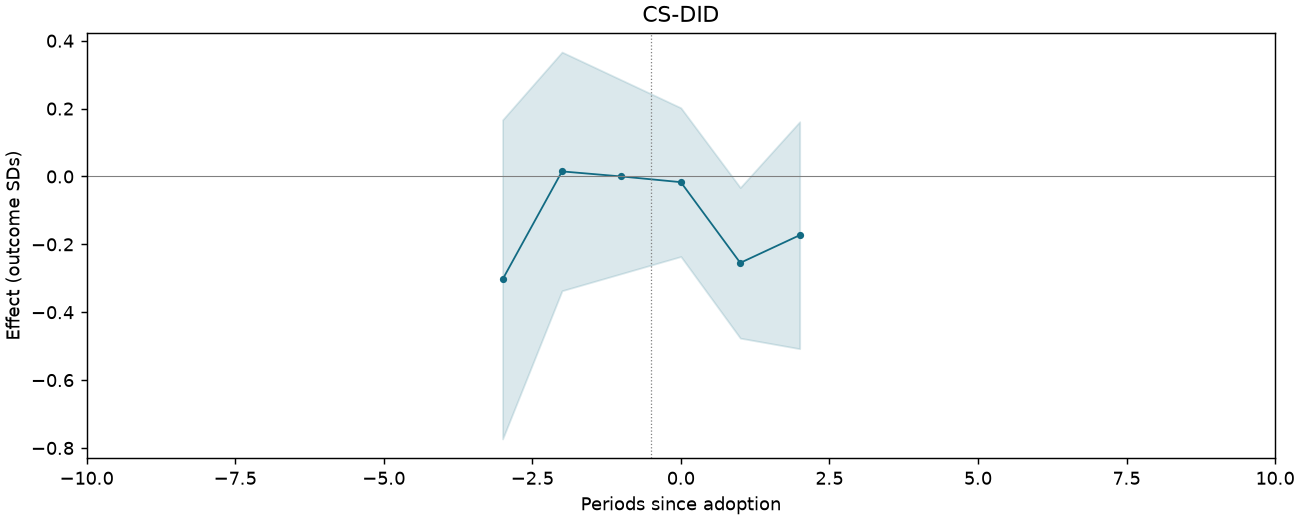
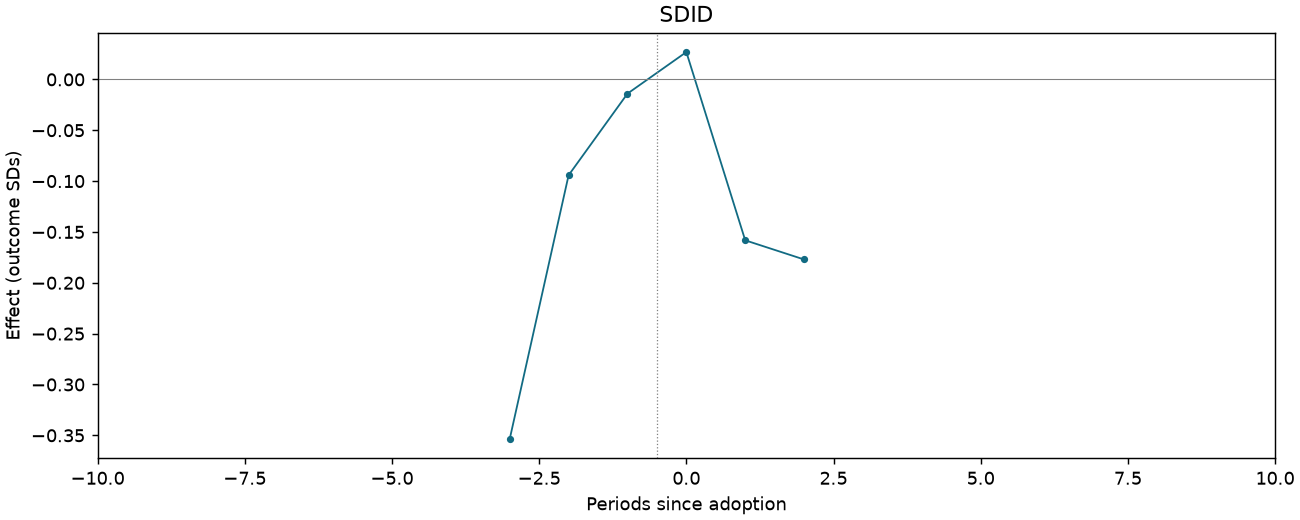
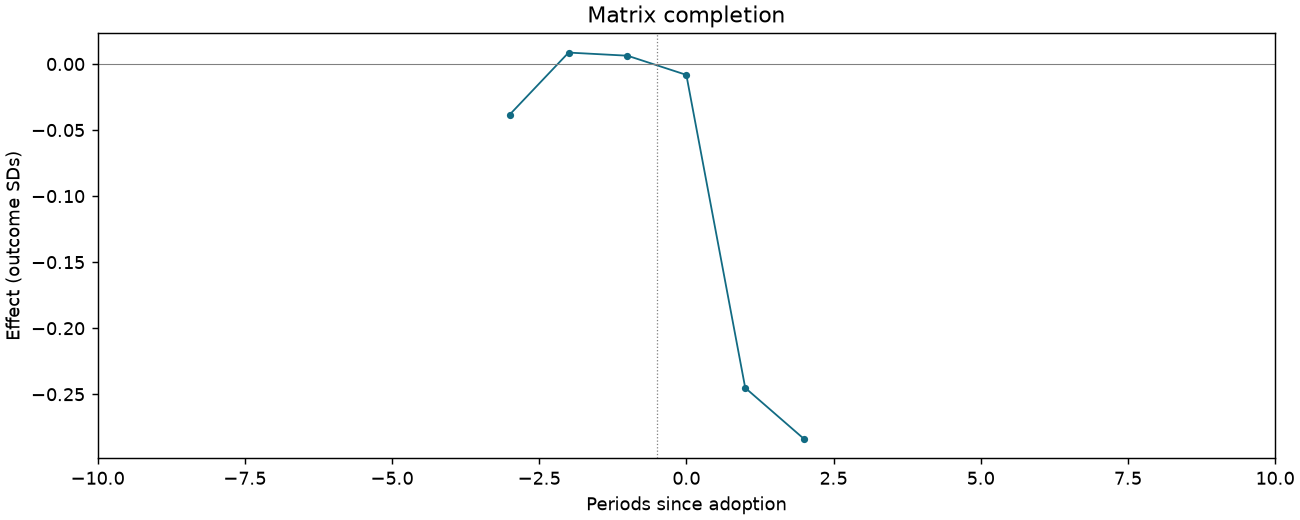
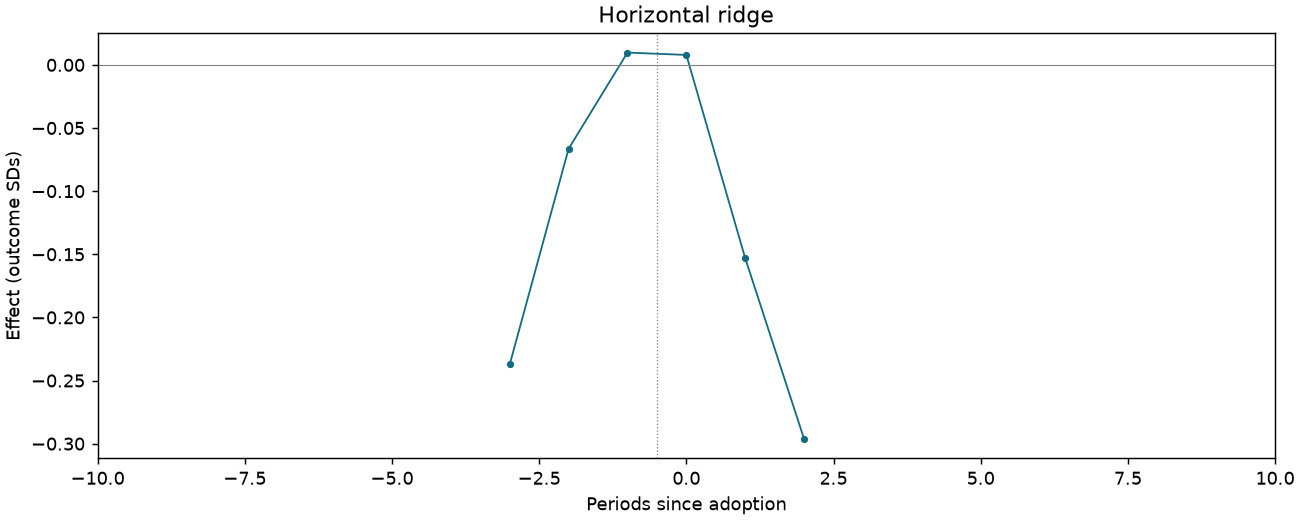
Trust: central government [Table 3 original scale]
1,107 observations · 19 units · 19 clusters · 13 treated / 6 control units.
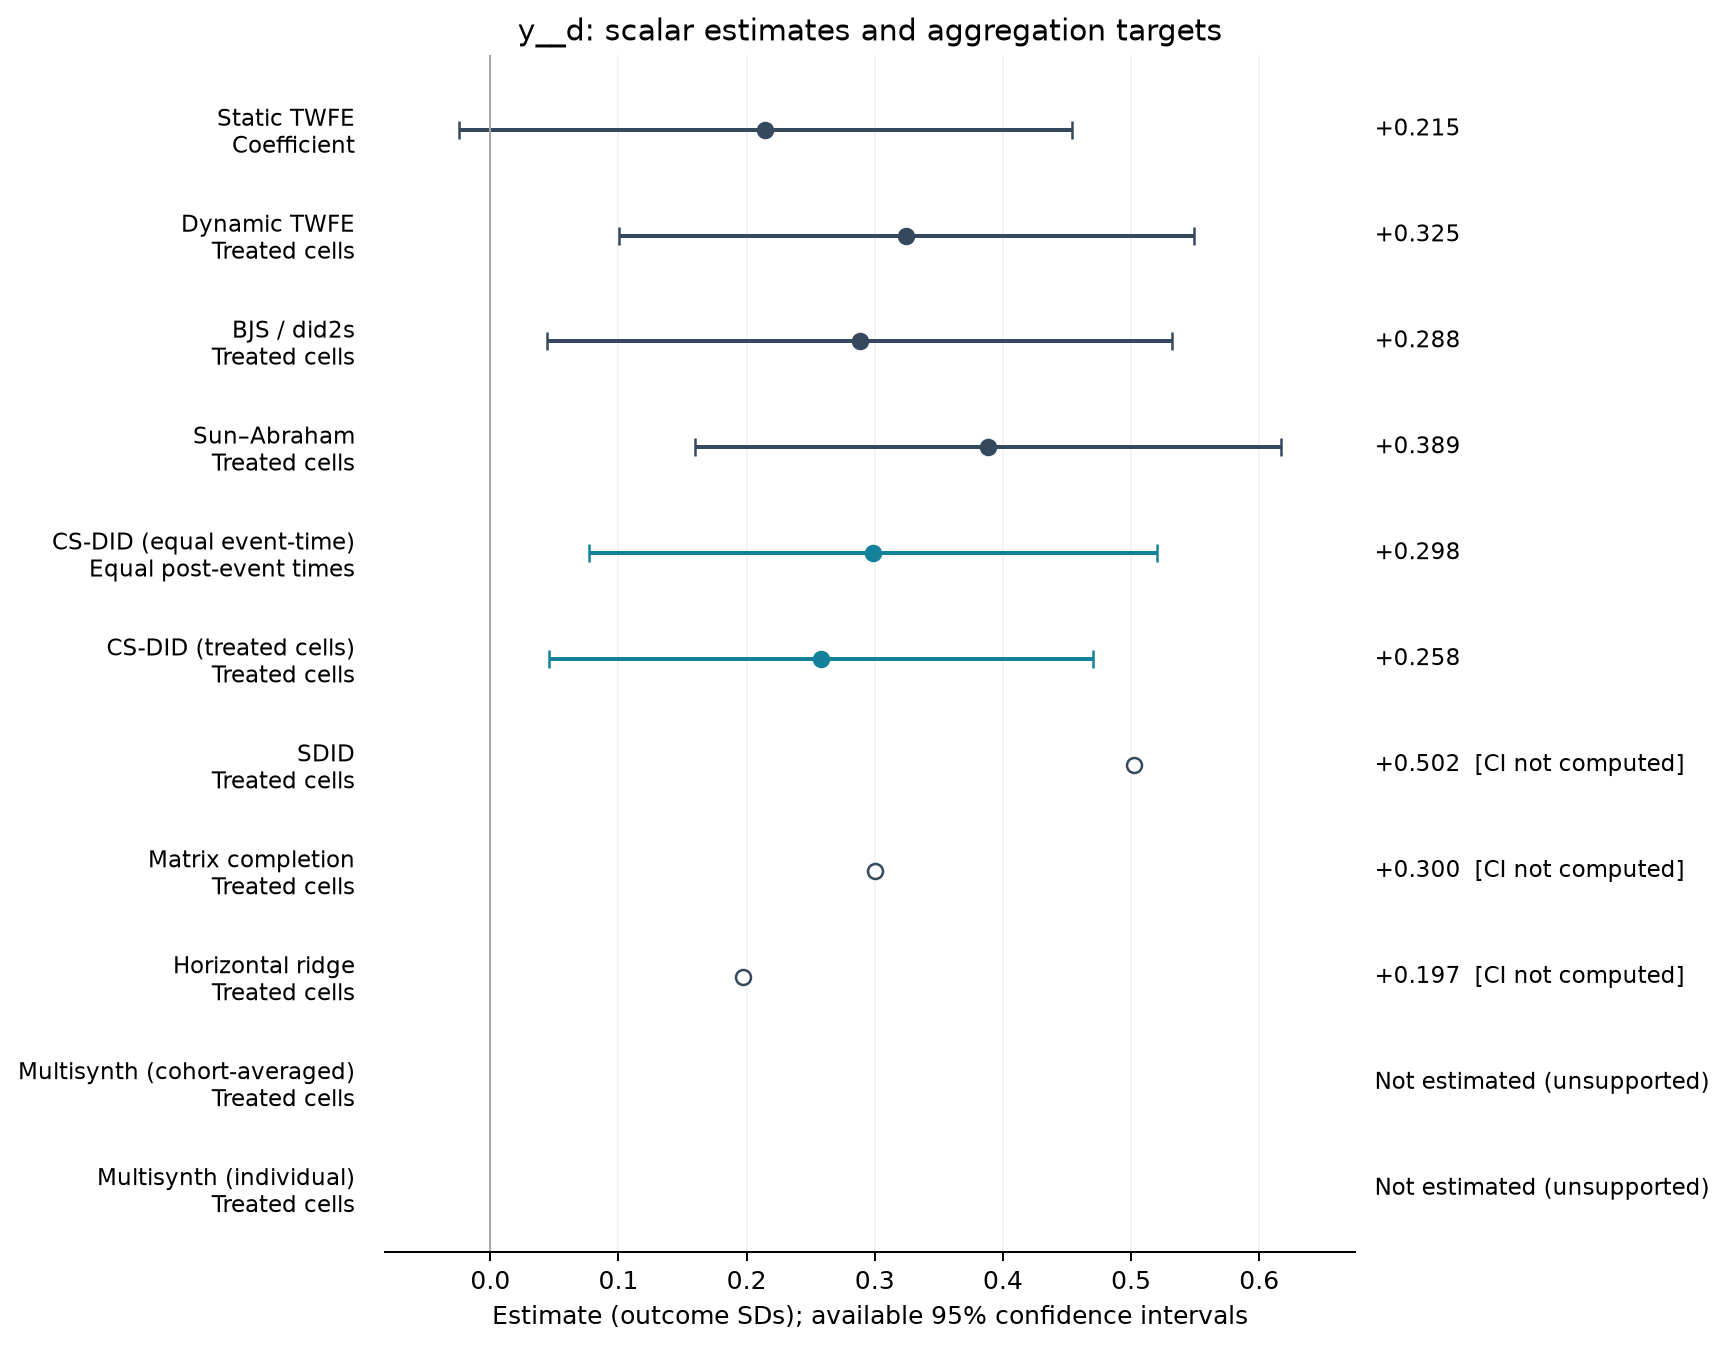
Estimate comparison
| Estimator | Estimate (SDs) | SE | 95% CI | Averaging |
|---|---|---|---|---|
| Static TWFE | 0.215 | 0.114 | [-0.024, 0.454] | Coefficient |
| Dynamic TWFE | 0.325 | 0.107 | [0.100, 0.549] | Treated cells |
| BJS / did2s | 0.288 | 0.116 | [0.045, 0.532] | Treated cells |
| Sun–Abraham | 0.389 | 0.109 | [0.160, 0.617] | Treated cells |
| CS-DID (equal event-time) | 0.298 | 0.113 | [0.077, 0.520] | Equal post-event times |
| CS-DID (treated cells) | 0.258 | 0.108 | [0.045, 0.470] | Treated cells |
| SDID | 0.502 | — | — | Treated cells |
| Matrix completion | 0.300 | — | — | Treated cells |
| Horizontal ridge | 0.197 | — | — | Treated cells |
Event studies
Periods −10 to +10; pointwise 95% intervals where available.
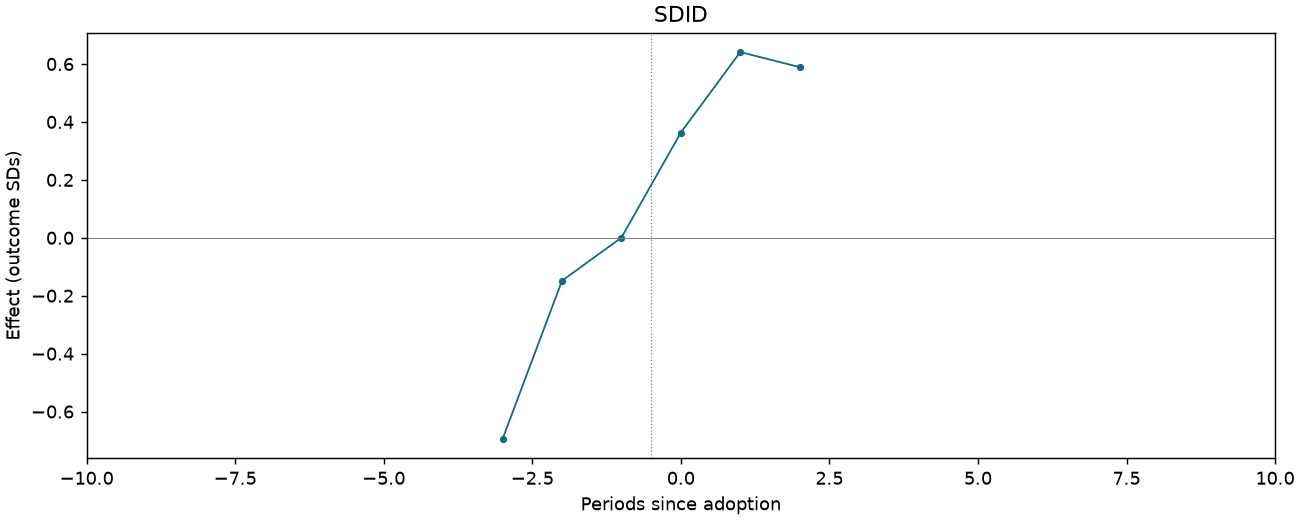
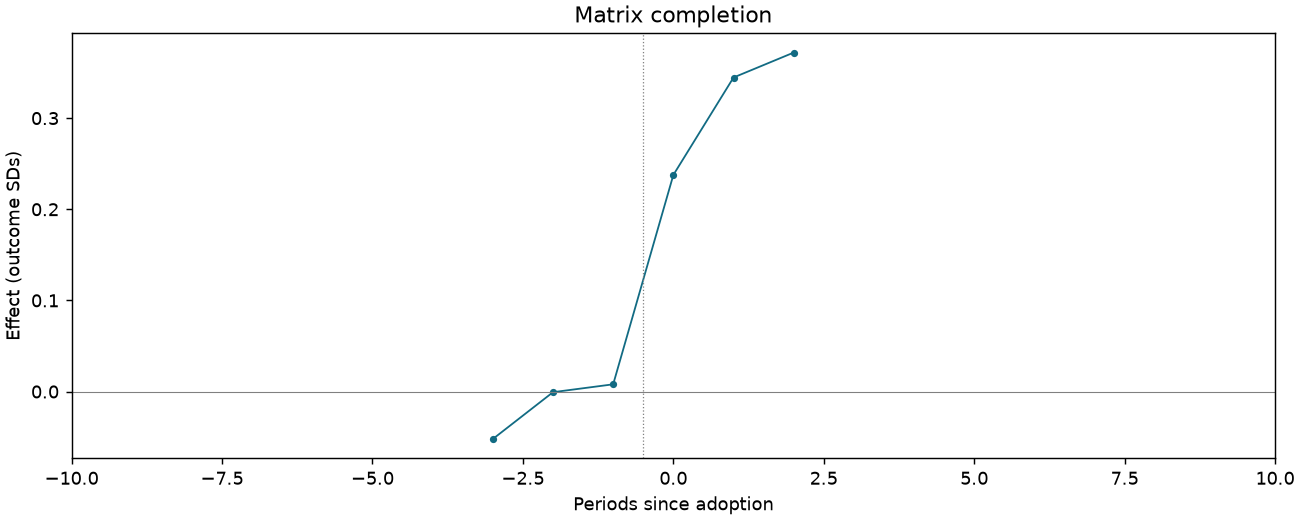
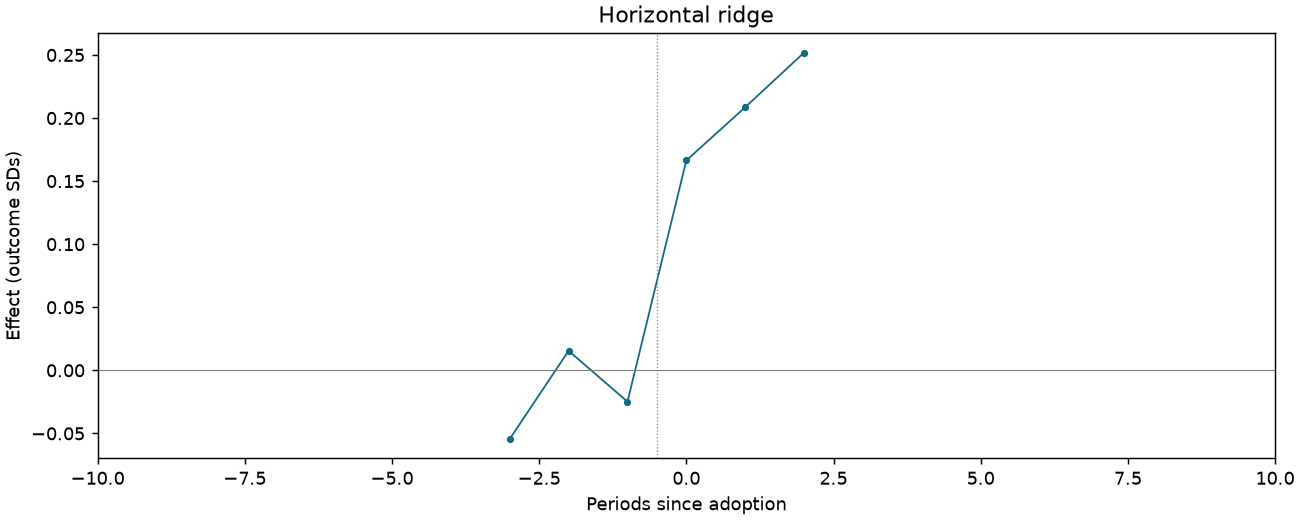
Trust: provincial government [Table 3 original scale]
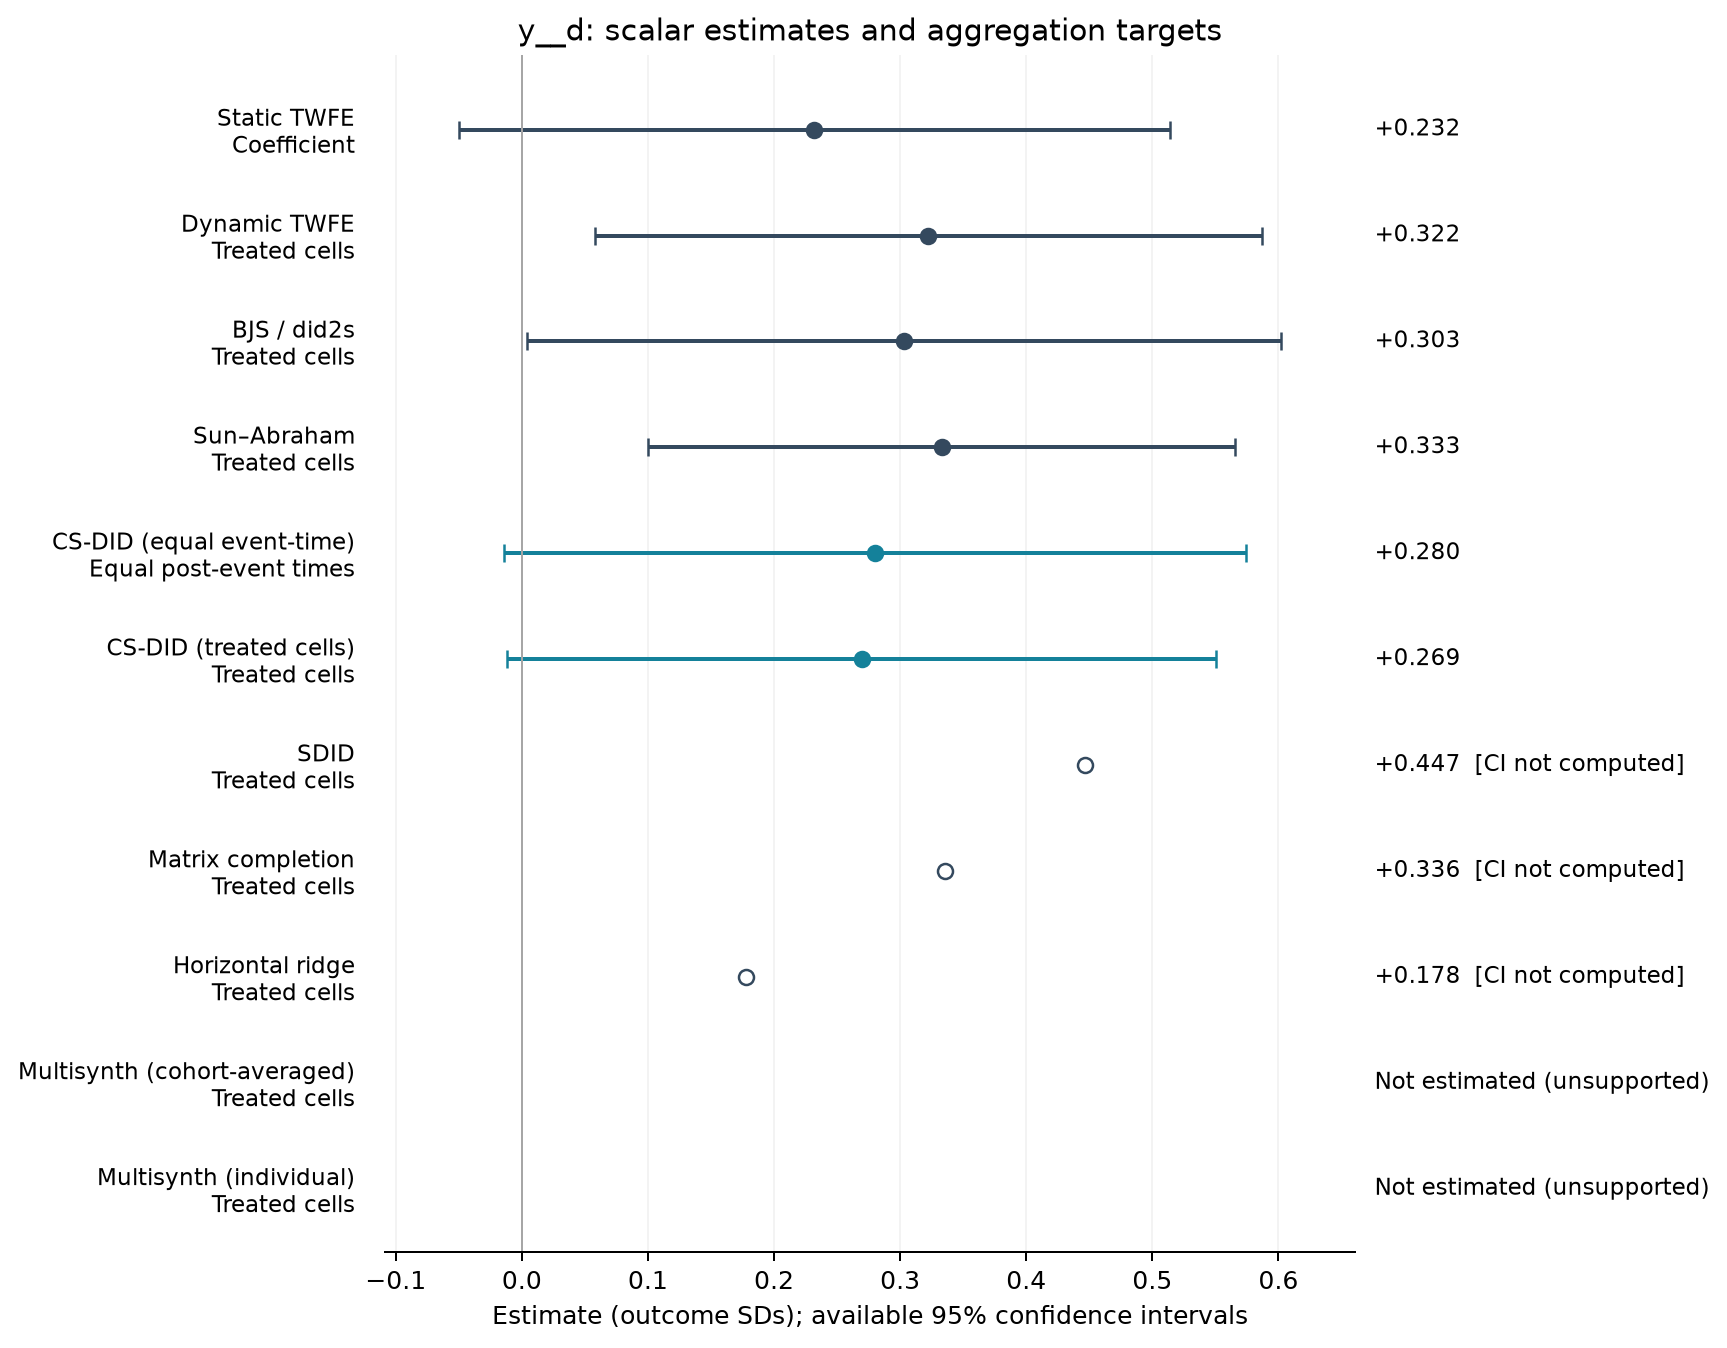
1,106 observations · 19 units · 19 clusters · 13 treated / 6 control units.
Estimate comparison
| Estimator | Estimate (SDs) | SE | 95% CI | Averaging |
|---|---|---|---|---|
| Static TWFE | 0.232 | 0.134 | [-0.050, 0.514] | Coefficient |
| Dynamic TWFE | 0.322 | 0.126 | [0.058, 0.587] | Treated cells |
| BJS / did2s | 0.303 | 0.142 | [0.004, 0.602] | Treated cells |
| Sun–Abraham | 0.333 | 0.111 | [0.100, 0.566] | Treated cells |
| CS-DID (equal event-time) | 0.280 | 0.150 | [-0.014, 0.575] | Equal post-event times |
| CS-DID (treated cells) | 0.269 | 0.143 | [-0.012, 0.551] | Treated cells |
| SDID | 0.447 | — | — | Treated cells |
| Matrix completion | 0.336 | — | — | Treated cells |
| Horizontal ridge | 0.178 | — | — | Treated cells |
Event studies
Periods −10 to +10; pointwise 95% intervals where available.
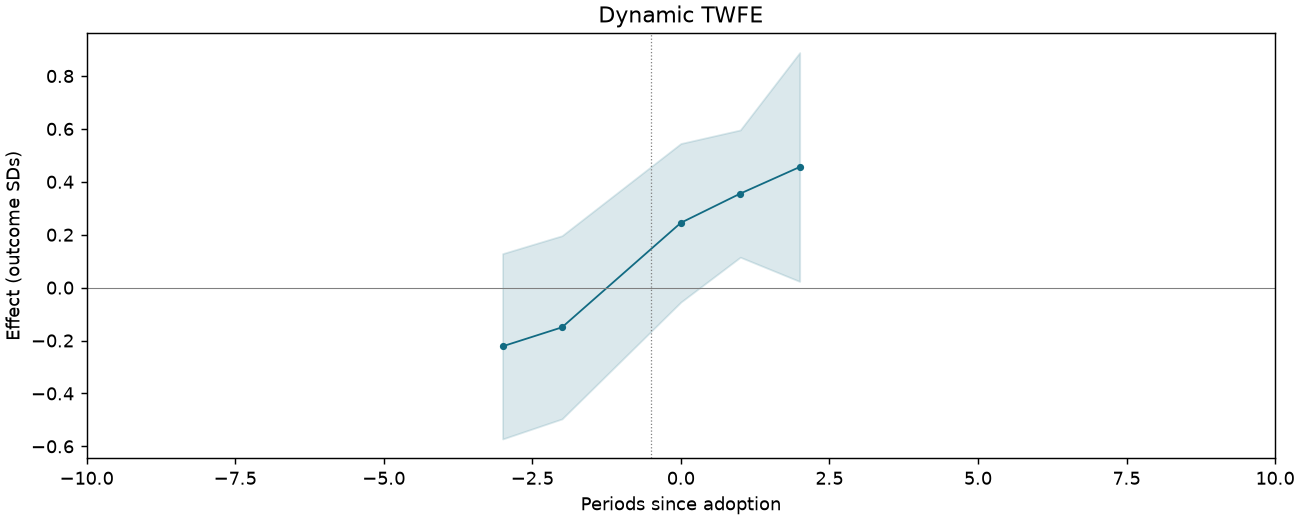
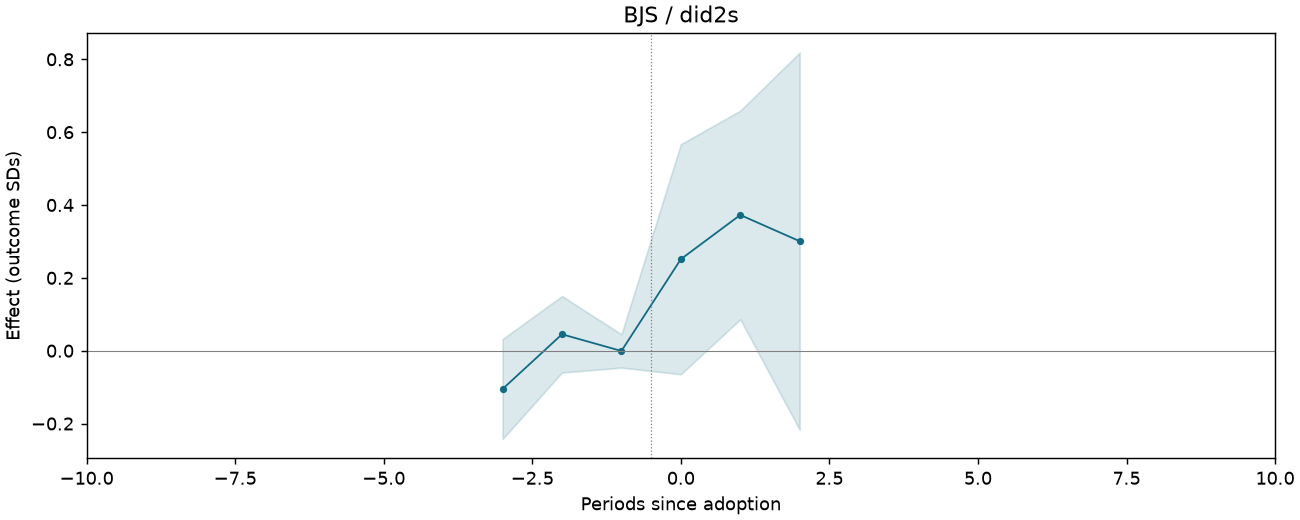
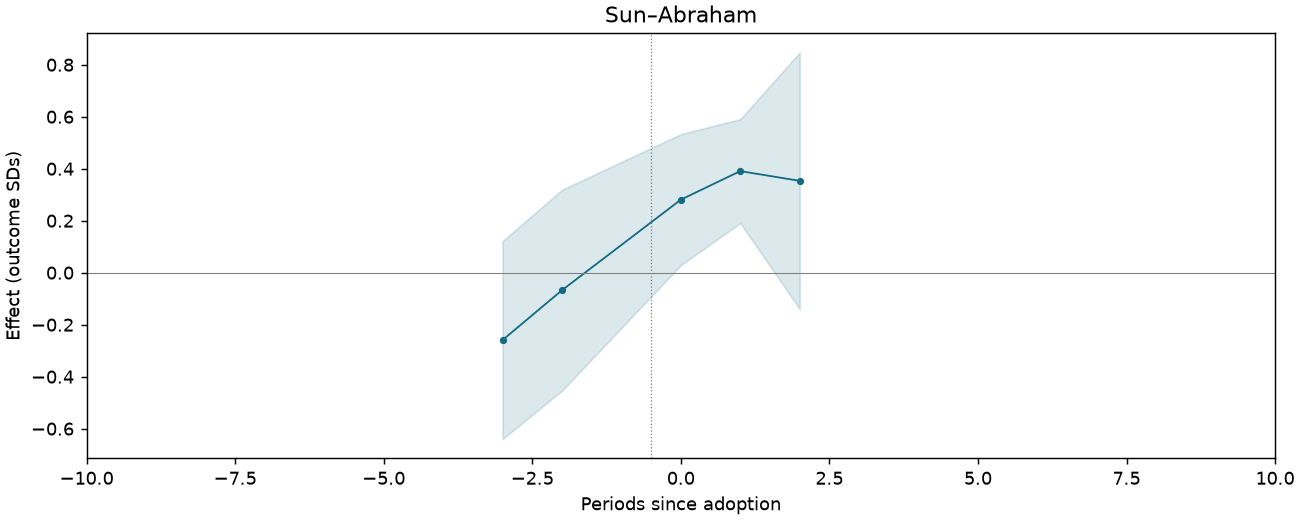
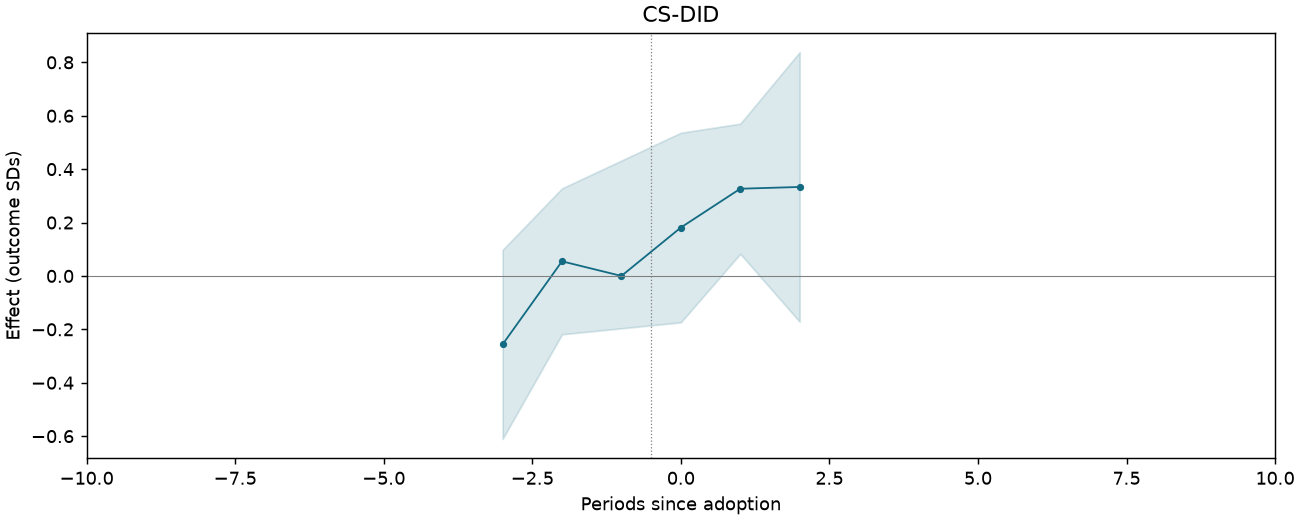
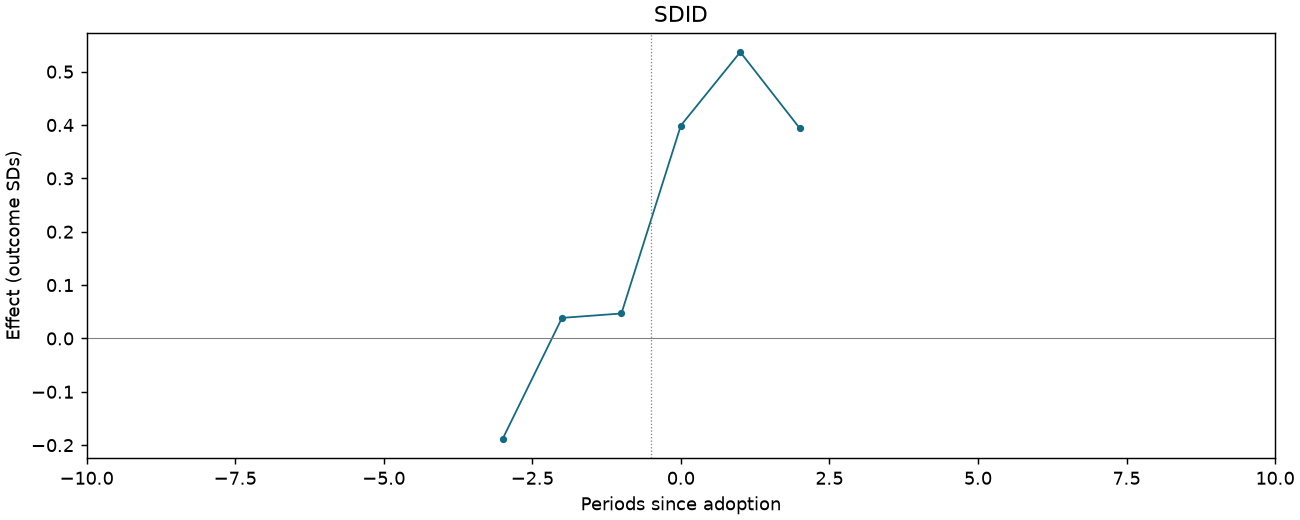
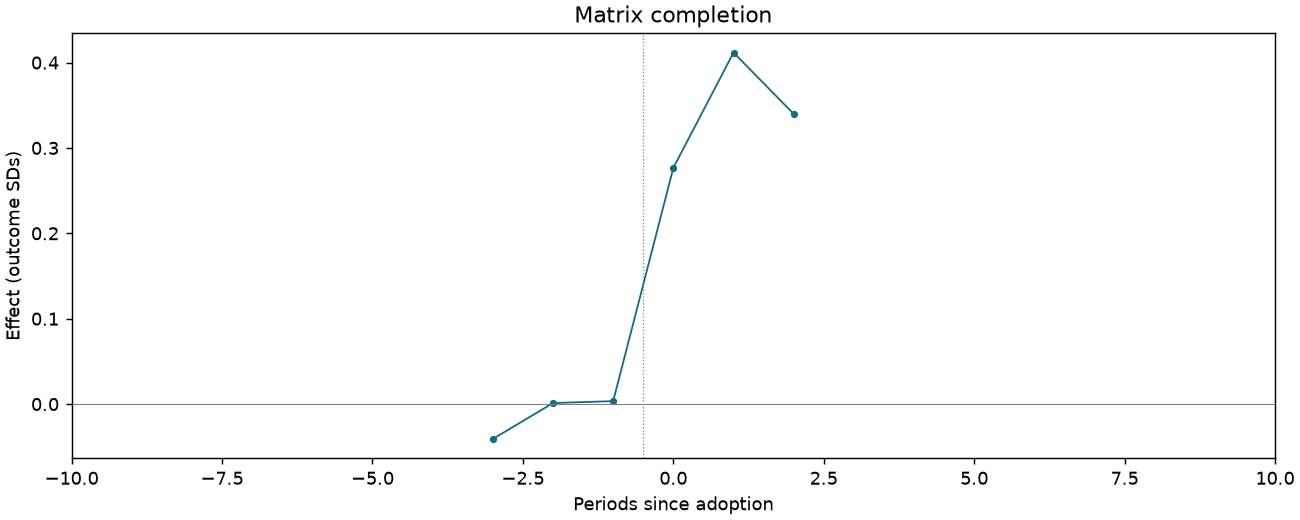
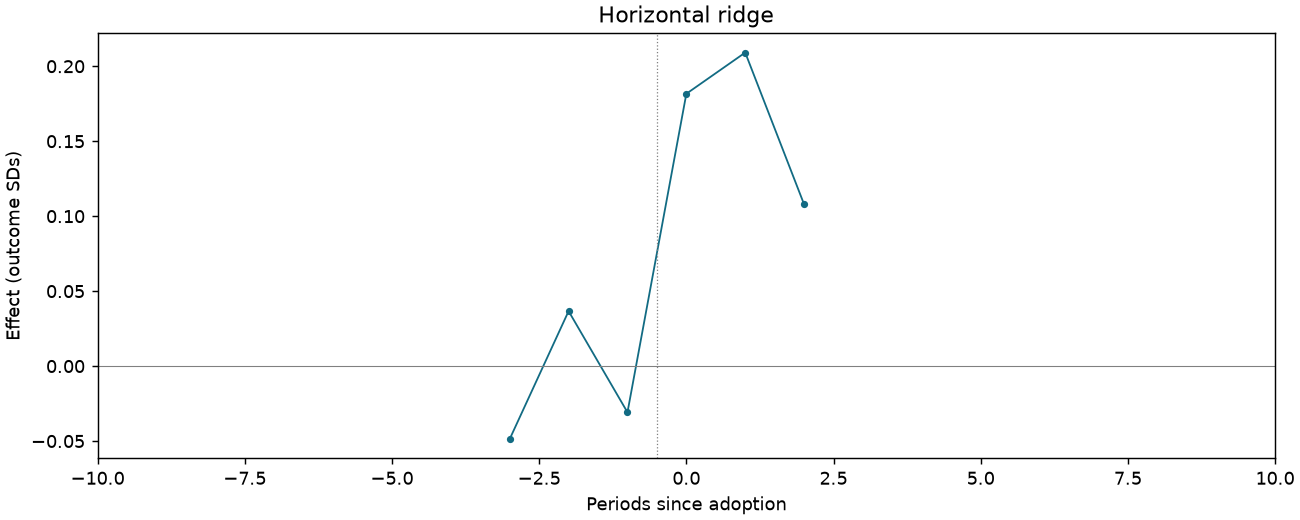
Trust: local government [Table 3 original scale]
1,107 observations · 19 units · 19 clusters · 13 treated / 6 control units.
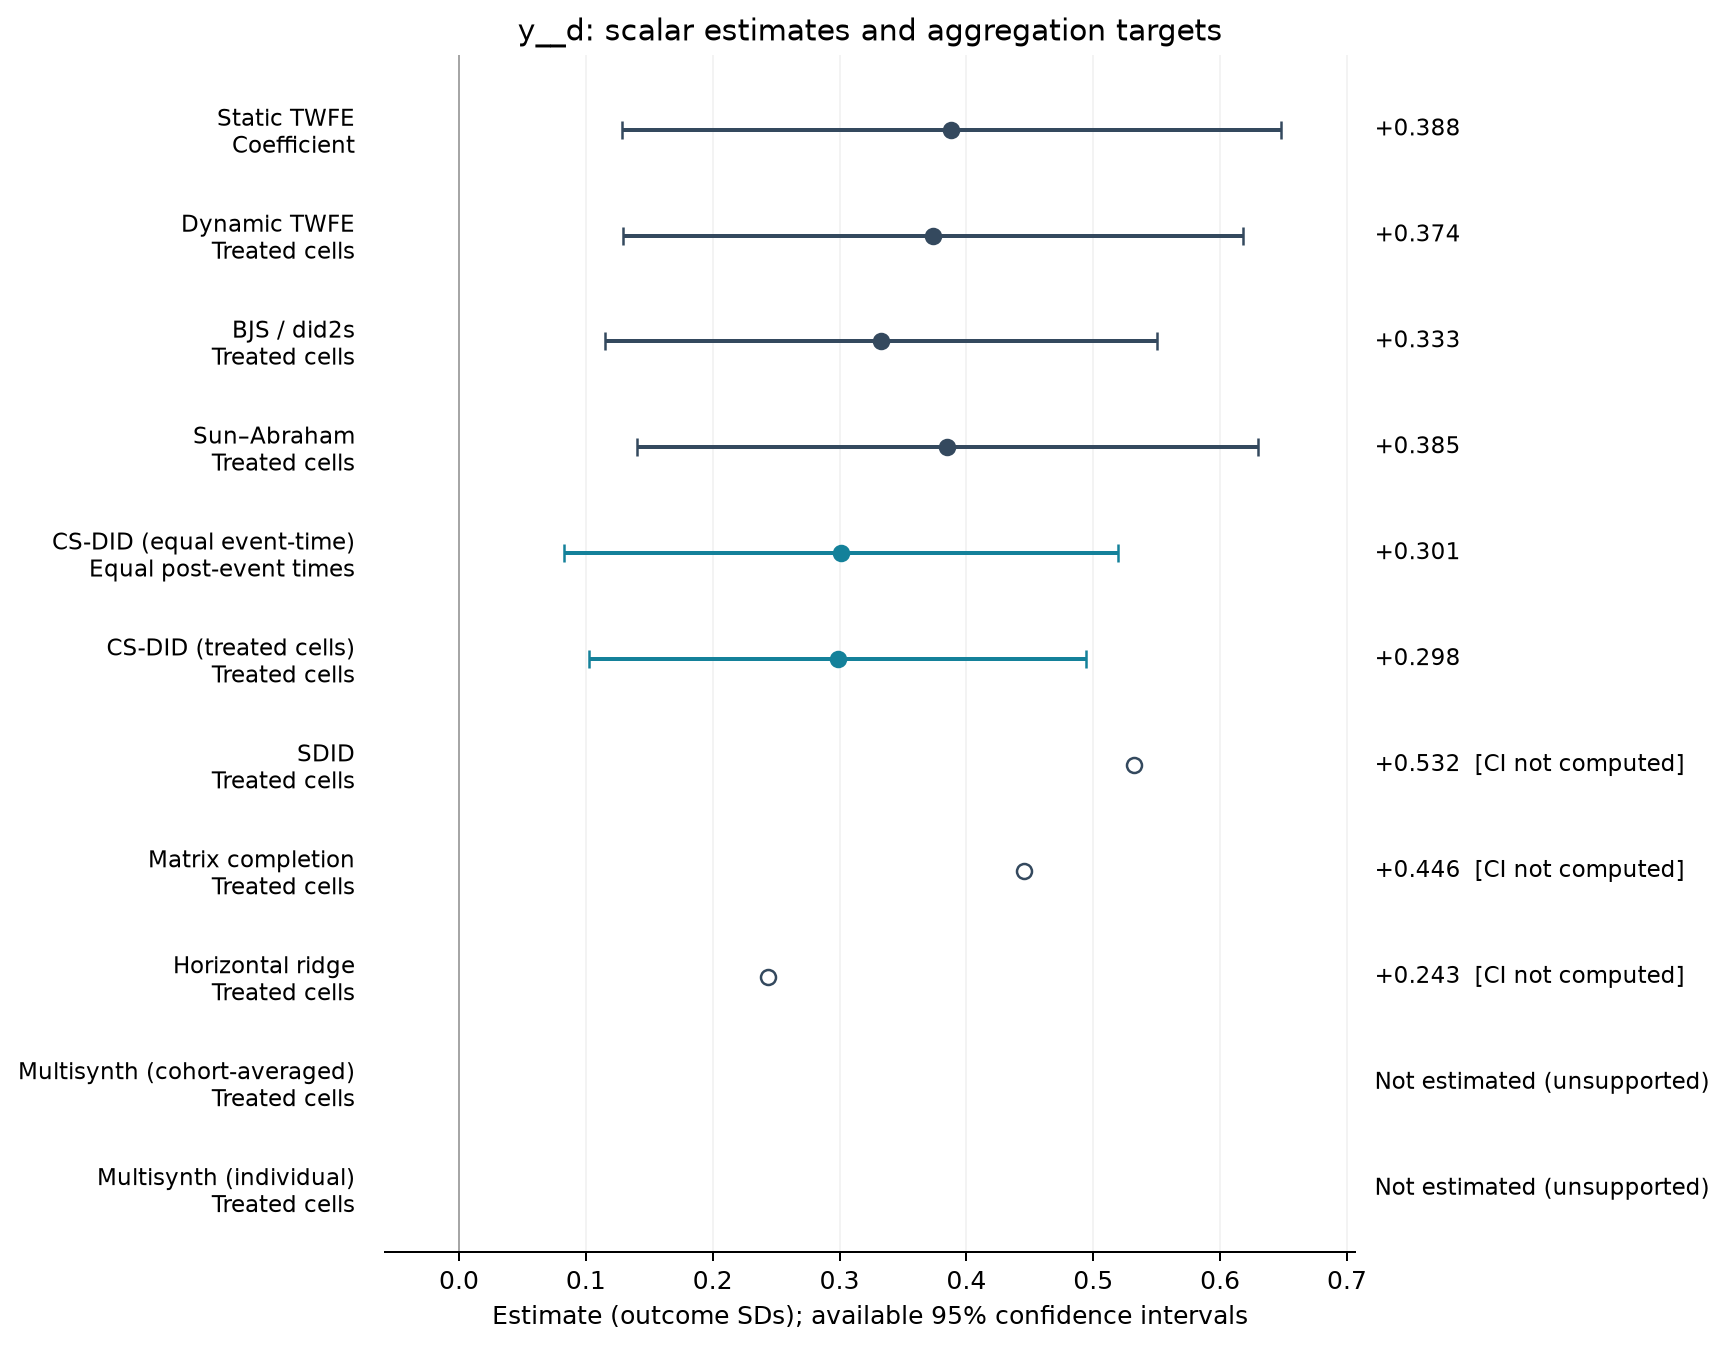
Estimate comparison
| Estimator | Estimate (SDs) | SE | 95% CI | Averaging |
|---|---|---|---|---|
| Static TWFE | 0.388 | 0.124 | [0.128, 0.648] | Coefficient |
| Dynamic TWFE | 0.374 | 0.116 | [0.129, 0.618] | Treated cells |
| BJS / did2s | 0.333 | 0.104 | [0.115, 0.551] | Treated cells |
| Sun–Abraham | 0.385 | 0.116 | [0.140, 0.630] | Treated cells |
| CS-DID (equal event-time) | 0.301 | 0.111 | [0.083, 0.519] | Equal post-event times |
| CS-DID (treated cells) | 0.298 | 0.100 | [0.103, 0.494] | Treated cells |
| SDID | 0.532 | — | — | Treated cells |
| Matrix completion | 0.446 | — | — | Treated cells |
| Horizontal ridge | 0.243 | — | — | Treated cells |
Event studies
Periods −10 to +10; pointwise 95% intervals where available.
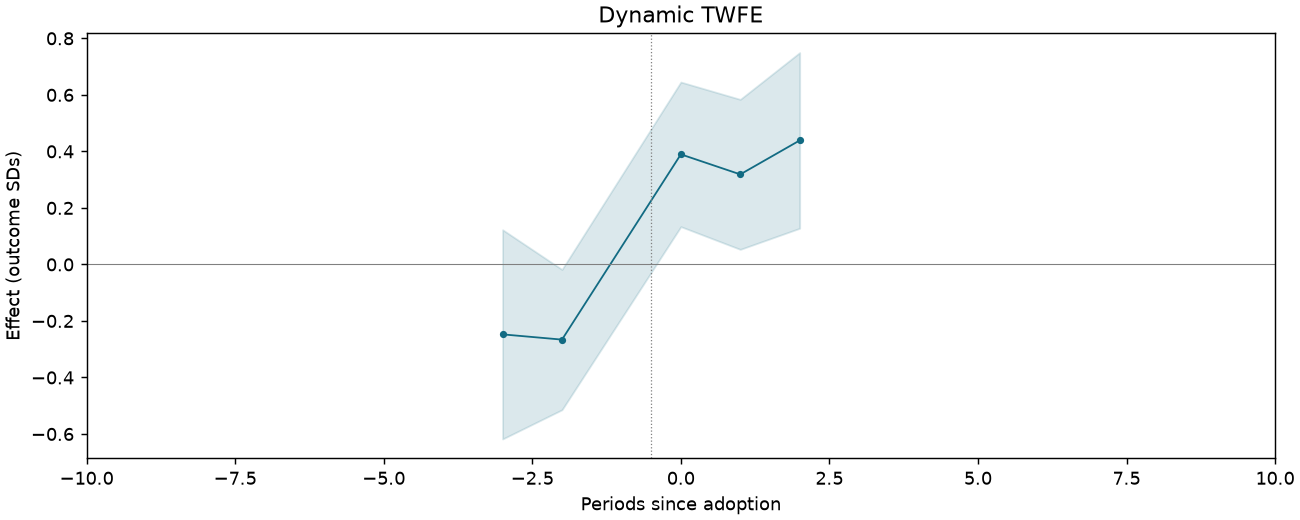
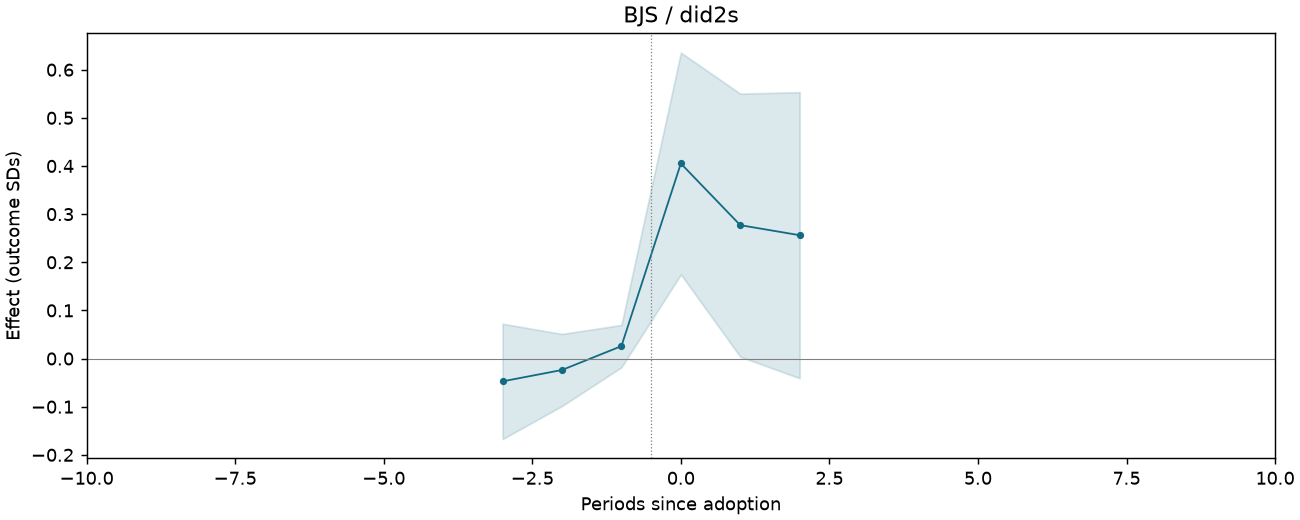
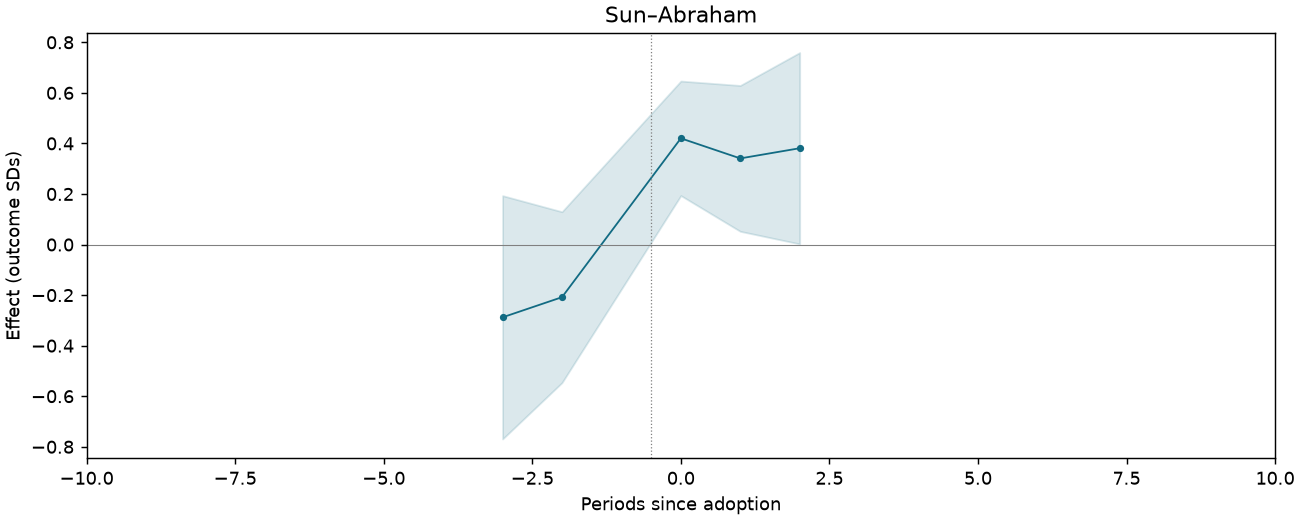
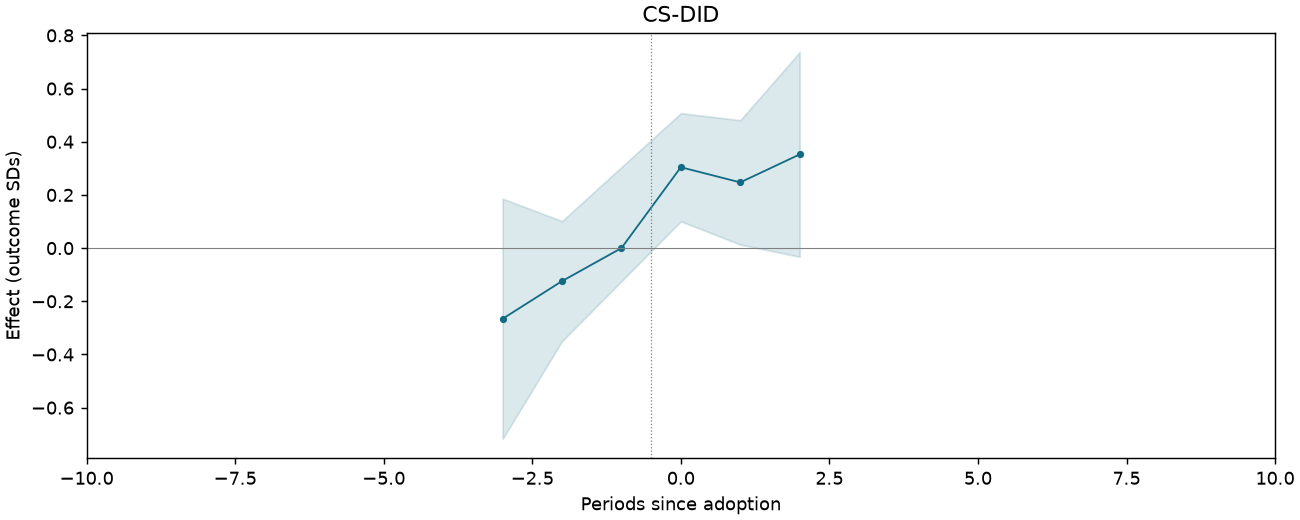
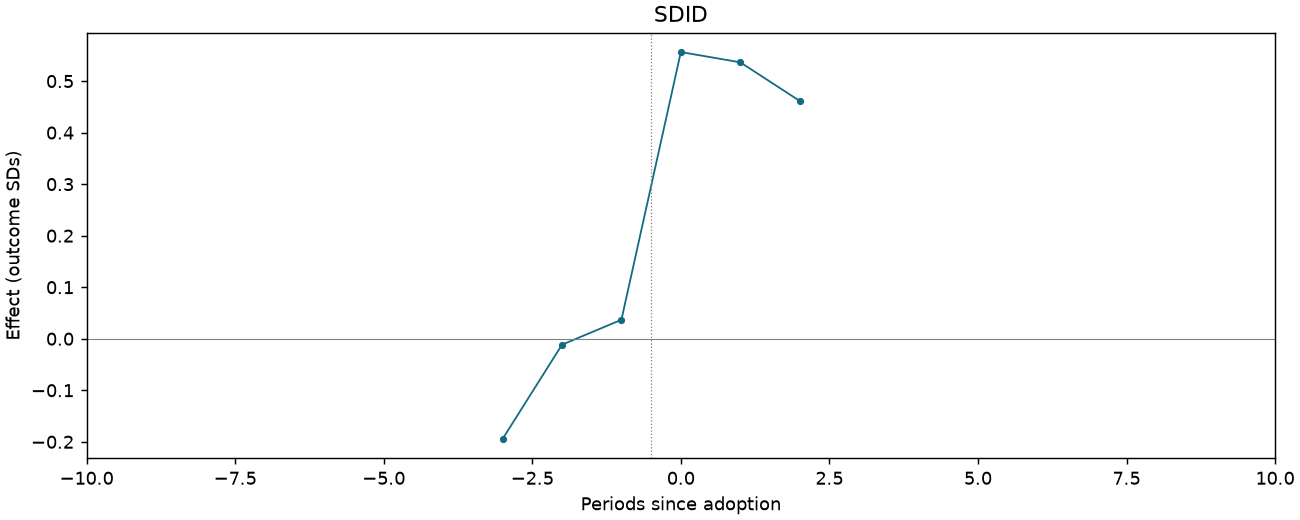
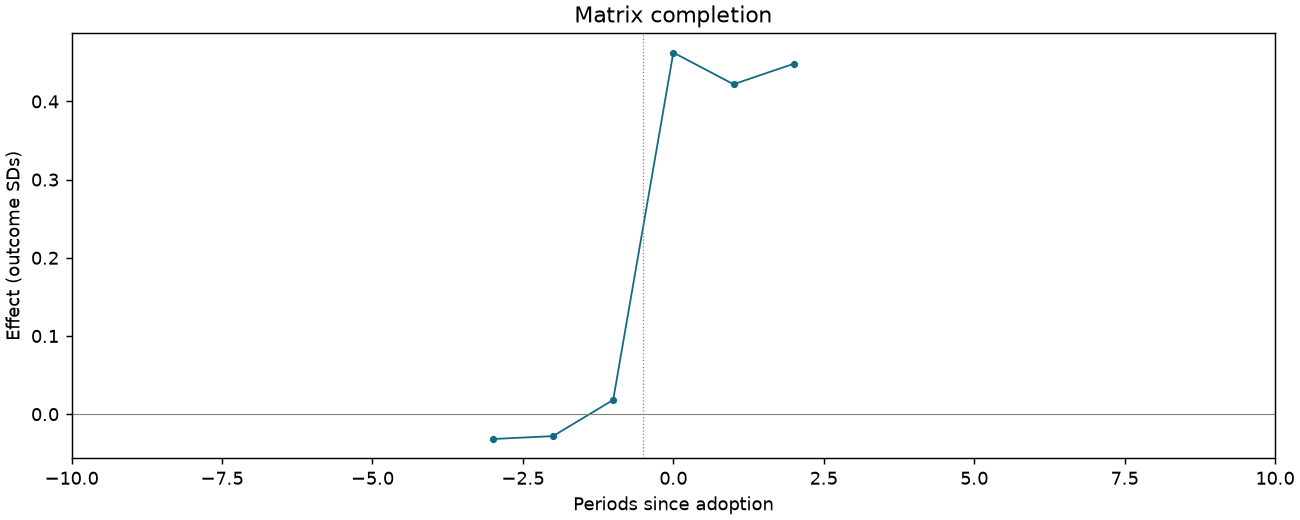
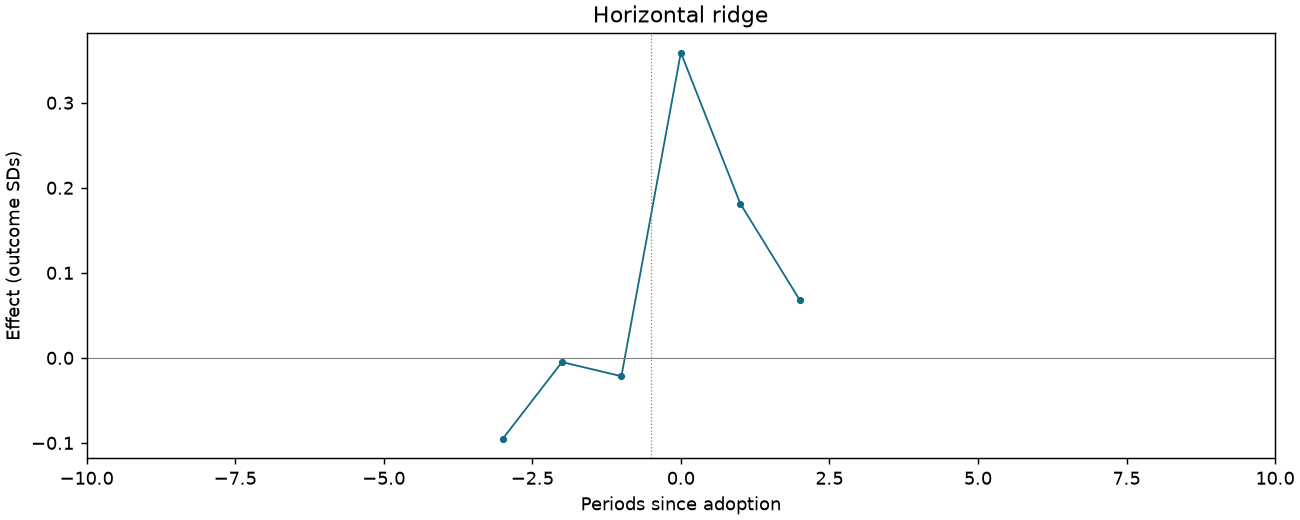
Trust: courts [Table 3 original scale]
1,107 observations · 19 units · 19 clusters · 13 treated / 6 control units.
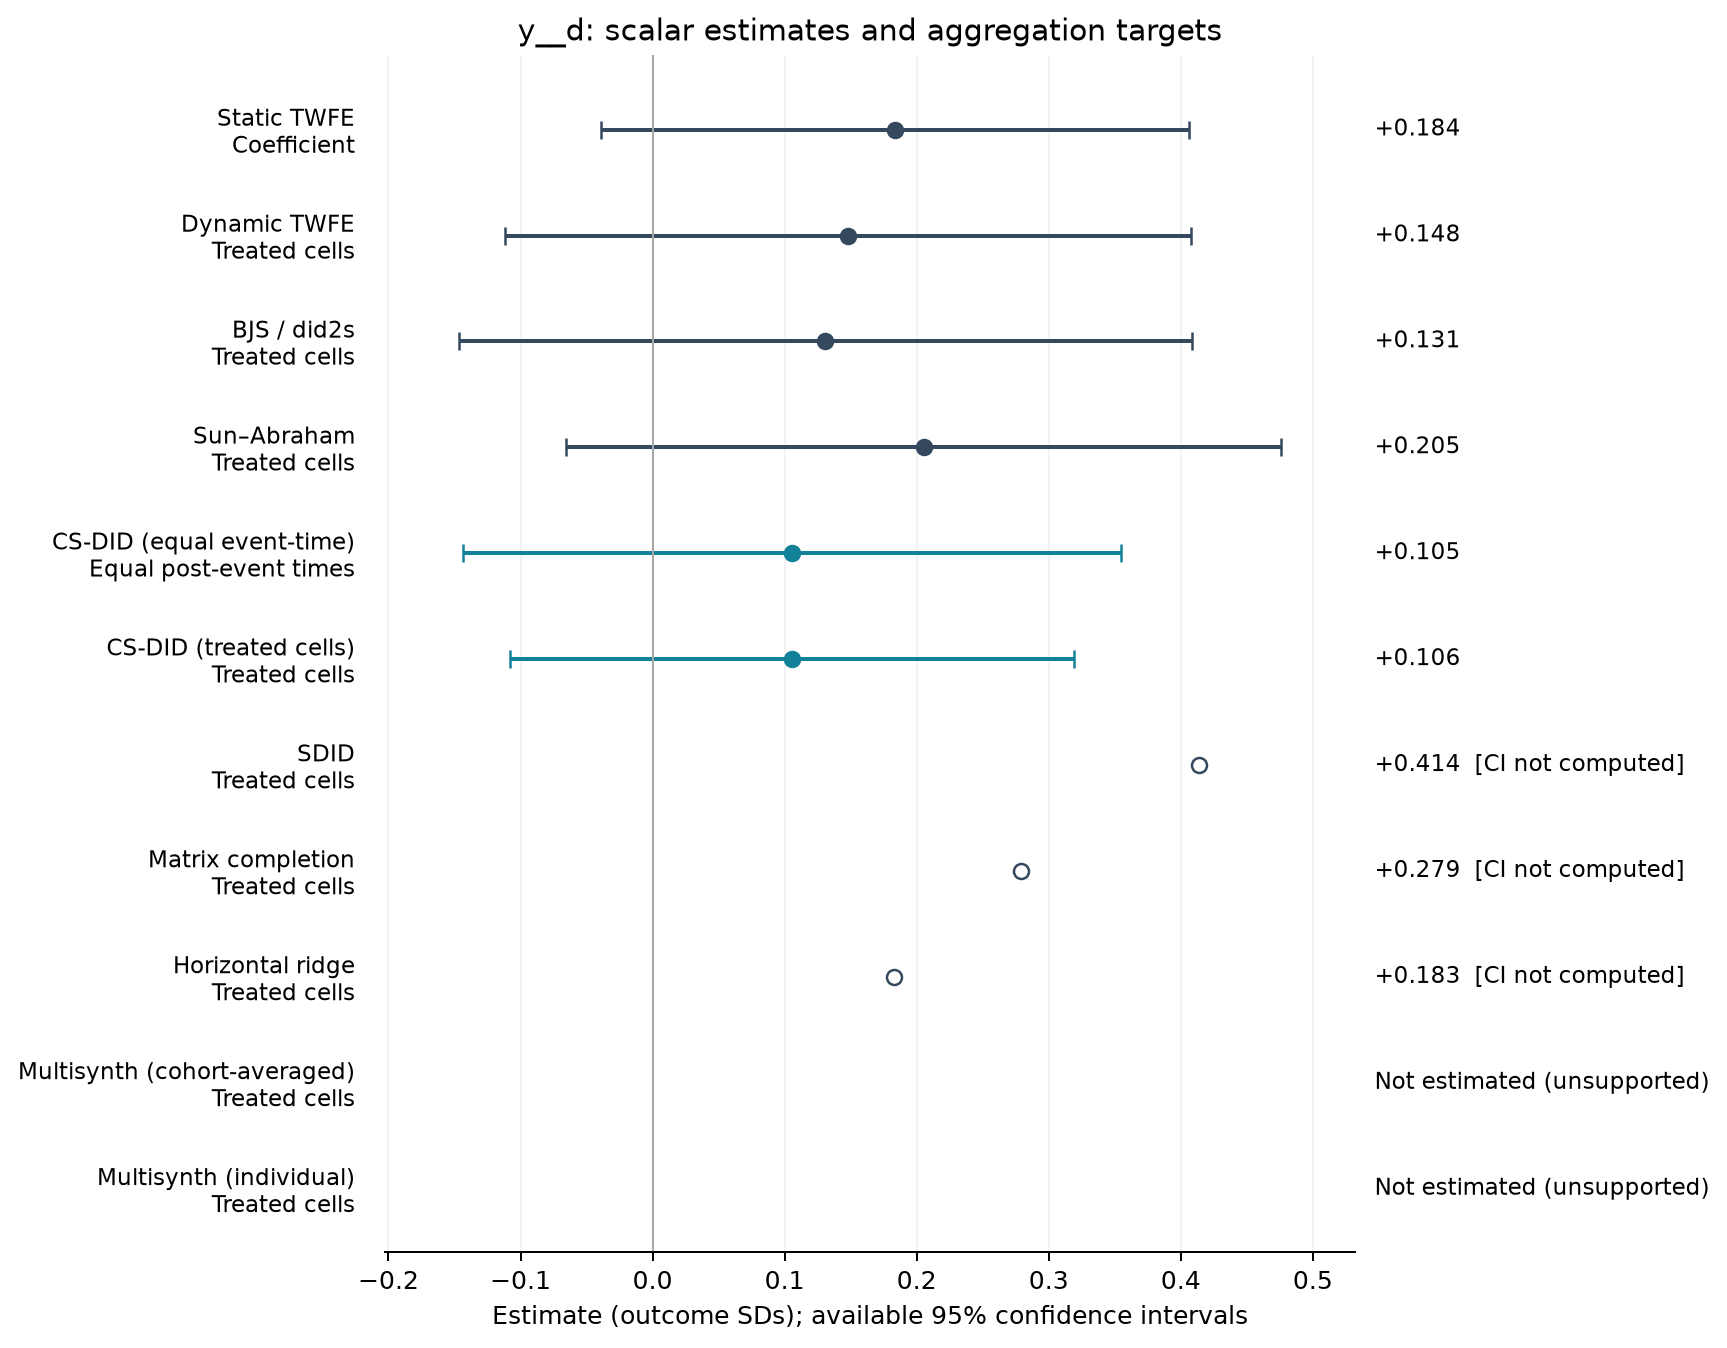
Estimate comparison
| Estimator | Estimate (SDs) | SE | 95% CI | Averaging |
|---|---|---|---|---|
| Static TWFE | 0.184 | 0.106 | [-0.039, 0.406] | Coefficient |
| Dynamic TWFE | 0.148 | 0.124 | [-0.112, 0.408] | Treated cells |
| BJS / did2s | 0.131 | 0.132 | [-0.147, 0.408] | Treated cells |
| Sun–Abraham | 0.205 | 0.129 | [-0.065, 0.476] | Treated cells |
| CS-DID (equal event-time) | 0.105 | 0.127 | [-0.143, 0.354] | Equal post-event times |
| CS-DID (treated cells) | 0.106 | 0.109 | [-0.108, 0.319] | Treated cells |
| SDID | 0.414 | — | — | Treated cells |
| Matrix completion | 0.279 | — | — | Treated cells |
| Horizontal ridge | 0.183 | — | — | Treated cells |
Event studies
Periods −10 to +10; pointwise 95% intervals where available.
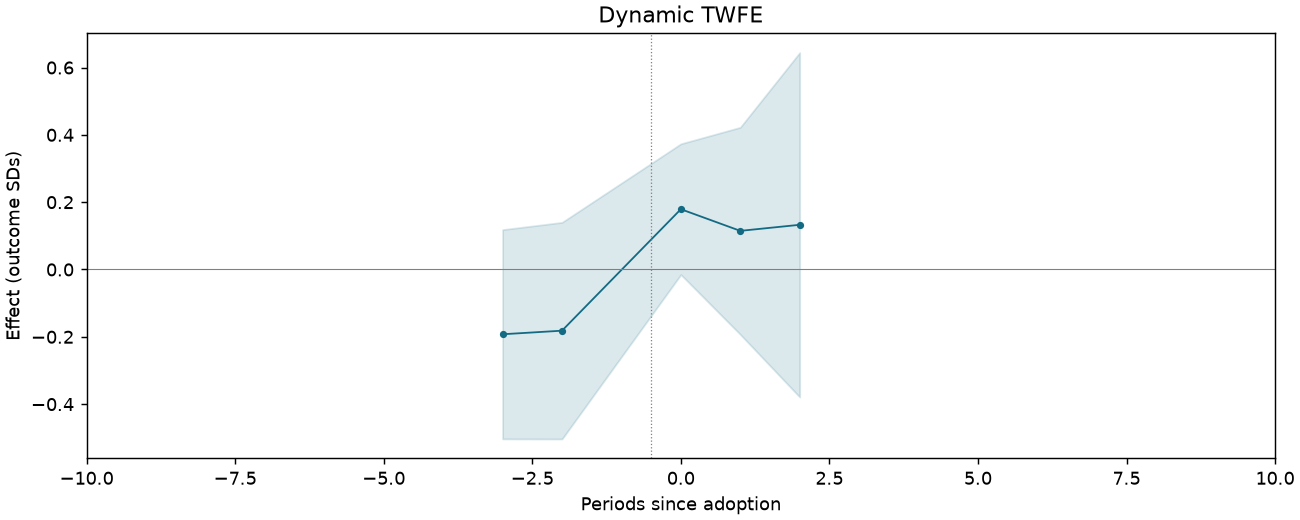
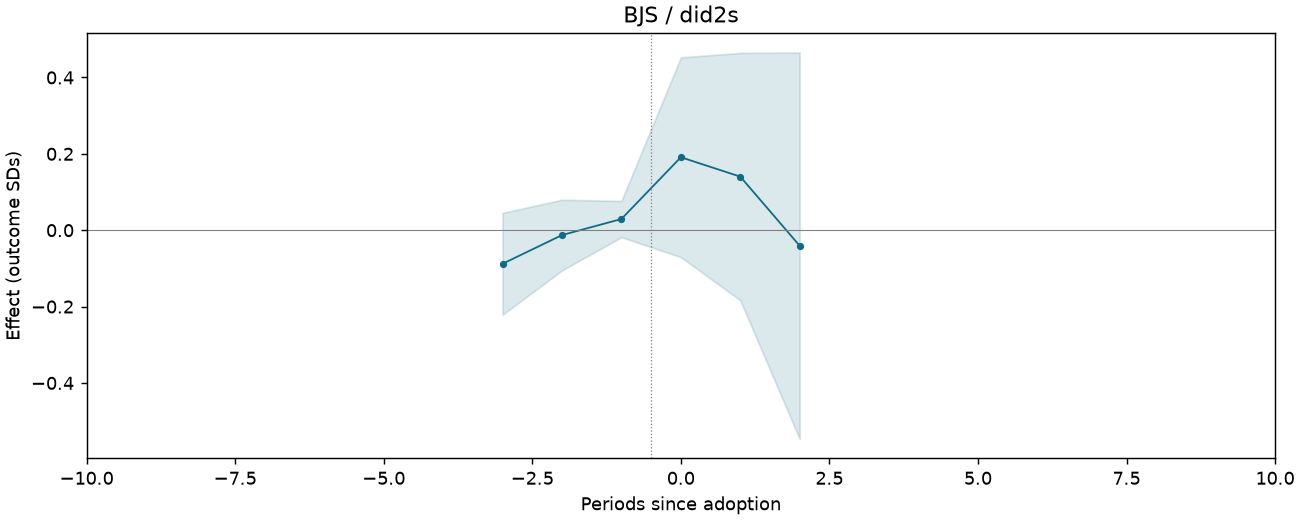
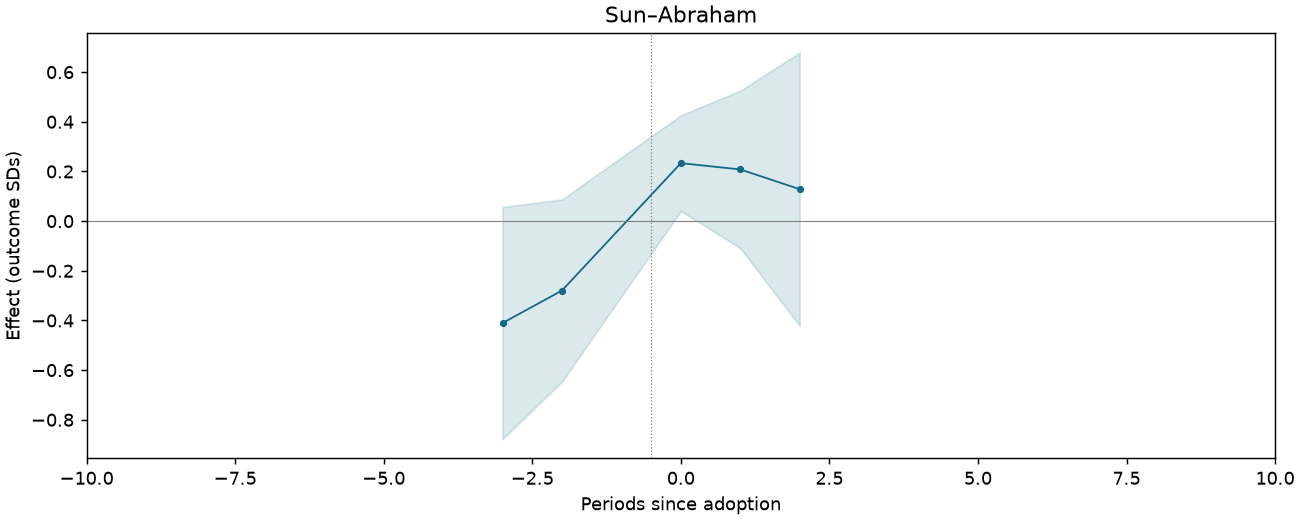
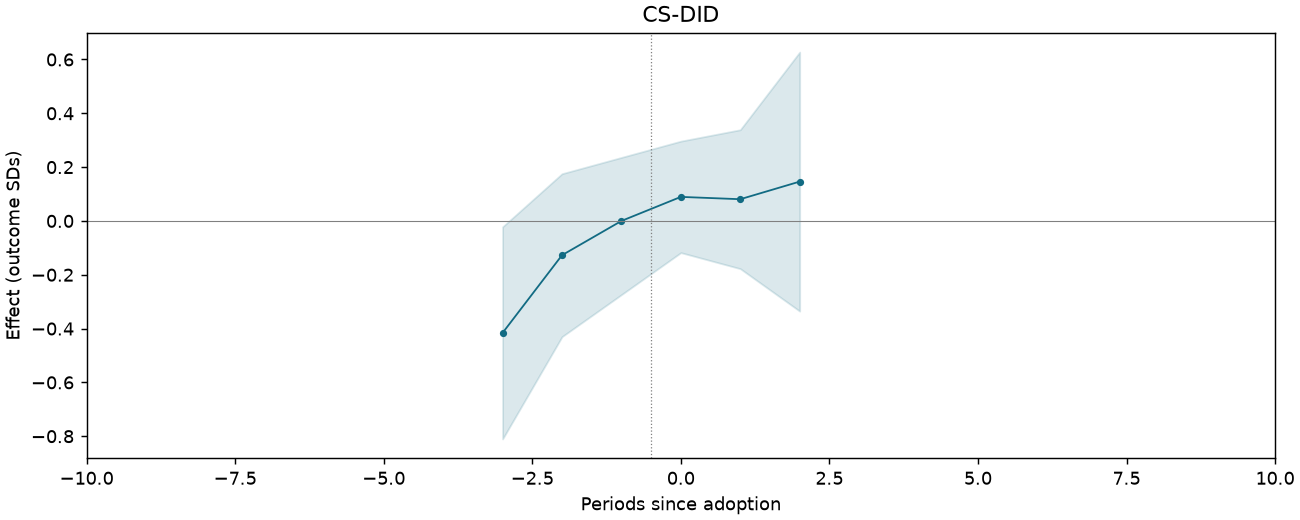
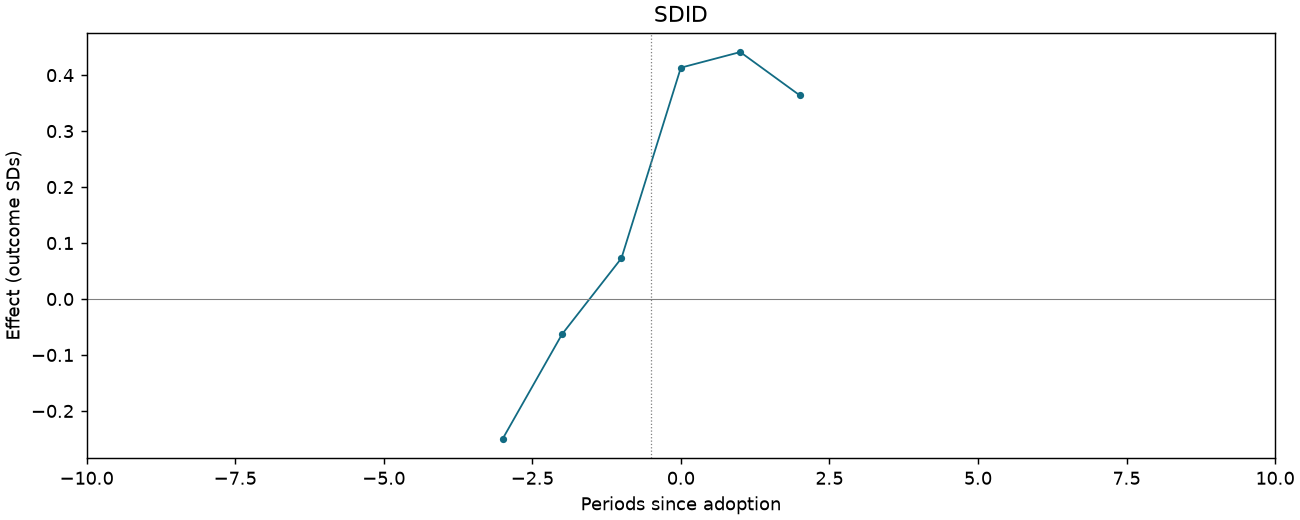
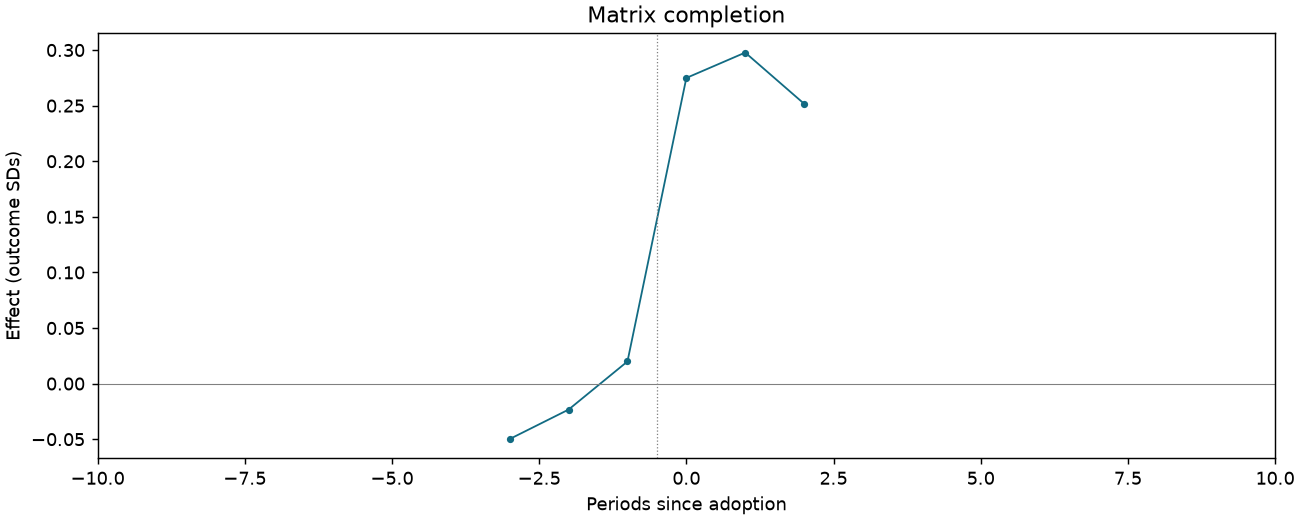
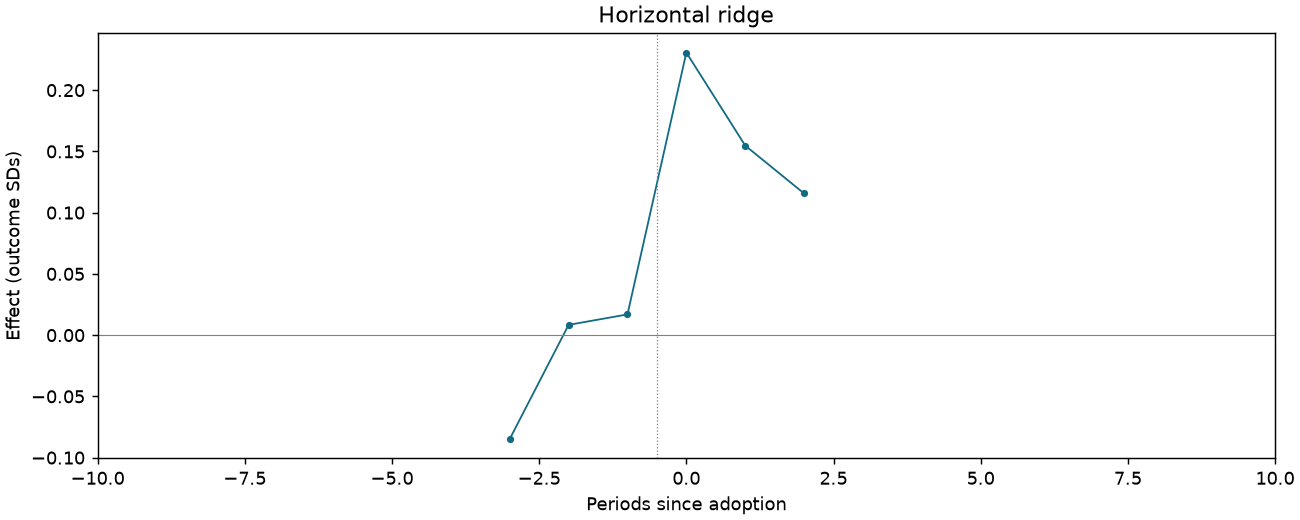
Trust: armed forces [Table 3 original scale]
1,106 observations · 19 units · 19 clusters · 13 treated / 6 control units.
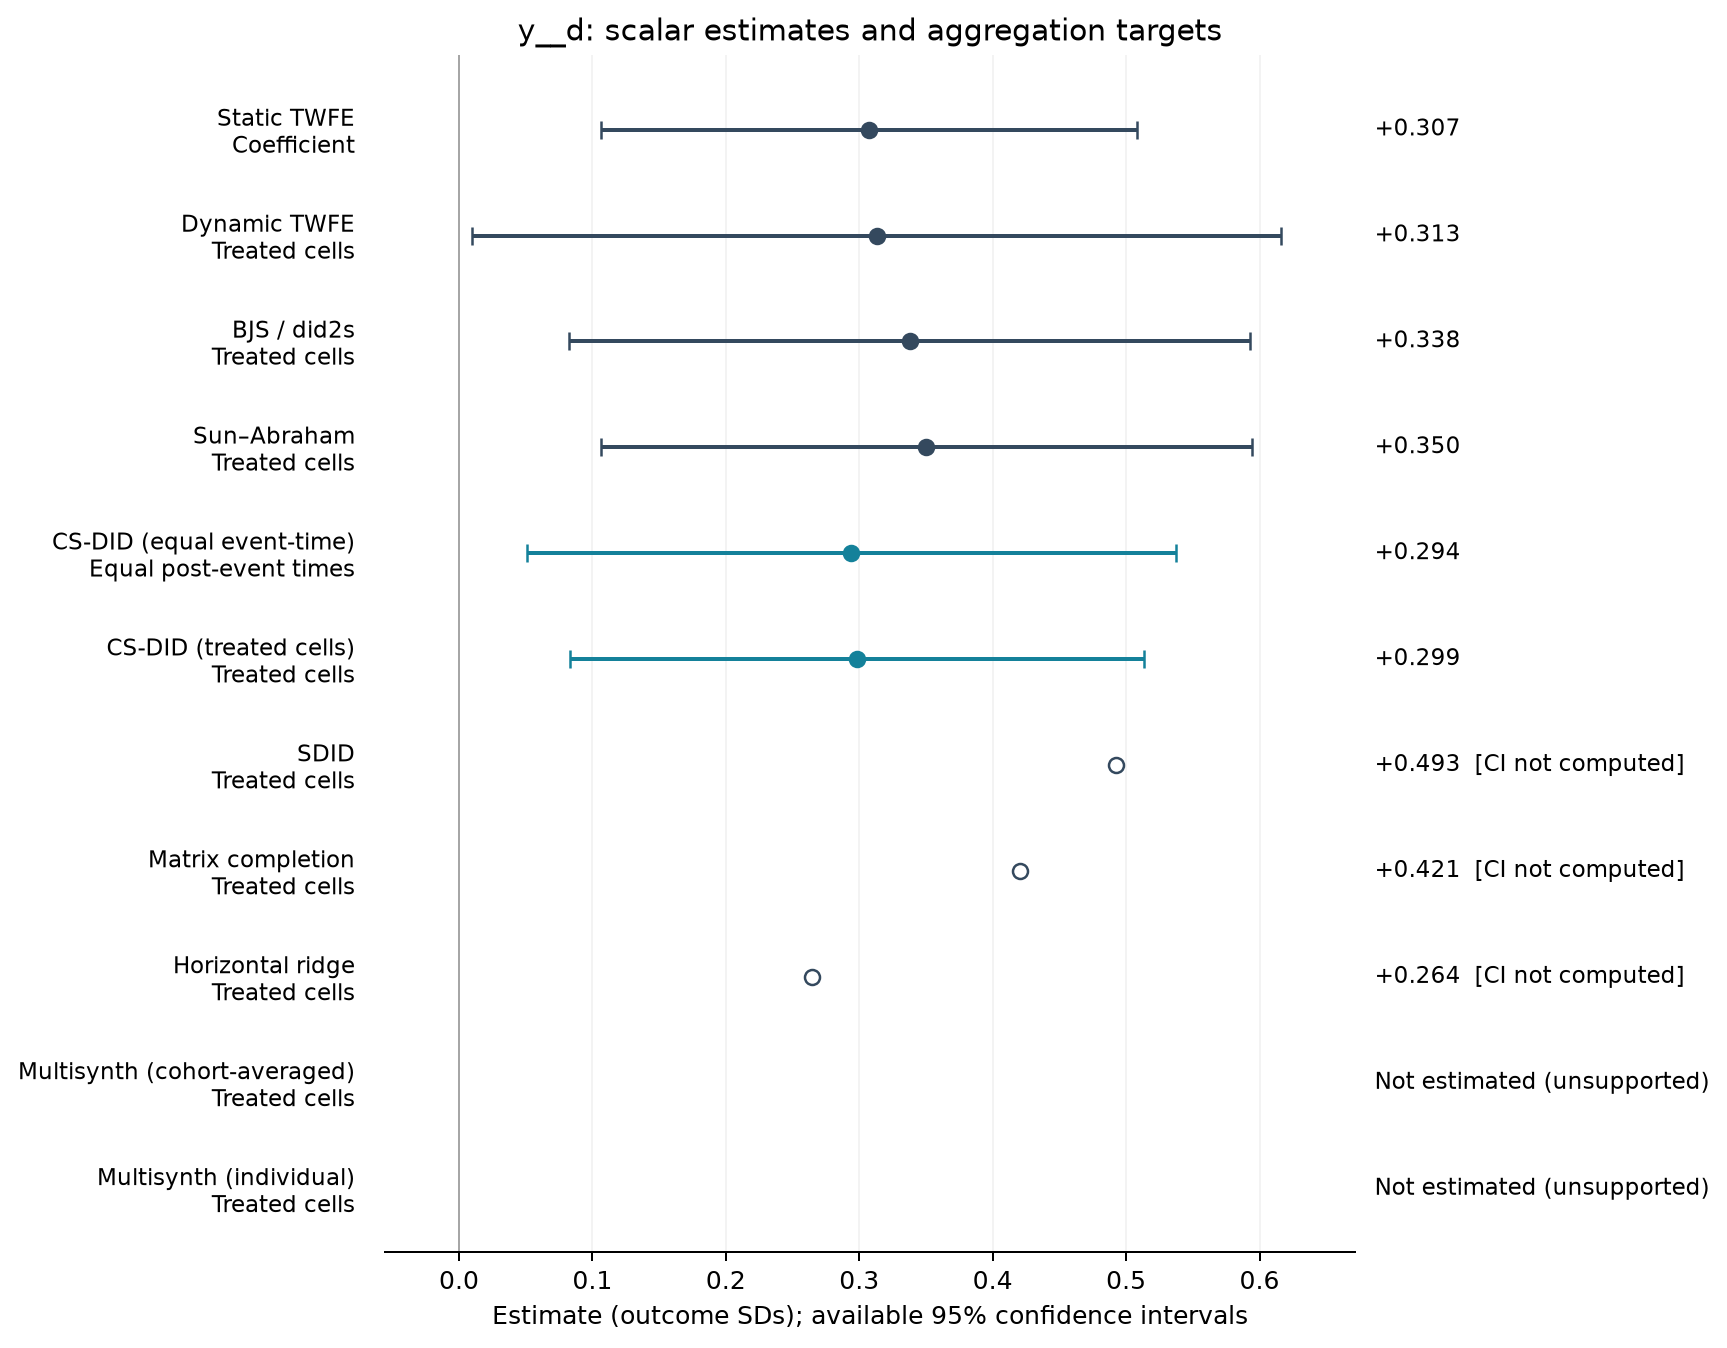
Estimate comparison
| Estimator | Estimate (SDs) | SE | 95% CI | Averaging |
|---|---|---|---|---|
| Static TWFE | 0.307 | 0.096 | [0.107, 0.508] | Coefficient |
| Dynamic TWFE | 0.313 | 0.144 | [0.010, 0.616] | Treated cells |
| BJS / did2s | 0.338 | 0.121 | [0.083, 0.593] | Treated cells |
| Sun–Abraham | 0.350 | 0.116 | [0.106, 0.594] | Treated cells |
| CS-DID (equal event-time) | 0.294 | 0.124 | [0.051, 0.537] | Equal post-event times |
| CS-DID (treated cells) | 0.299 | 0.110 | [0.083, 0.514] | Treated cells |
| SDID | 0.493 | — | — | Treated cells |
| Matrix completion | 0.421 | — | — | Treated cells |
| Horizontal ridge | 0.264 | — | — | Treated cells |
Event studies
Periods −10 to +10; pointwise 95% intervals where available.
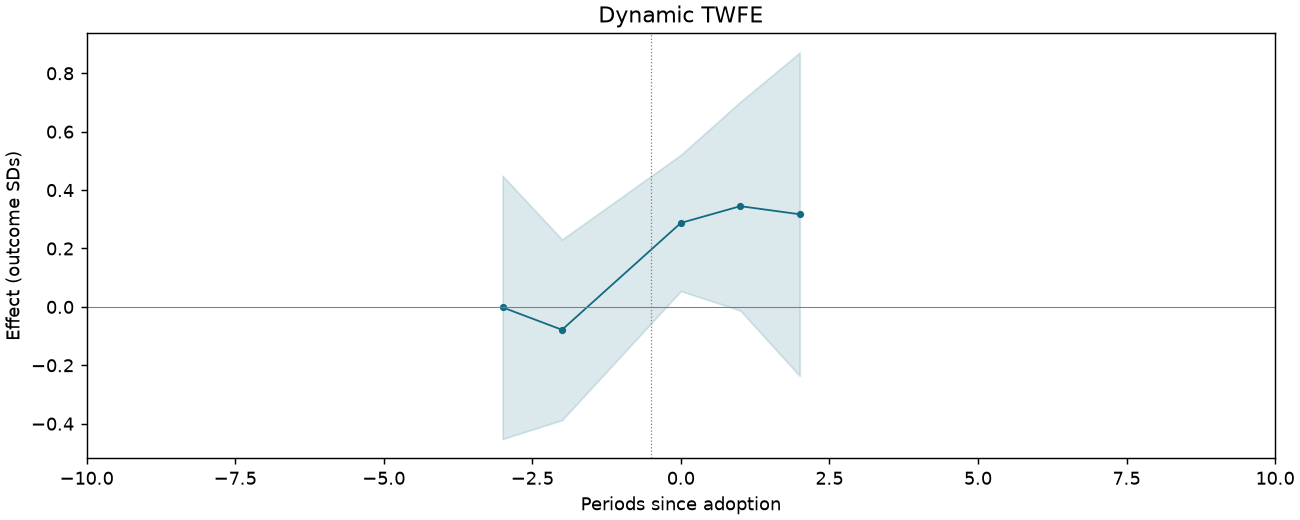
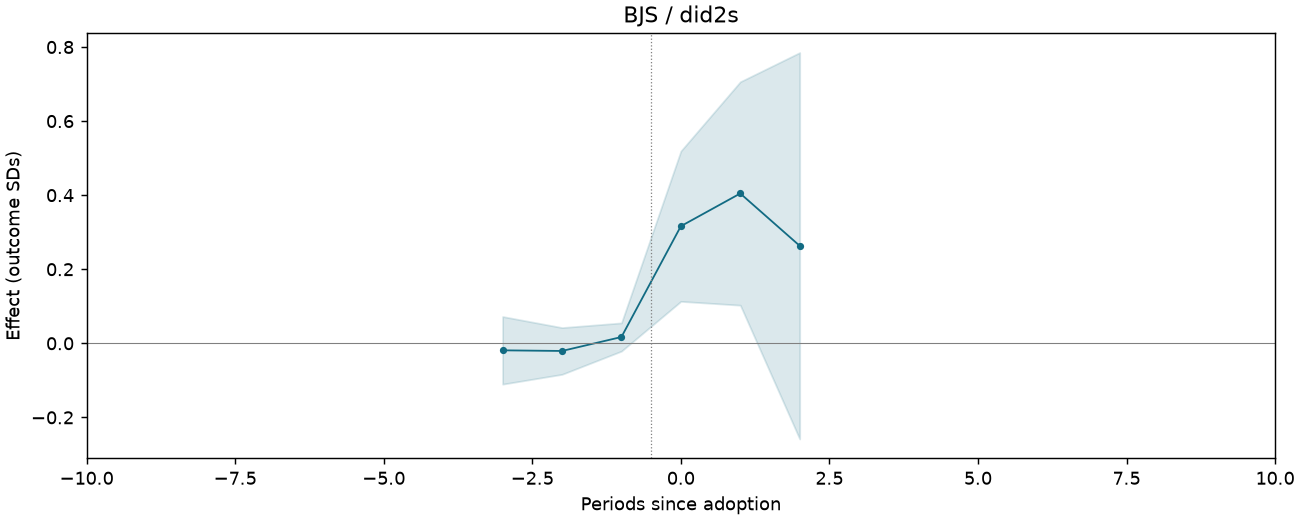
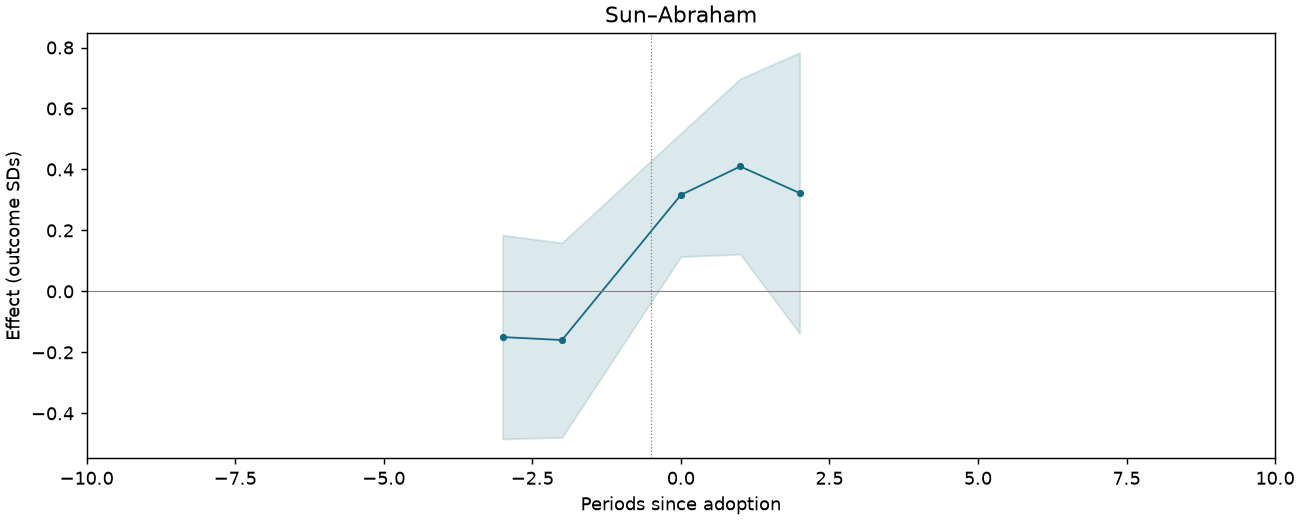
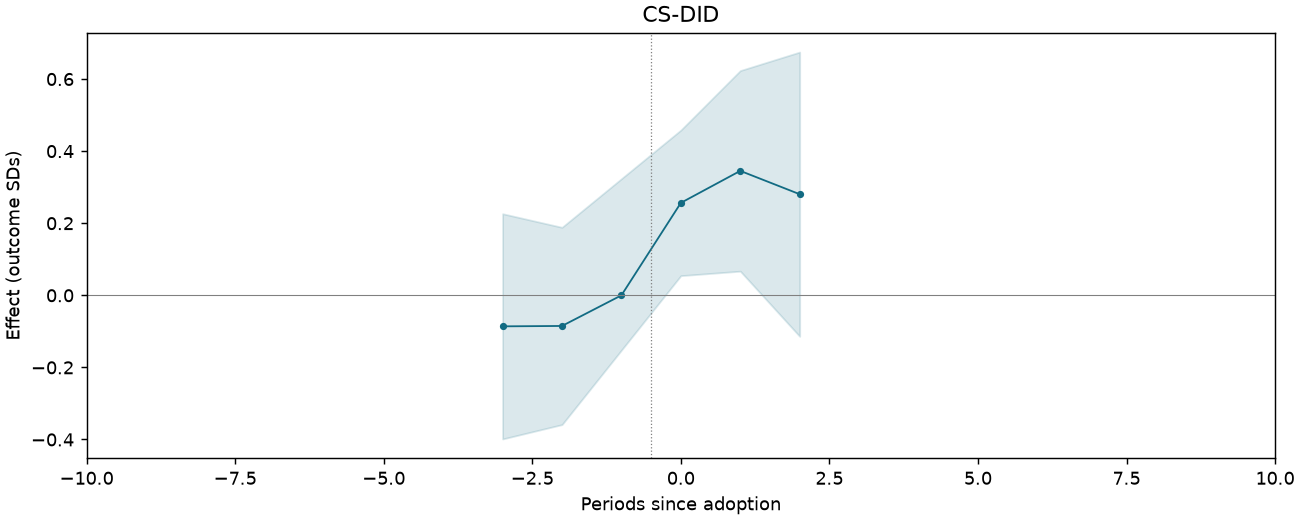
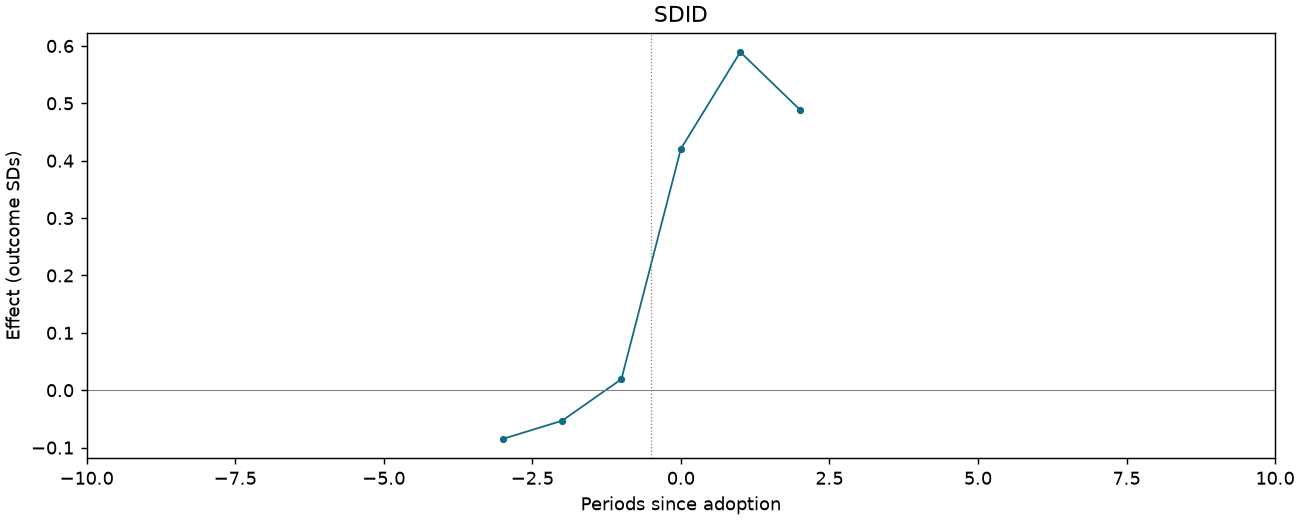
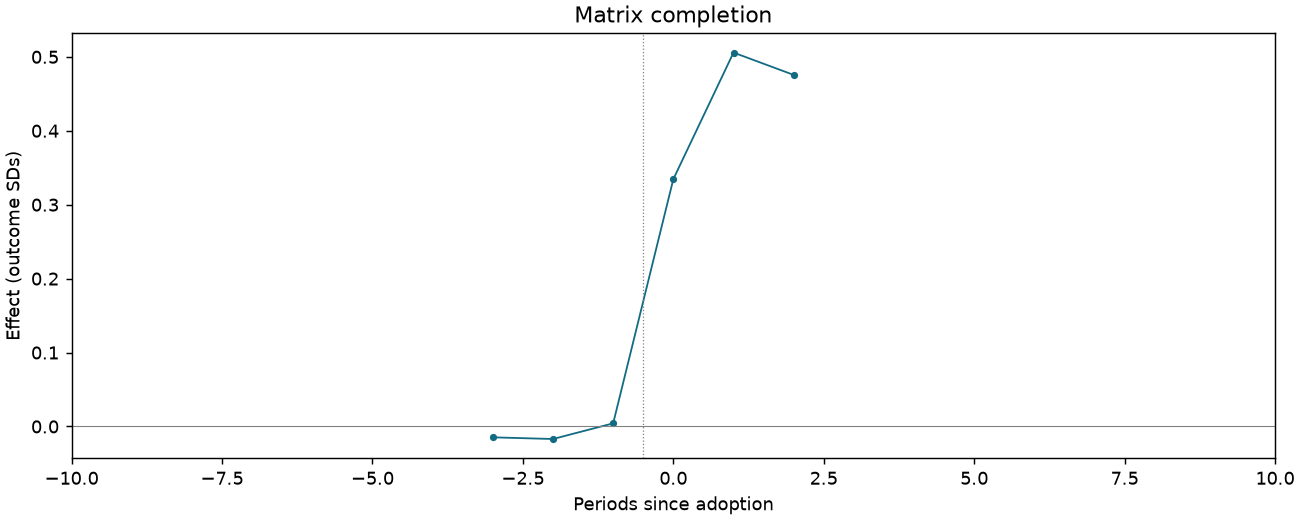
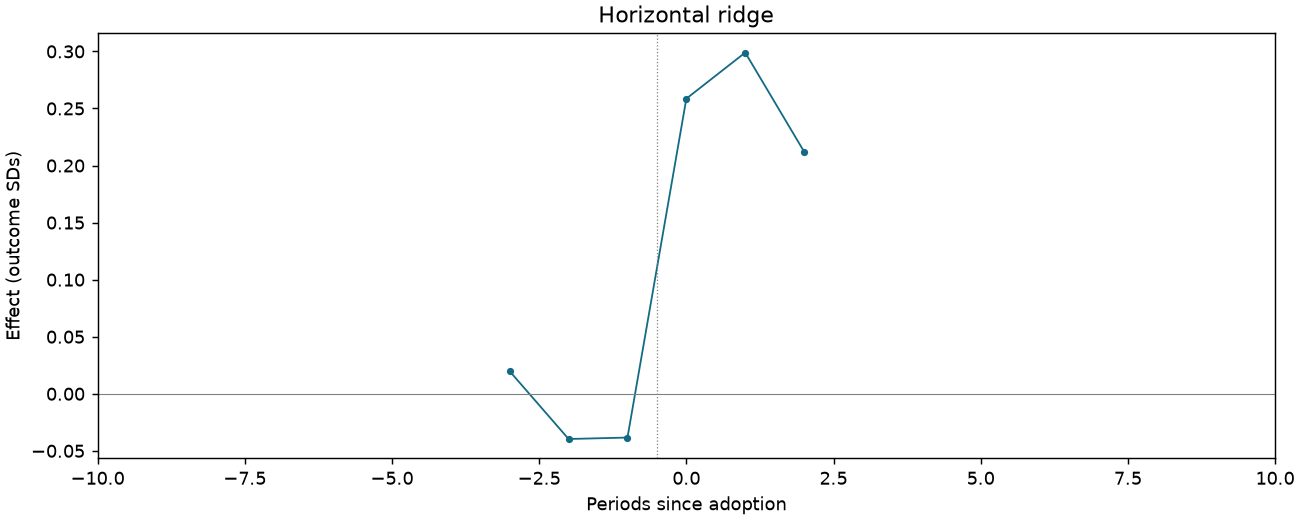
Trust: police [Table 3 original scale]
1,107 observations · 19 units · 19 clusters · 13 treated / 6 control units.
Estimate comparison
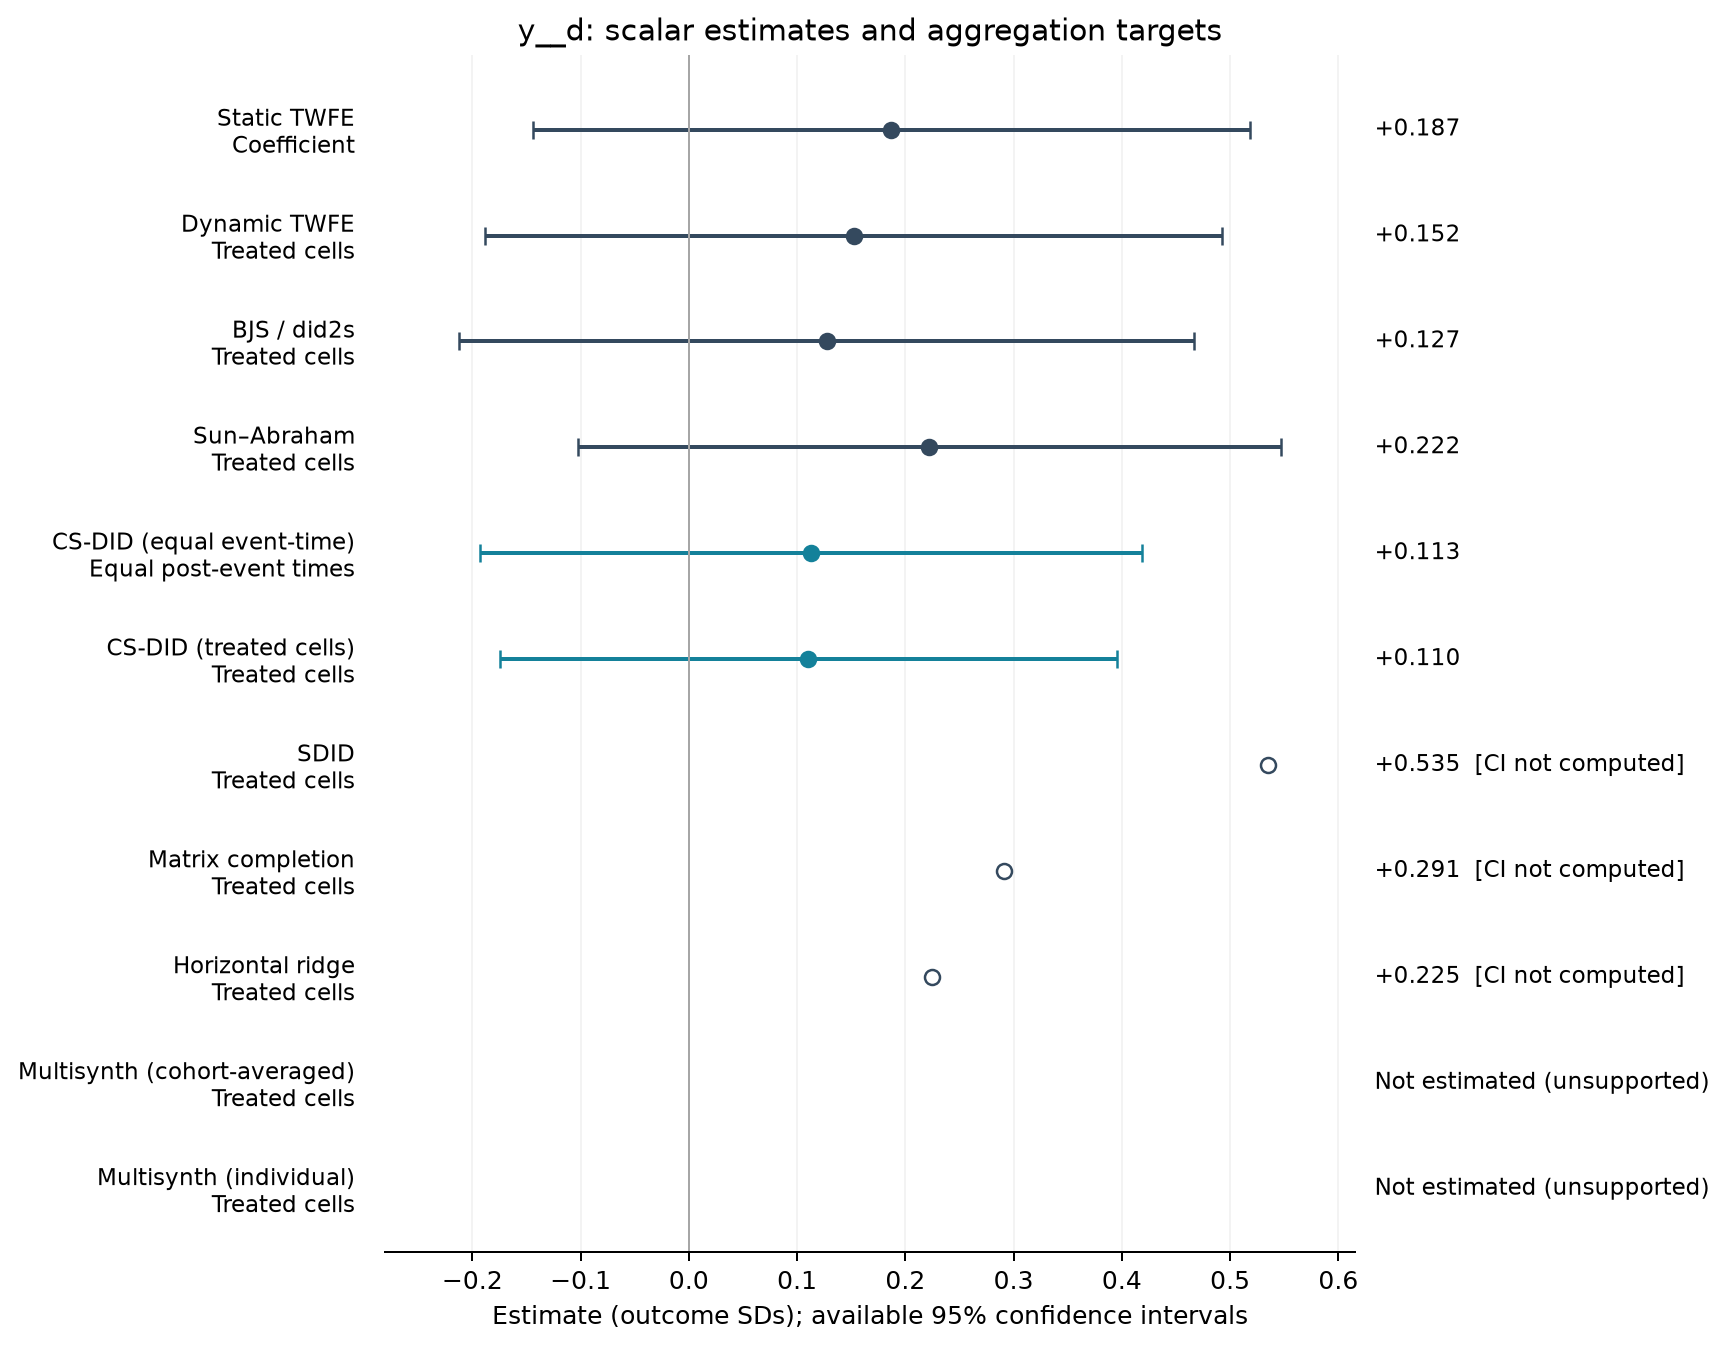
| Estimator | Estimate (SDs) | SE | 95% CI | Averaging |
|---|---|---|---|---|
| Static TWFE | 0.187 | 0.158 | [-0.144, 0.518] | Coefficient |
| Dynamic TWFE | 0.152 | 0.162 | [-0.188, 0.493] | Treated cells |
| BJS / did2s | 0.127 | 0.162 | [-0.212, 0.467] | Treated cells |
| Sun–Abraham | 0.222 | 0.155 | [-0.103, 0.547] | Treated cells |
| CS-DID (equal event-time) | 0.113 | 0.156 | [-0.193, 0.419] | Equal post-event times |
| CS-DID (treated cells) | 0.110 | 0.145 | [-0.174, 0.395] | Treated cells |
| SDID | 0.535 | — | — | Treated cells |
| Matrix completion | 0.291 | — | — | Treated cells |
| Horizontal ridge | 0.225 | — | — | Treated cells |
Event studies
Periods −10 to +10; pointwise 95% intervals where available.
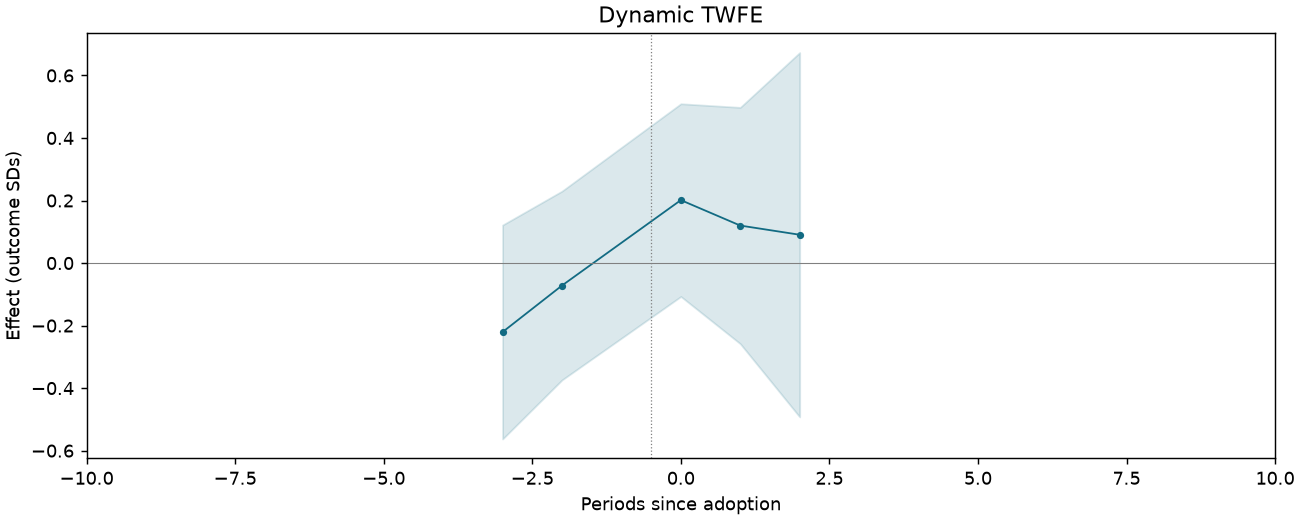
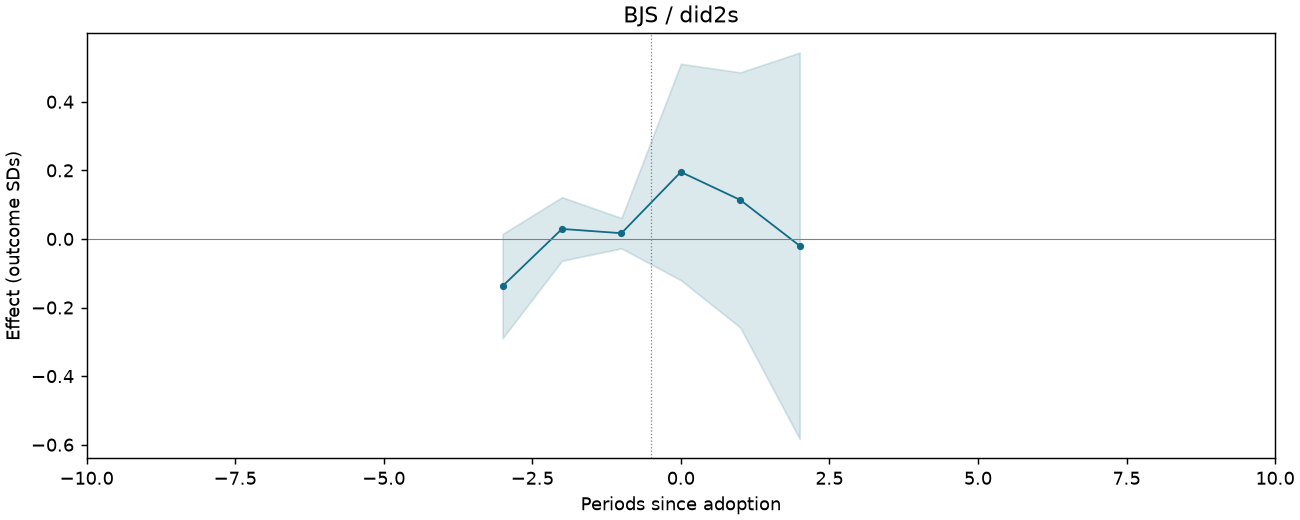
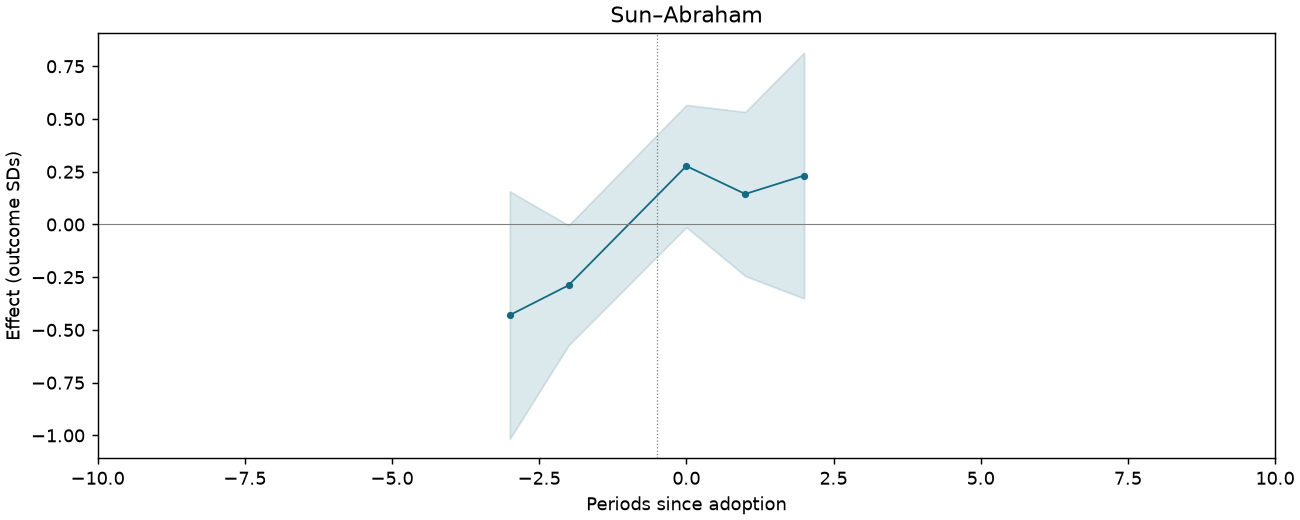
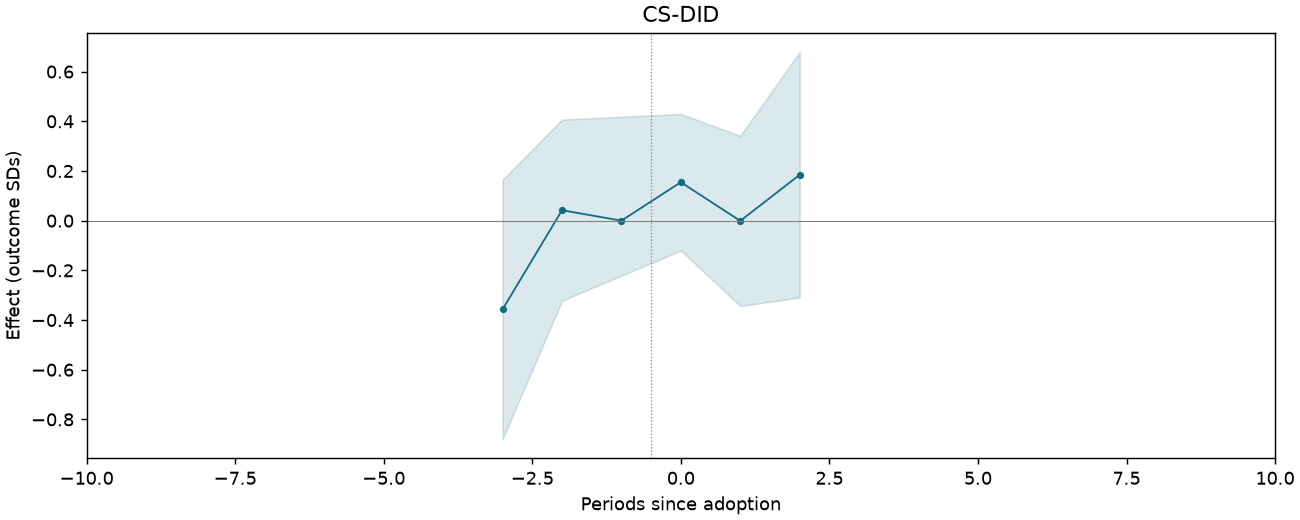
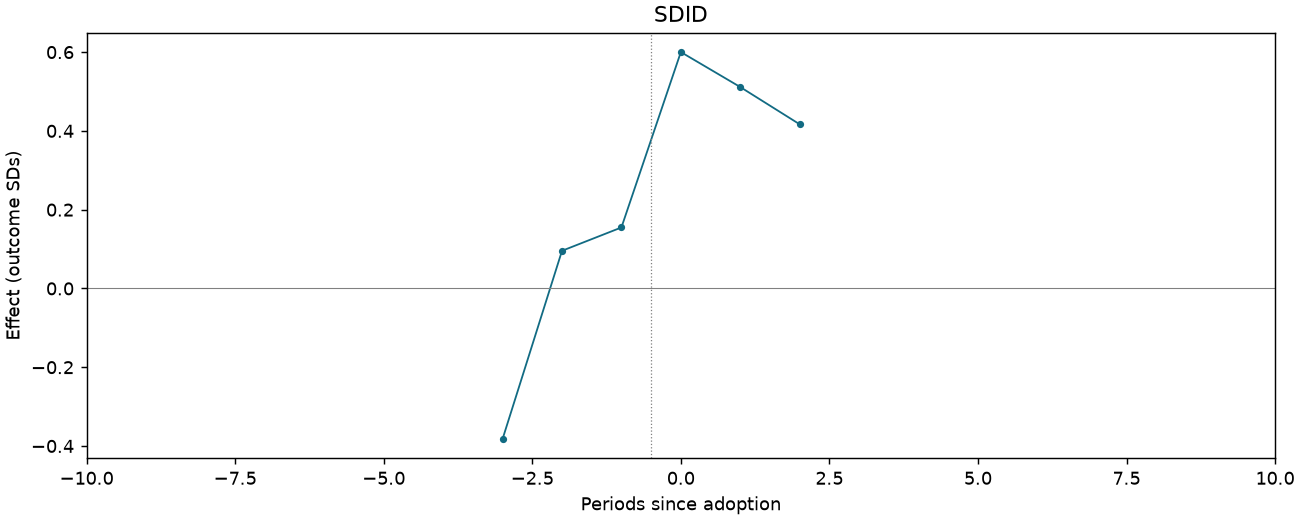
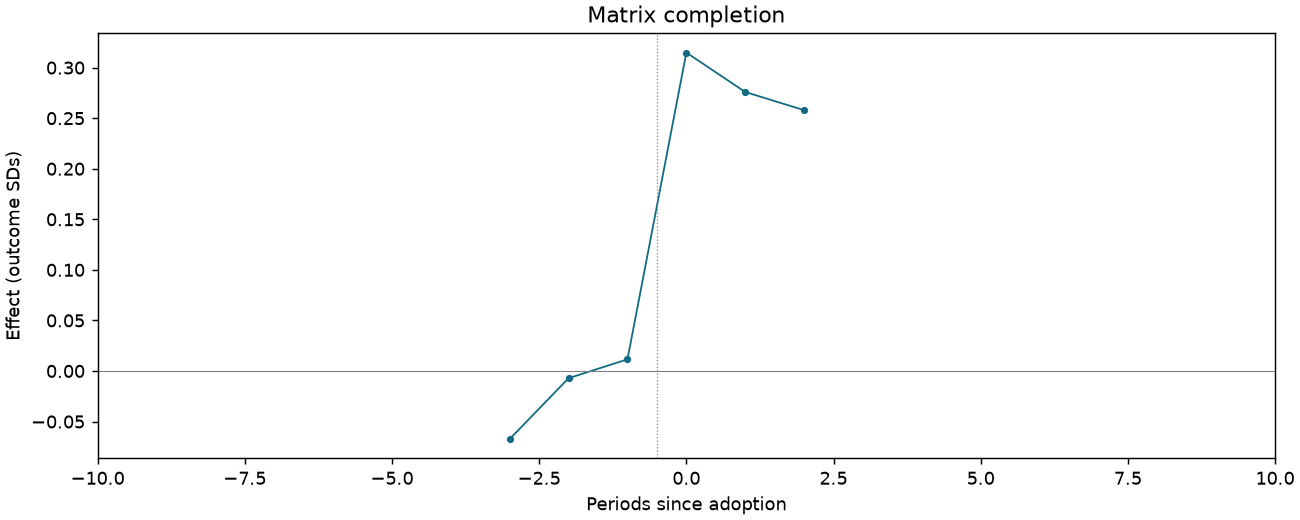
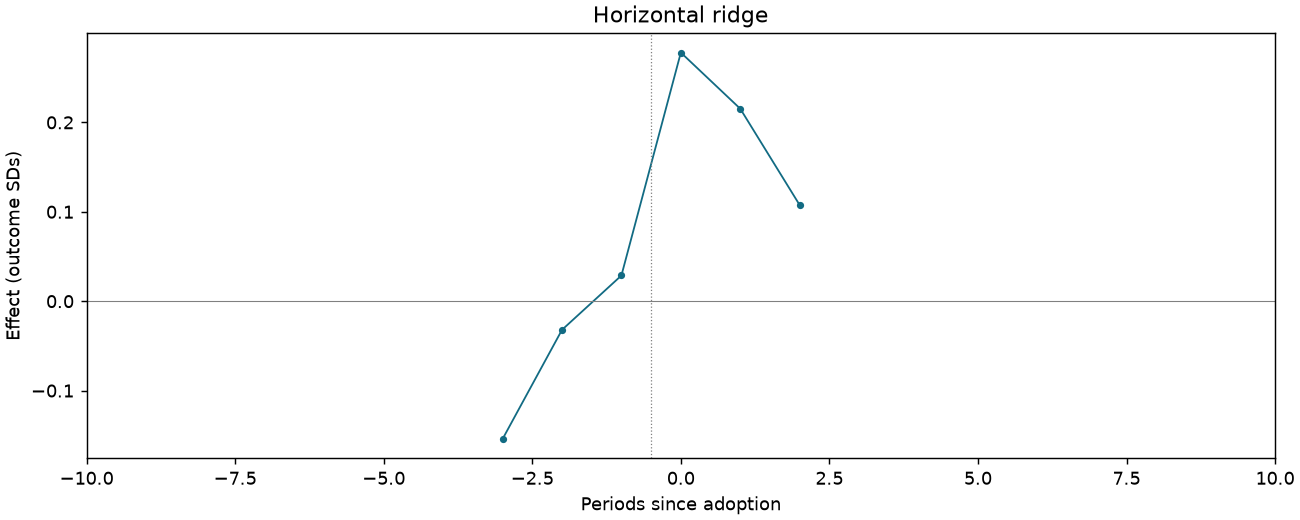
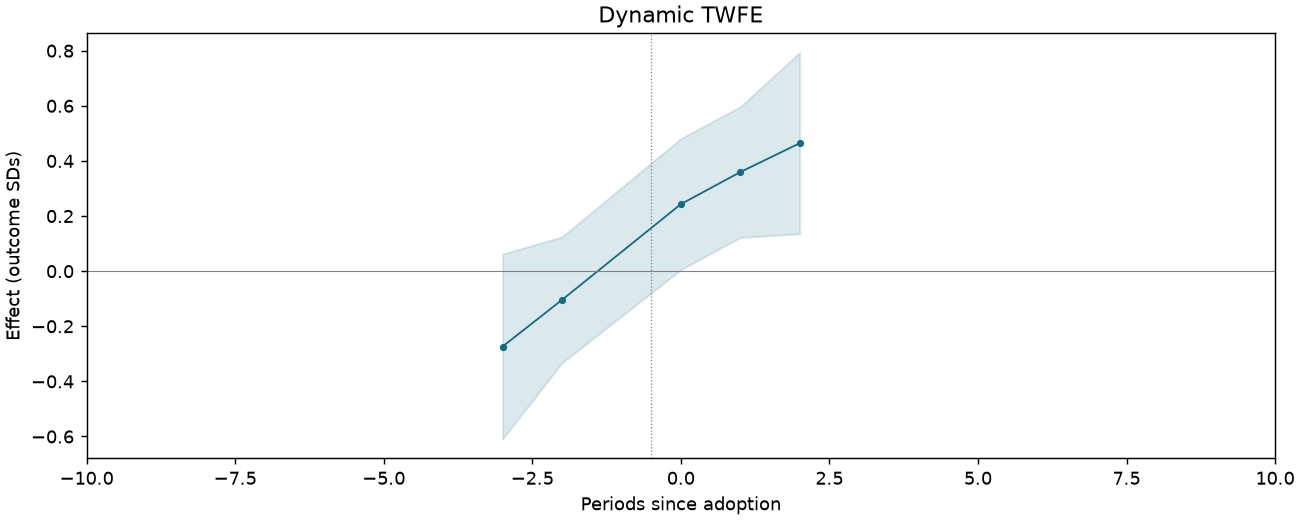
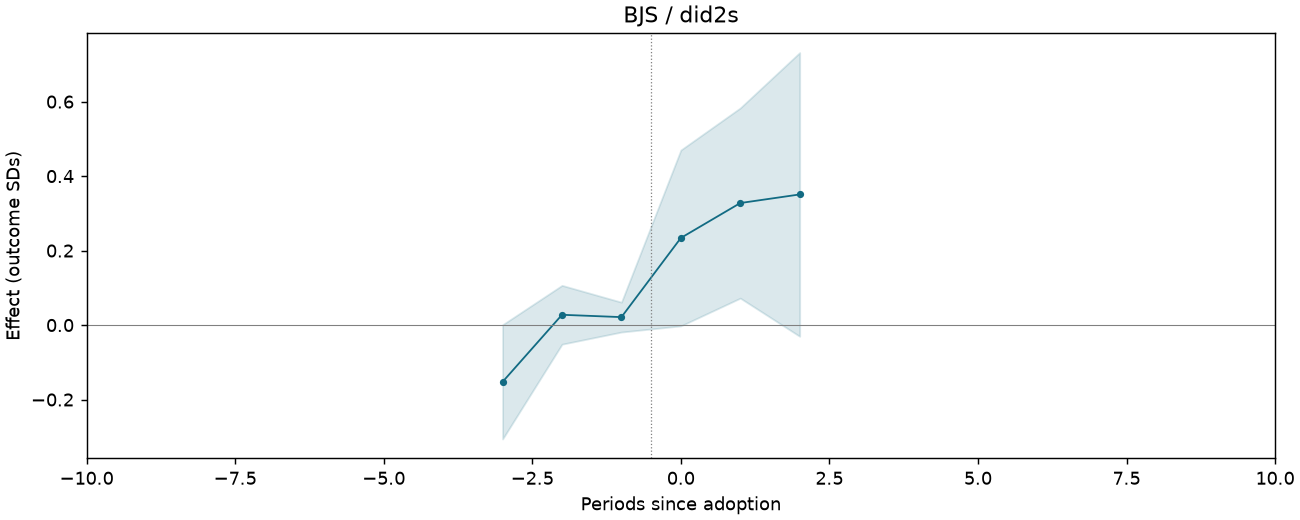
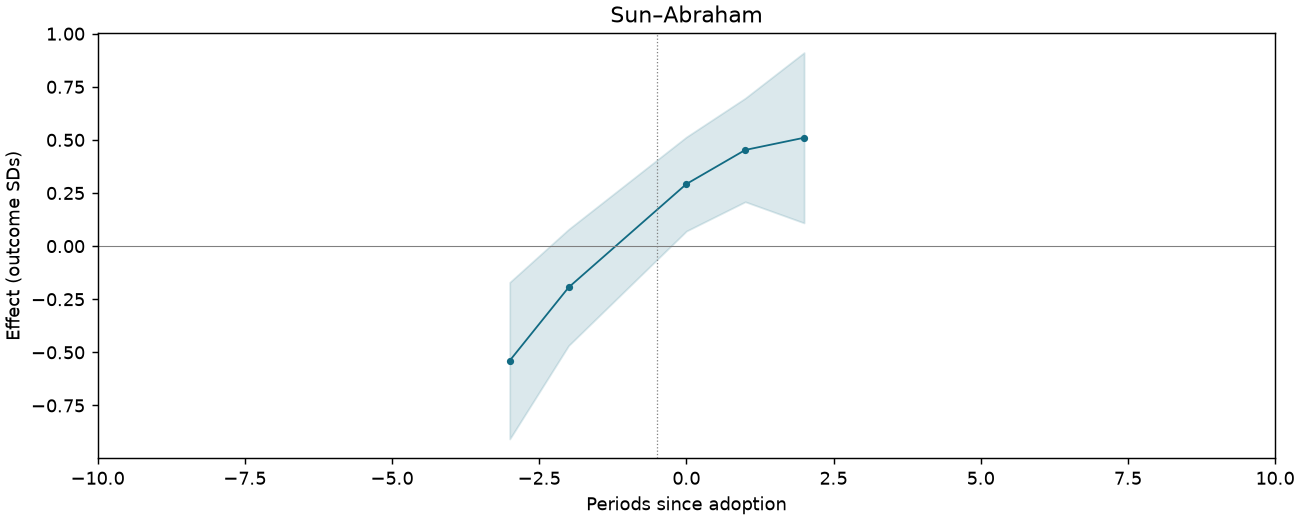
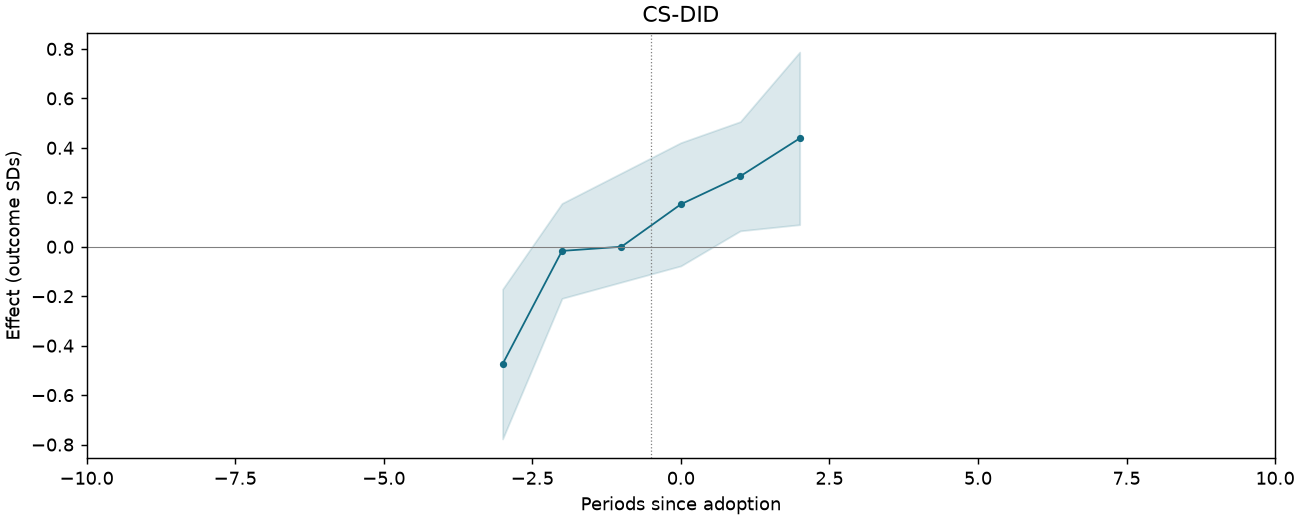
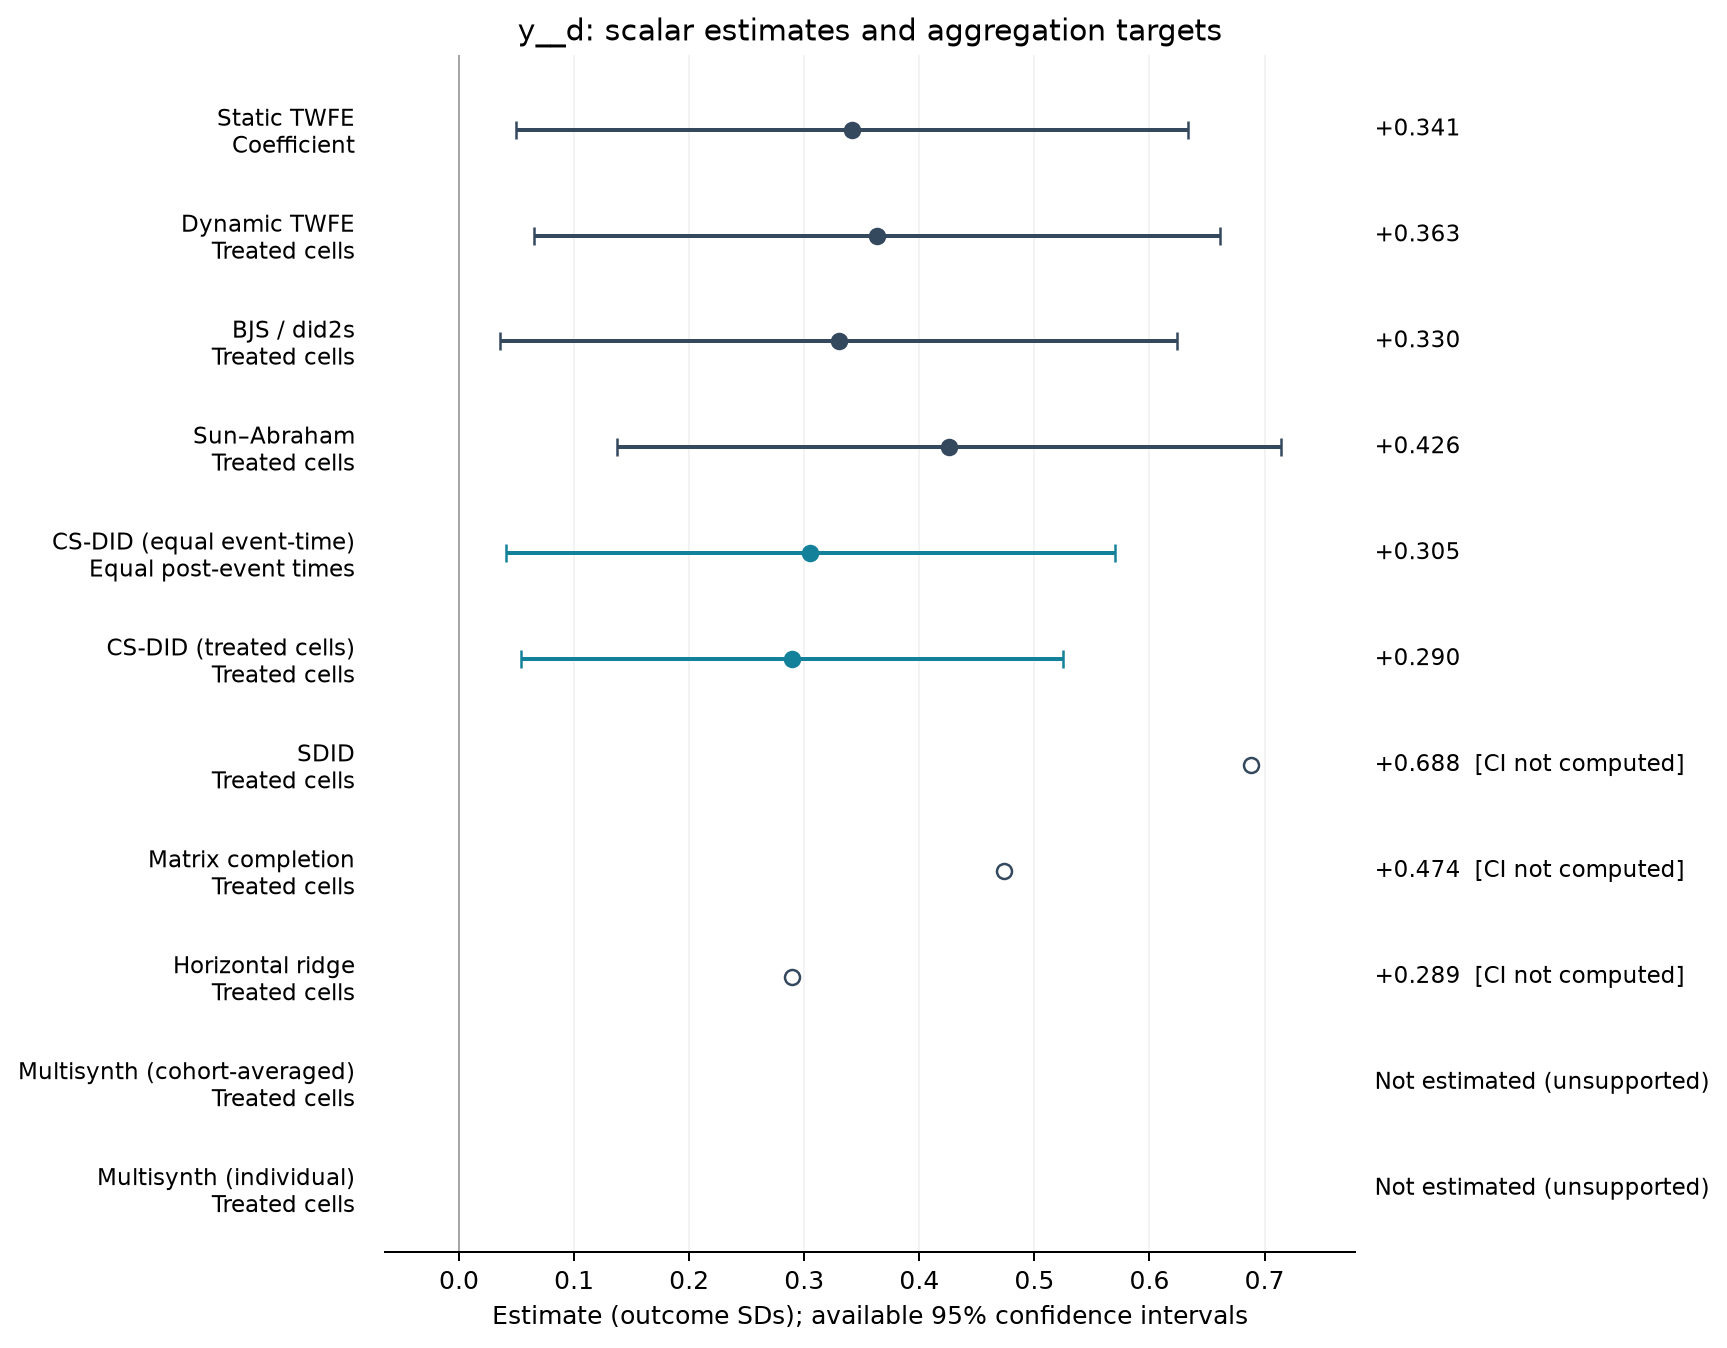
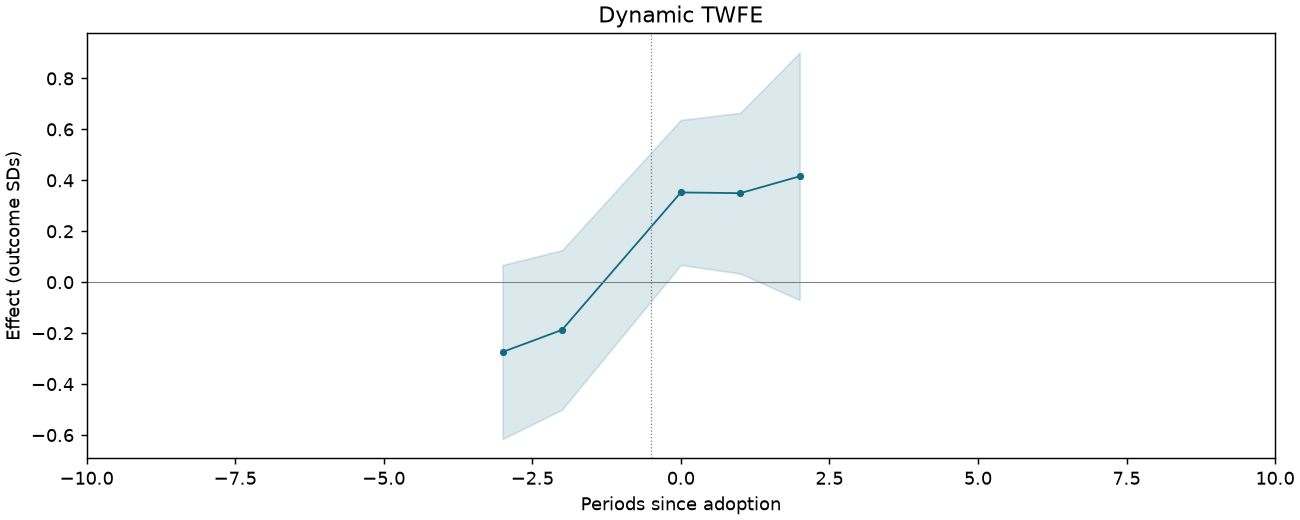
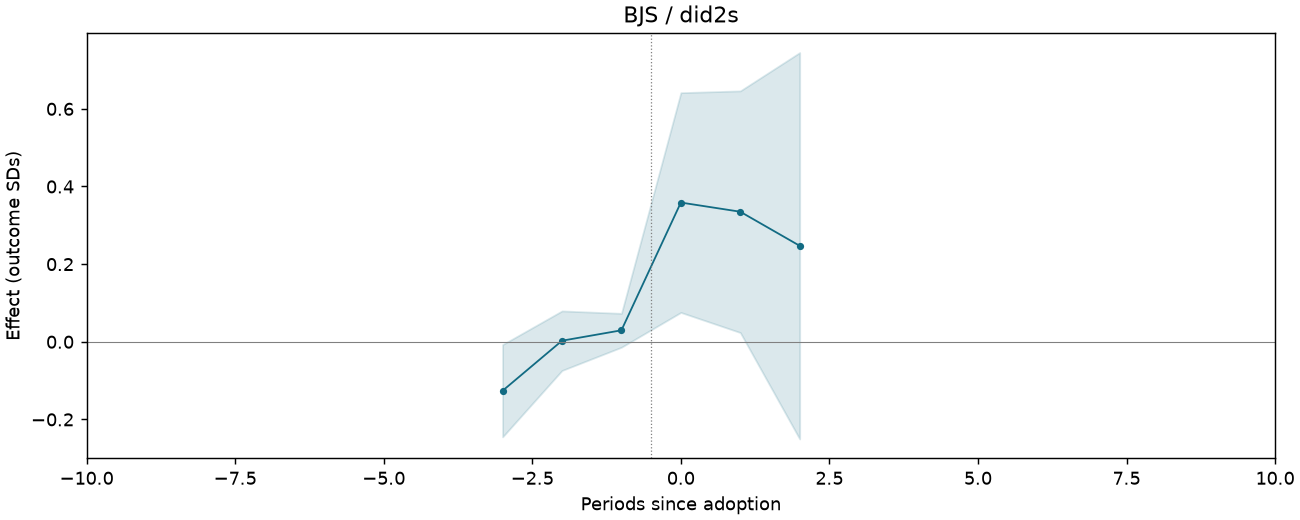
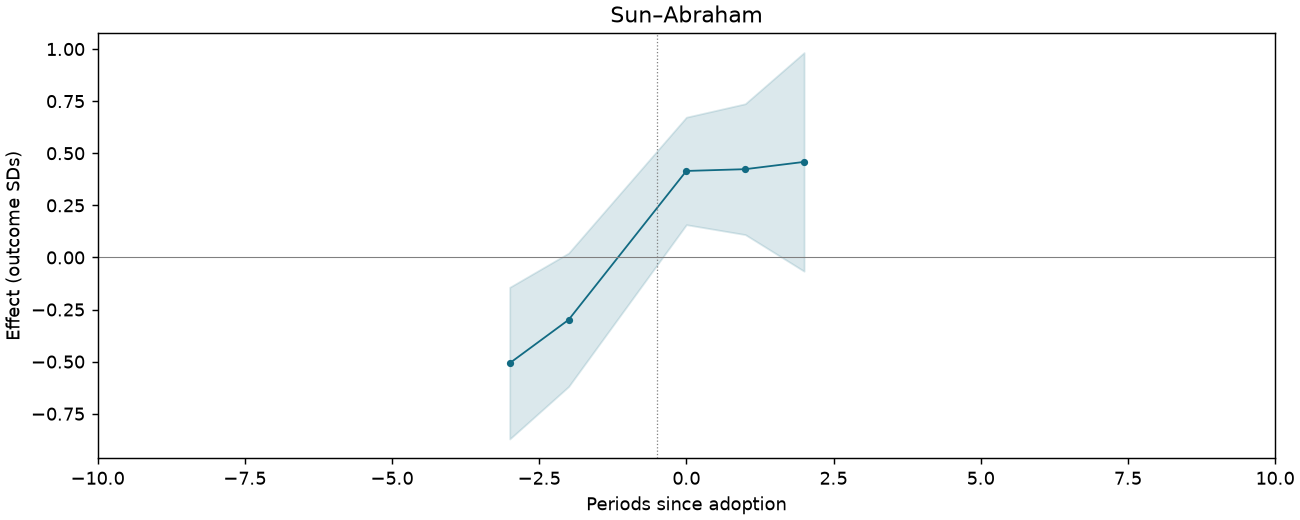
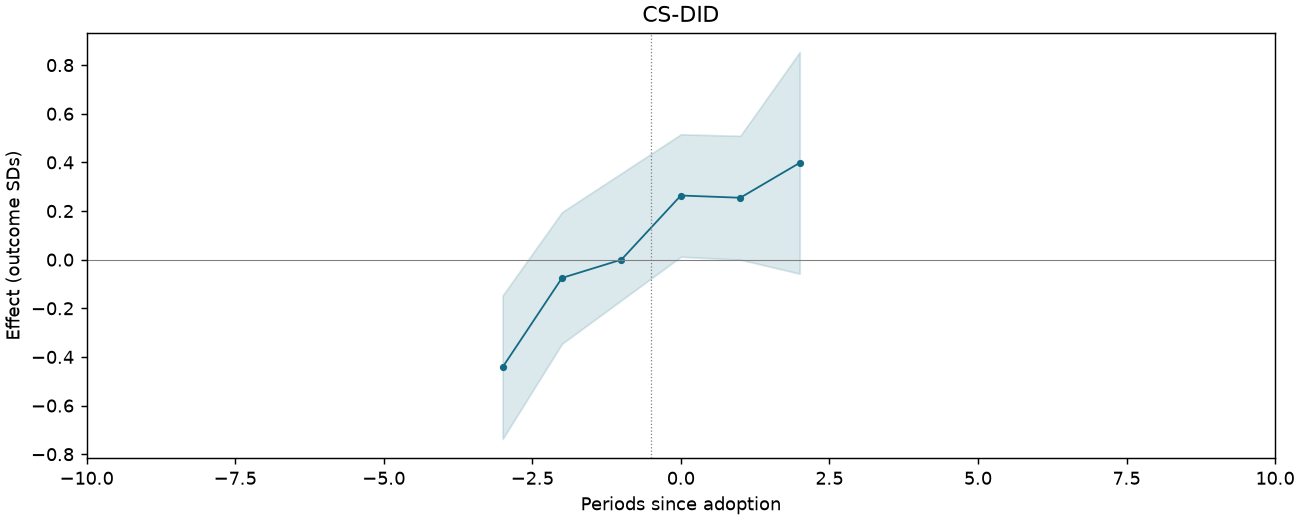
Trust in government officials z-score index [Table 3 original scale]
1,106 observations · 19 units · 19 clusters · 13 treated / 6 control units.
Estimate comparison
| Estimator | Estimate (SDs) | SE | 95% CI | Averaging |
|---|---|---|---|---|
| Static TWFE | 0.341 | 0.139 | [0.049, 0.634] | Coefficient |
| Dynamic TWFE | 0.363 | 0.142 | [0.065, 0.661] | Treated cells |
| BJS / did2s | 0.330 | 0.140 | [0.036, 0.624] | Treated cells |
| Sun–Abraham | 0.426 | 0.137 | [0.137, 0.714] | Treated cells |
| CS-DID (equal event-time) | 0.305 | 0.135 | [0.041, 0.570] | Equal post-event times |
| CS-DID (treated cells) | 0.290 | 0.120 | [0.054, 0.525] | Treated cells |
| SDID | 0.688 | — | — | Treated cells |
| Matrix completion | 0.474 | — | — | Treated cells |
| Horizontal ridge | 0.289 | — | — | Treated cells |
Event studies
Periods −10 to +10; pointwise 95% intervals where available.
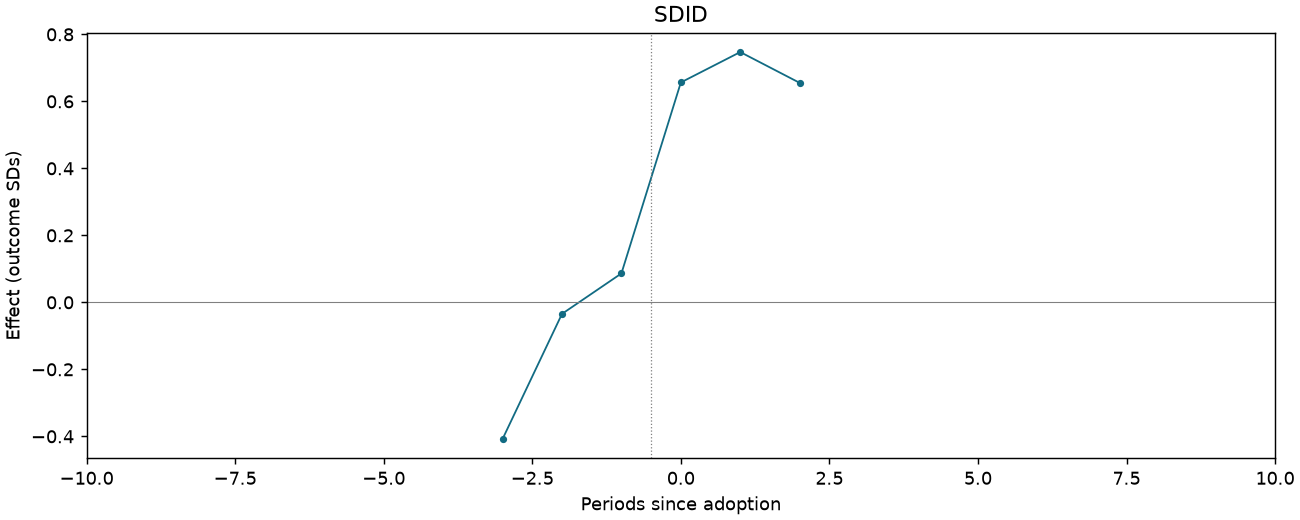
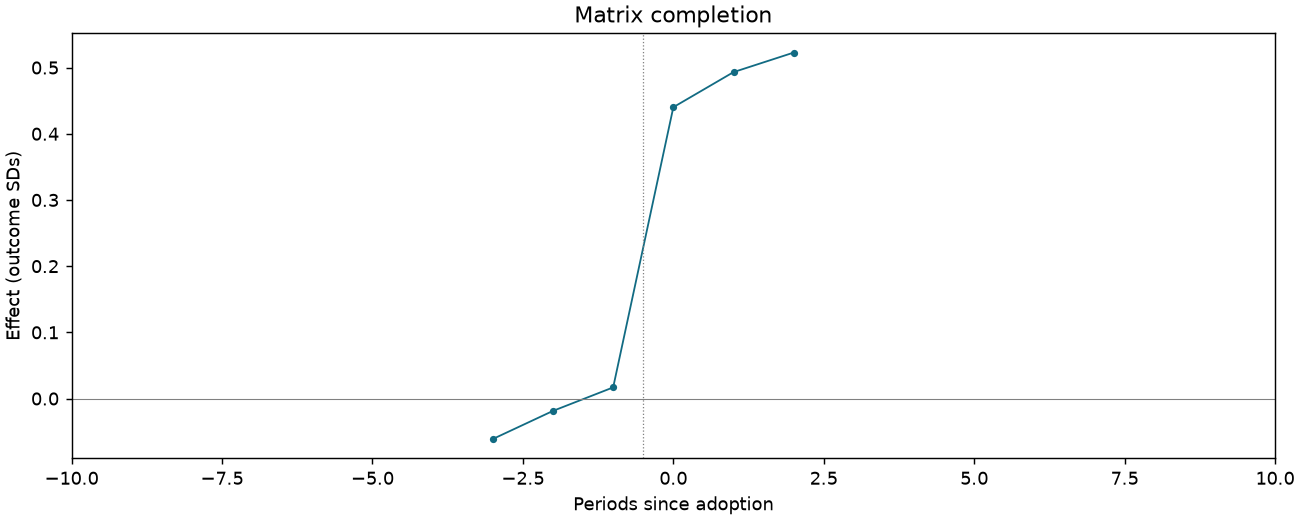
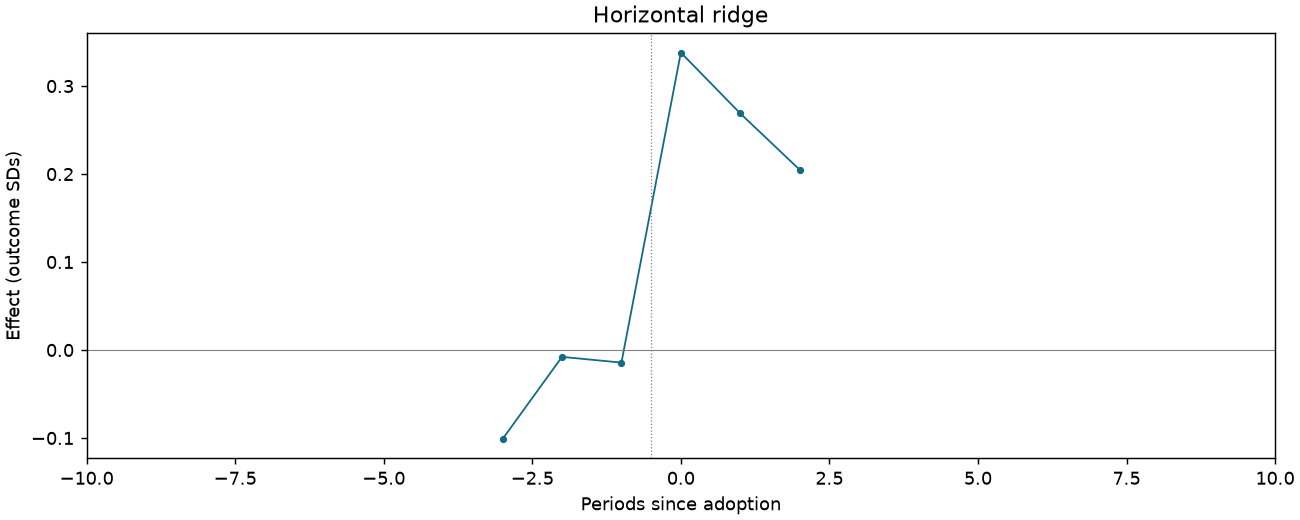
Trust in non-governmental institutions z-score index (falsification) [Table 3 original scale]
1,107 observations · 19 units · 19 clusters · 13 treated / 6 control units.
Estimate comparison
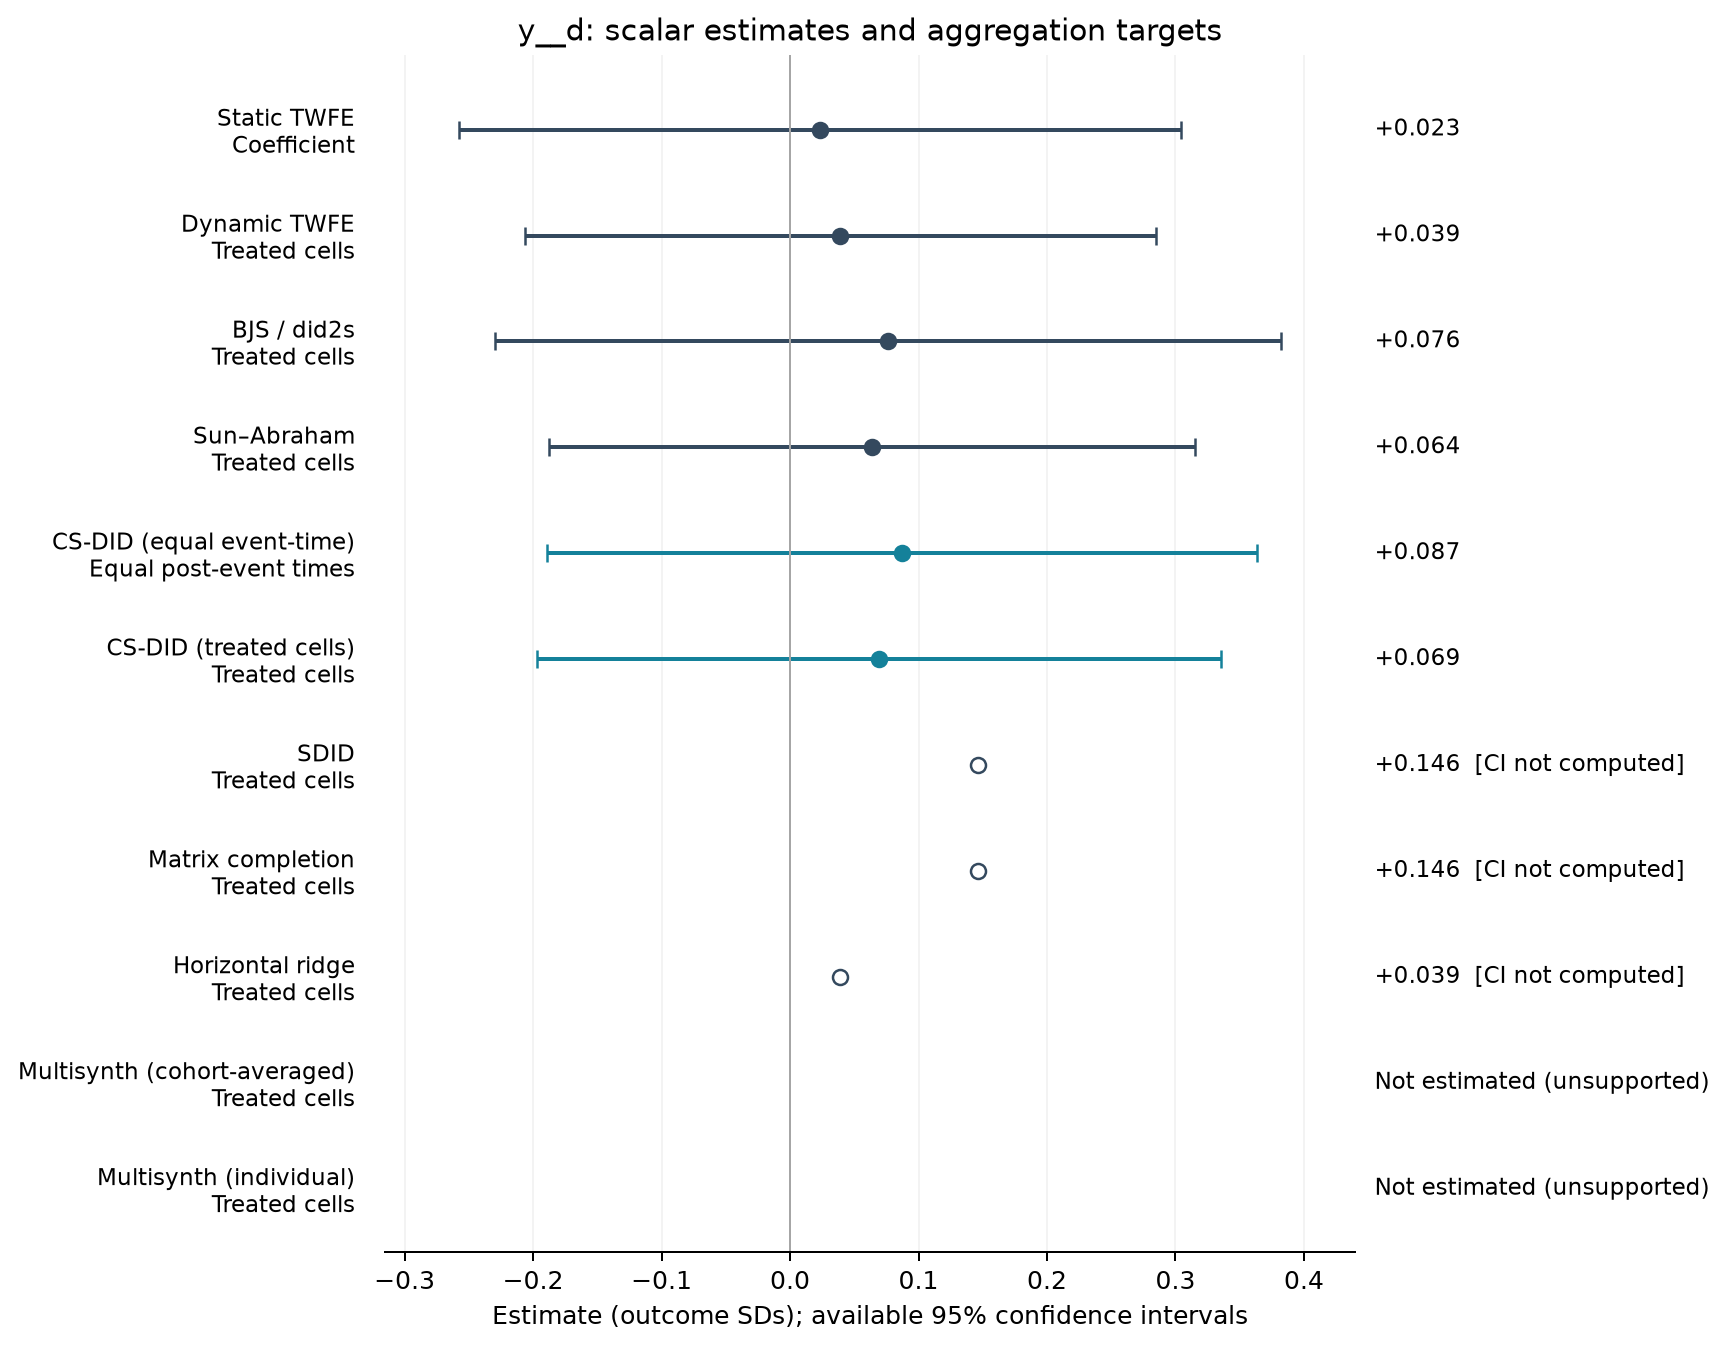
| Estimator | Estimate (SDs) | SE | 95% CI | Averaging |
|---|---|---|---|---|
| Static TWFE | 0.023 | 0.134 | [-0.258, 0.304] | Coefficient |
| Dynamic TWFE | 0.039 | 0.117 | [-0.206, 0.285] | Treated cells |
| BJS / did2s | 0.076 | 0.146 | [-0.229, 0.382] | Treated cells |
| Sun–Abraham | 0.064 | 0.120 | [-0.188, 0.315] | Treated cells |
| CS-DID (equal event-time) | 0.087 | 0.141 | [-0.189, 0.363] | Equal post-event times |
| CS-DID (treated cells) | 0.069 | 0.136 | [-0.197, 0.335] | Treated cells |
| SDID | 0.146 | — | — | Treated cells |
| Matrix completion | 0.146 | — | — | Treated cells |
| Horizontal ridge | 0.039 | — | — | Treated cells |
Event studies
Periods −10 to +10; pointwise 95% intervals where available.
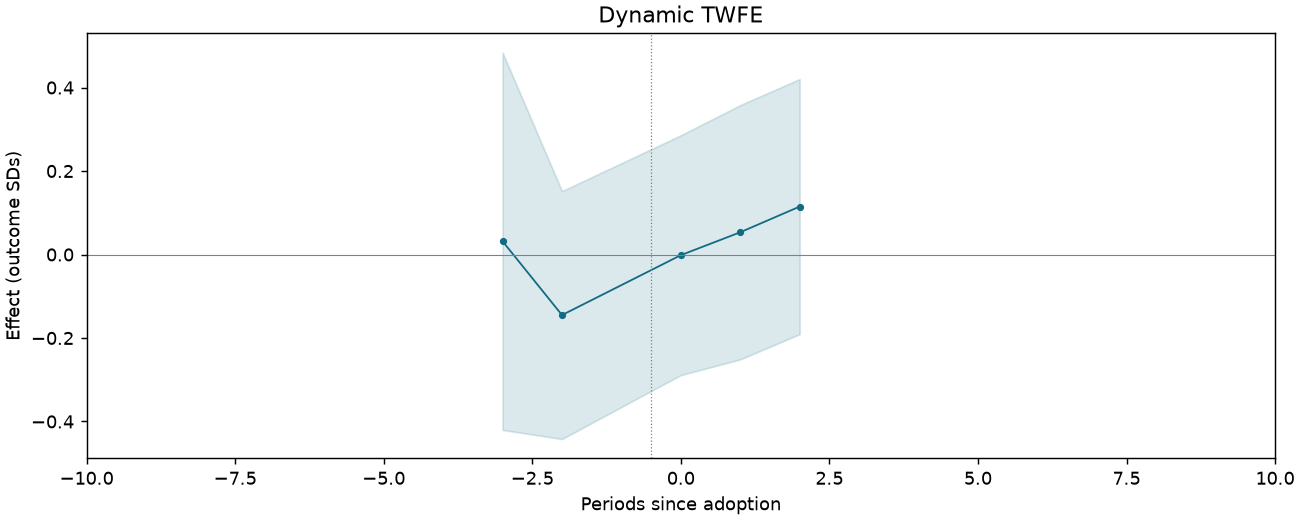
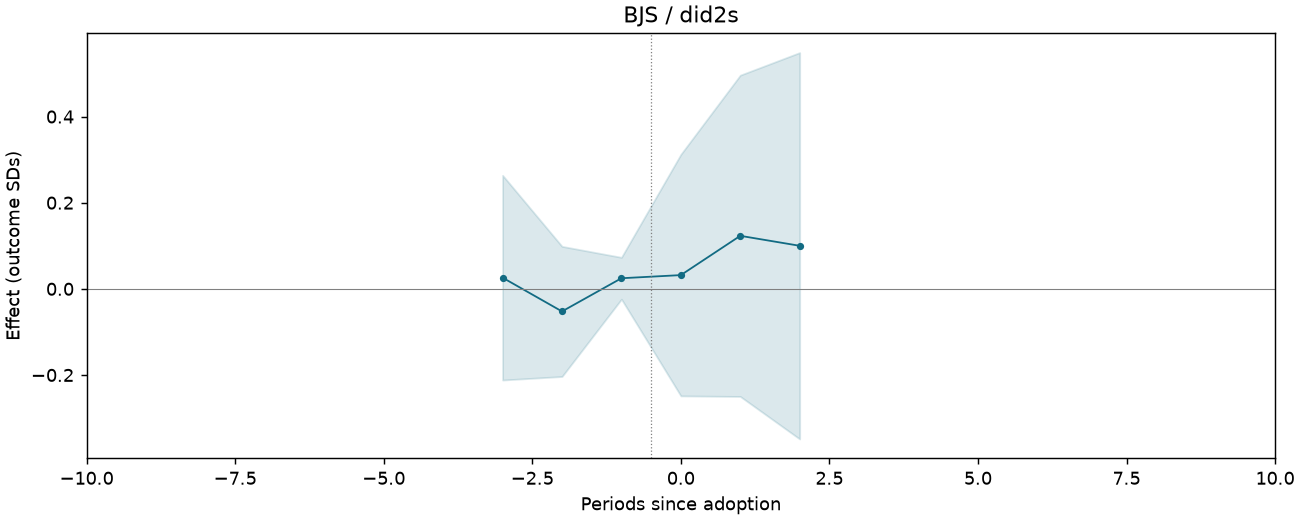
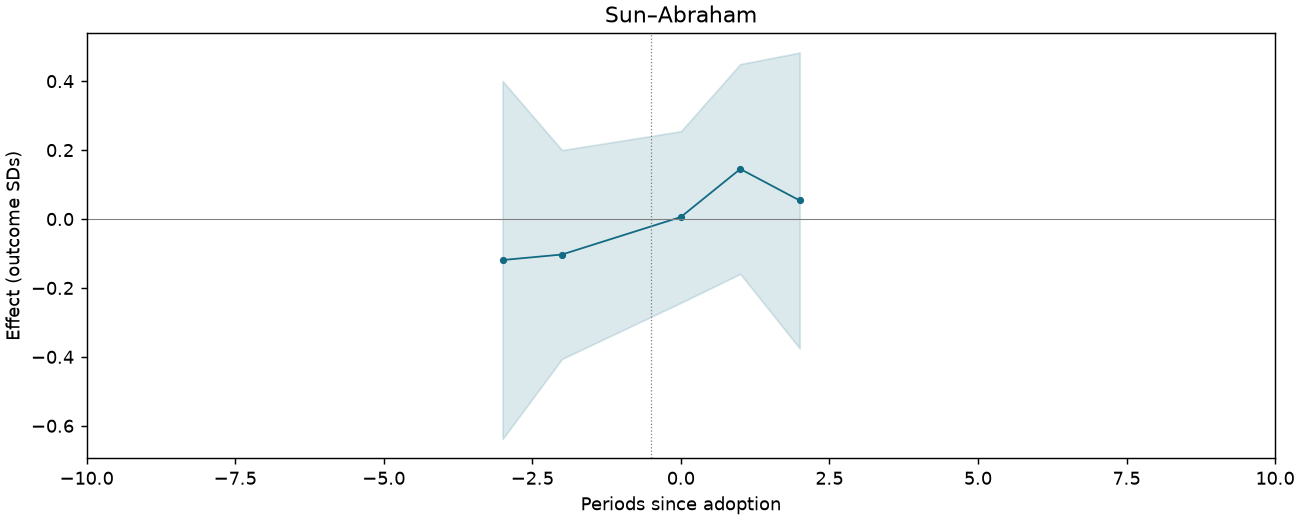
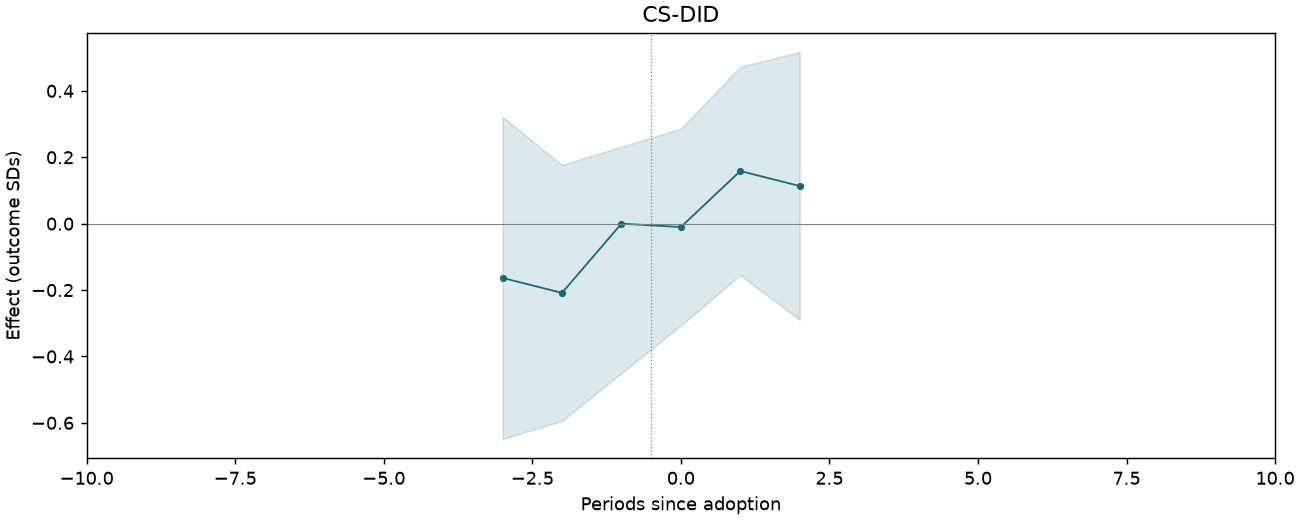
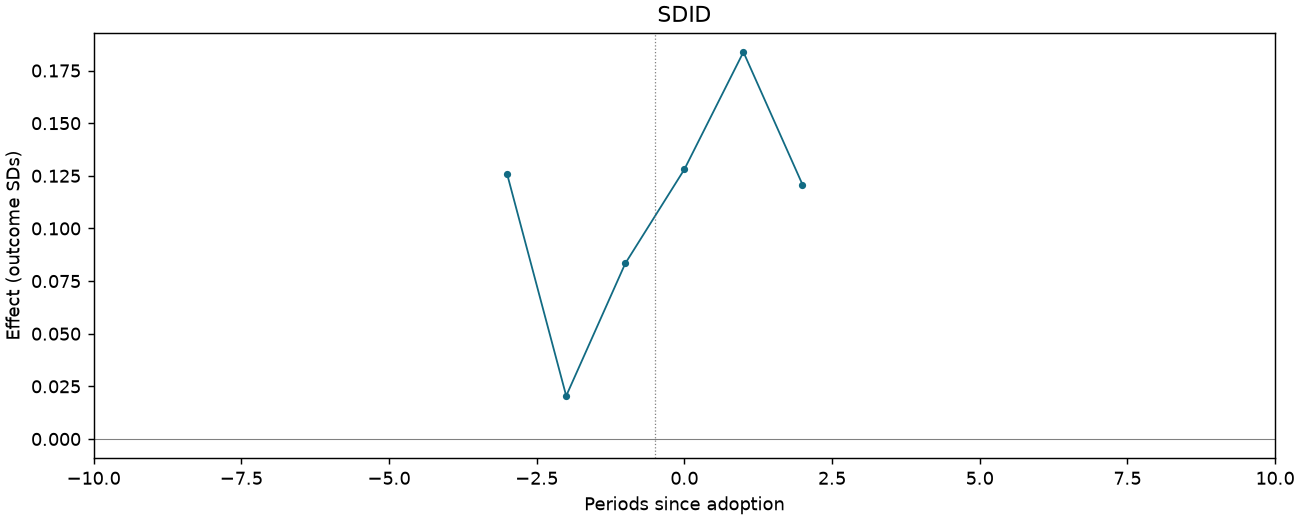
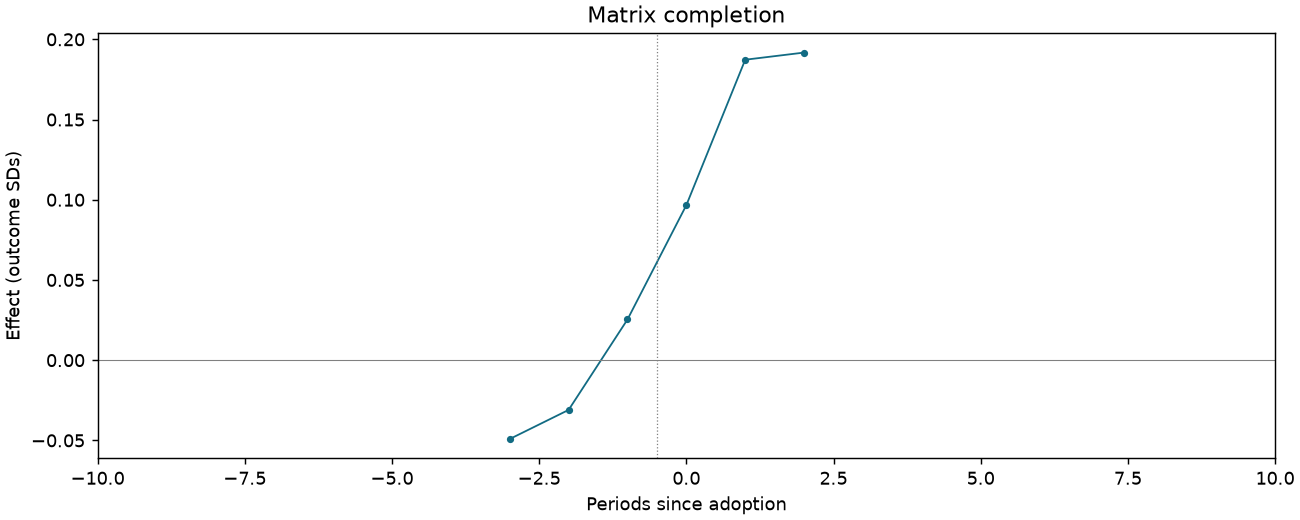
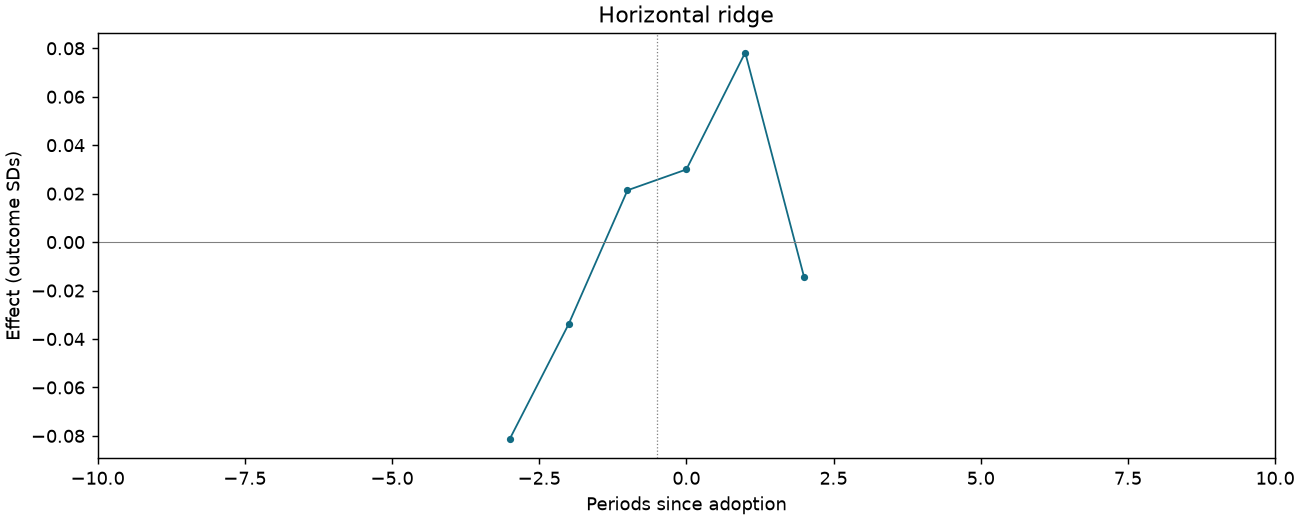
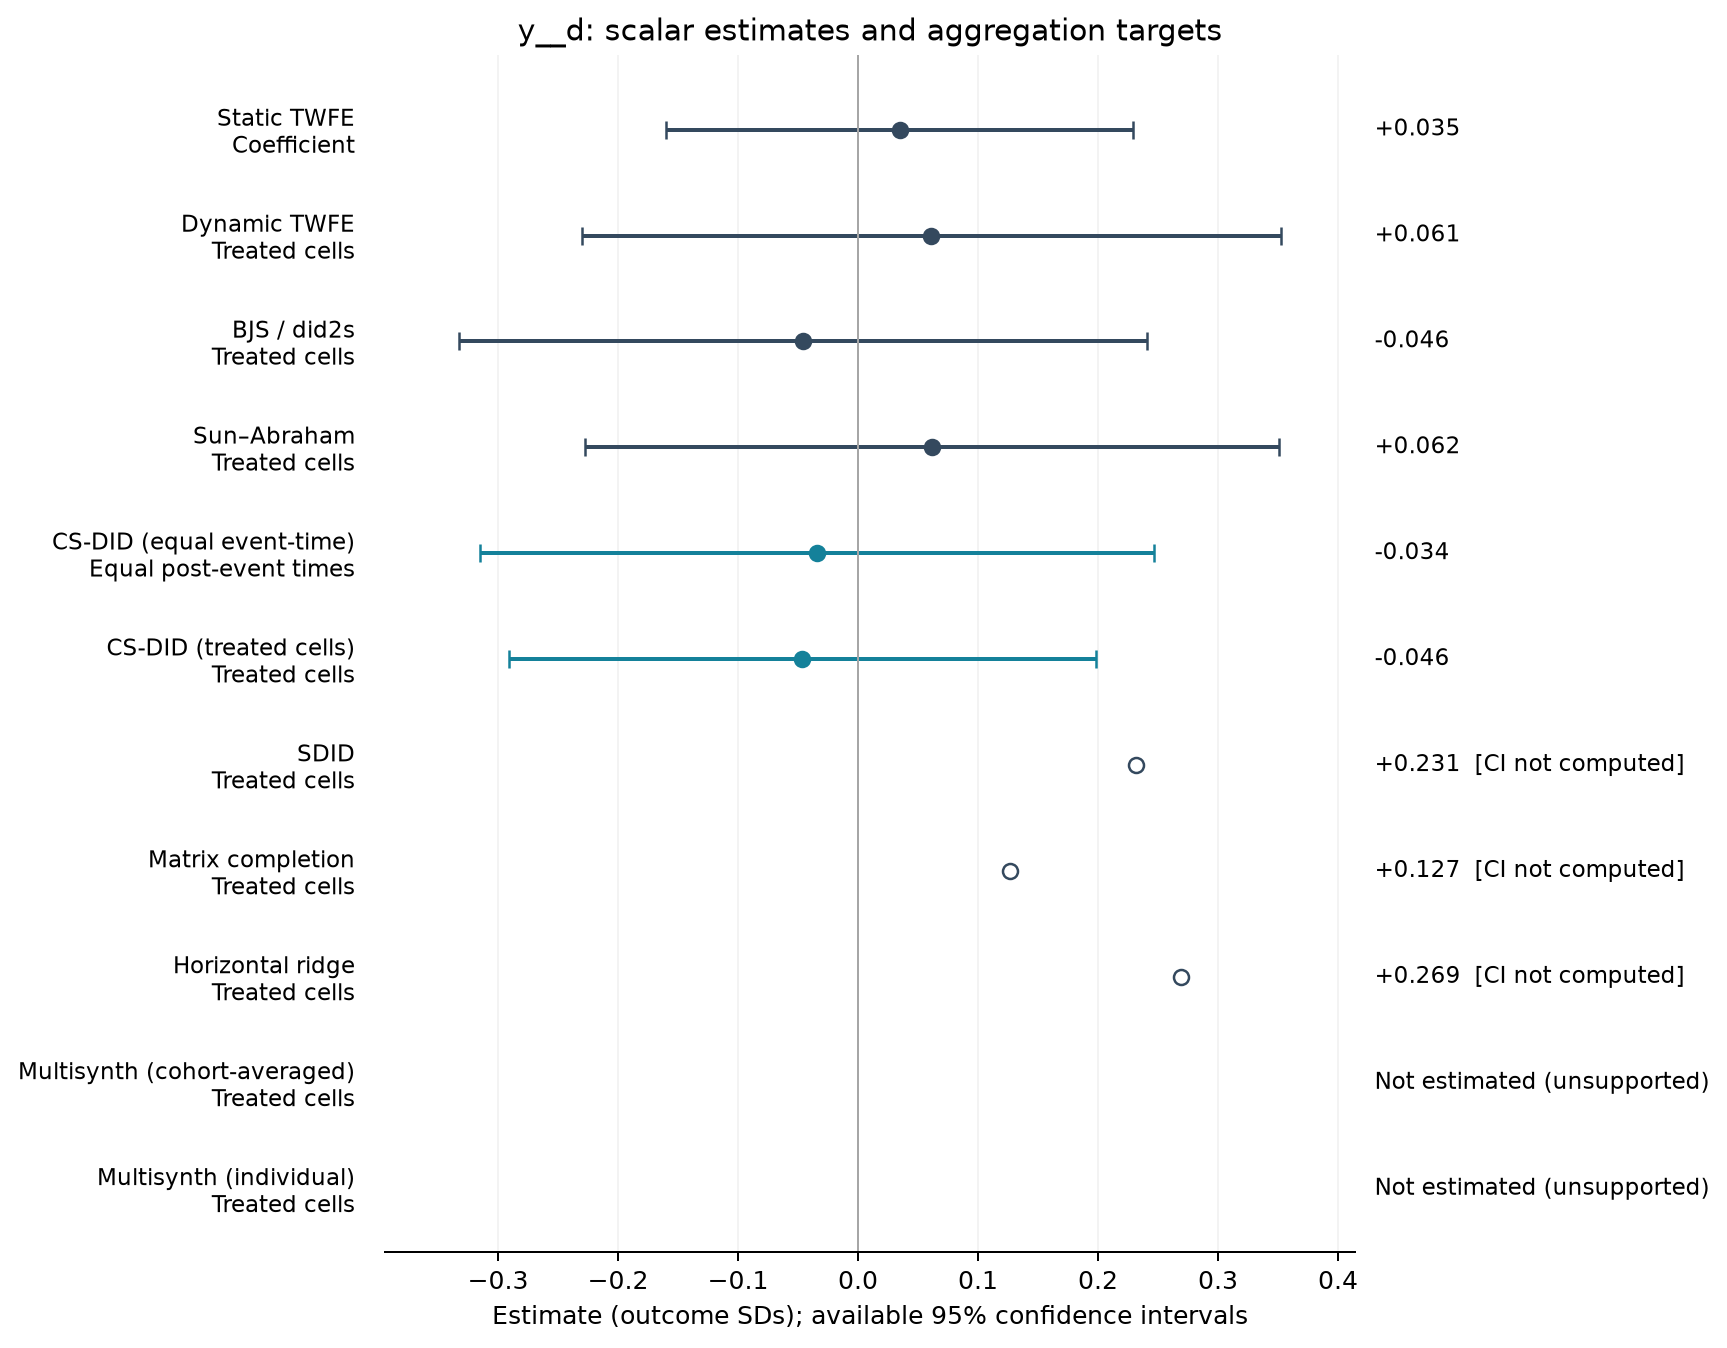
Village head is not self-interested [Table 3 original scale]
1,100 observations · 19 units · 19 clusters · 13 treated / 6 control units.
Estimate comparison
| Estimator | Estimate (SDs) | SE | 95% CI | Averaging |
|---|---|---|---|---|
| Static TWFE | 0.035 | 0.093 | [-0.160, 0.229] | Coefficient |
| Dynamic TWFE | 0.061 | 0.139 | [-0.230, 0.353] | Treated cells |
| BJS / did2s | -0.046 | 0.136 | [-0.333, 0.240] | Treated cells |
| Sun–Abraham | 0.062 | 0.138 | [-0.228, 0.351] | Treated cells |
| CS-DID (equal event-time) | -0.034 | 0.143 | [-0.315, 0.247] | Equal post-event times |
| CS-DID (treated cells) | -0.046 | 0.125 | [-0.291, 0.198] | Treated cells |
| SDID | 0.231 | — | — | Treated cells |
| Matrix completion | 0.127 | — | — | Treated cells |
| Horizontal ridge | 0.269 | — | — | Treated cells |
Event studies
Periods −10 to +10; pointwise 95% intervals where available.
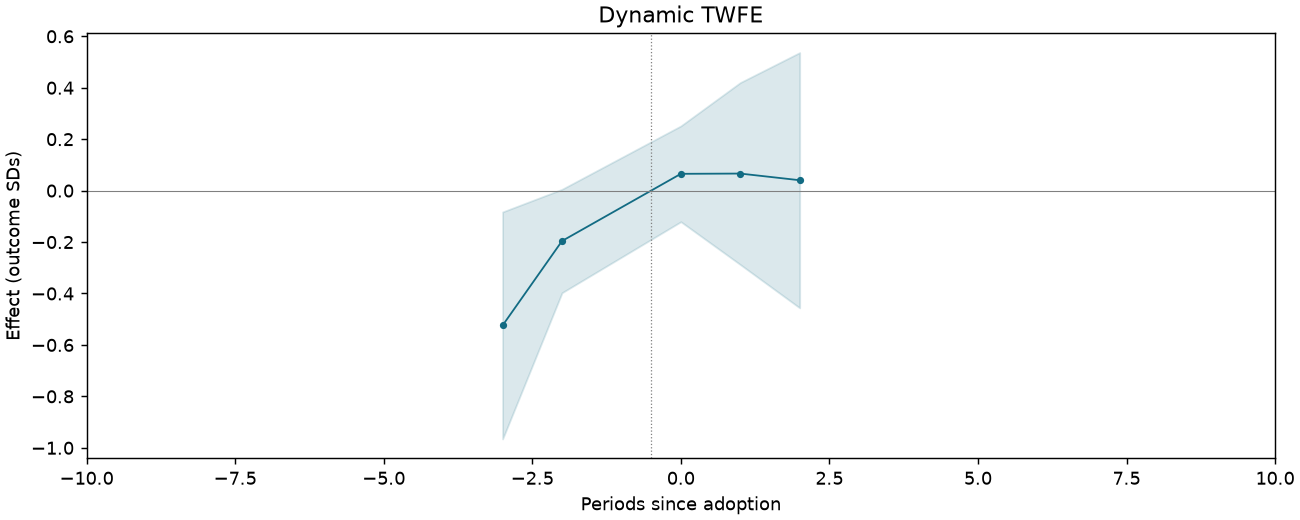
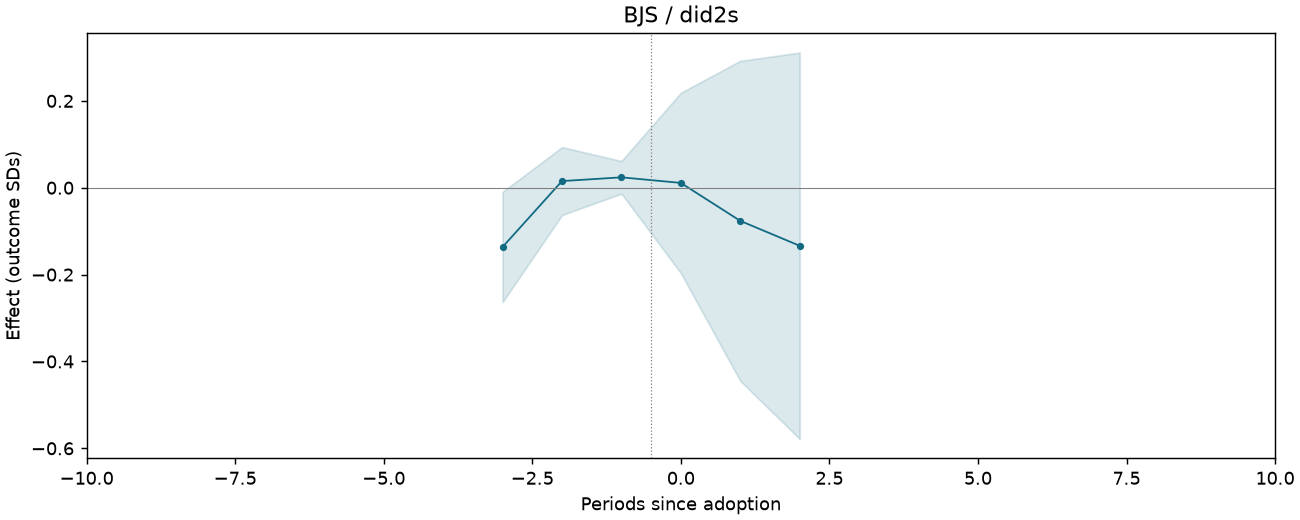
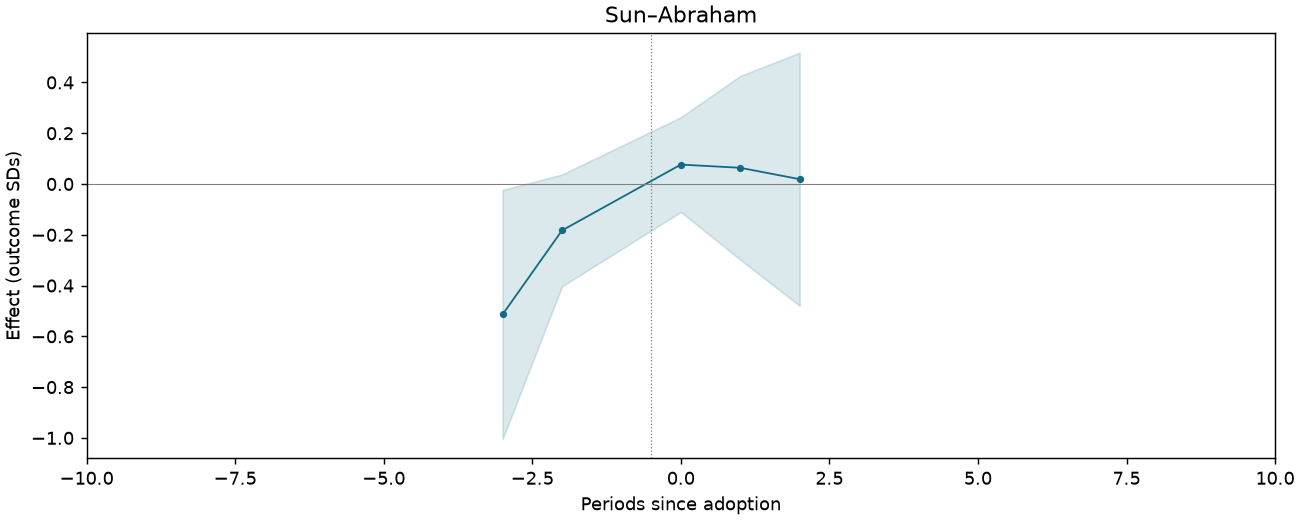
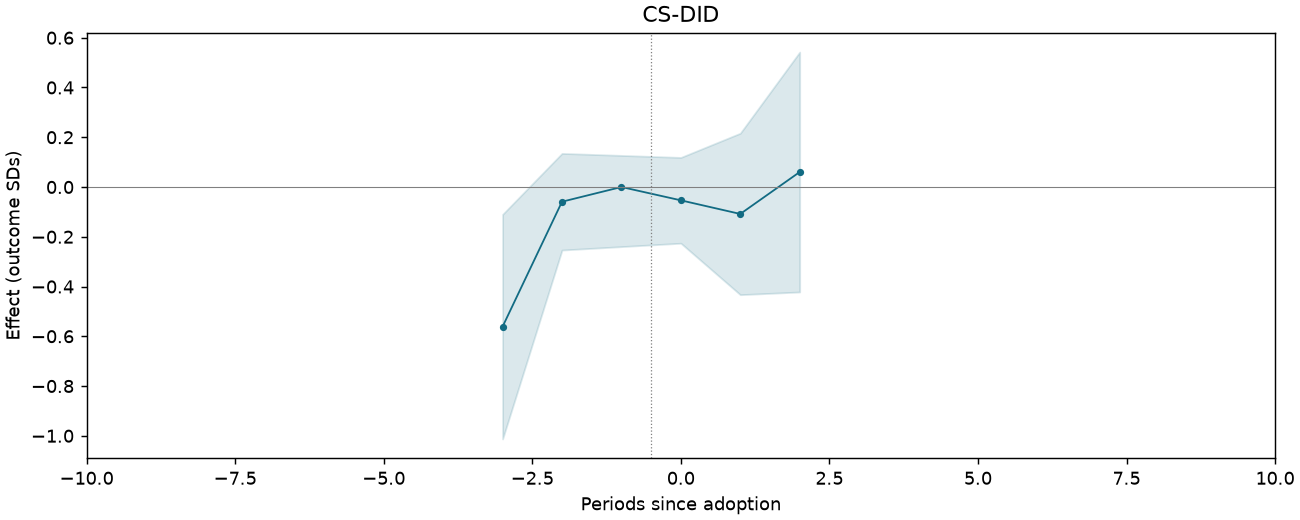
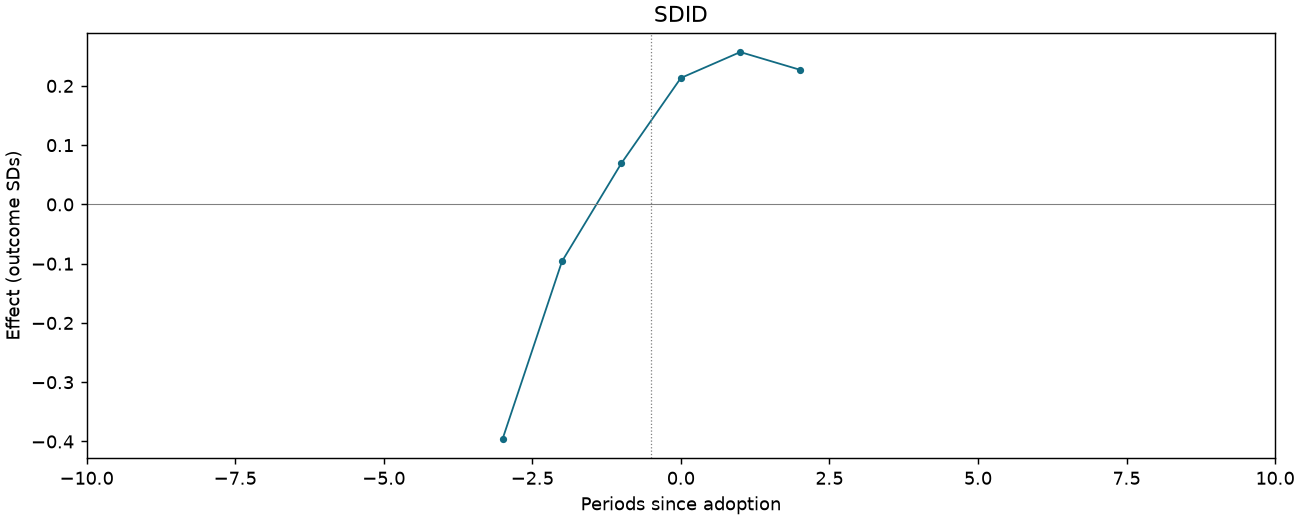
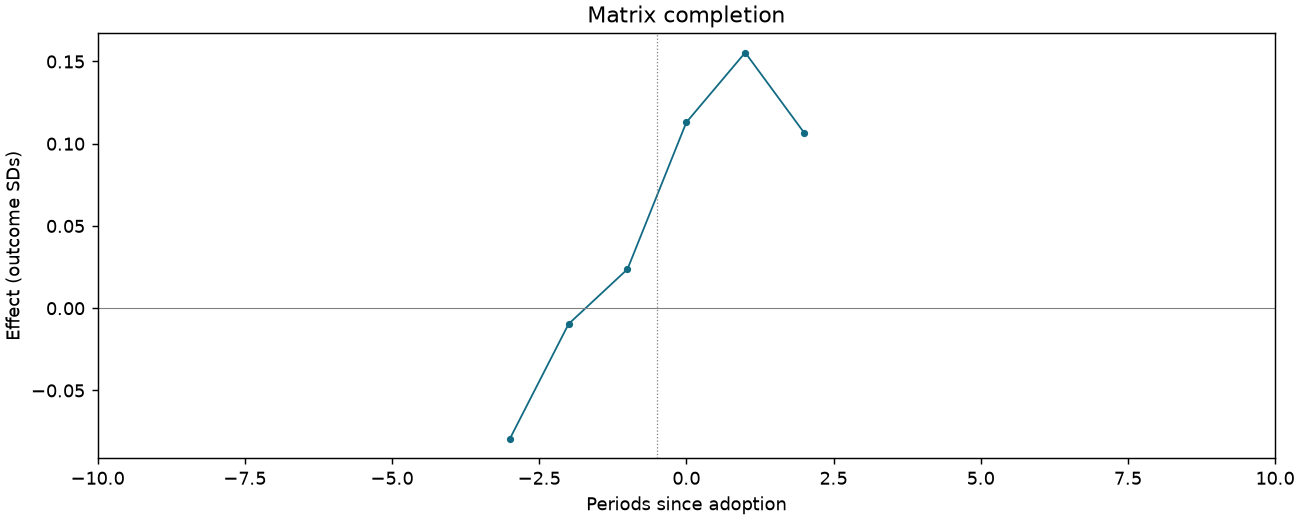
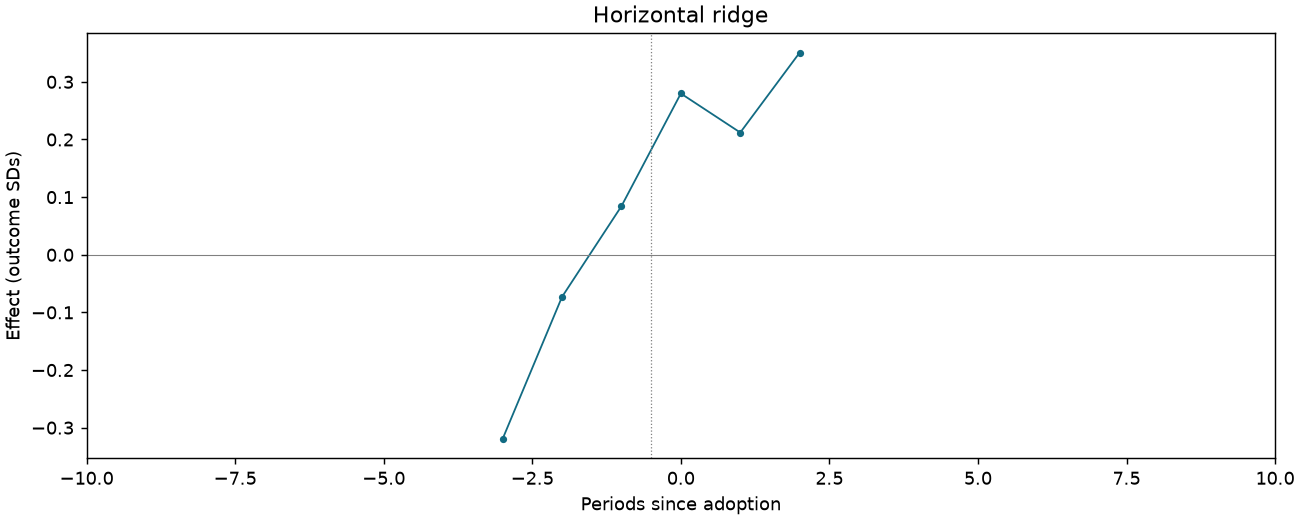
Village head cares not only about rich and powerful [Table 3 original scale]
1,102 observations · 19 units · 19 clusters · 13 treated / 6 control units.
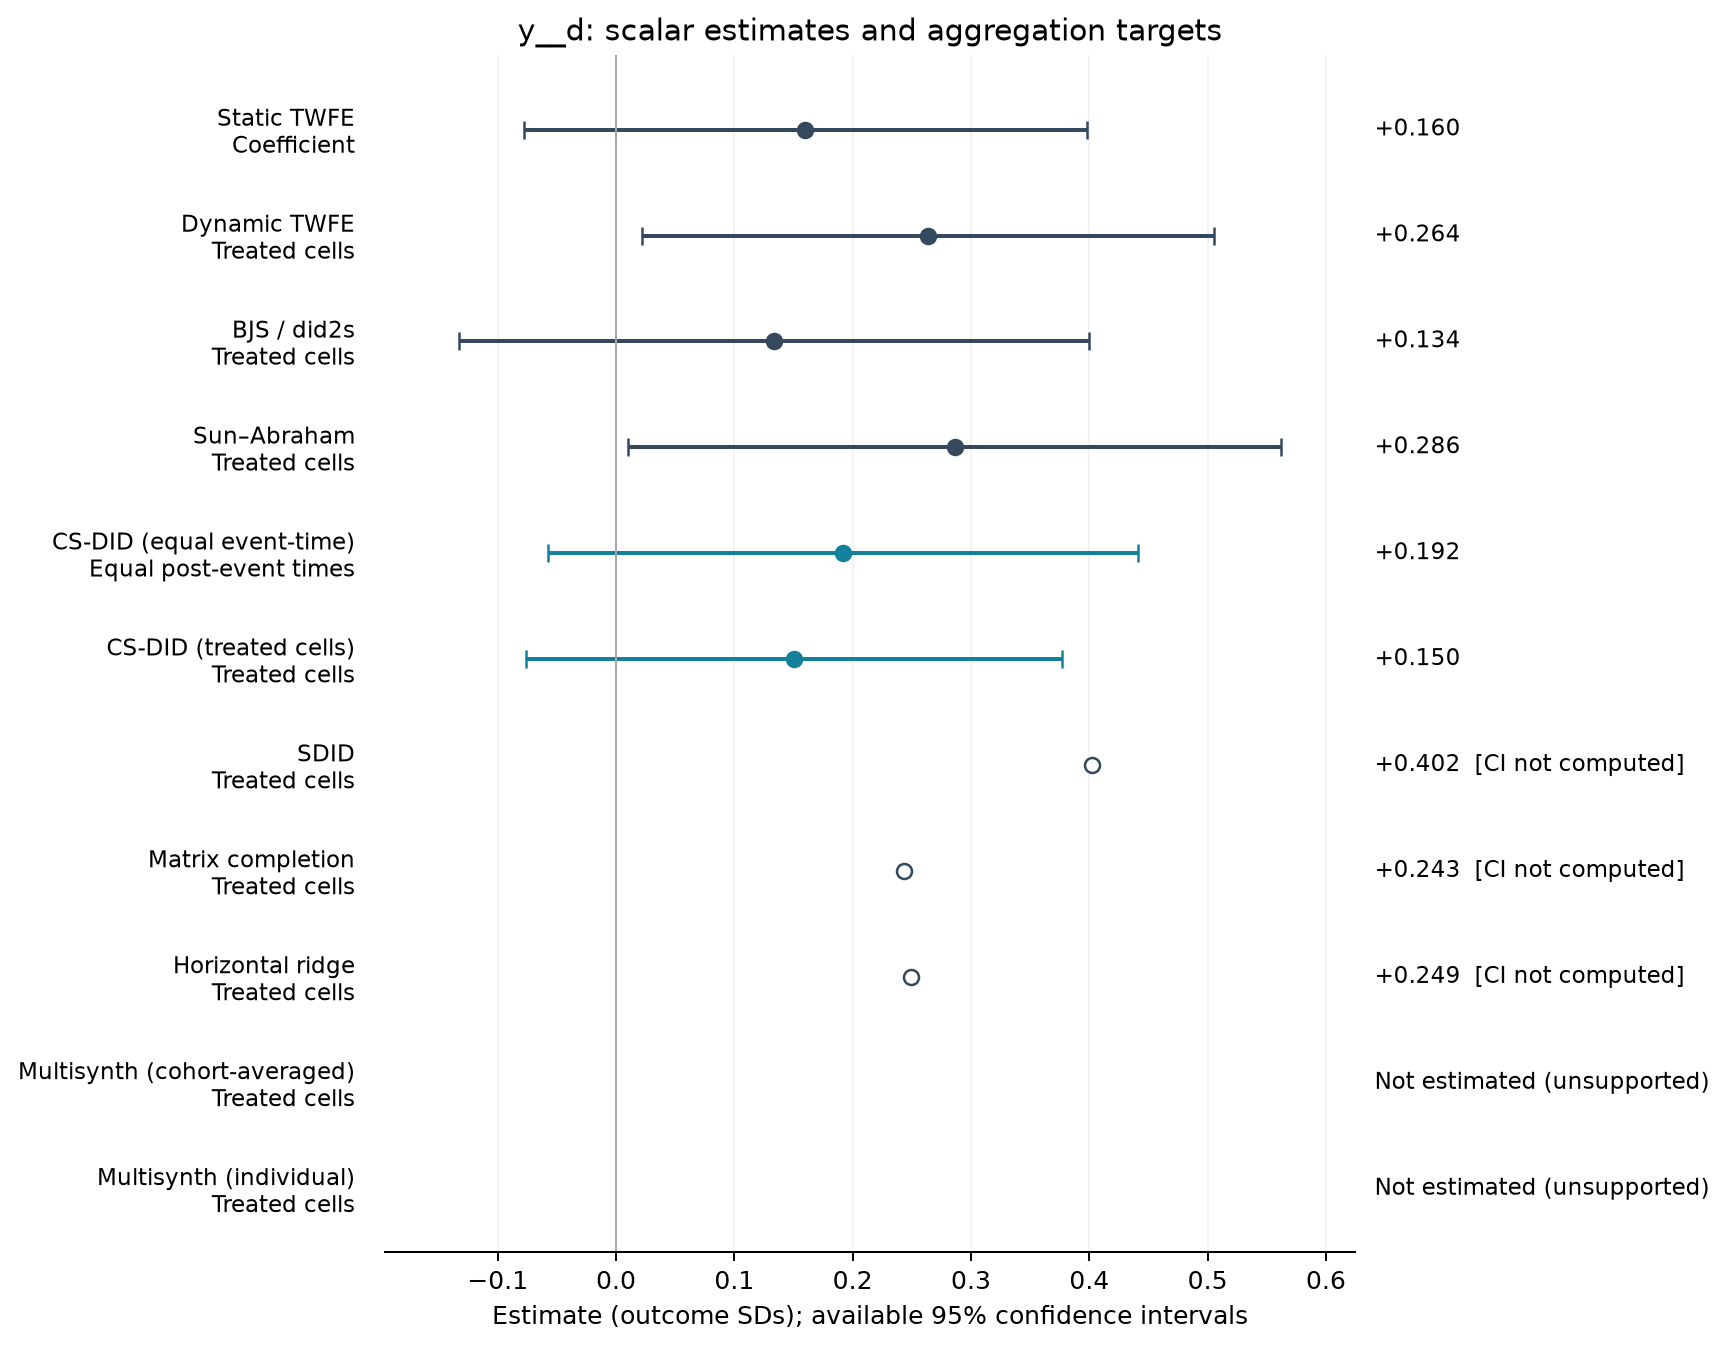
Estimate comparison
| Estimator | Estimate (SDs) | SE | 95% CI | Averaging |
|---|---|---|---|---|
| Static TWFE | 0.160 | 0.113 | [-0.078, 0.398] | Coefficient |
| Dynamic TWFE | 0.264 | 0.115 | [0.022, 0.505] | Treated cells |
| BJS / did2s | 0.134 | 0.127 | [-0.133, 0.400] | Treated cells |
| Sun–Abraham | 0.286 | 0.131 | [0.010, 0.562] | Treated cells |
| CS-DID (equal event-time) | 0.192 | 0.127 | [-0.057, 0.441] | Equal post-event times |
| CS-DID (treated cells) | 0.150 | 0.116 | [-0.076, 0.377] | Treated cells |
| SDID | 0.402 | — | — | Treated cells |
| Matrix completion | 0.243 | — | — | Treated cells |
| Horizontal ridge | 0.249 | — | — | Treated cells |
Event studies
Periods −10 to +10; pointwise 95% intervals where available.
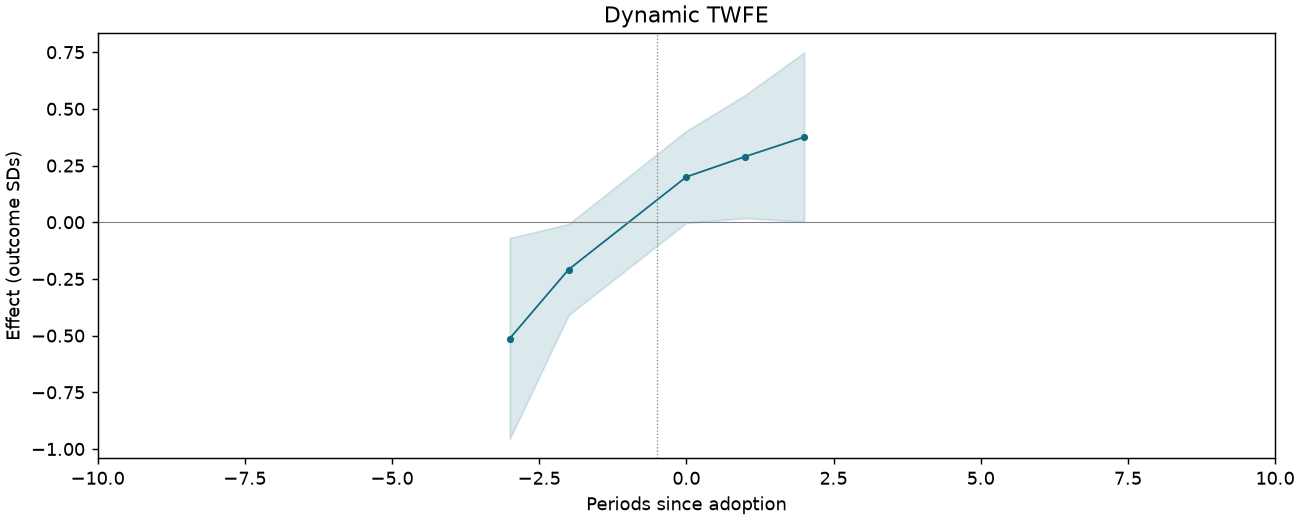
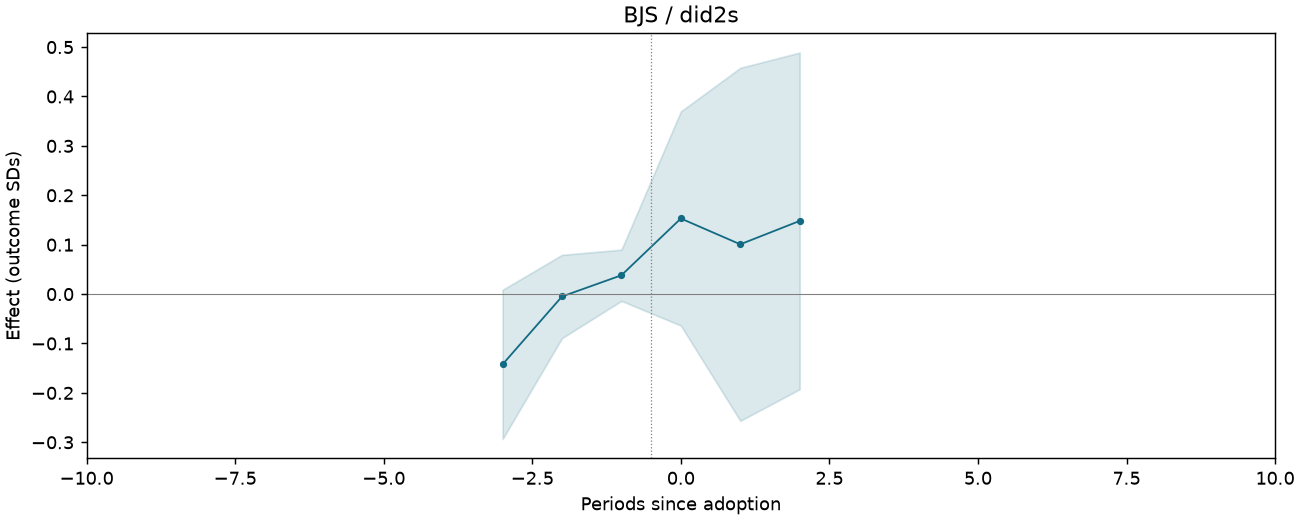
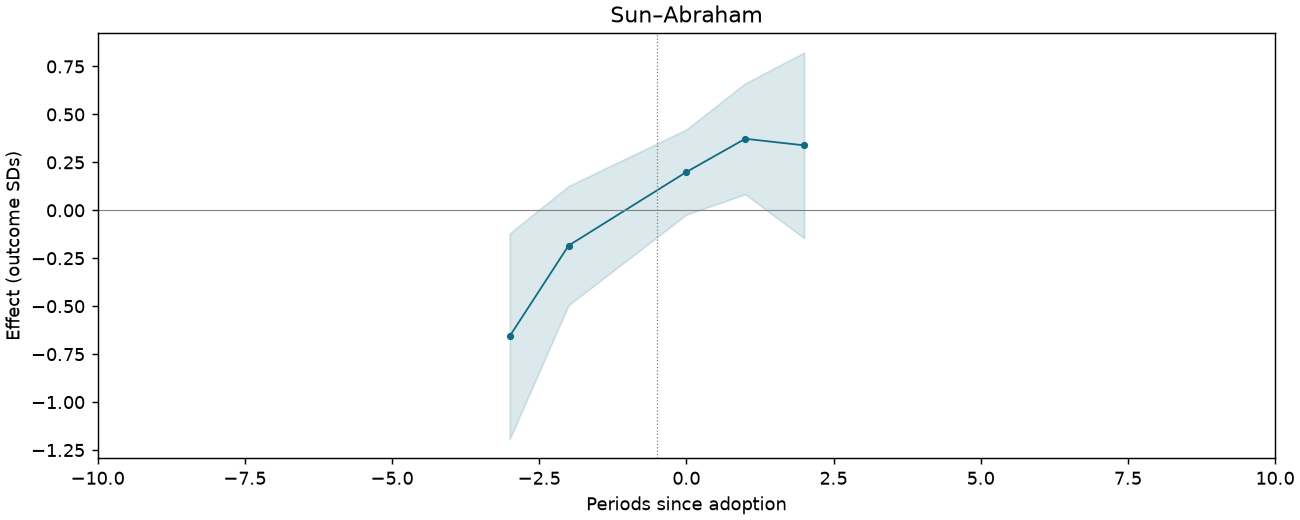
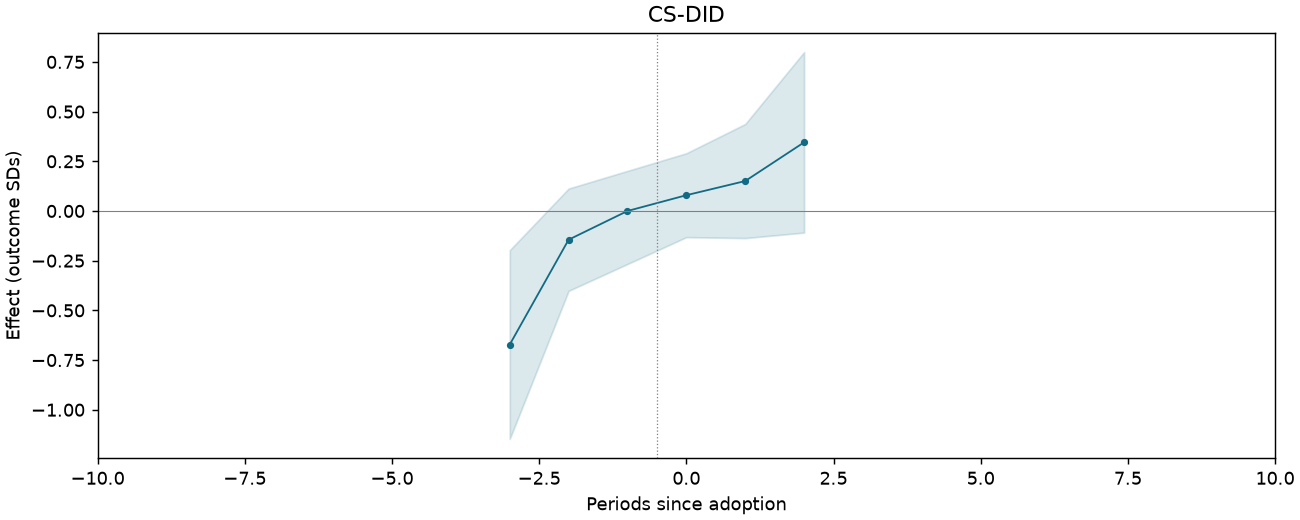
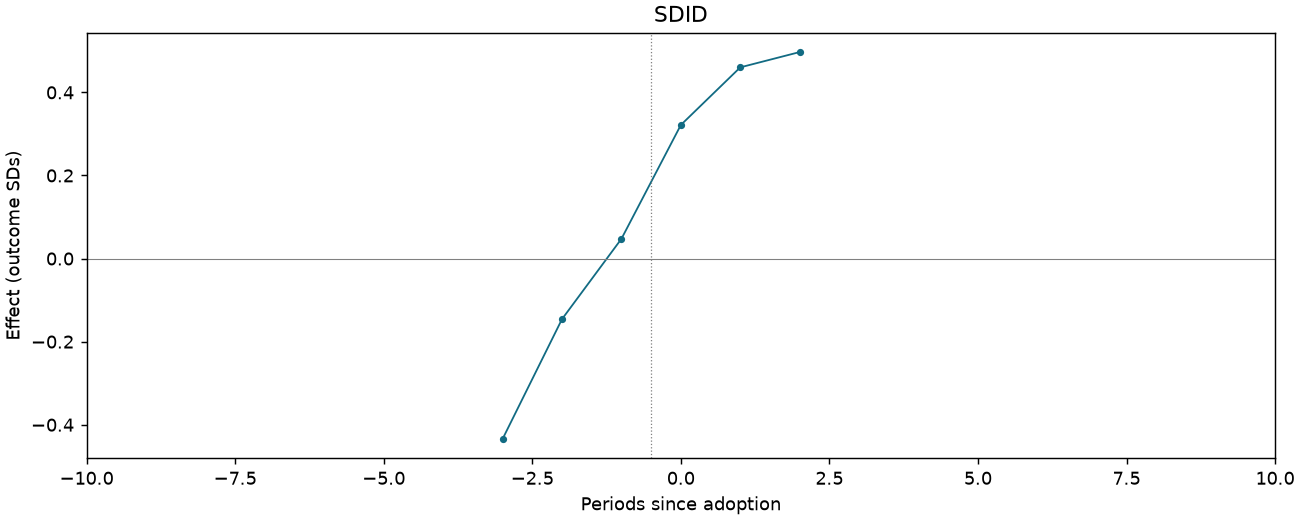
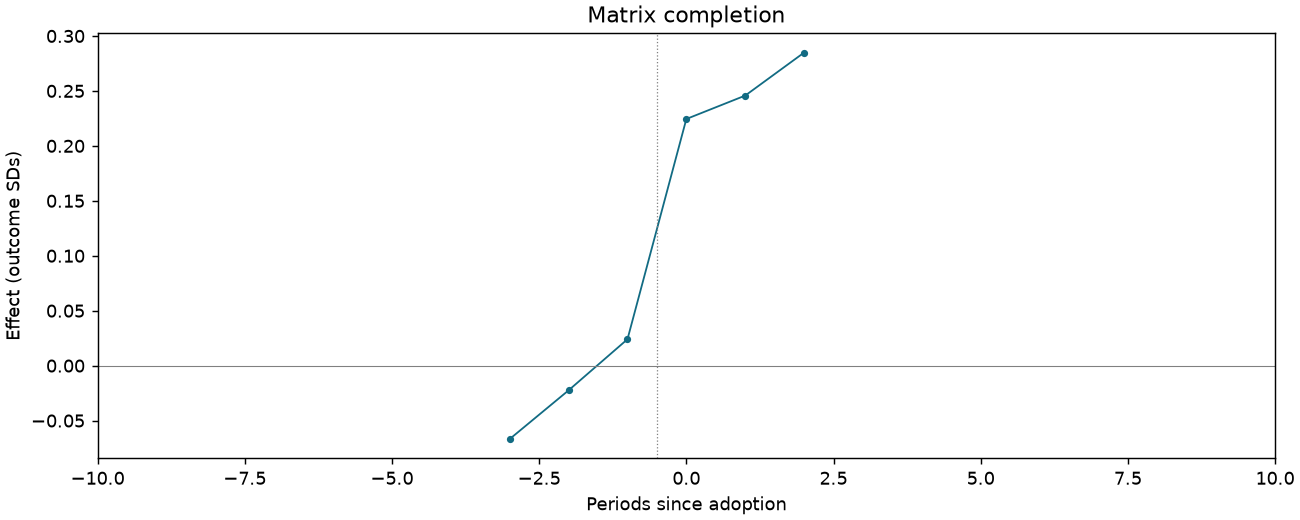
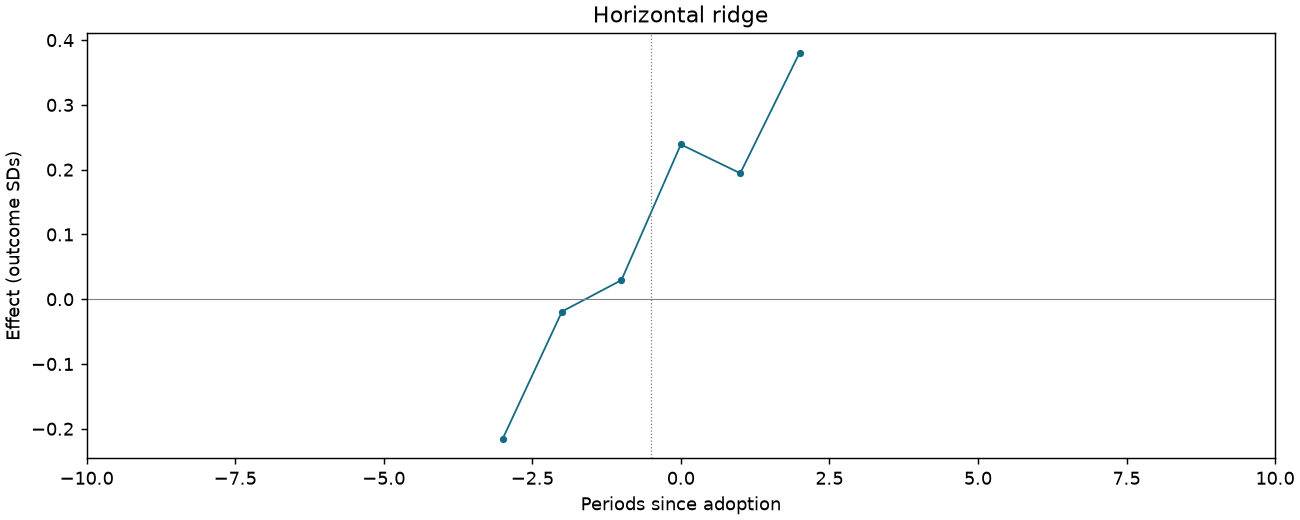
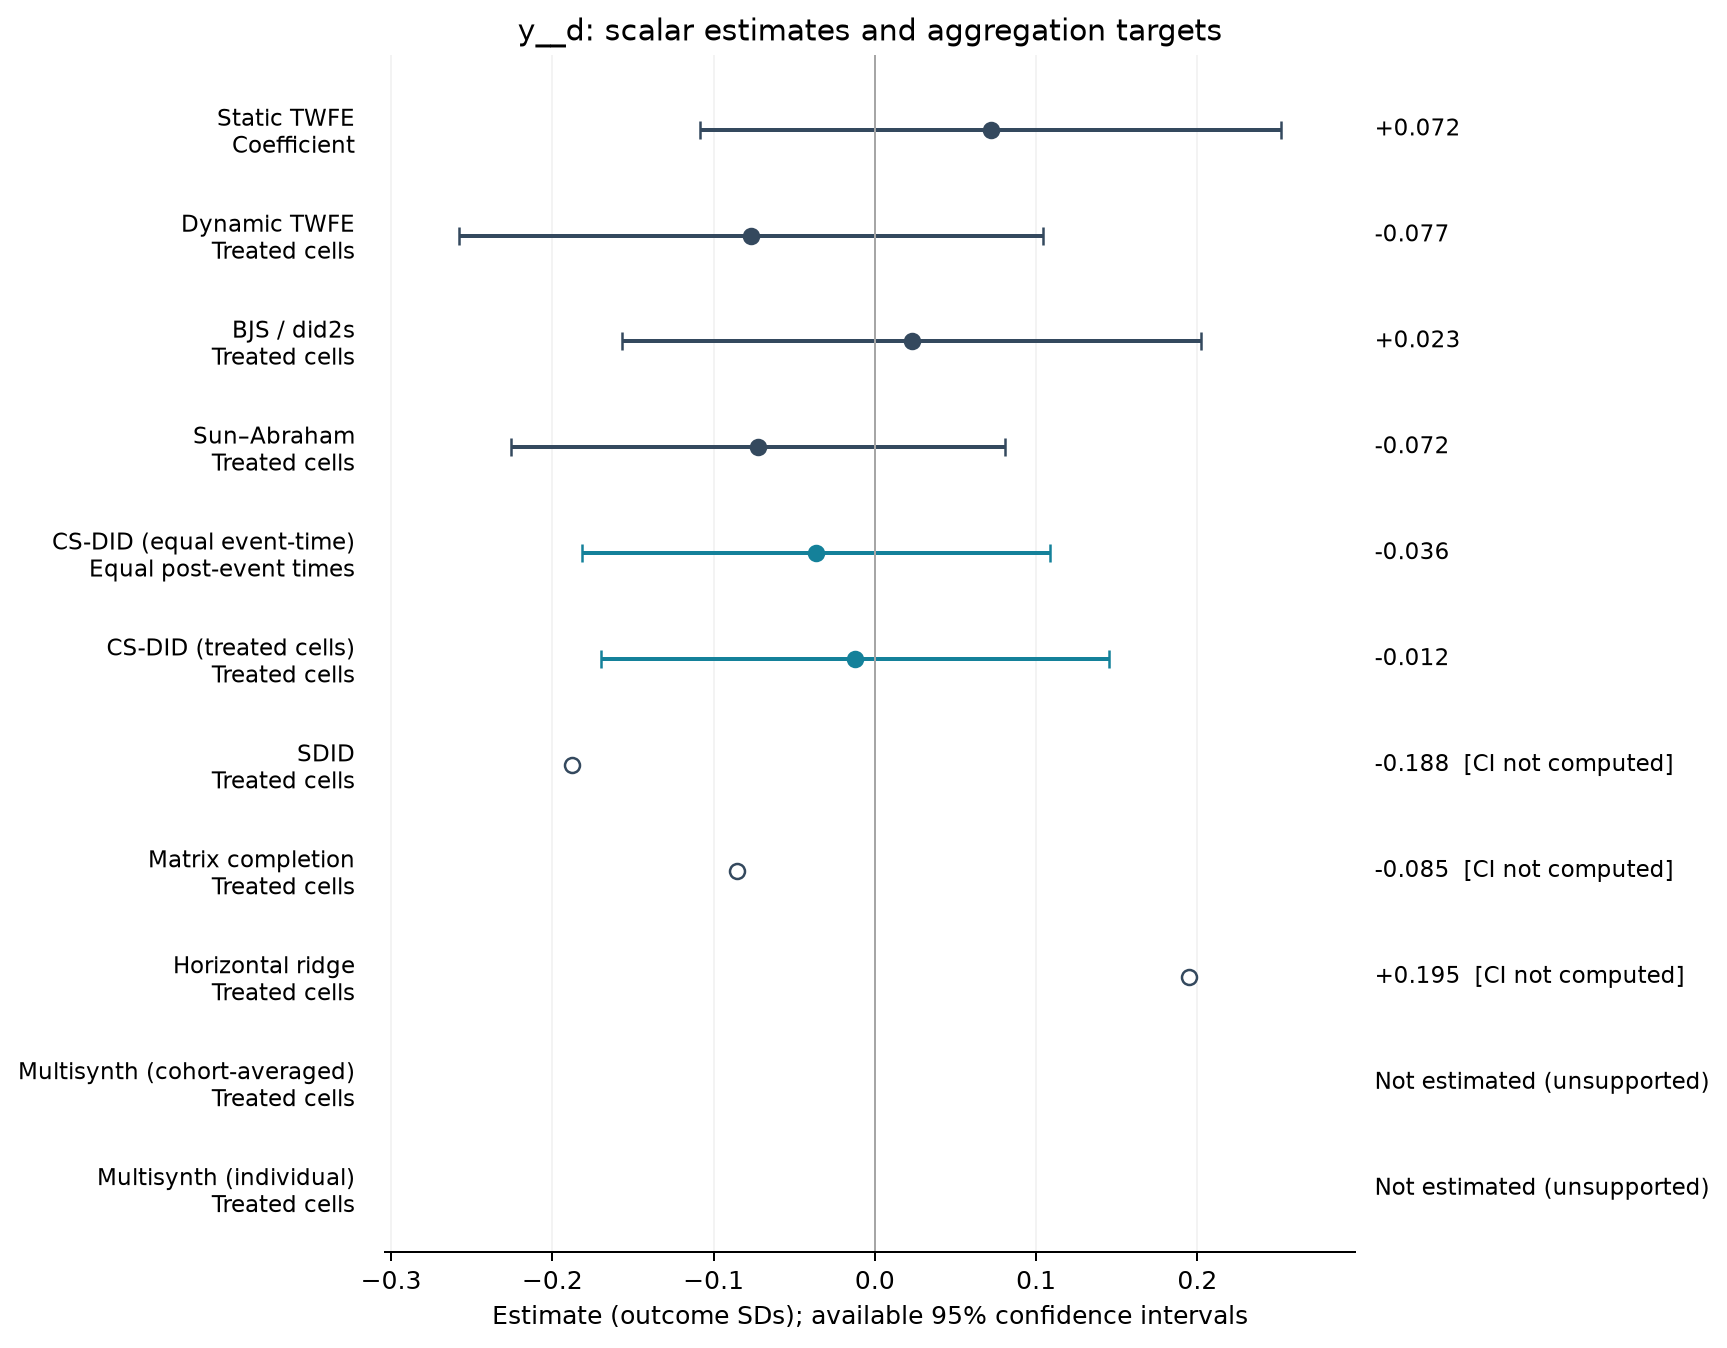
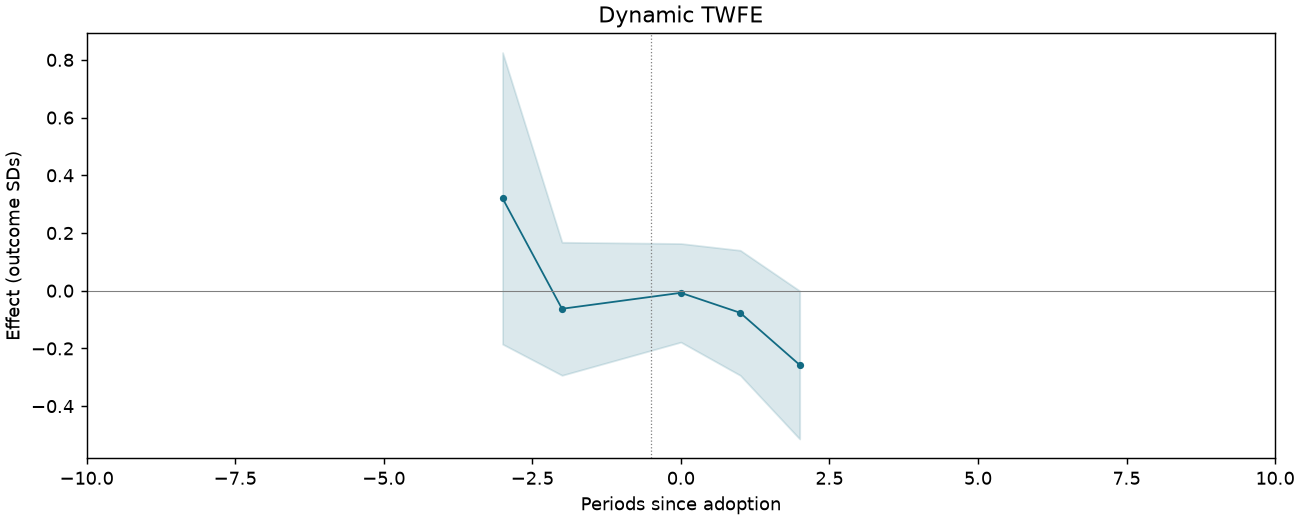
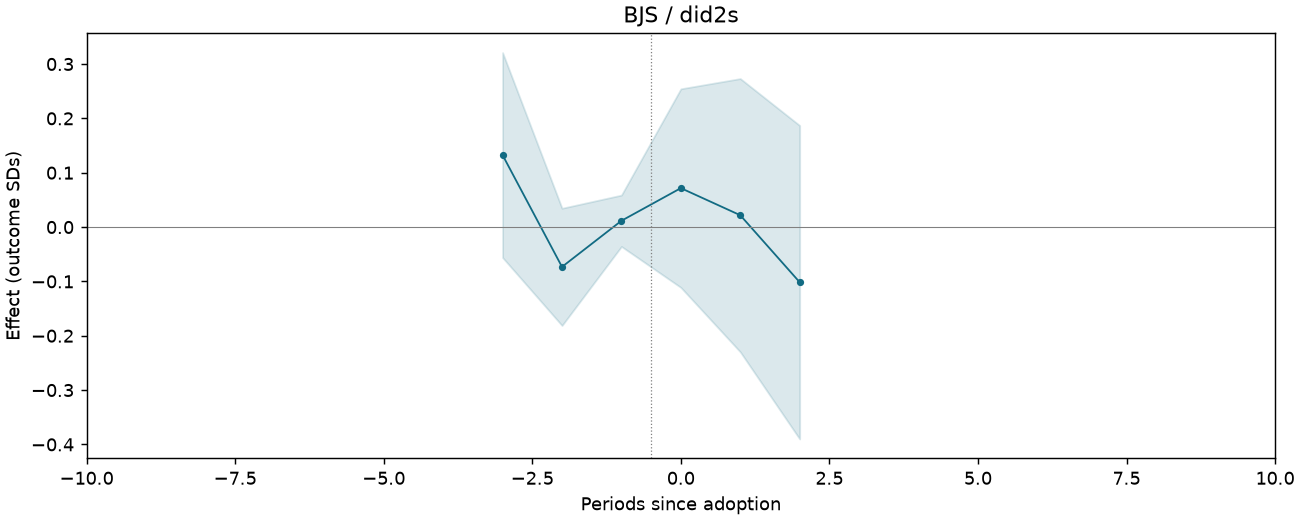
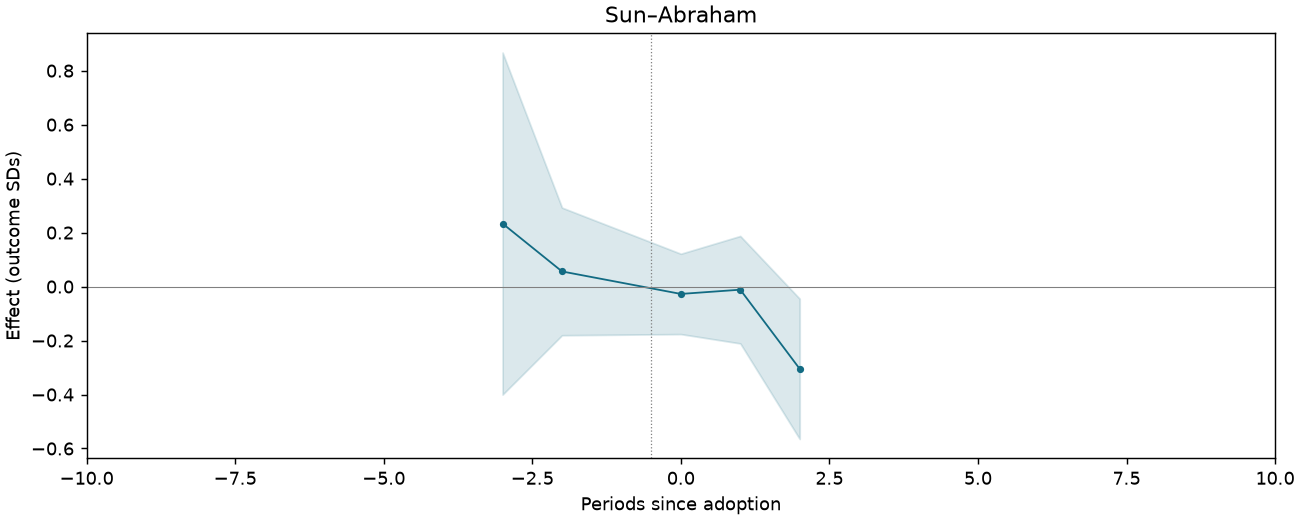
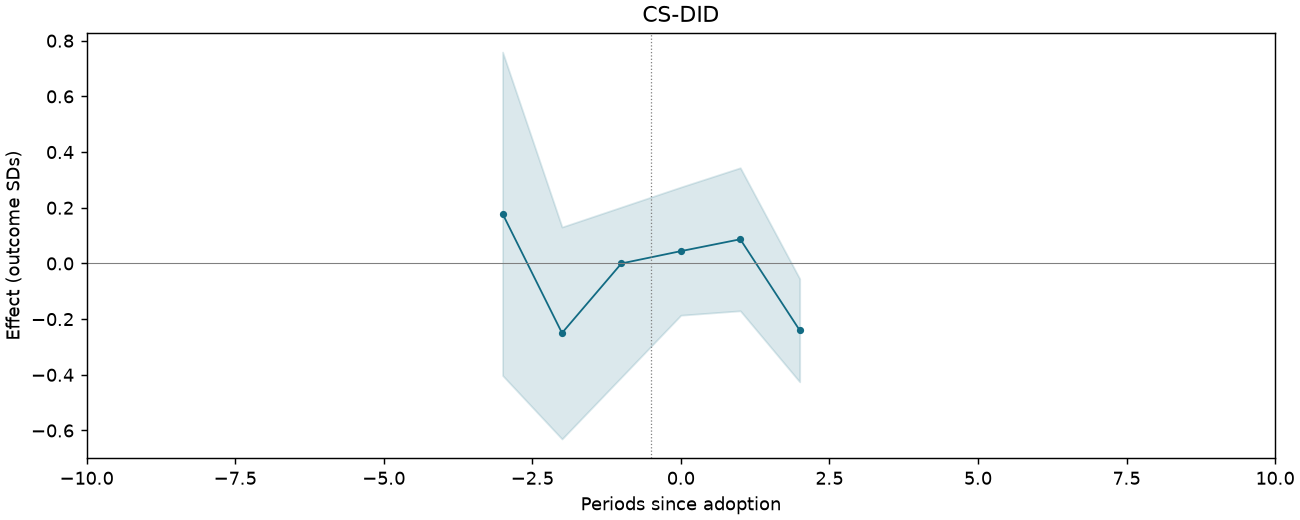
Bribes are not necessary: police [Table 3 original scale]
1,091 observations · 19 units · 19 clusters · 13 treated / 6 control units.
Estimate comparison
| Estimator | Estimate (SDs) | SE | 95% CI | Averaging |
|---|---|---|---|---|
| Static TWFE | 0.072 | 0.086 | [-0.108, 0.252] | Coefficient |
| Dynamic TWFE | -0.077 | 0.086 | [-0.258, 0.104] | Treated cells |
| BJS / did2s | 0.023 | 0.085 | [-0.157, 0.202] | Treated cells |
| Sun–Abraham | -0.072 | 0.073 | [-0.226, 0.081] | Treated cells |
| CS-DID (equal event-time) | -0.036 | 0.074 | [-0.182, 0.109] | Equal post-event times |
| CS-DID (treated cells) | -0.012 | 0.080 | [-0.170, 0.145] | Treated cells |
| SDID | -0.188 | — | — | Treated cells |
| Matrix completion | -0.085 | — | — | Treated cells |
| Horizontal ridge | 0.195 | — | — | Treated cells |
Event studies
Periods −10 to +10; pointwise 95% intervals where available.
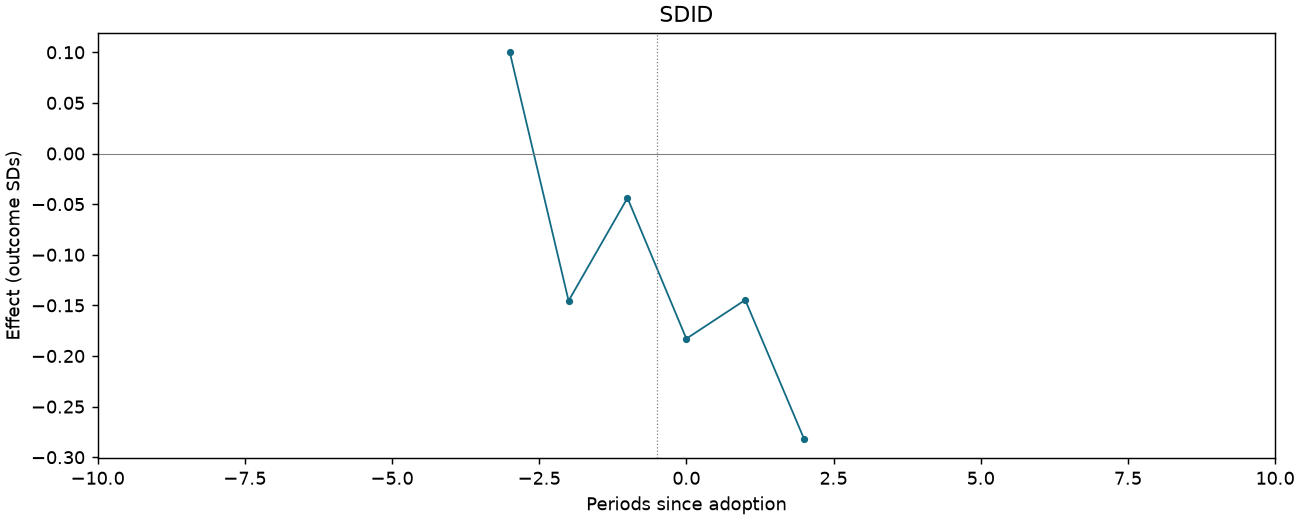
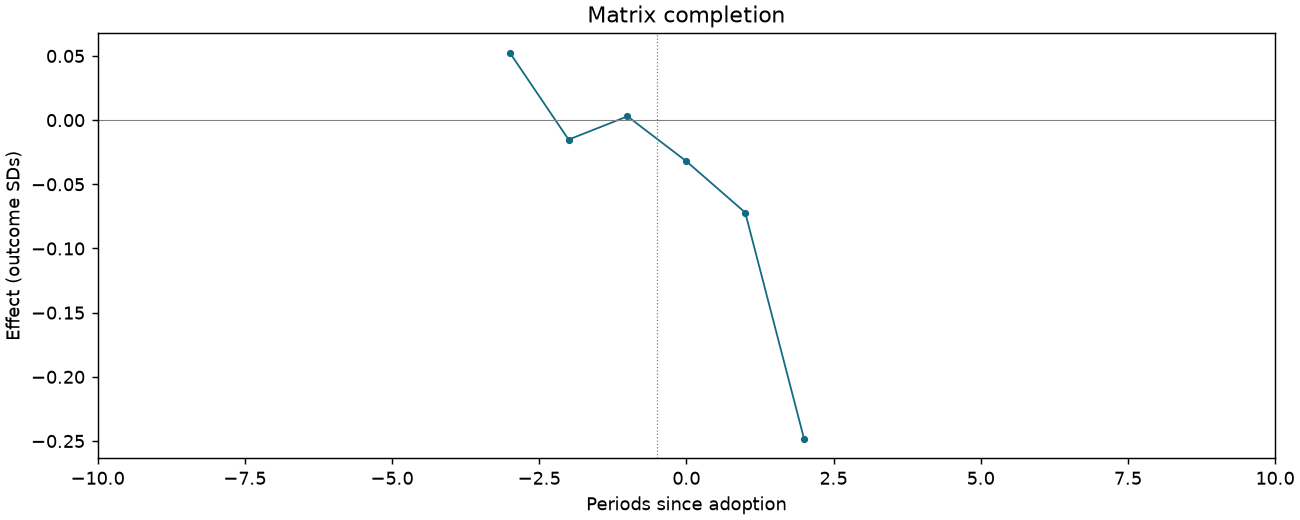
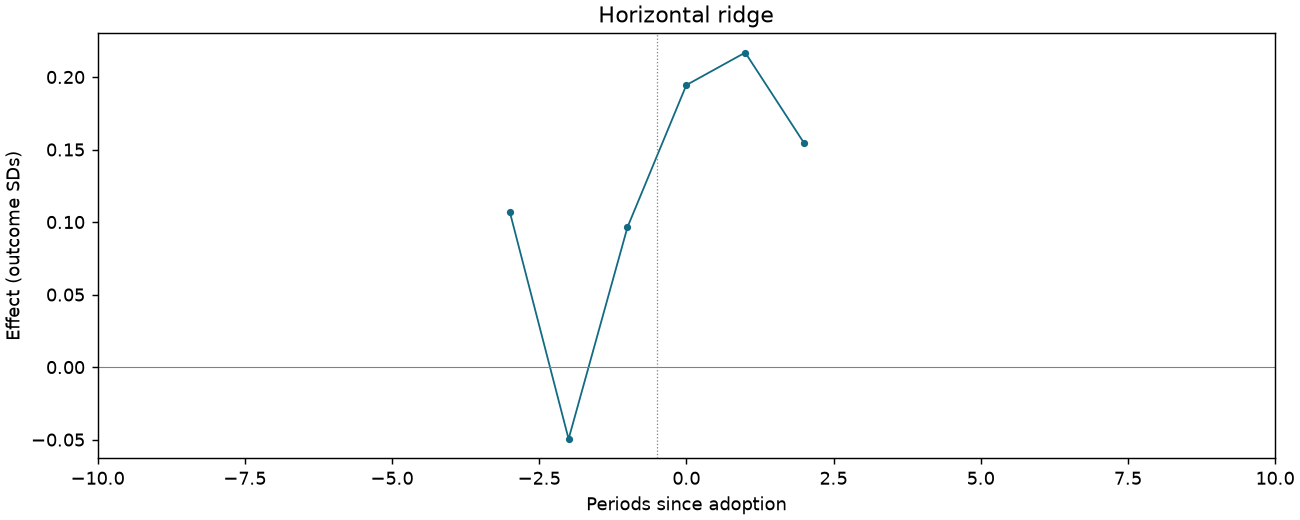
Bribes are not necessary: documents [Table 3 original scale]
1,091 observations · 19 units · 19 clusters · 13 treated / 6 control units.
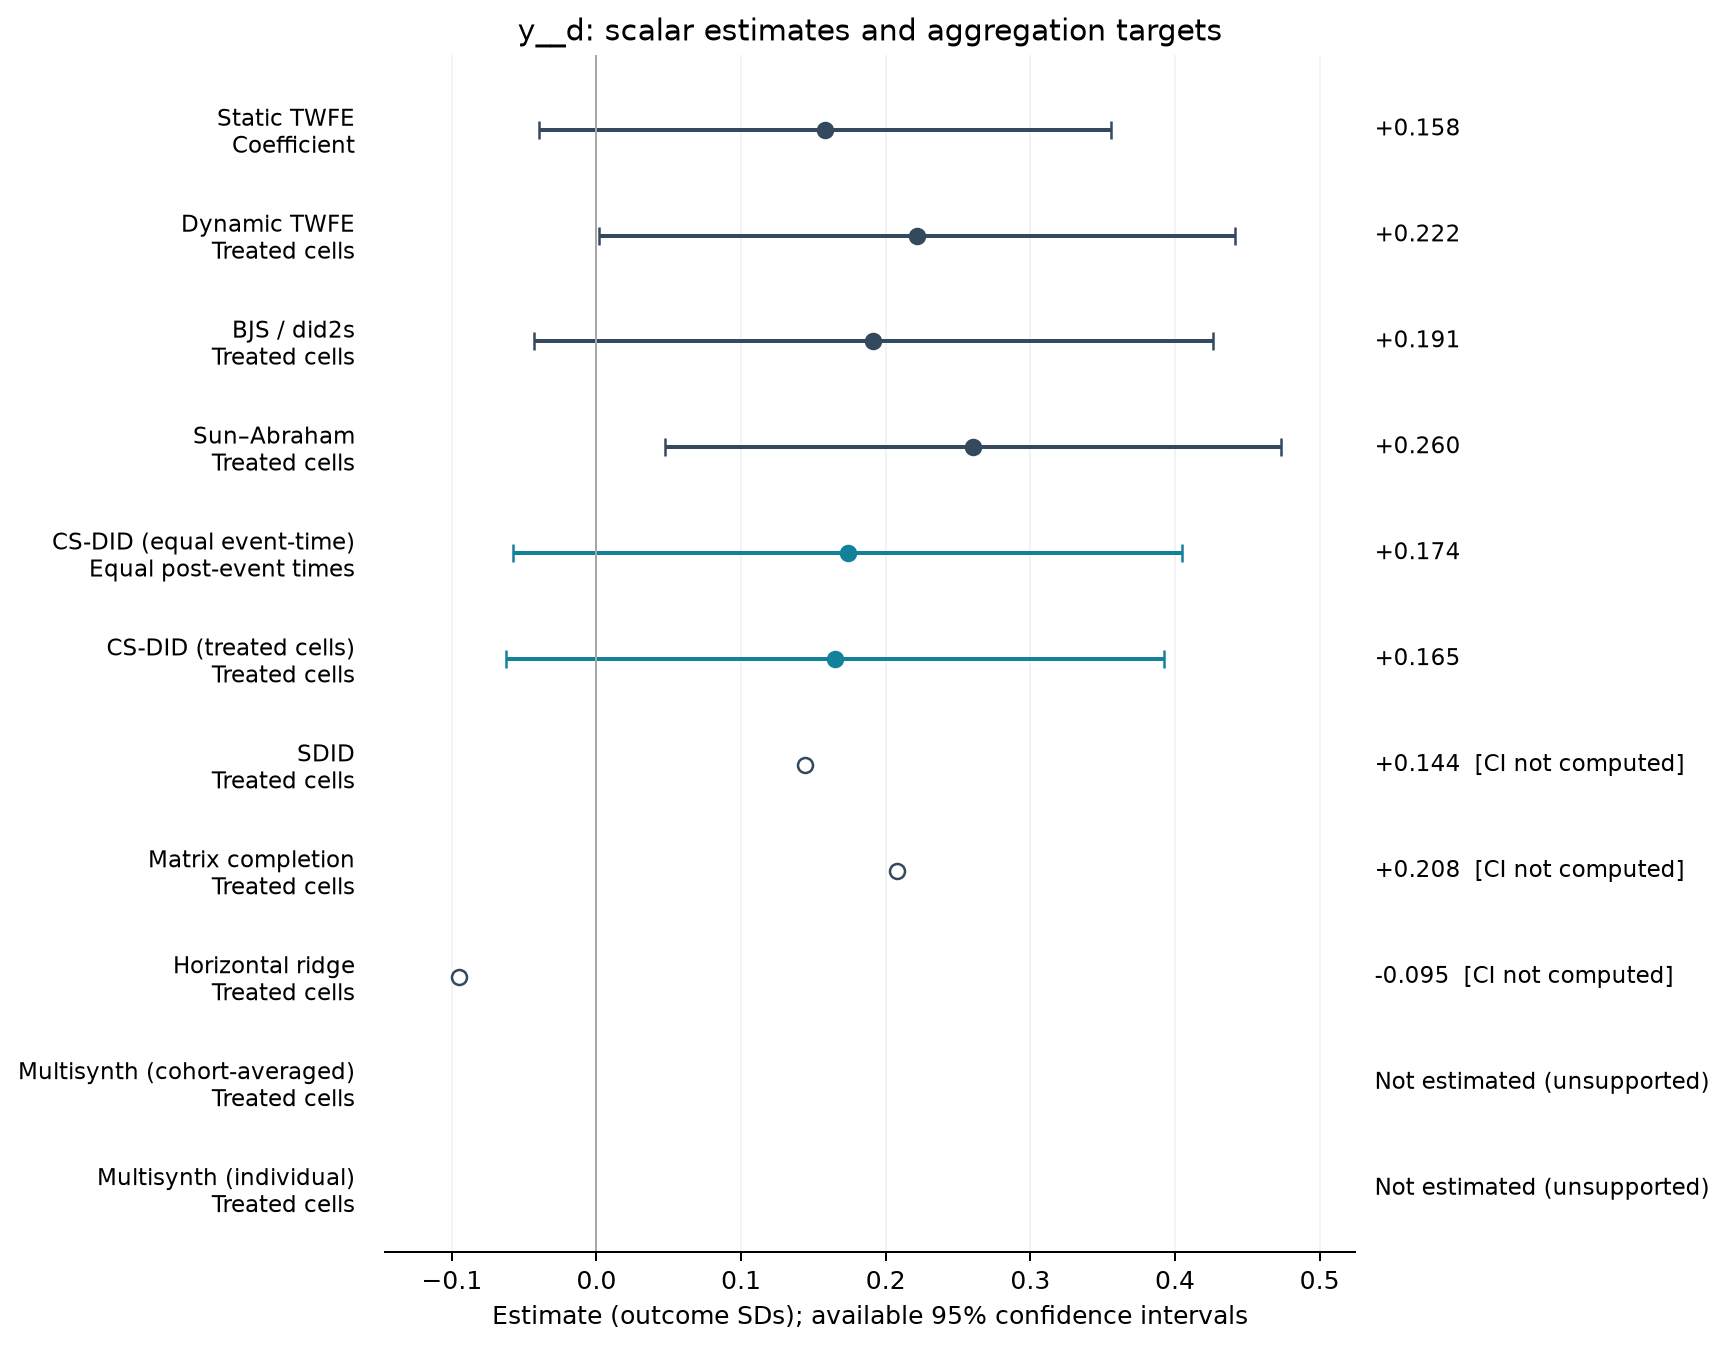
Estimate comparison
| Estimator | Estimate (SDs) | SE | 95% CI | Averaging |
|---|---|---|---|---|
| Static TWFE | 0.158 | 0.094 | [-0.040, 0.356] | Coefficient |
| Dynamic TWFE | 0.222 | 0.105 | [0.002, 0.442] | Treated cells |
| BJS / did2s | 0.191 | 0.112 | [-0.043, 0.426] | Treated cells |
| Sun–Abraham | 0.260 | 0.101 | [0.047, 0.473] | Treated cells |
| CS-DID (equal event-time) | 0.174 | 0.118 | [-0.058, 0.405] | Equal post-event times |
| CS-DID (treated cells) | 0.165 | 0.116 | [-0.063, 0.392] | Treated cells |
| SDID | 0.144 | — | — | Treated cells |
| Matrix completion | 0.208 | — | — | Treated cells |
| Horizontal ridge | -0.095 | — | — | Treated cells |
Event studies
Periods −10 to +10; pointwise 95% intervals where available.
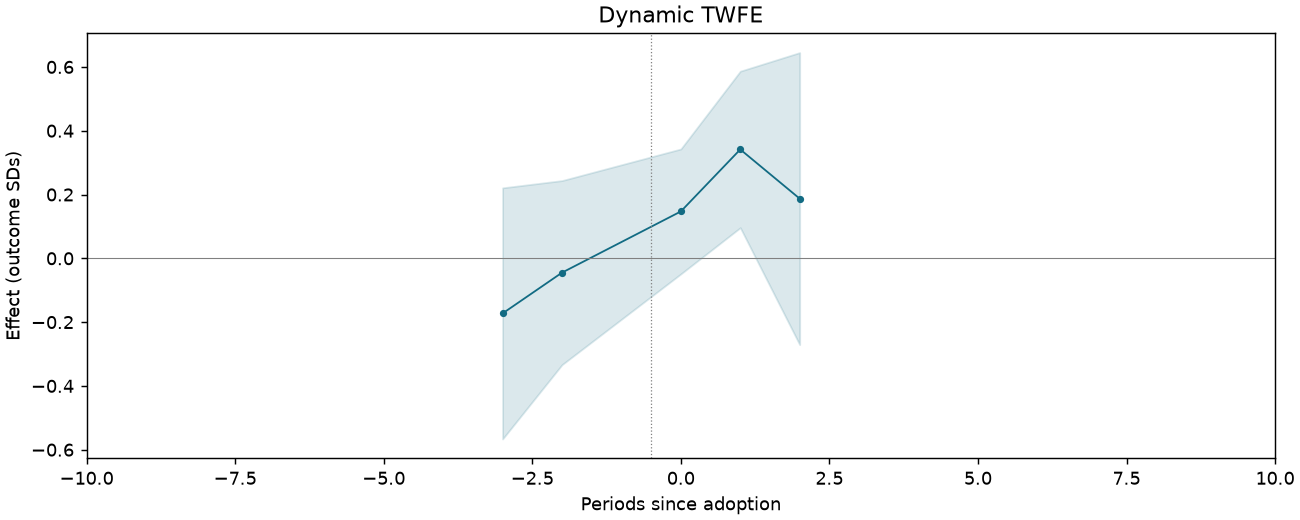
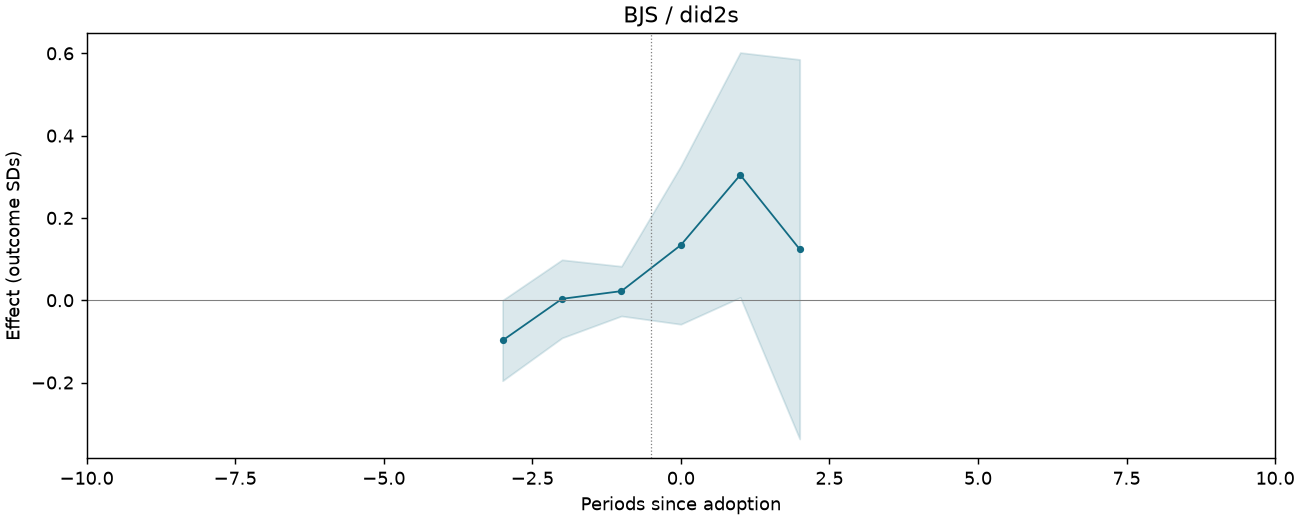
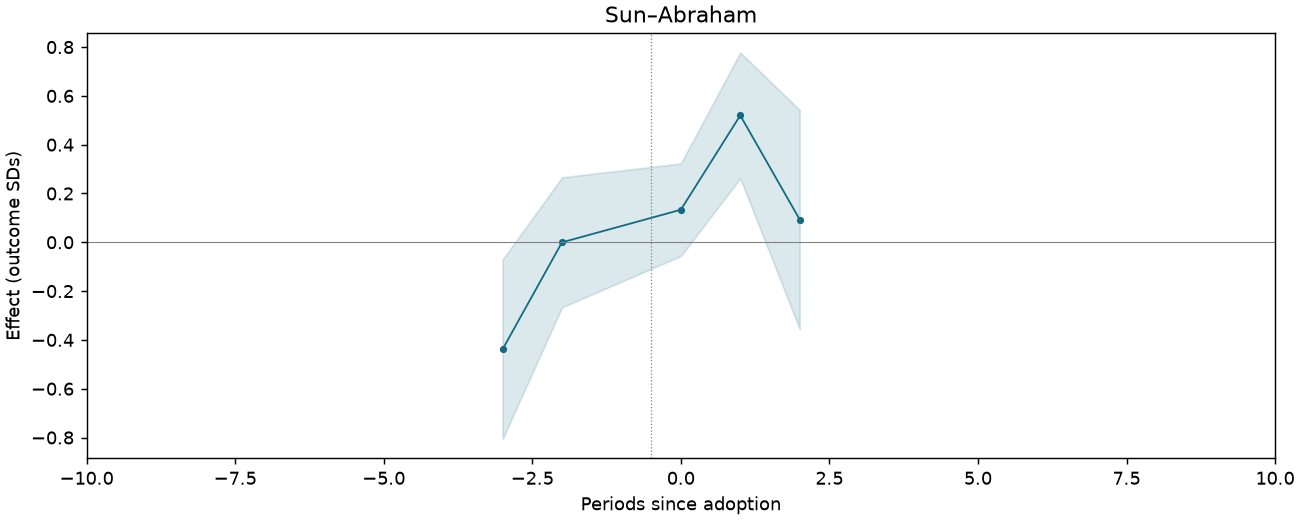
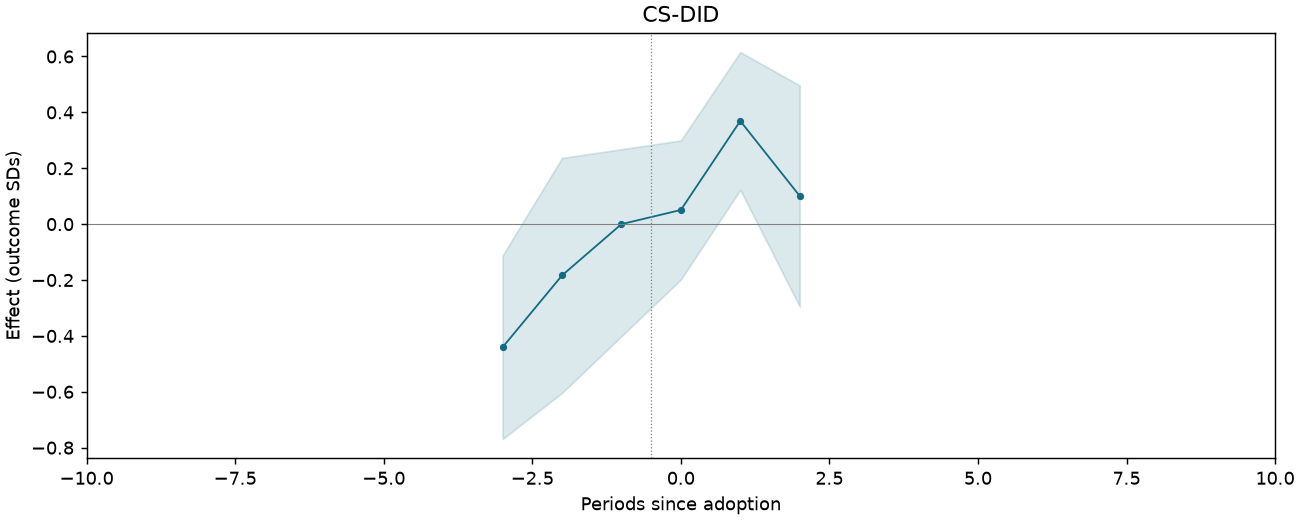
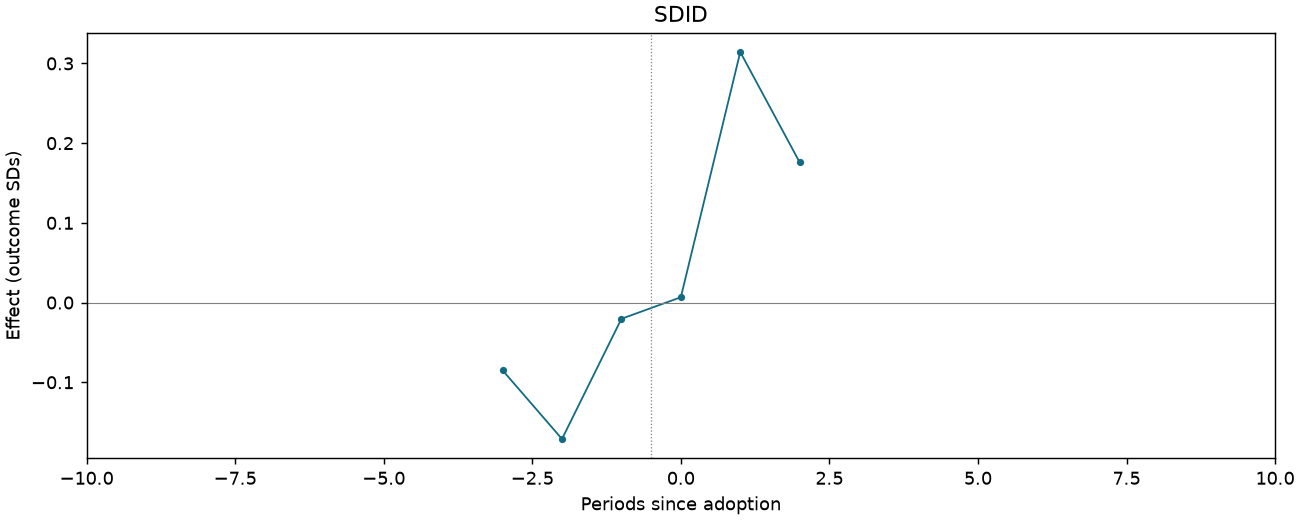
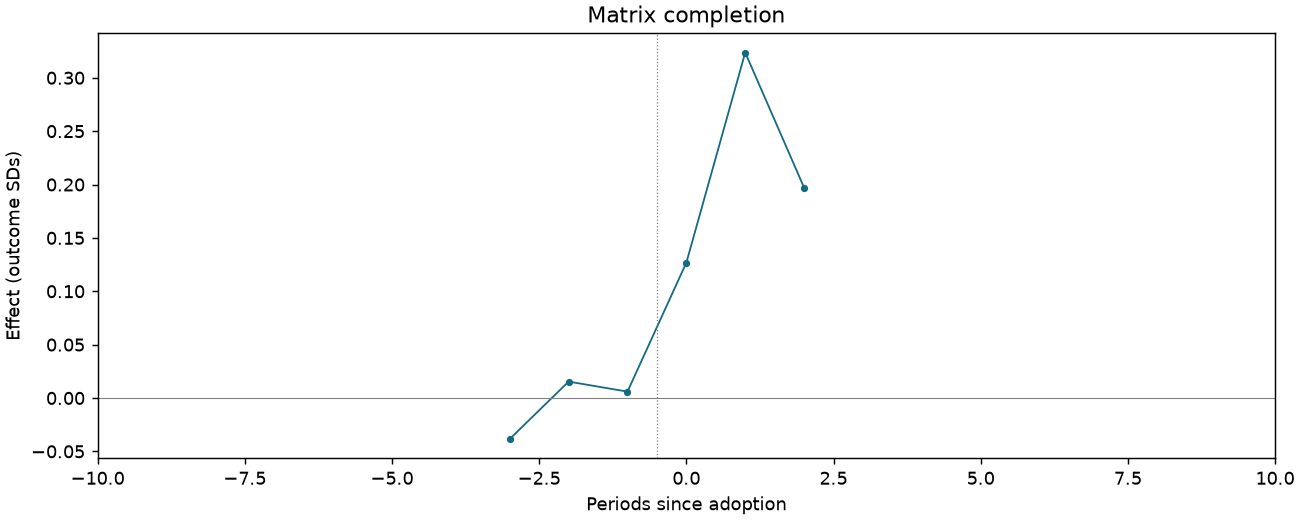
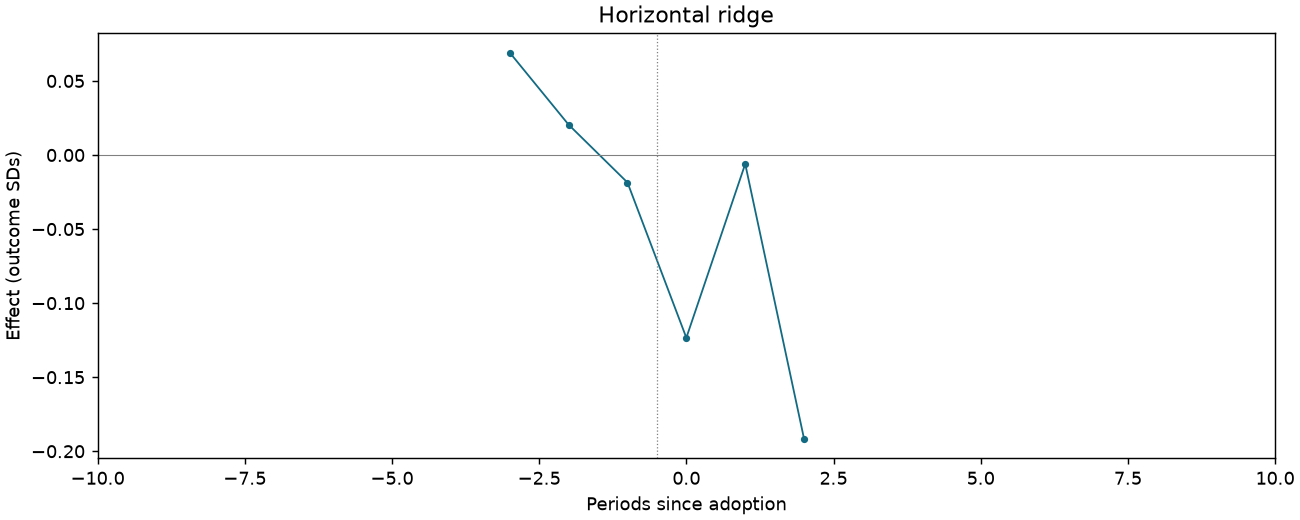
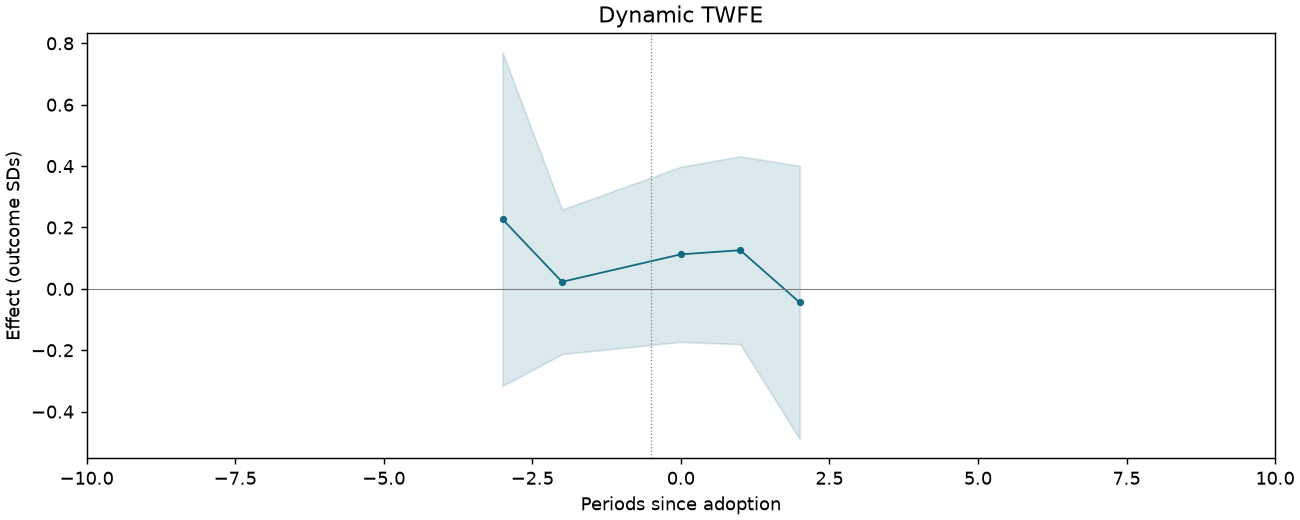
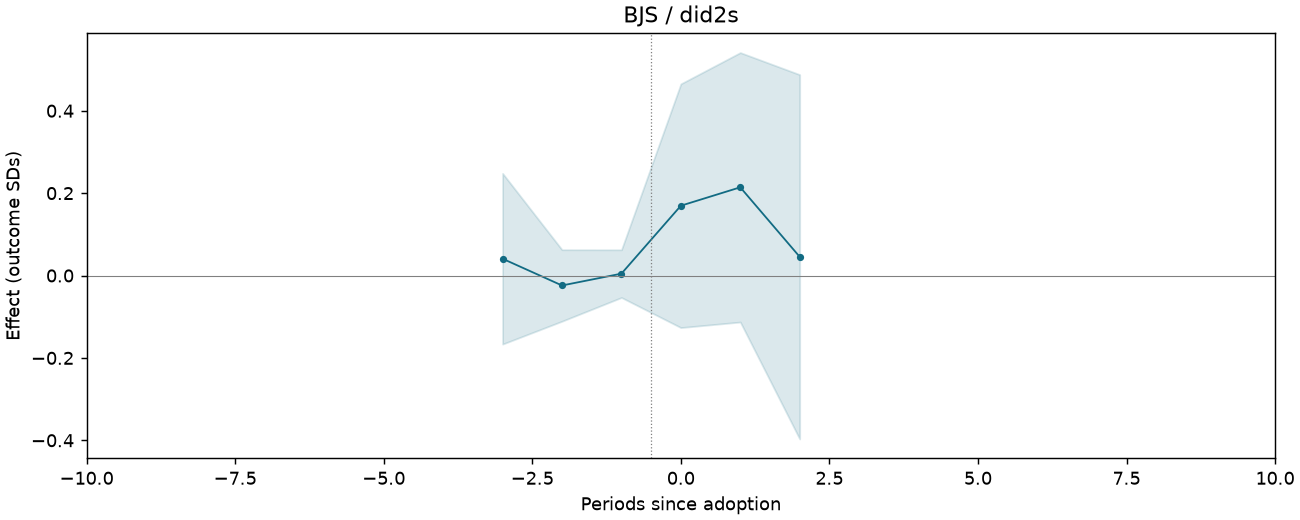
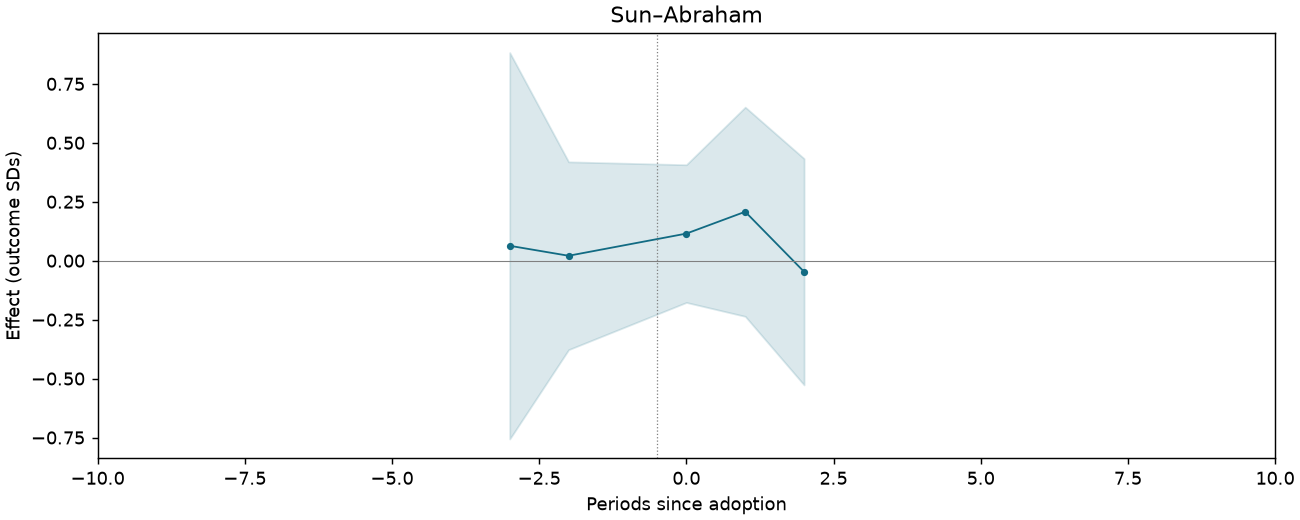
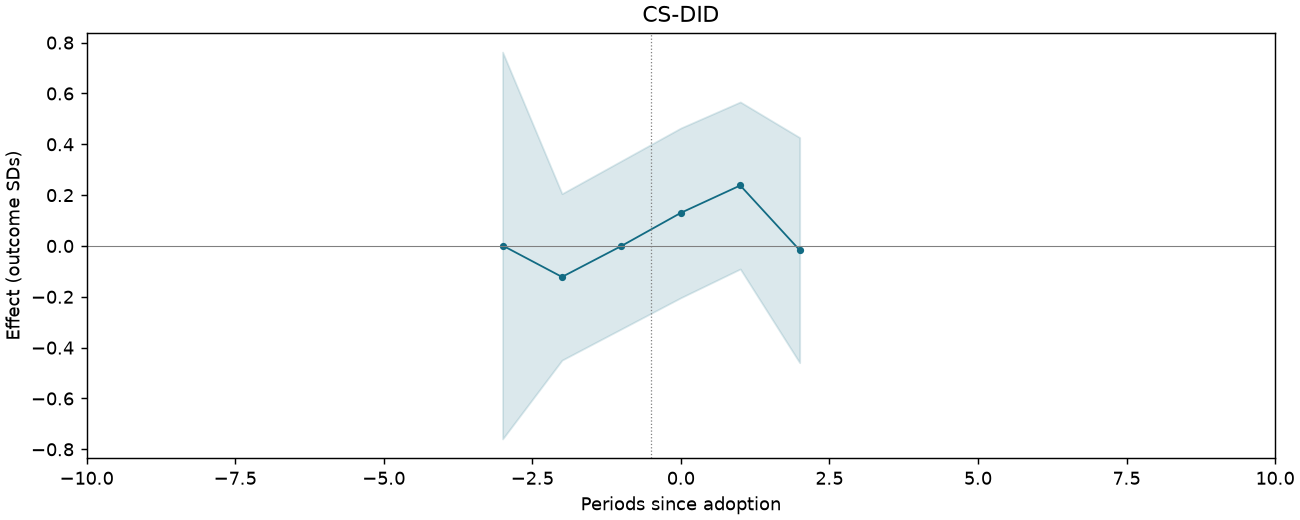
Bribes are not necessary: courts [Table 3 original scale]
1,091 observations · 19 units · 19 clusters · 13 treated / 6 control units.
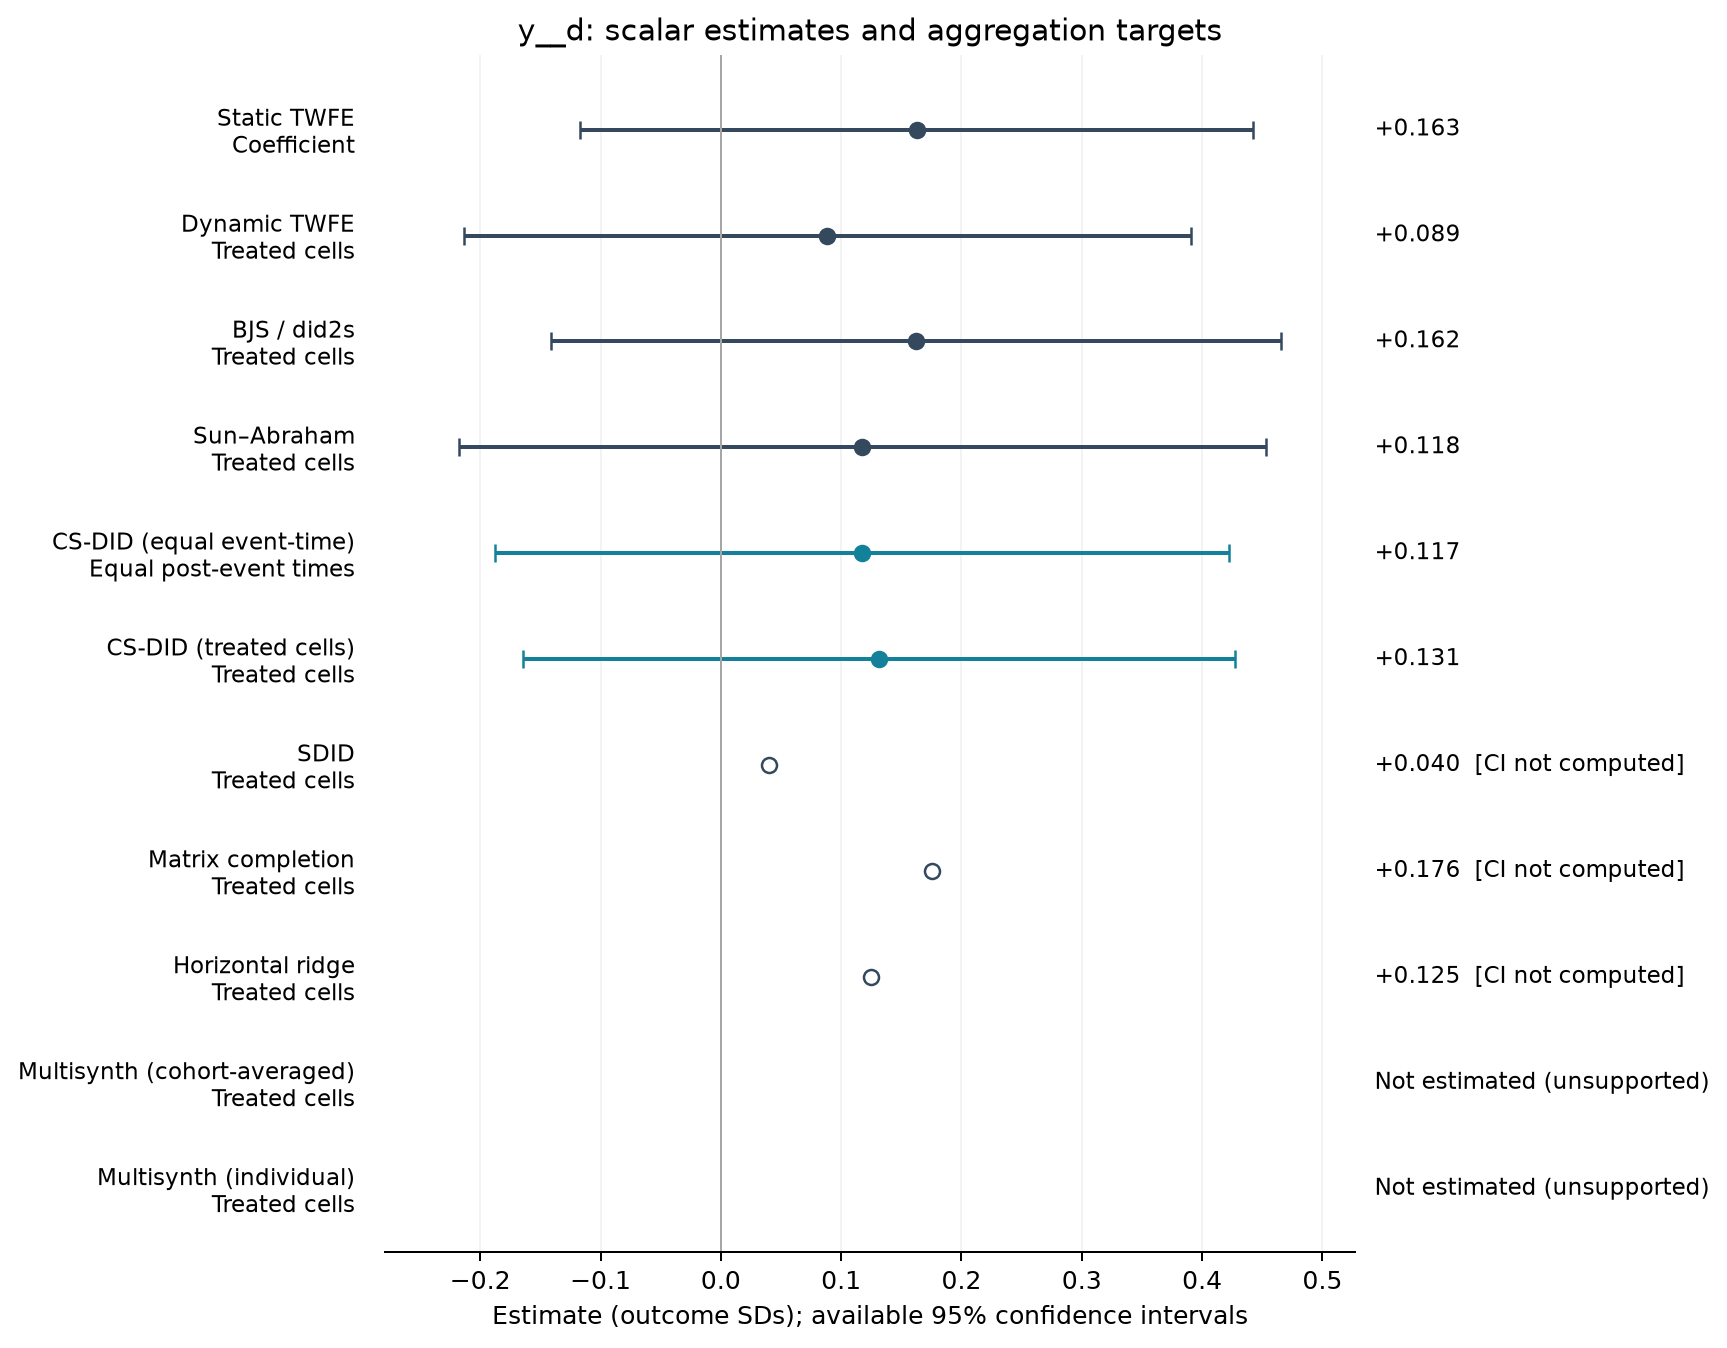
Estimate comparison
| Estimator | Estimate (SDs) | SE | 95% CI | Averaging |
|---|---|---|---|---|
| Static TWFE | 0.163 | 0.133 | [-0.117, 0.442] | Coefficient |
| Dynamic TWFE | 0.089 | 0.144 | [-0.213, 0.391] | Treated cells |
| BJS / did2s | 0.162 | 0.144 | [-0.141, 0.466] | Treated cells |
| Sun–Abraham | 0.118 | 0.160 | [-0.218, 0.453] | Treated cells |
| CS-DID (equal event-time) | 0.117 | 0.156 | [-0.188, 0.422] | Equal post-event times |
| CS-DID (treated cells) | 0.131 | 0.151 | [-0.165, 0.427] | Treated cells |
| SDID | 0.040 | — | — | Treated cells |
| Matrix completion | 0.176 | — | — | Treated cells |
| Horizontal ridge | 0.125 | — | — | Treated cells |
Event studies
Periods −10 to +10; pointwise 95% intervals where available.
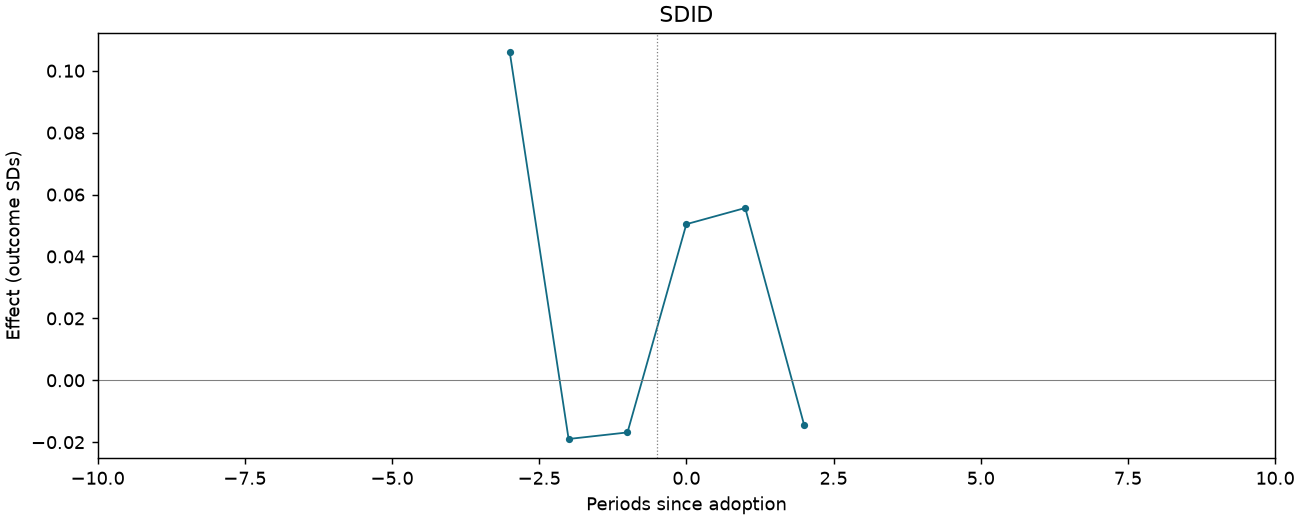
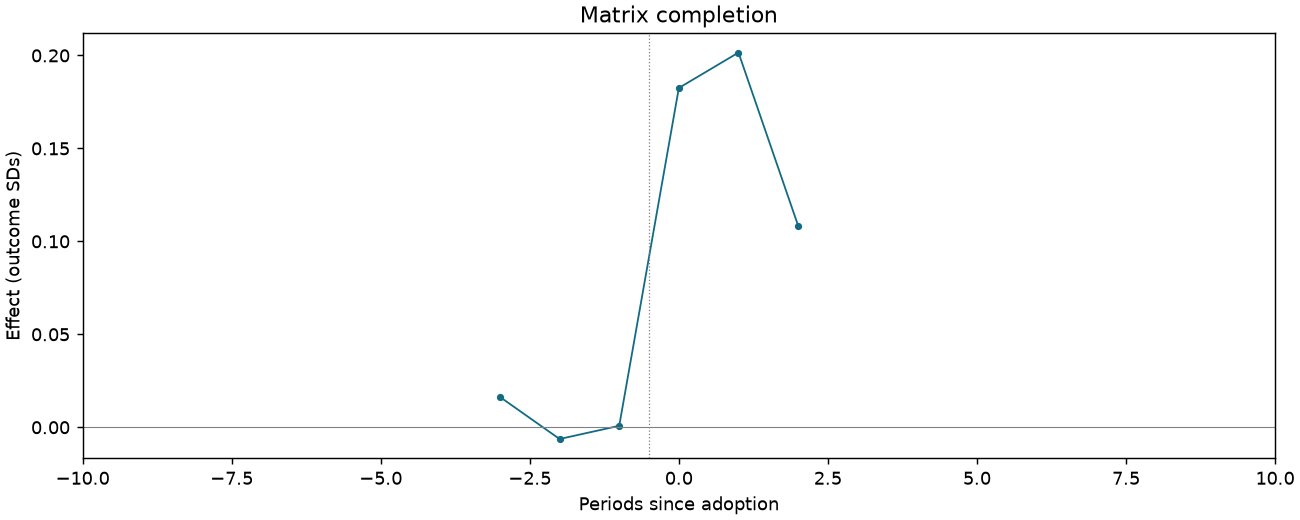
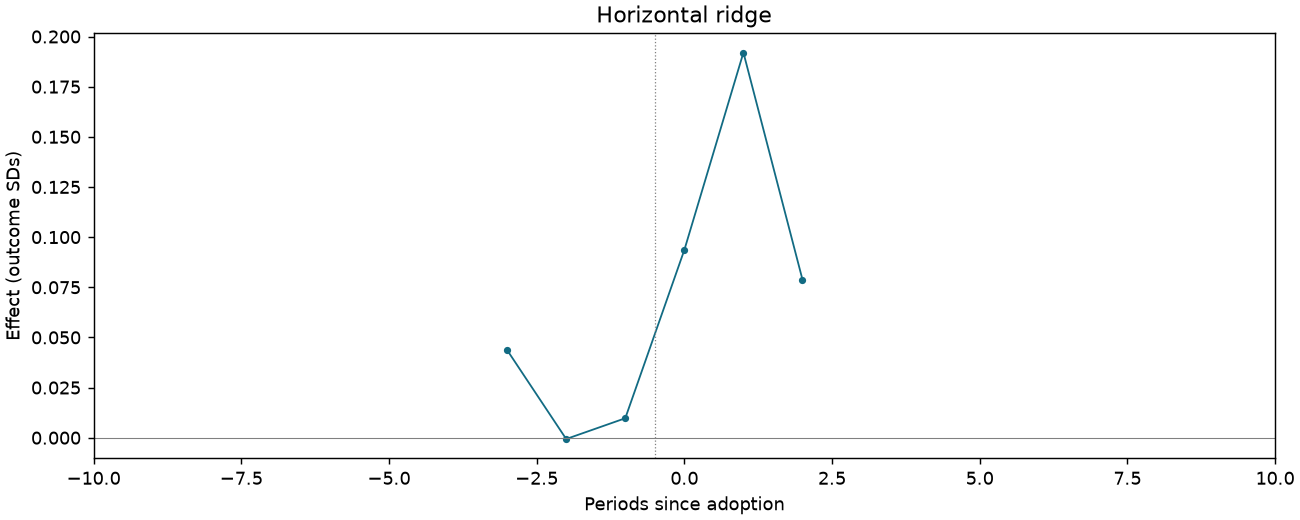
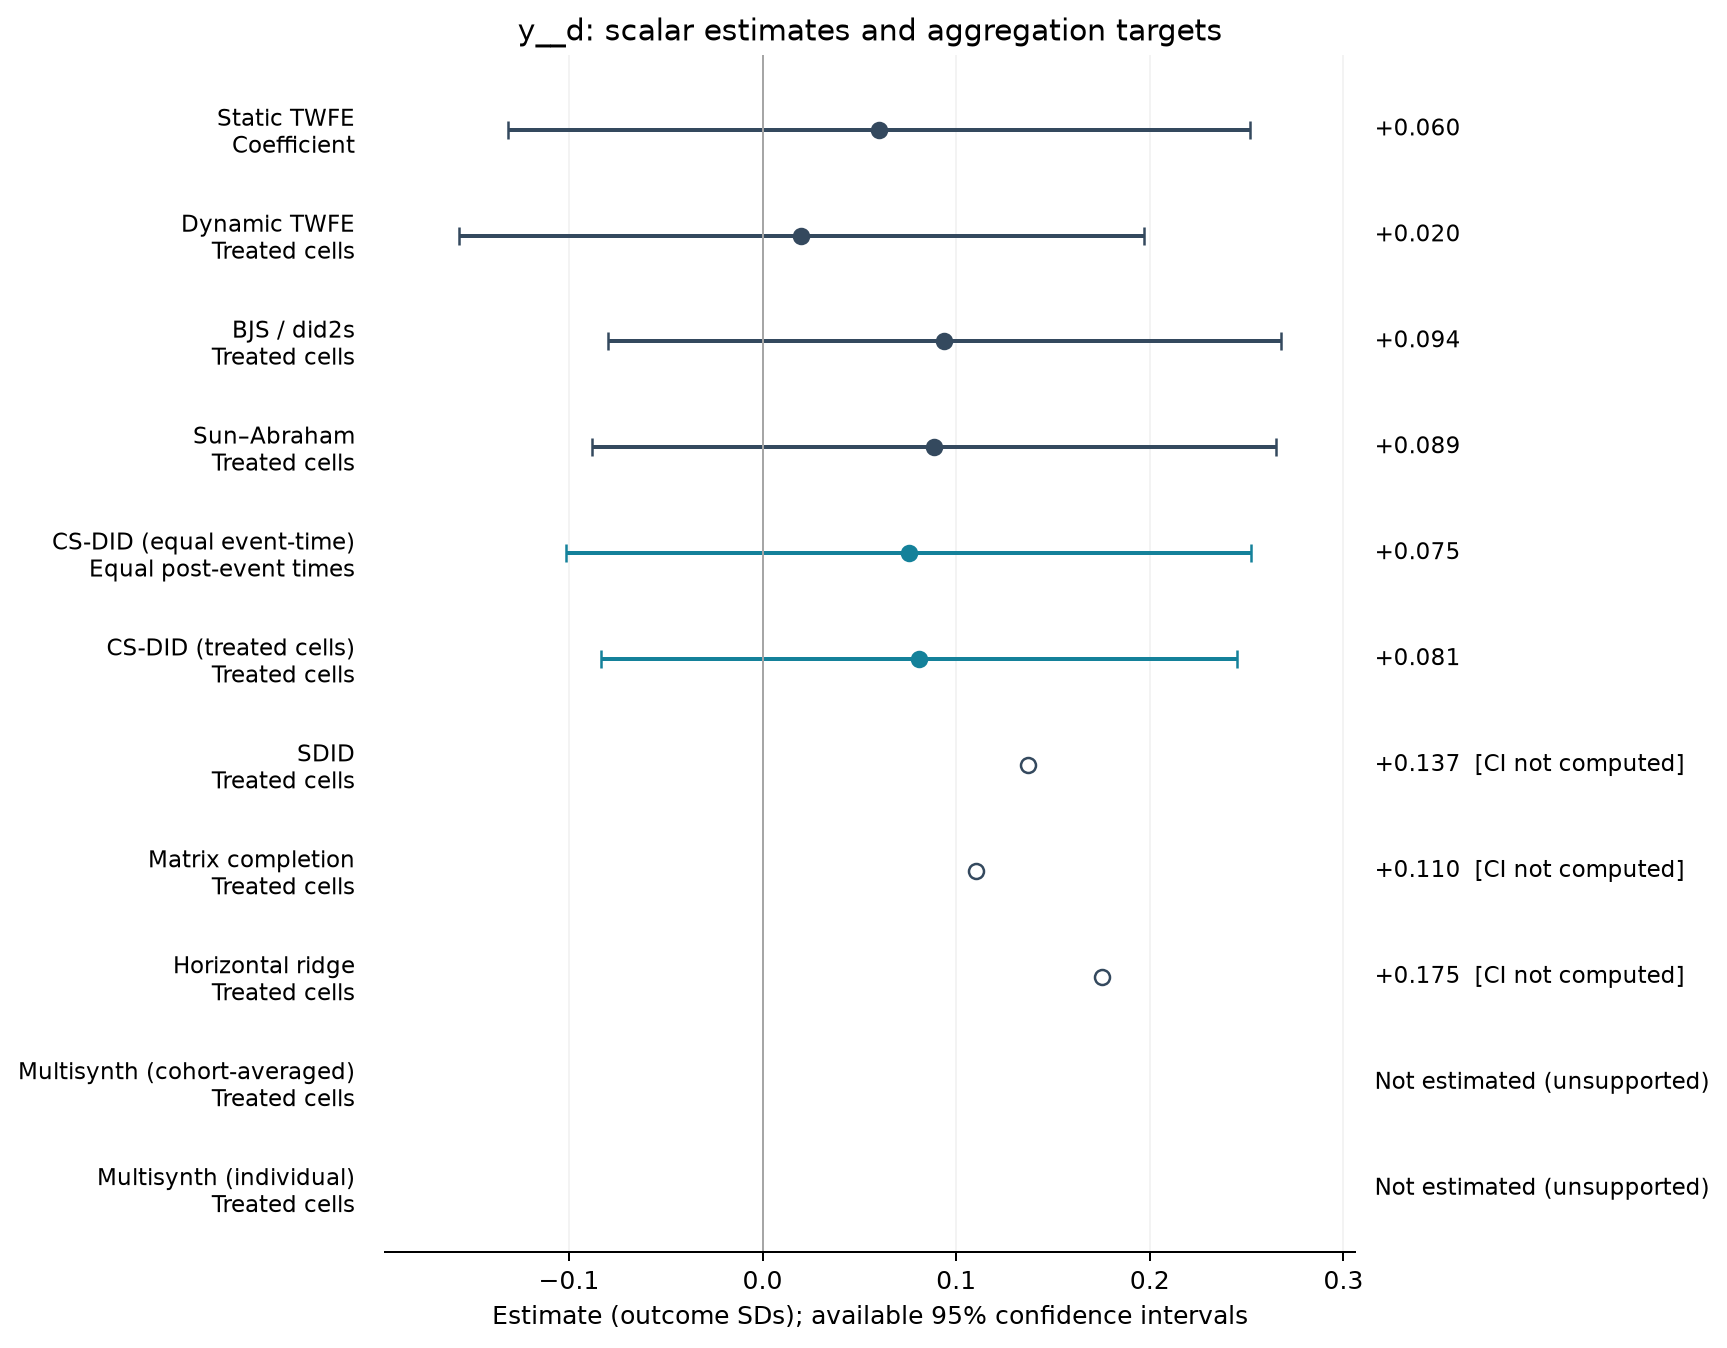
Bribes are not necessary: education [Table 3 original scale]
1,091 observations · 19 units · 19 clusters · 13 treated / 6 control units.
Estimate comparison
| Estimator | Estimate (SDs) | SE | 95% CI | Averaging |
|---|---|---|---|---|
| Static TWFE | 0.060 | 0.091 | [-0.131, 0.252] | Coefficient |
| Dynamic TWFE | 0.020 | 0.084 | [-0.157, 0.197] | Treated cells |
| BJS / did2s | 0.094 | 0.083 | [-0.080, 0.268] | Treated cells |
| Sun–Abraham | 0.089 | 0.084 | [-0.088, 0.265] | Treated cells |
| CS-DID (equal event-time) | 0.075 | 0.090 | [-0.101, 0.252] | Equal post-event times |
| CS-DID (treated cells) | 0.081 | 0.084 | [-0.083, 0.245] | Treated cells |
| SDID | 0.137 | — | — | Treated cells |
| Matrix completion | 0.110 | — | — | Treated cells |
| Horizontal ridge | 0.175 | — | — | Treated cells |
Event studies
Periods −10 to +10; pointwise 95% intervals where available.
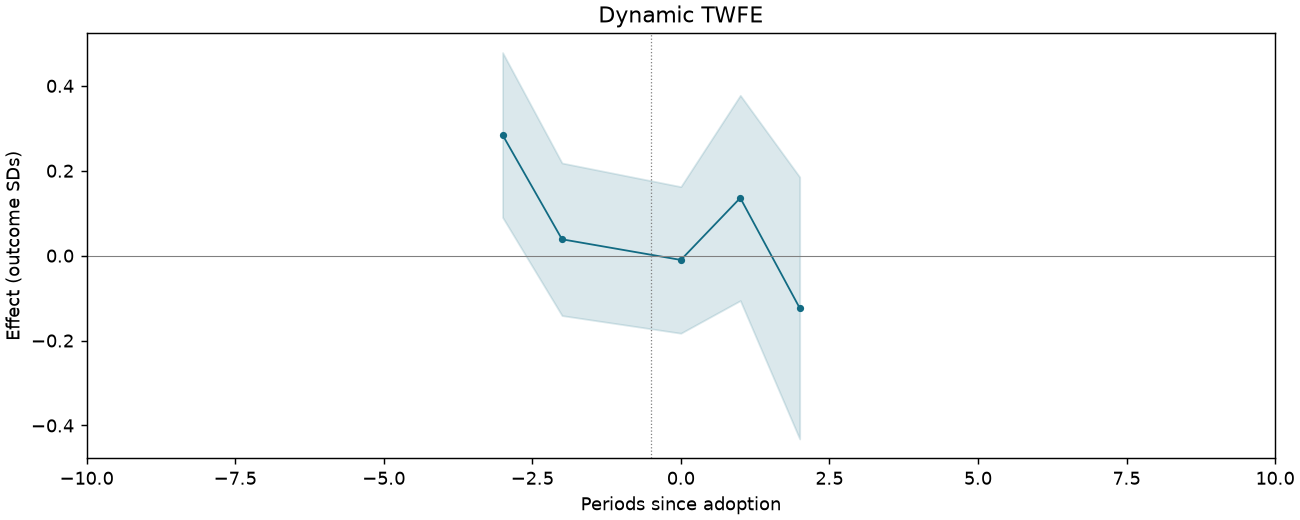
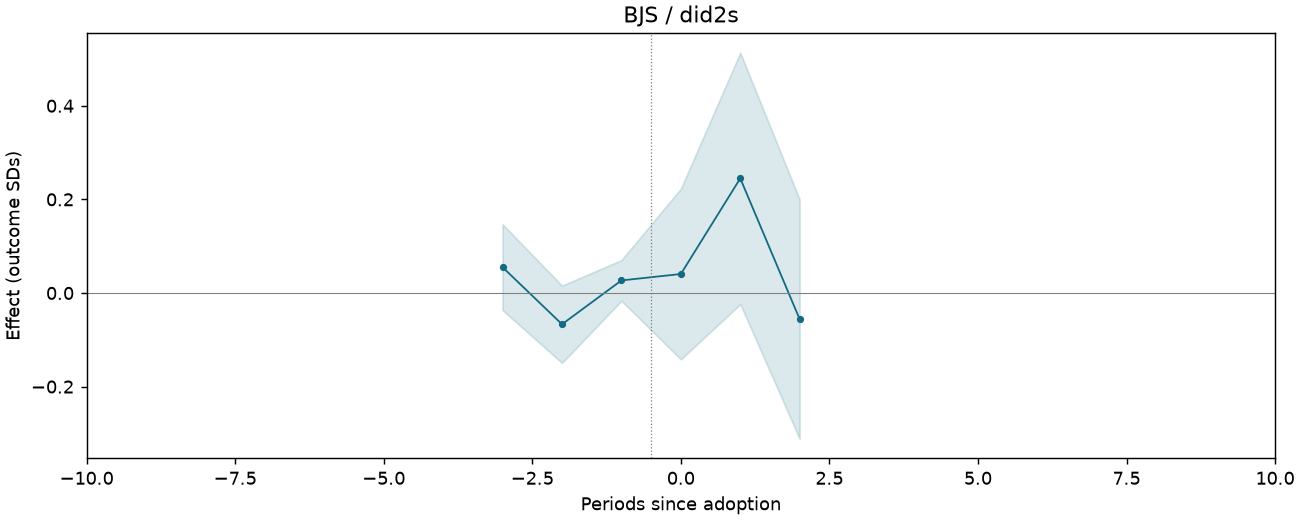
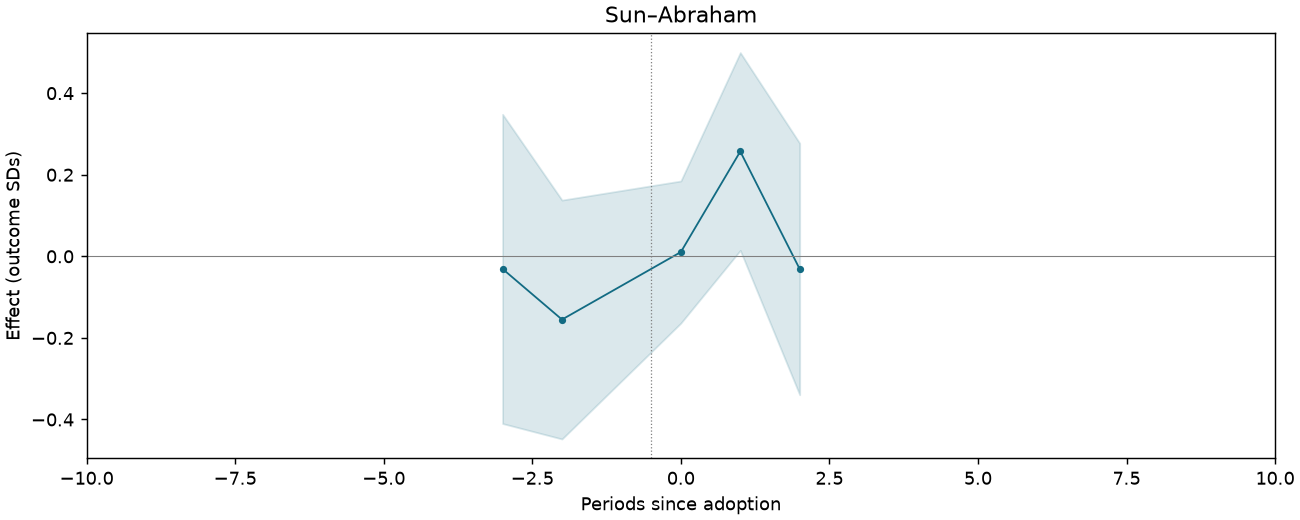
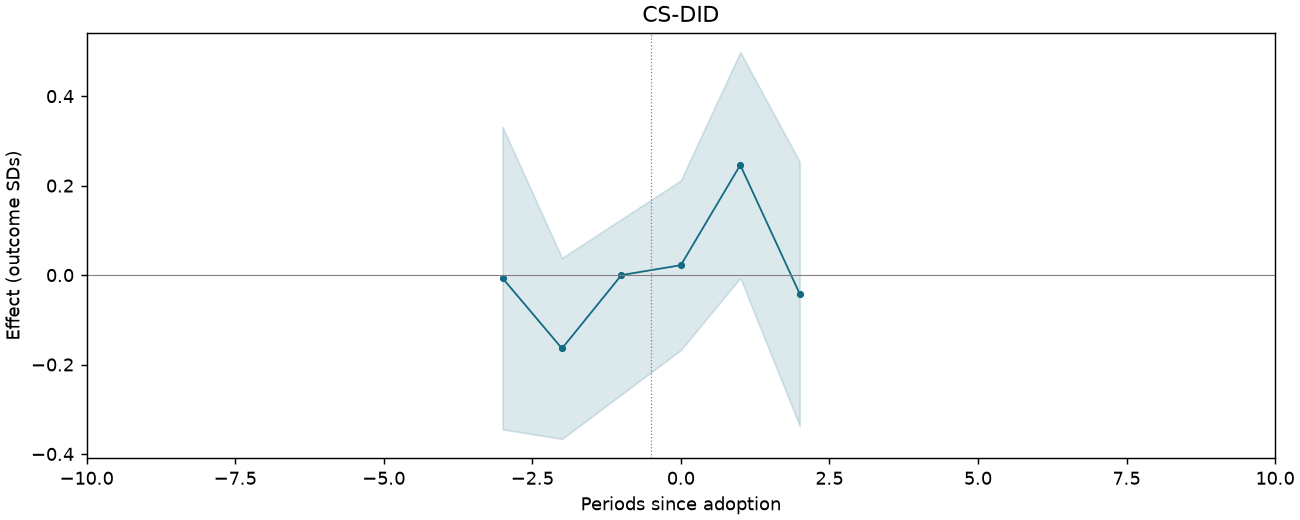
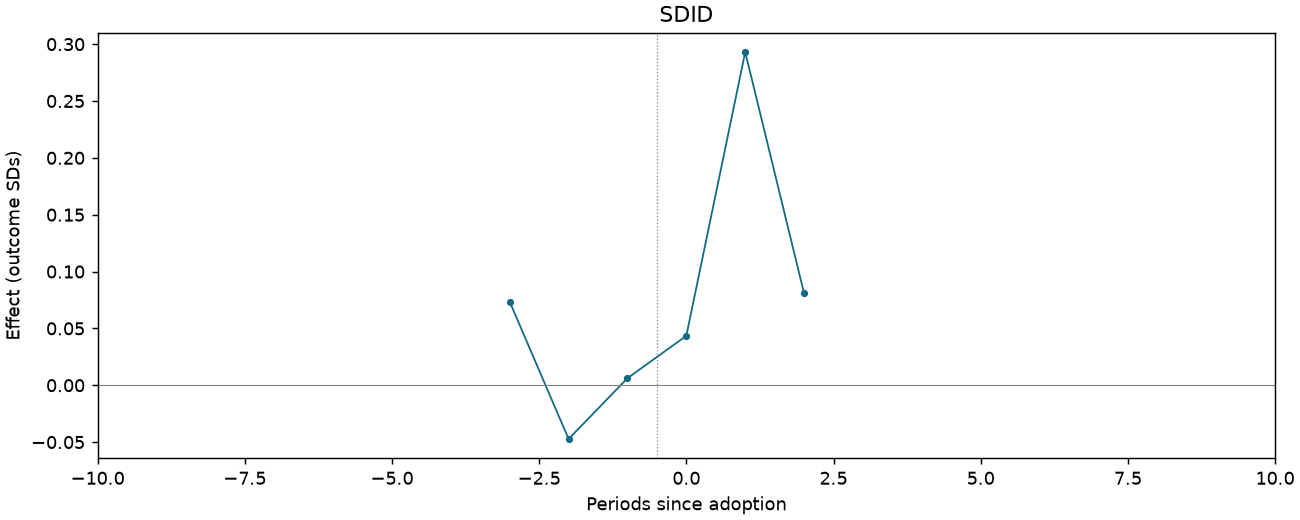
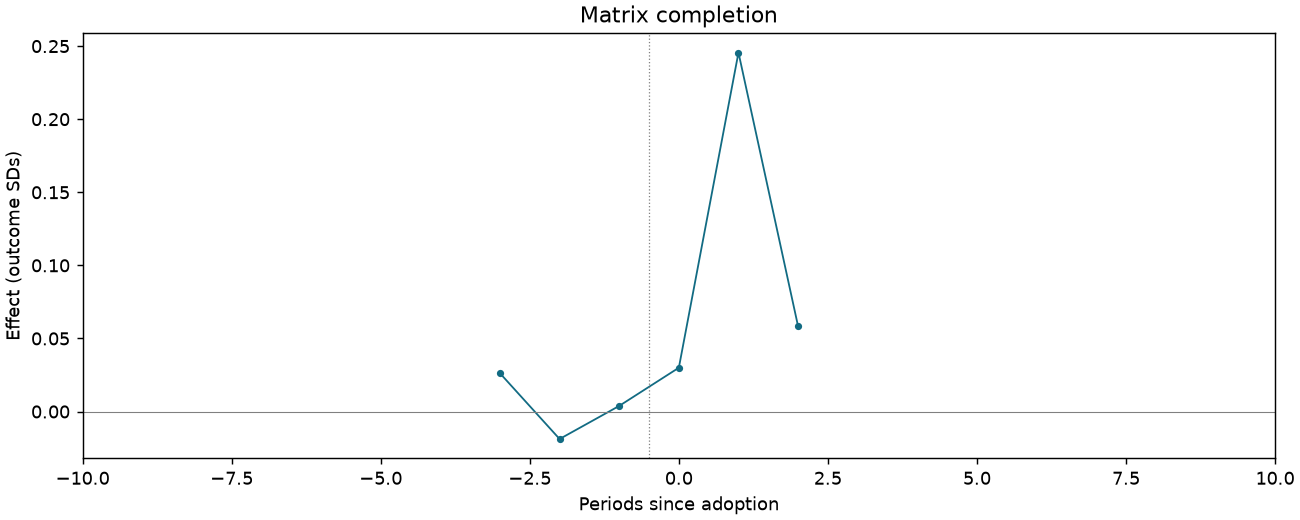
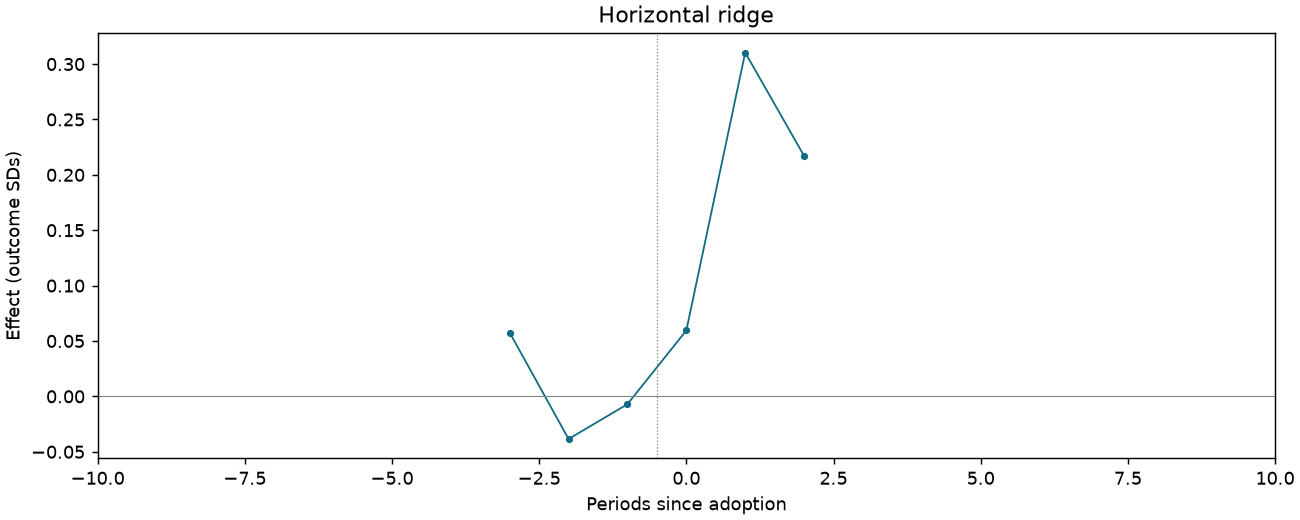
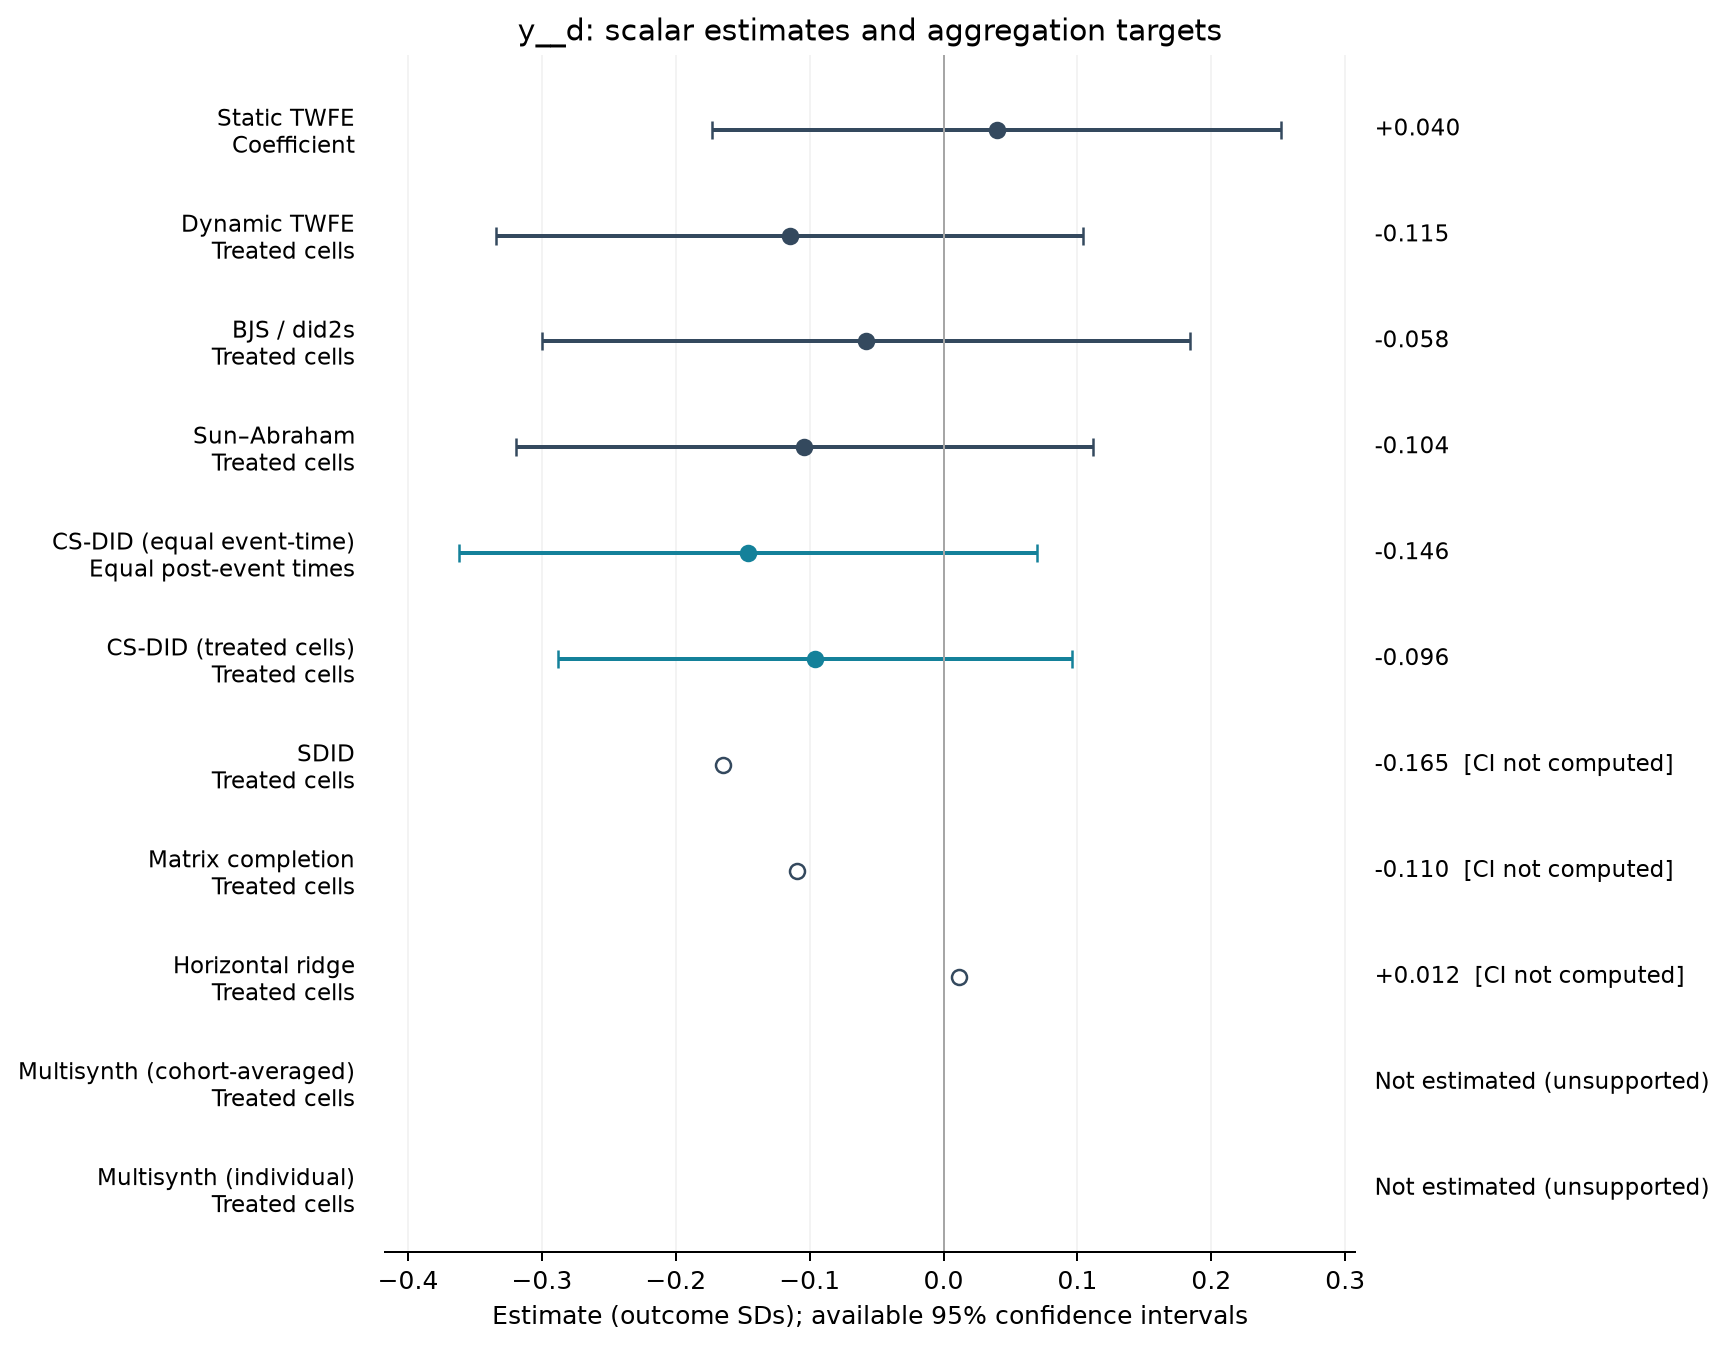
Bribes are not necessary: doctors [Table 3 original scale]
1,091 observations · 19 units · 19 clusters · 13 treated / 6 control units.
Estimate comparison
| Estimator | Estimate (SDs) | SE | 95% CI | Averaging |
|---|---|---|---|---|
| Static TWFE | 0.040 | 0.101 | [-0.173, 0.252] | Coefficient |
| Dynamic TWFE | -0.115 | 0.104 | [-0.334, 0.104] | Treated cells |
| BJS / did2s | -0.058 | 0.115 | [-0.300, 0.184] | Treated cells |
| Sun–Abraham | -0.104 | 0.103 | [-0.319, 0.111] | Treated cells |
| CS-DID (equal event-time) | -0.146 | 0.110 | [-0.362, 0.069] | Equal post-event times |
| CS-DID (treated cells) | -0.096 | 0.098 | [-0.288, 0.096] | Treated cells |
| SDID | -0.165 | — | — | Treated cells |
| Matrix completion | -0.110 | — | — | Treated cells |
| Horizontal ridge | 0.012 | — | — | Treated cells |
Event studies
Periods −10 to +10; pointwise 95% intervals where available.
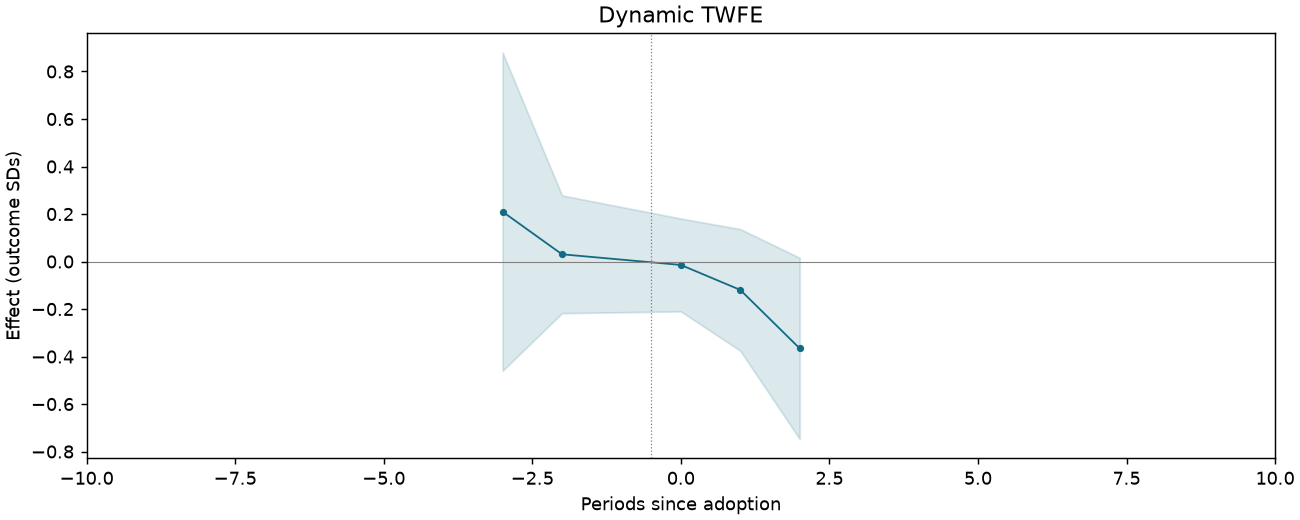
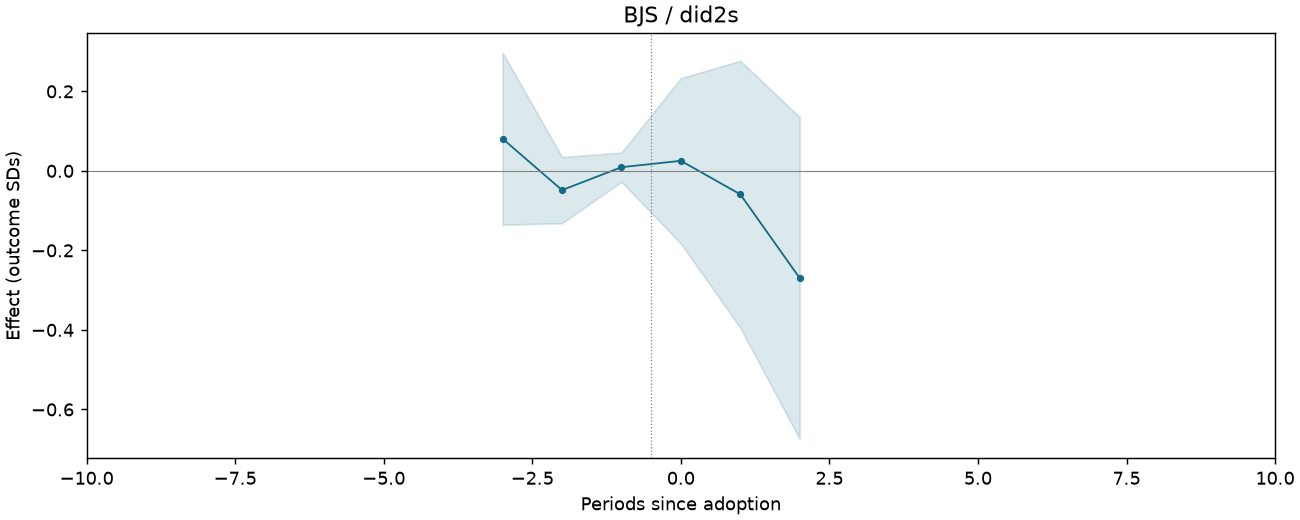
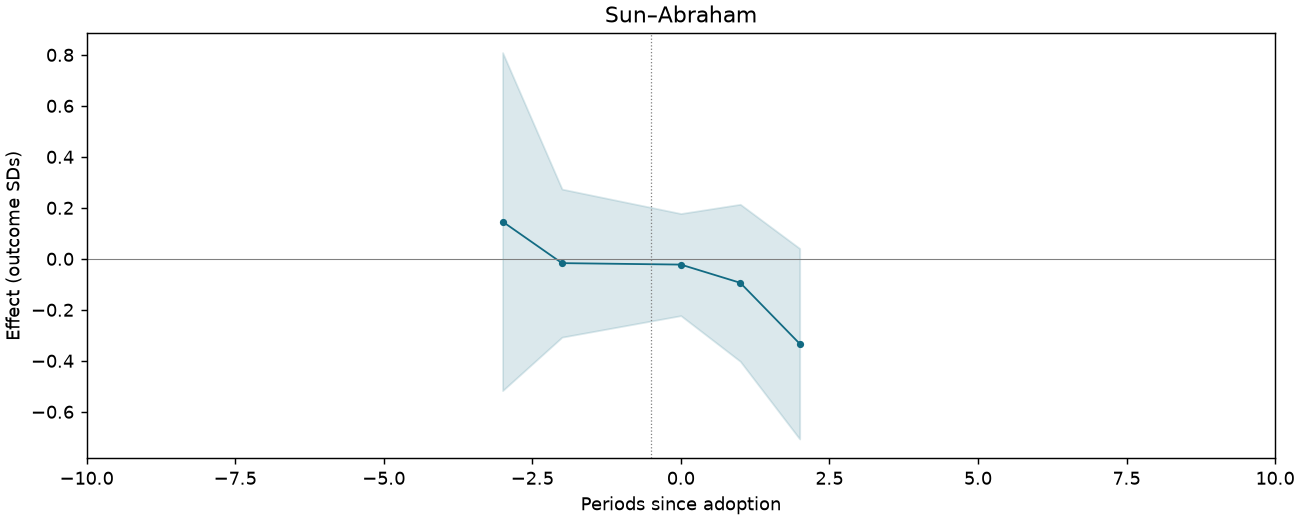
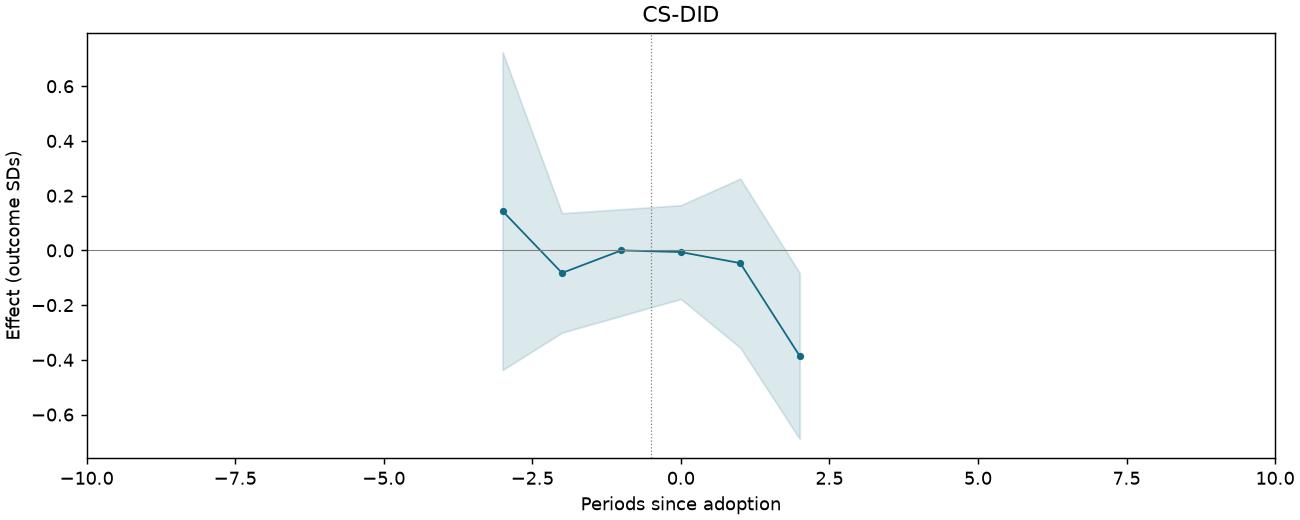
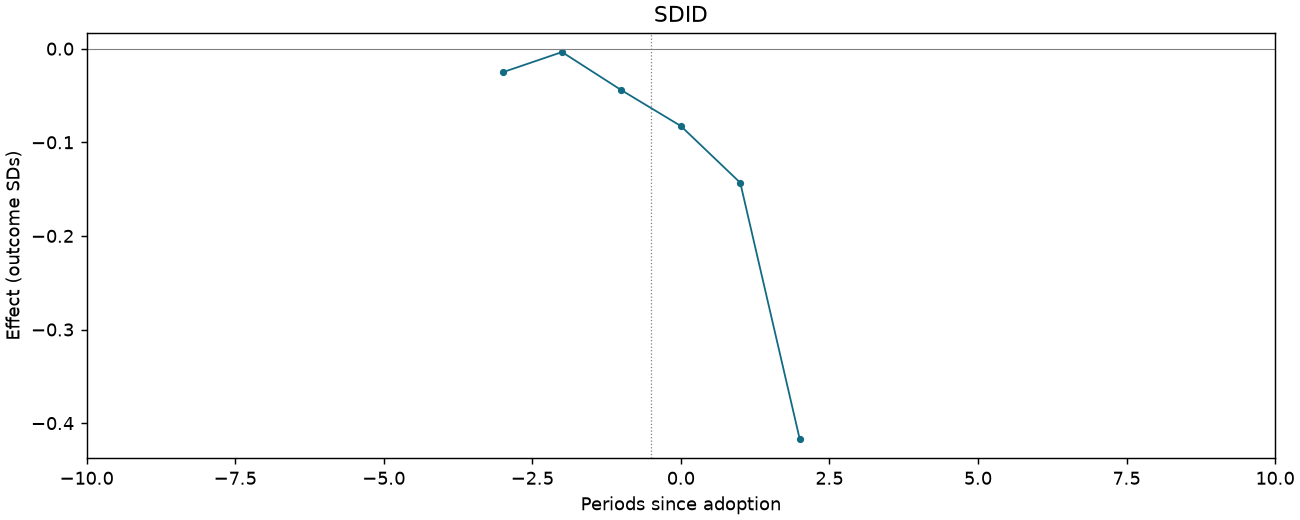
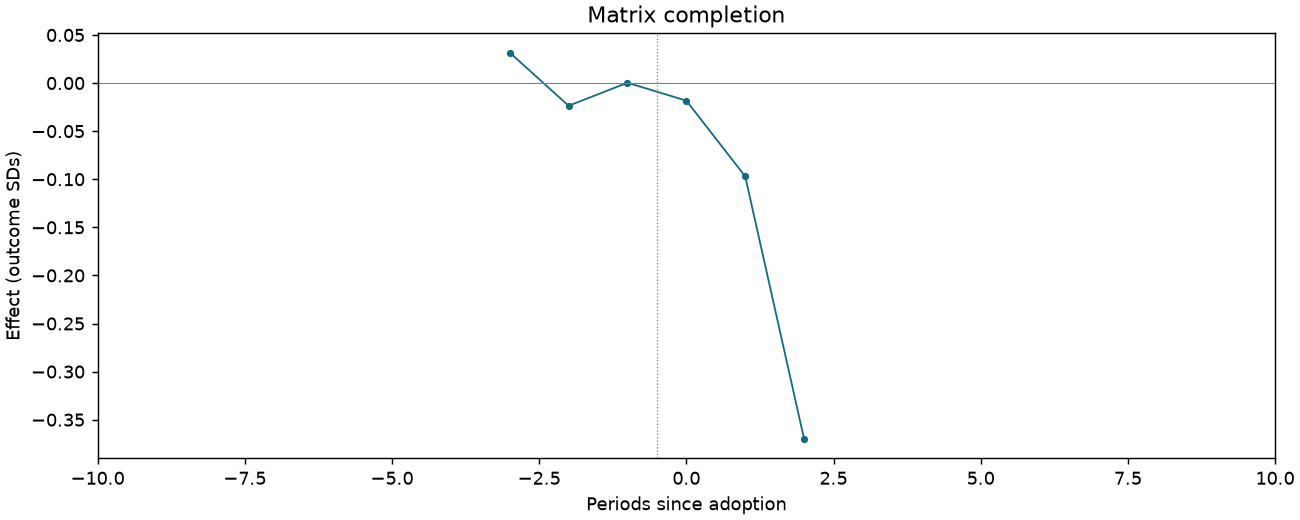
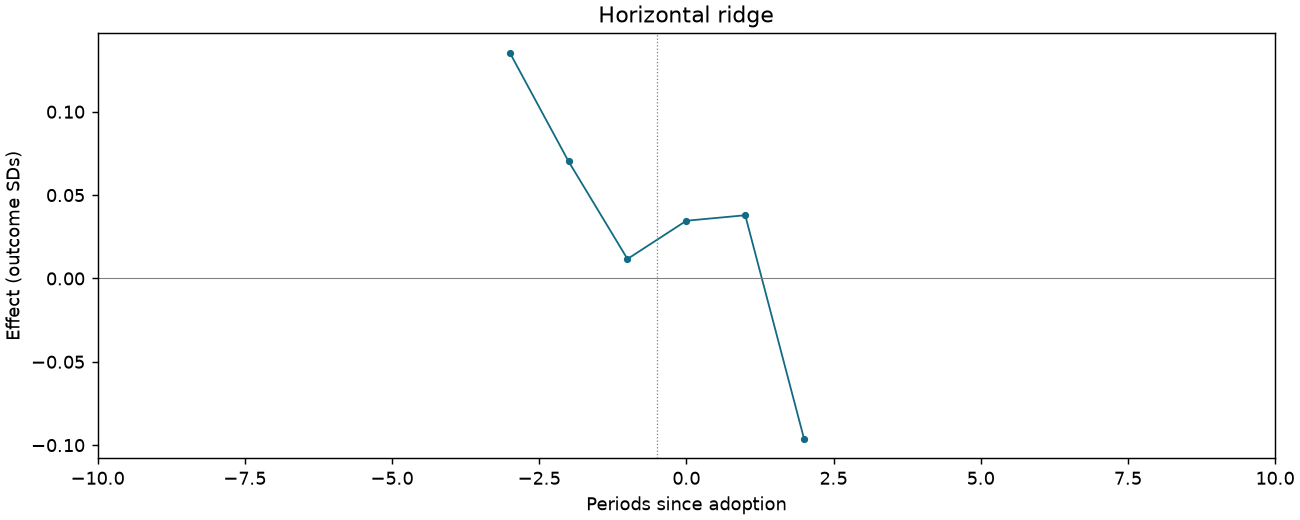
Bribes are not acceptable [Table 3 original scale]
1,090 observations · 19 units · 19 clusters · 13 treated / 6 control units.
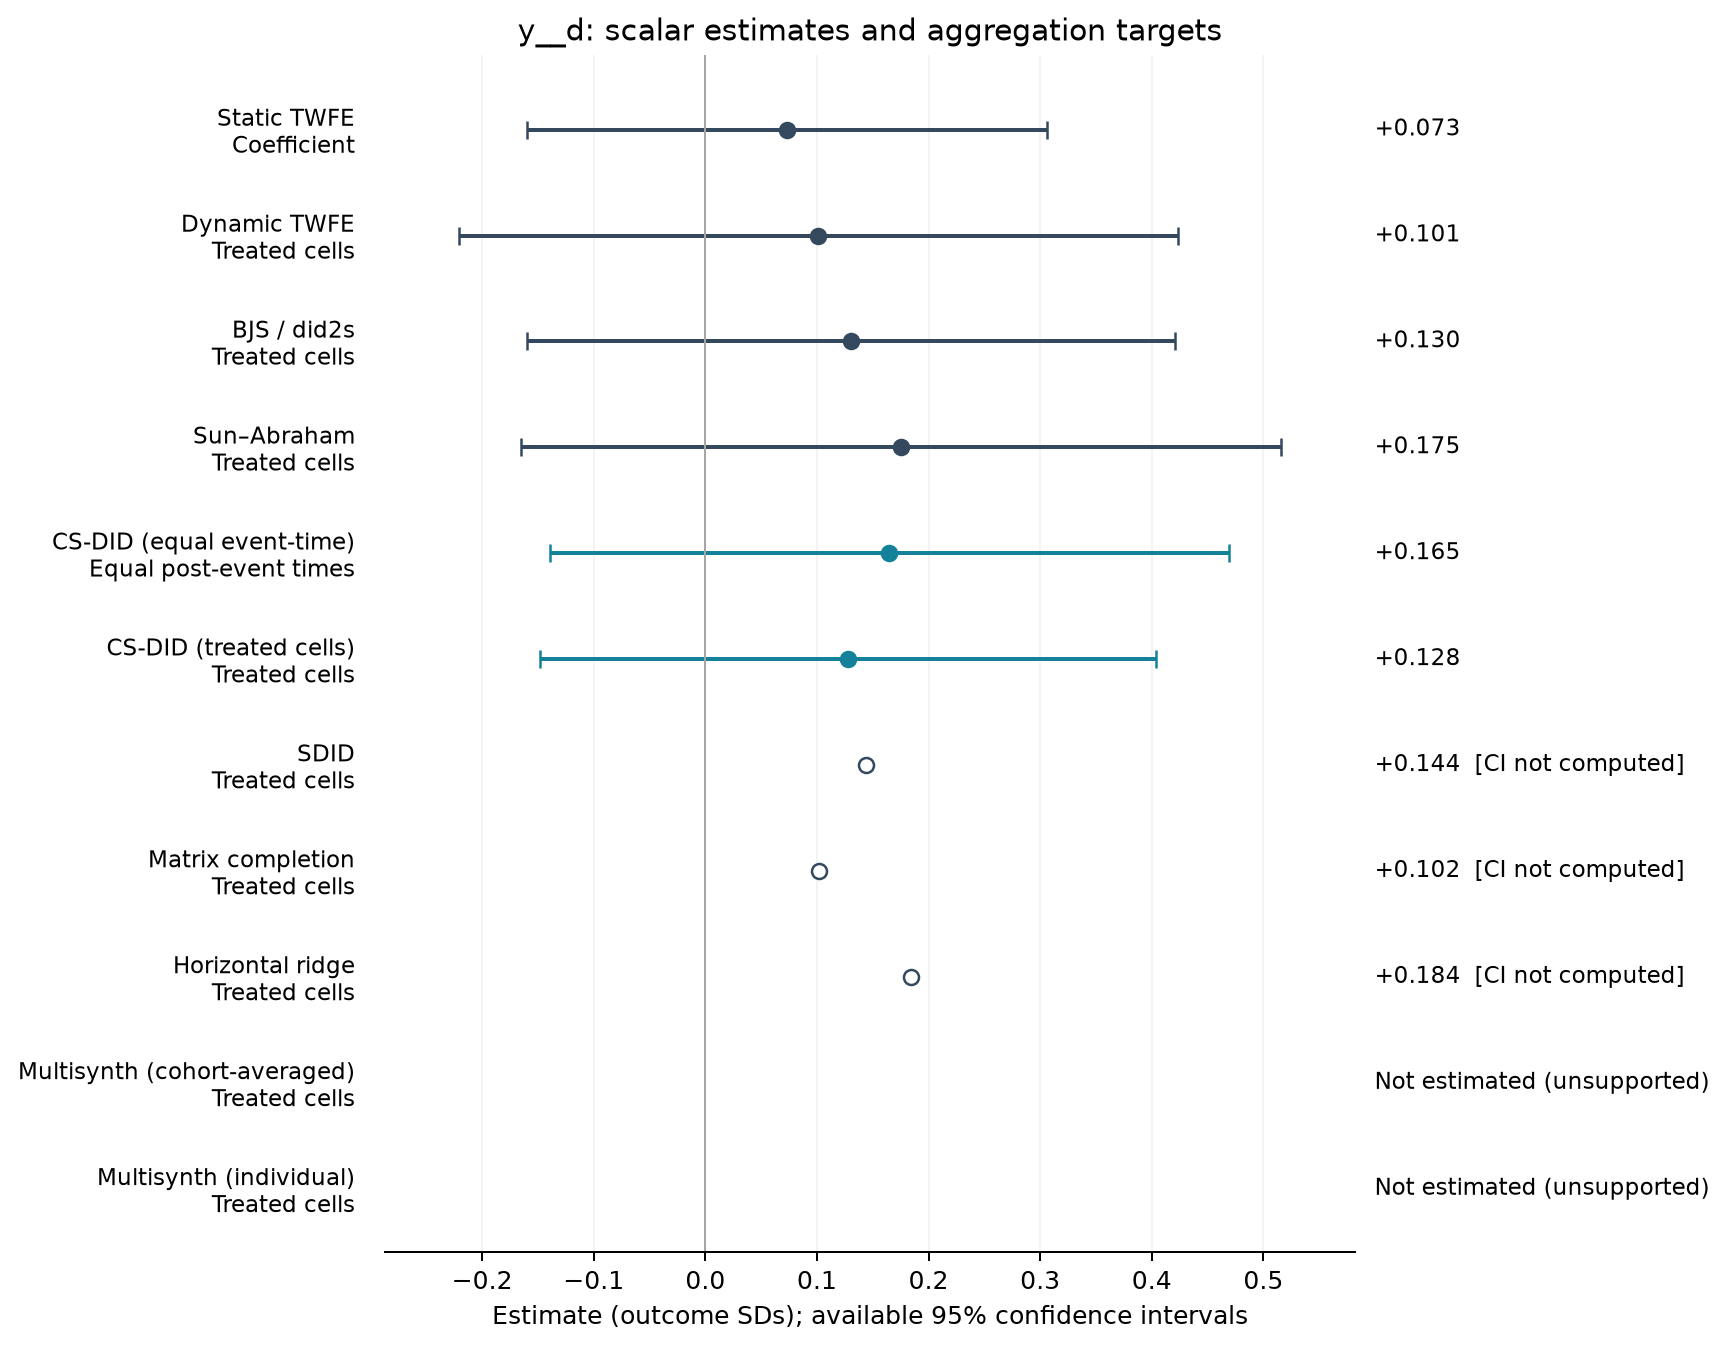
Estimate comparison
| Estimator | Estimate (SDs) | SE | 95% CI | Averaging |
|---|---|---|---|---|
| Static TWFE | 0.073 | 0.111 | [-0.160, 0.306] | Coefficient |
| Dynamic TWFE | 0.101 | 0.153 | [-0.221, 0.423] | Treated cells |
| BJS / did2s | 0.130 | 0.138 | [-0.160, 0.421] | Treated cells |
| Sun–Abraham | 0.175 | 0.162 | [-0.165, 0.516] | Treated cells |
| CS-DID (equal event-time) | 0.165 | 0.155 | [-0.139, 0.469] | Equal post-event times |
| CS-DID (treated cells) | 0.128 | 0.141 | [-0.148, 0.404] | Treated cells |
| SDID | 0.144 | — | — | Treated cells |
| Matrix completion | 0.102 | — | — | Treated cells |
| Horizontal ridge | 0.184 | — | — | Treated cells |
Event studies
Periods −10 to +10; pointwise 95% intervals where available.
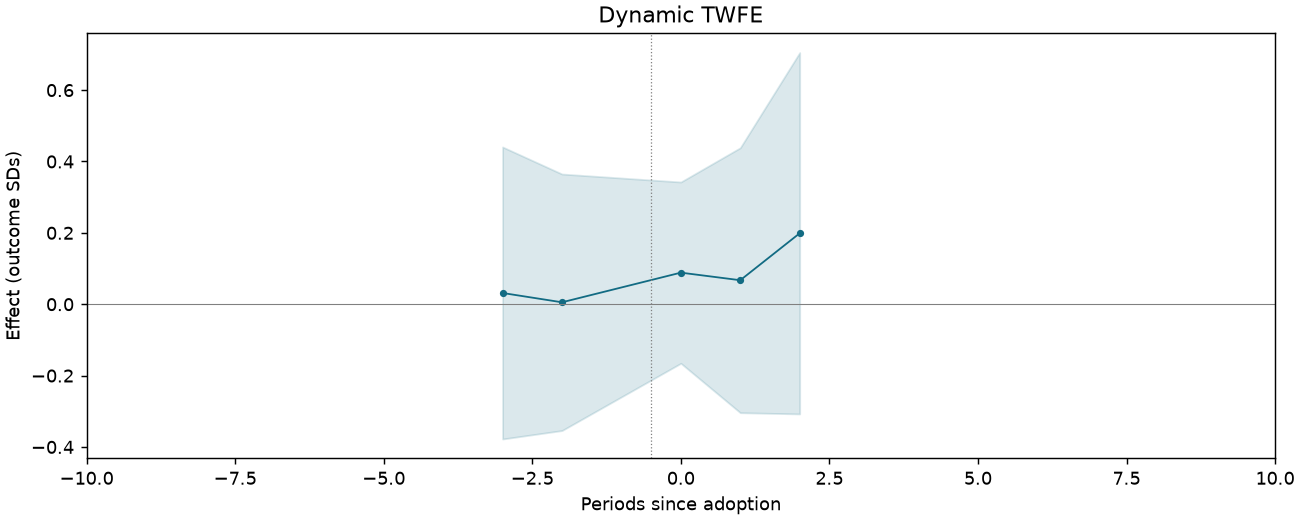
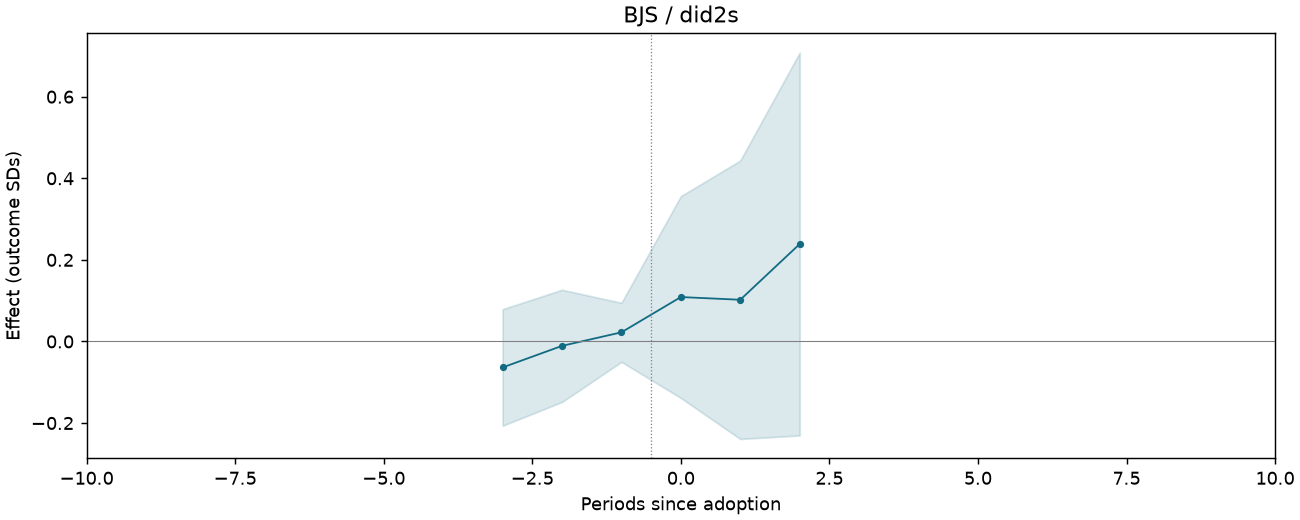
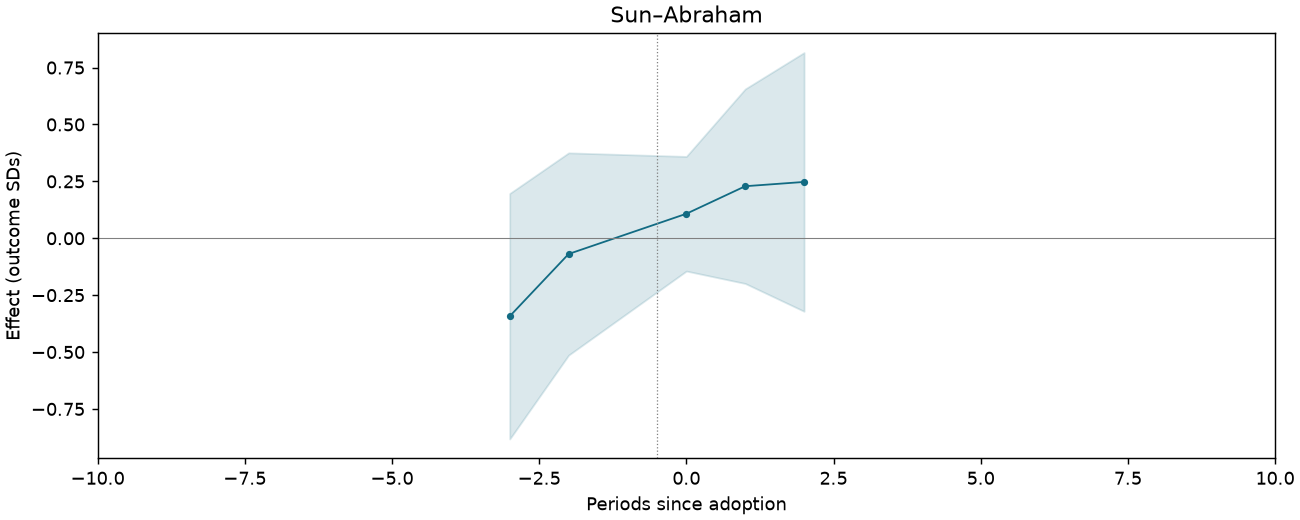
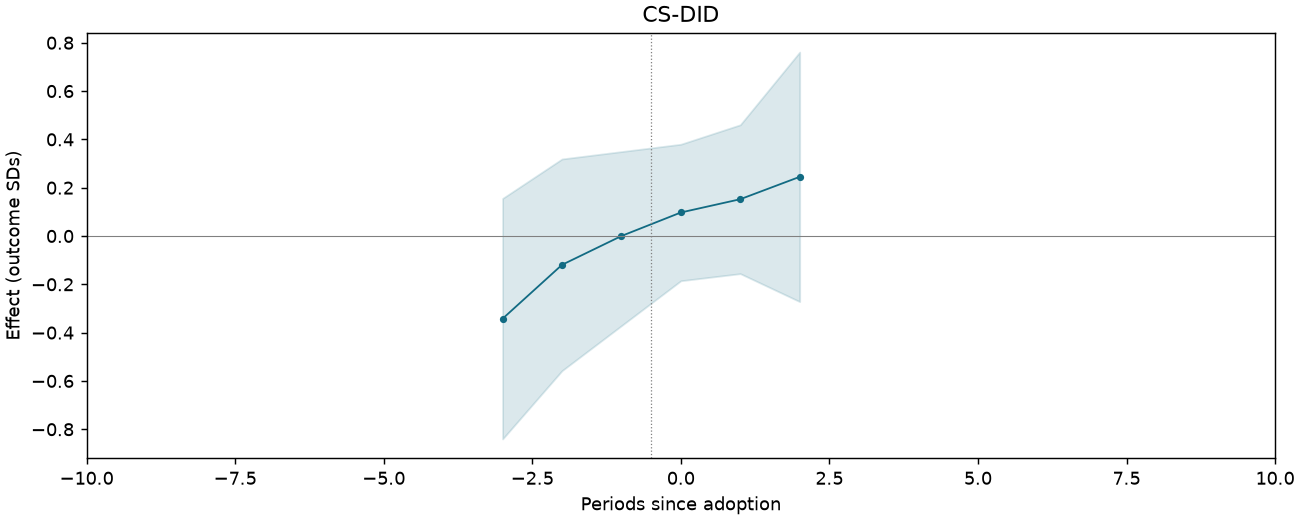
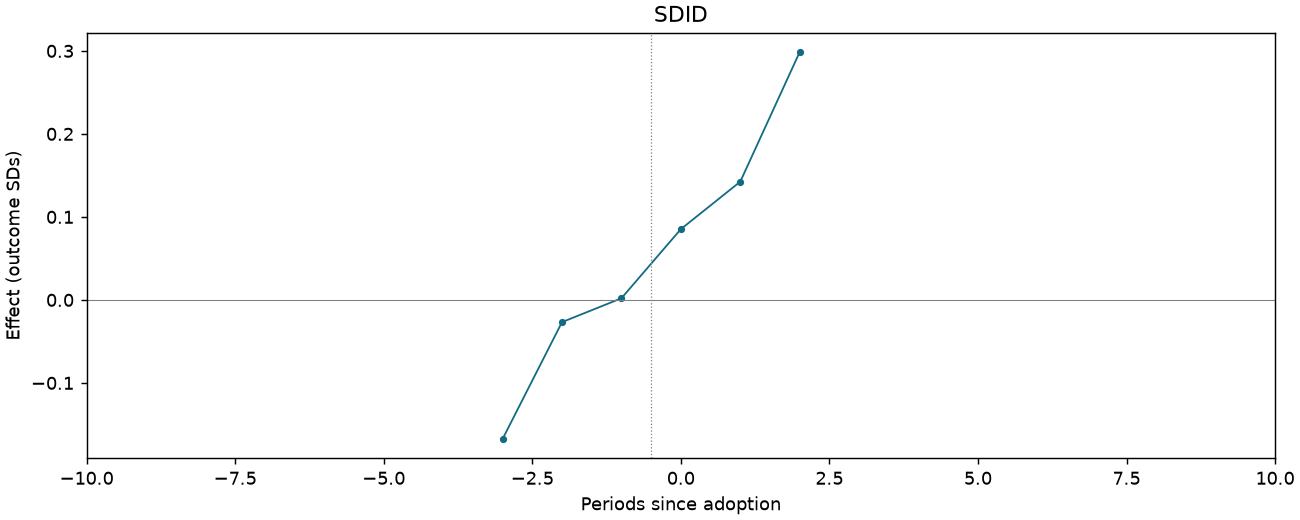
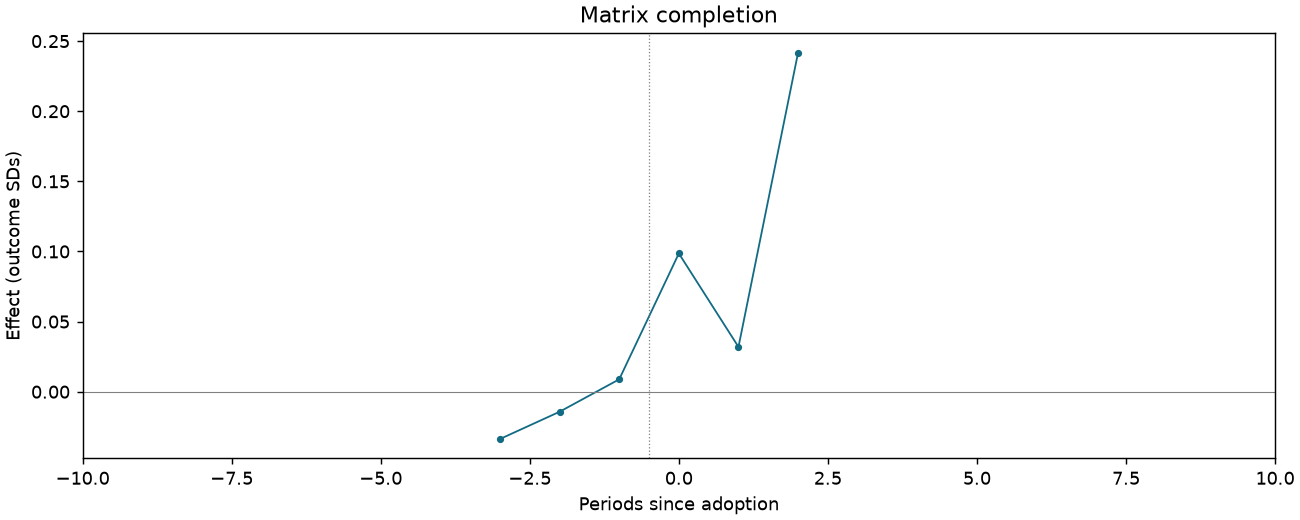
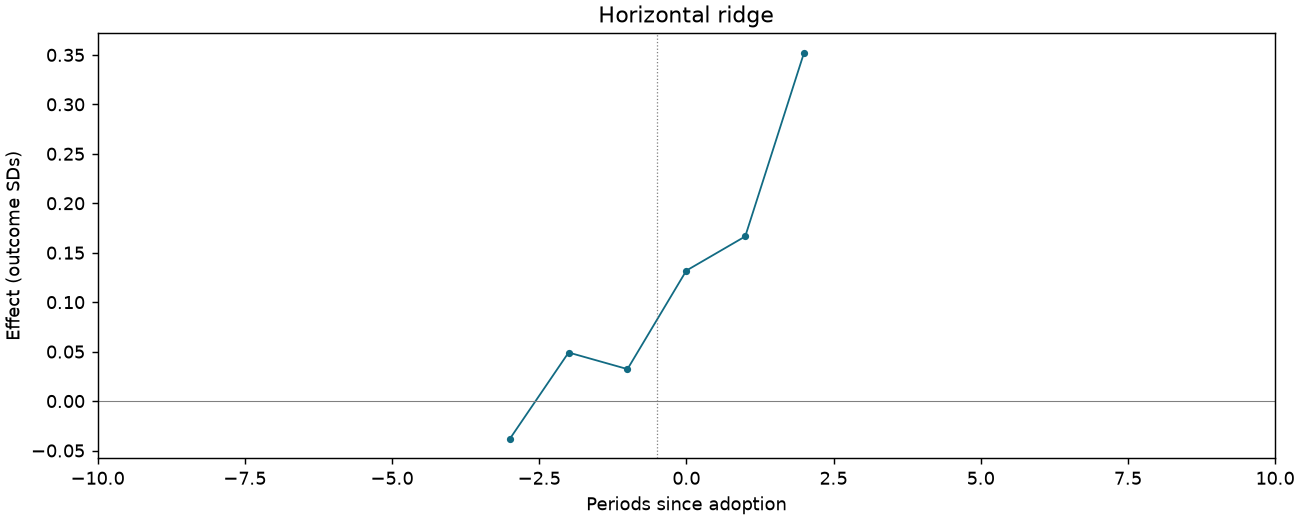
Bribes are not effective [Table 3 original scale]
1,091 observations · 19 units · 19 clusters · 13 treated / 6 control units.
Estimate comparison
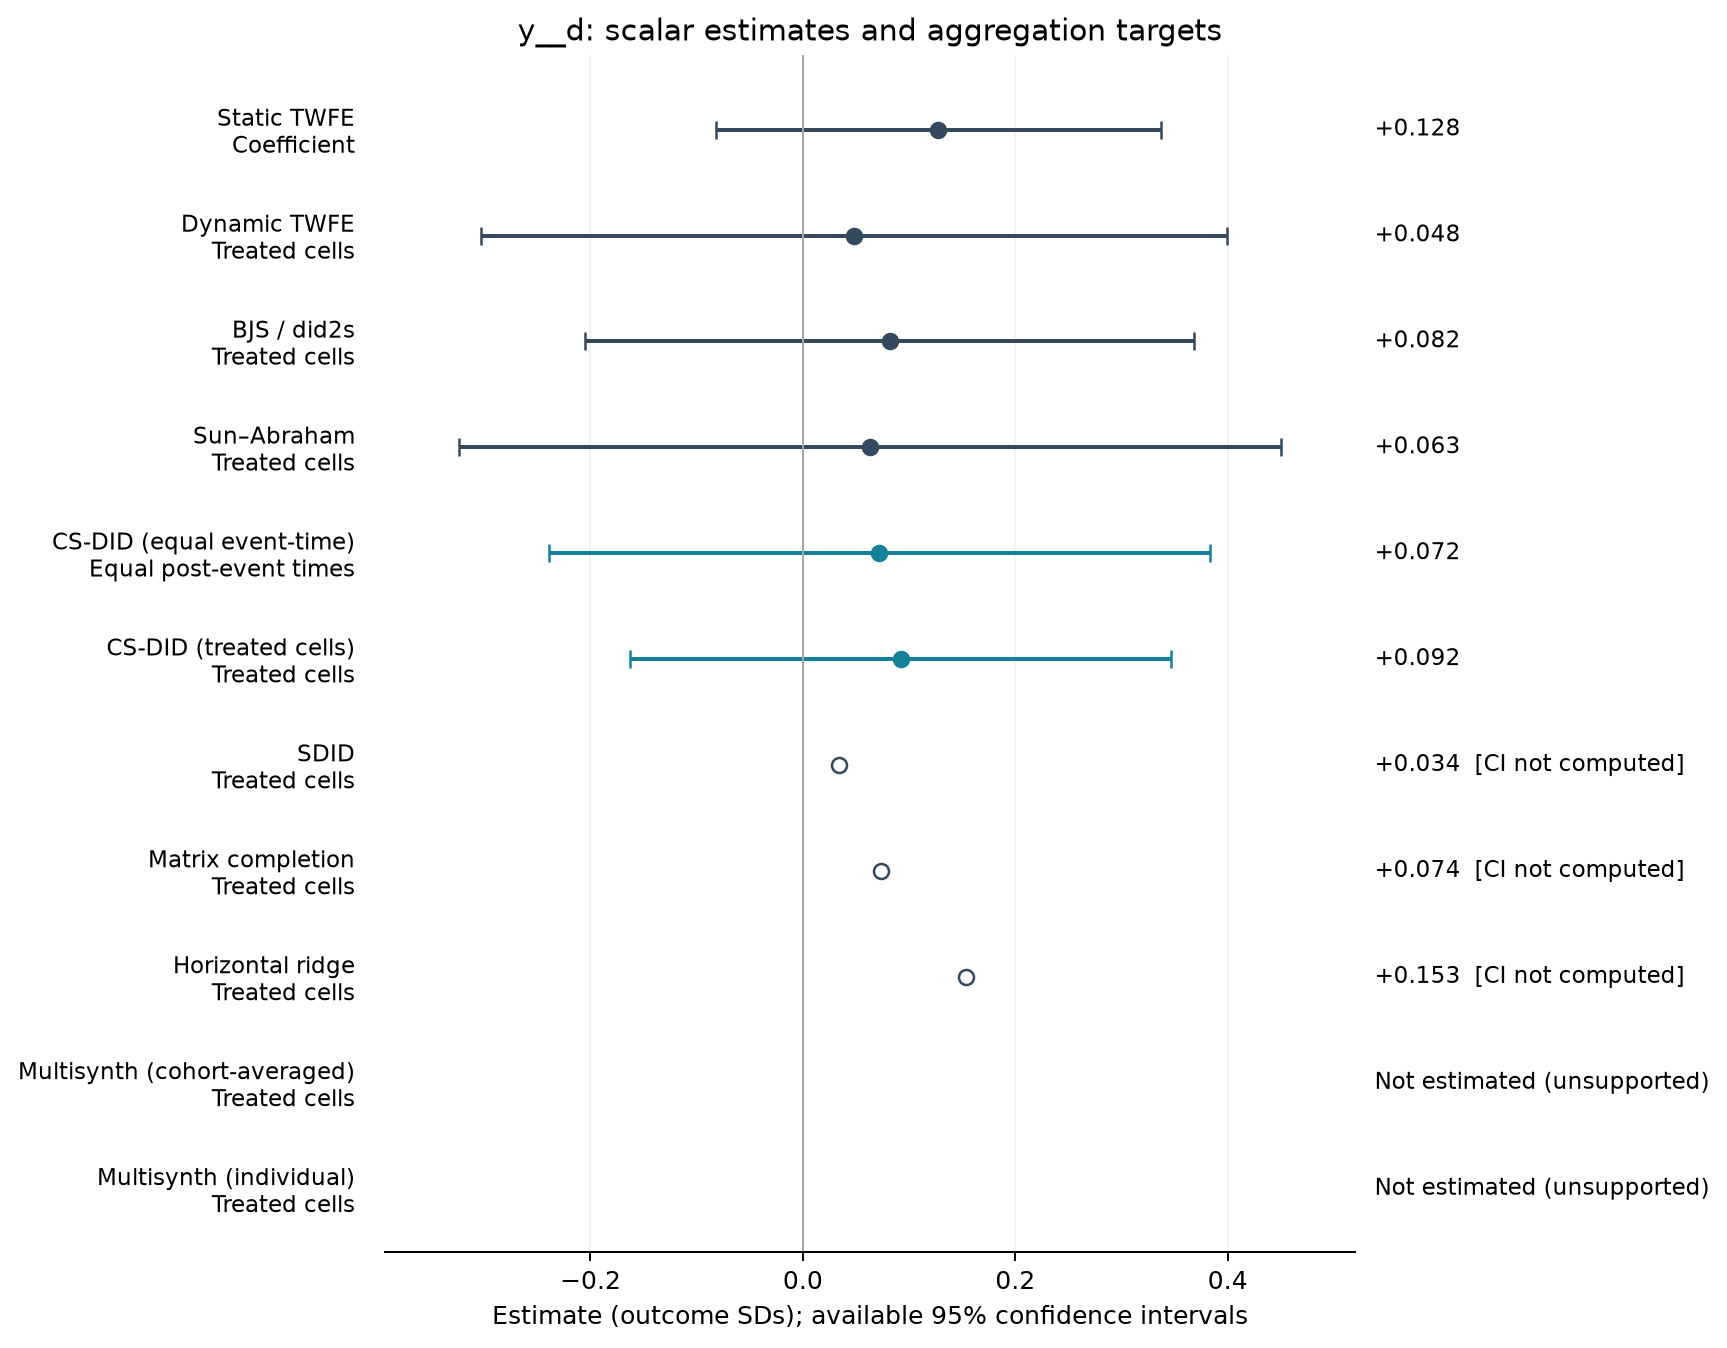
| Estimator | Estimate (SDs) | SE | 95% CI | Averaging |
|---|---|---|---|---|
| Static TWFE | 0.128 | 0.100 | [-0.082, 0.337] | Coefficient |
| Dynamic TWFE | 0.048 | 0.167 | [-0.303, 0.400] | Treated cells |
| BJS / did2s | 0.082 | 0.137 | [-0.205, 0.369] | Treated cells |
| Sun–Abraham | 0.063 | 0.184 | [-0.324, 0.450] | Treated cells |
| CS-DID (equal event-time) | 0.072 | 0.159 | [-0.239, 0.383] | Equal post-event times |
| CS-DID (treated cells) | 0.092 | 0.130 | [-0.163, 0.347] | Treated cells |
| SDID | 0.034 | — | — | Treated cells |
| Matrix completion | 0.074 | — | — | Treated cells |
| Horizontal ridge | 0.153 | — | — | Treated cells |
Event studies
Periods −10 to +10; pointwise 95% intervals where available.
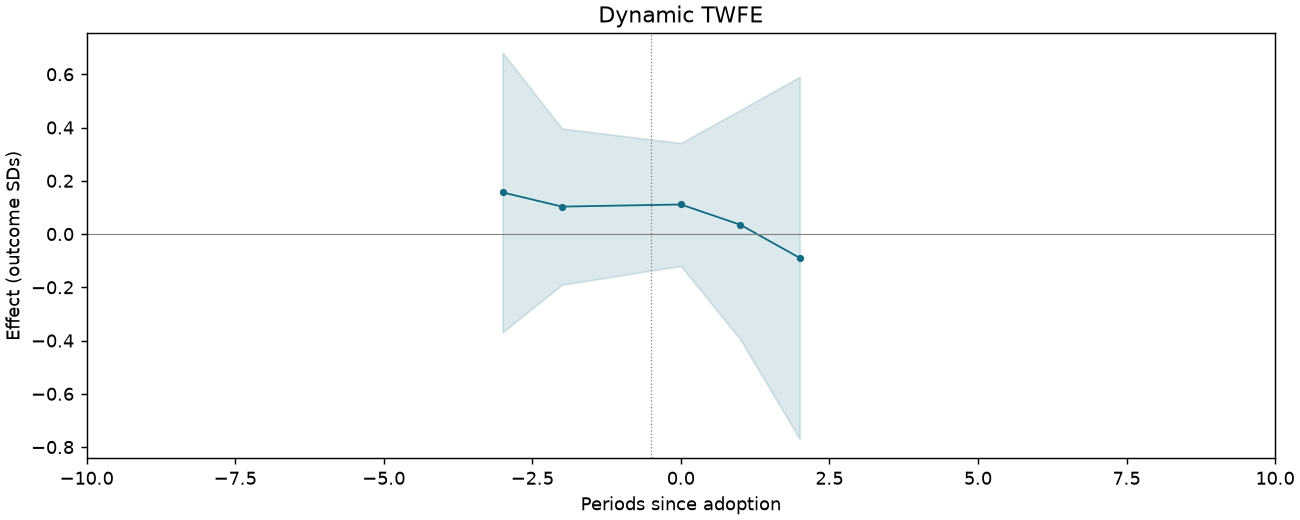
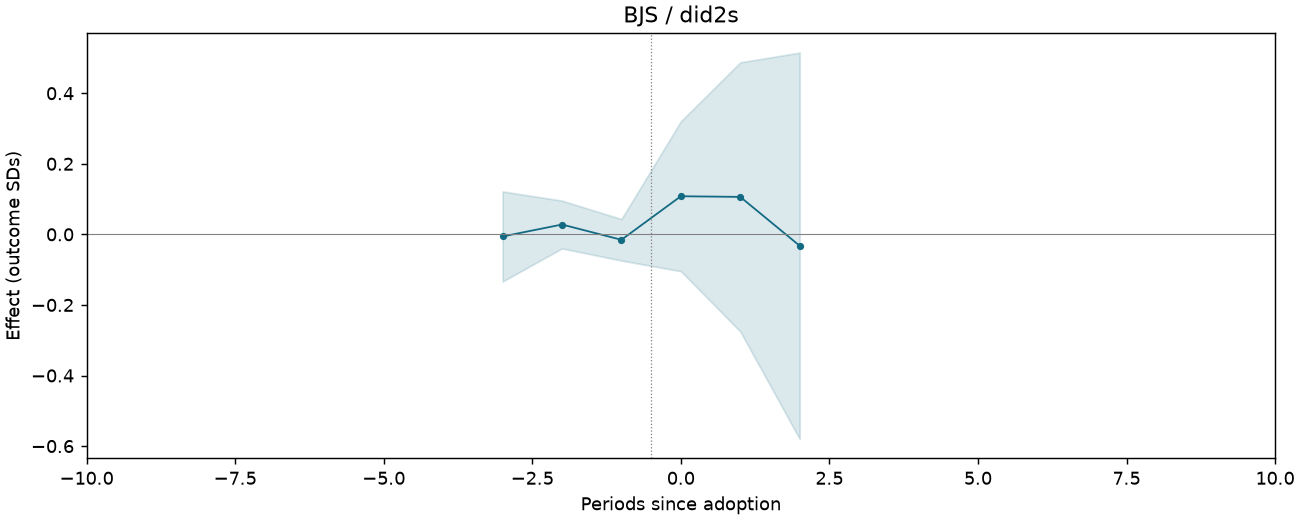
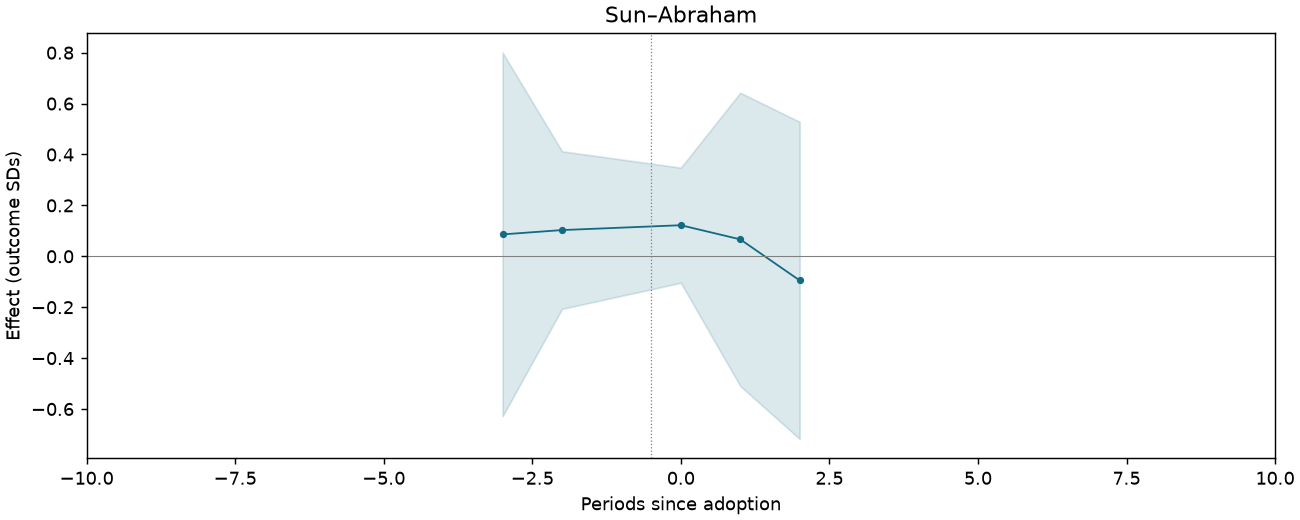
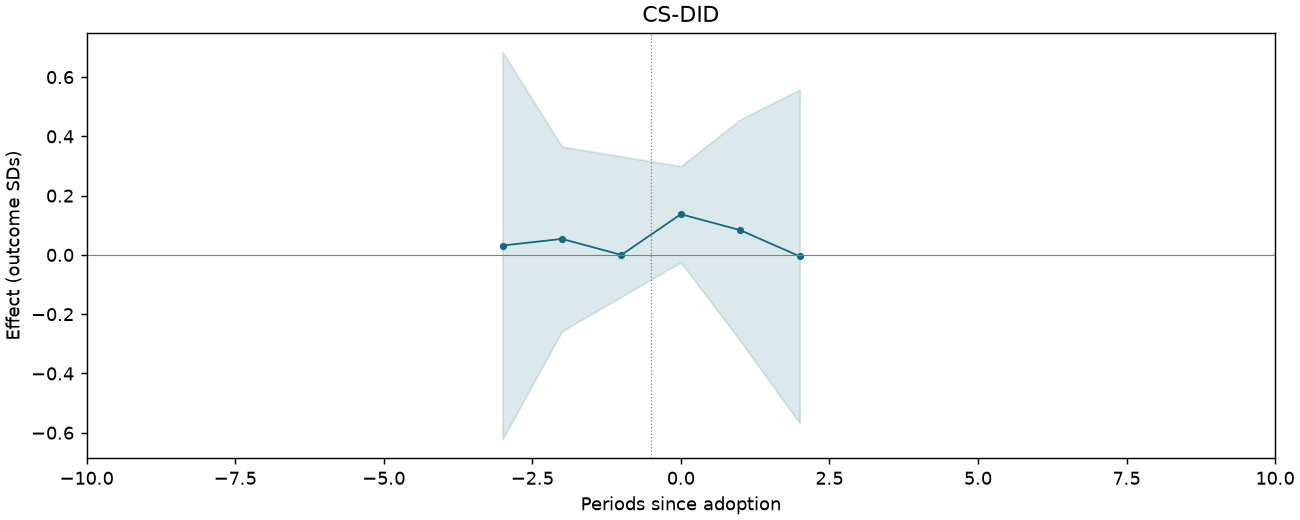
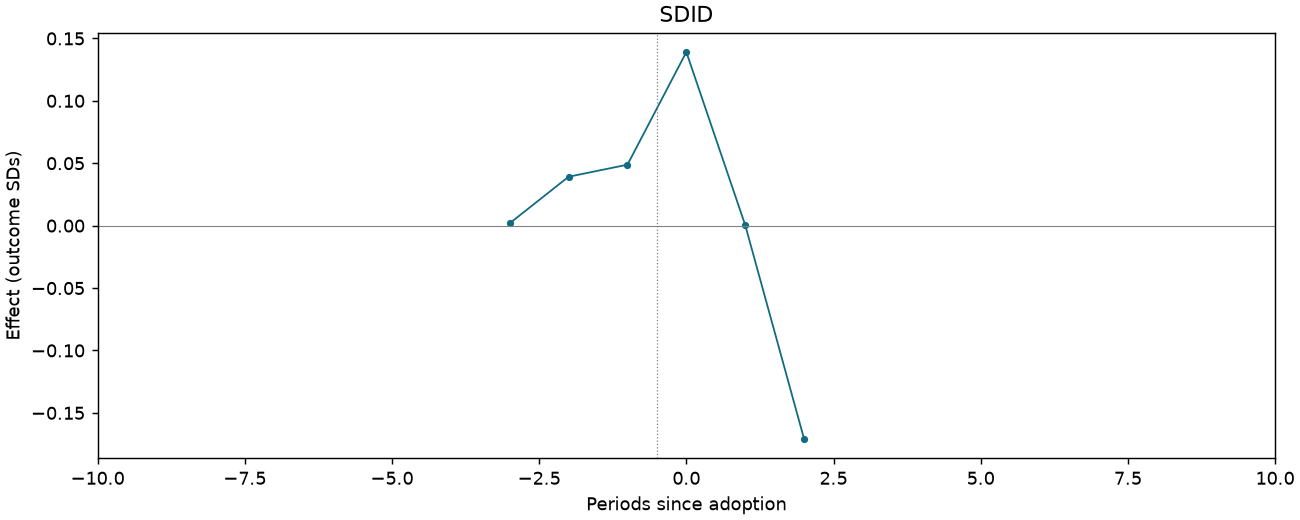
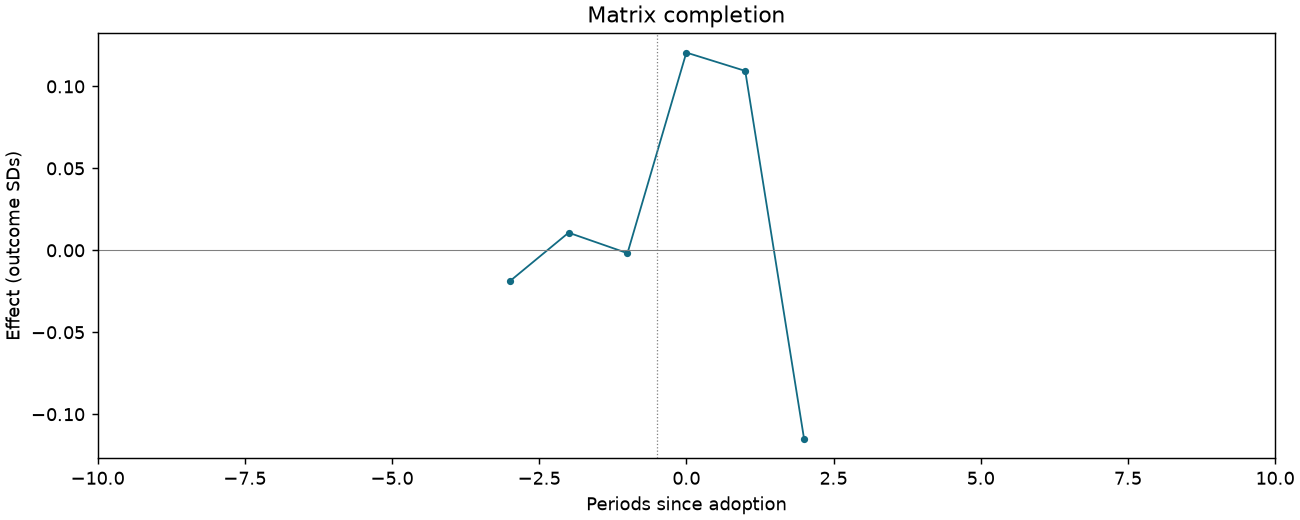
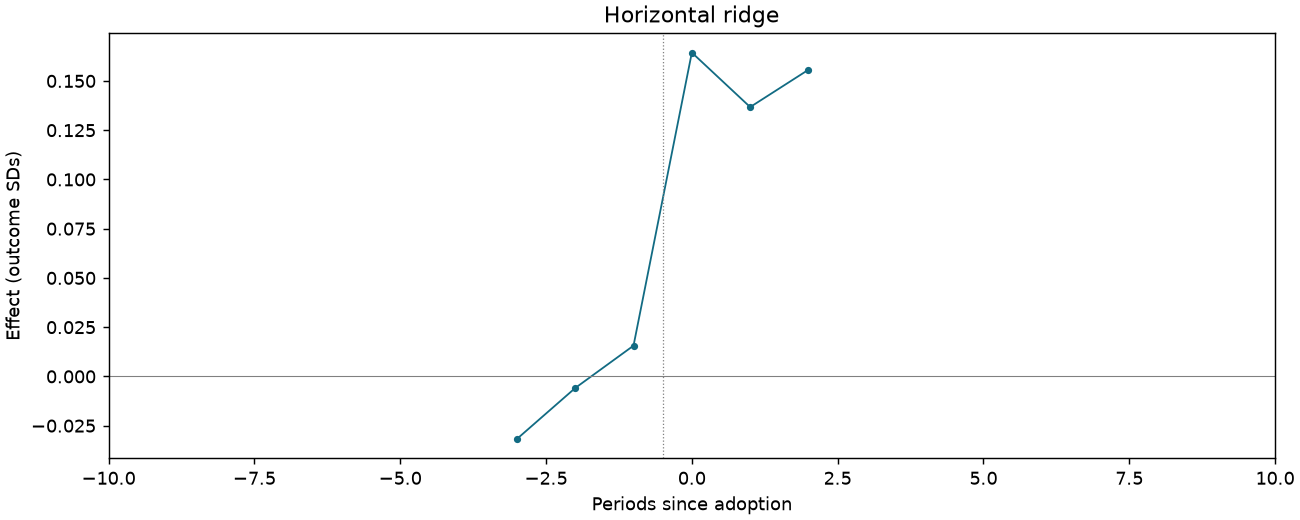
Officials would not accept bribes [Table 3 original scale]
1,091 observations · 19 units · 19 clusters · 13 treated / 6 control units.
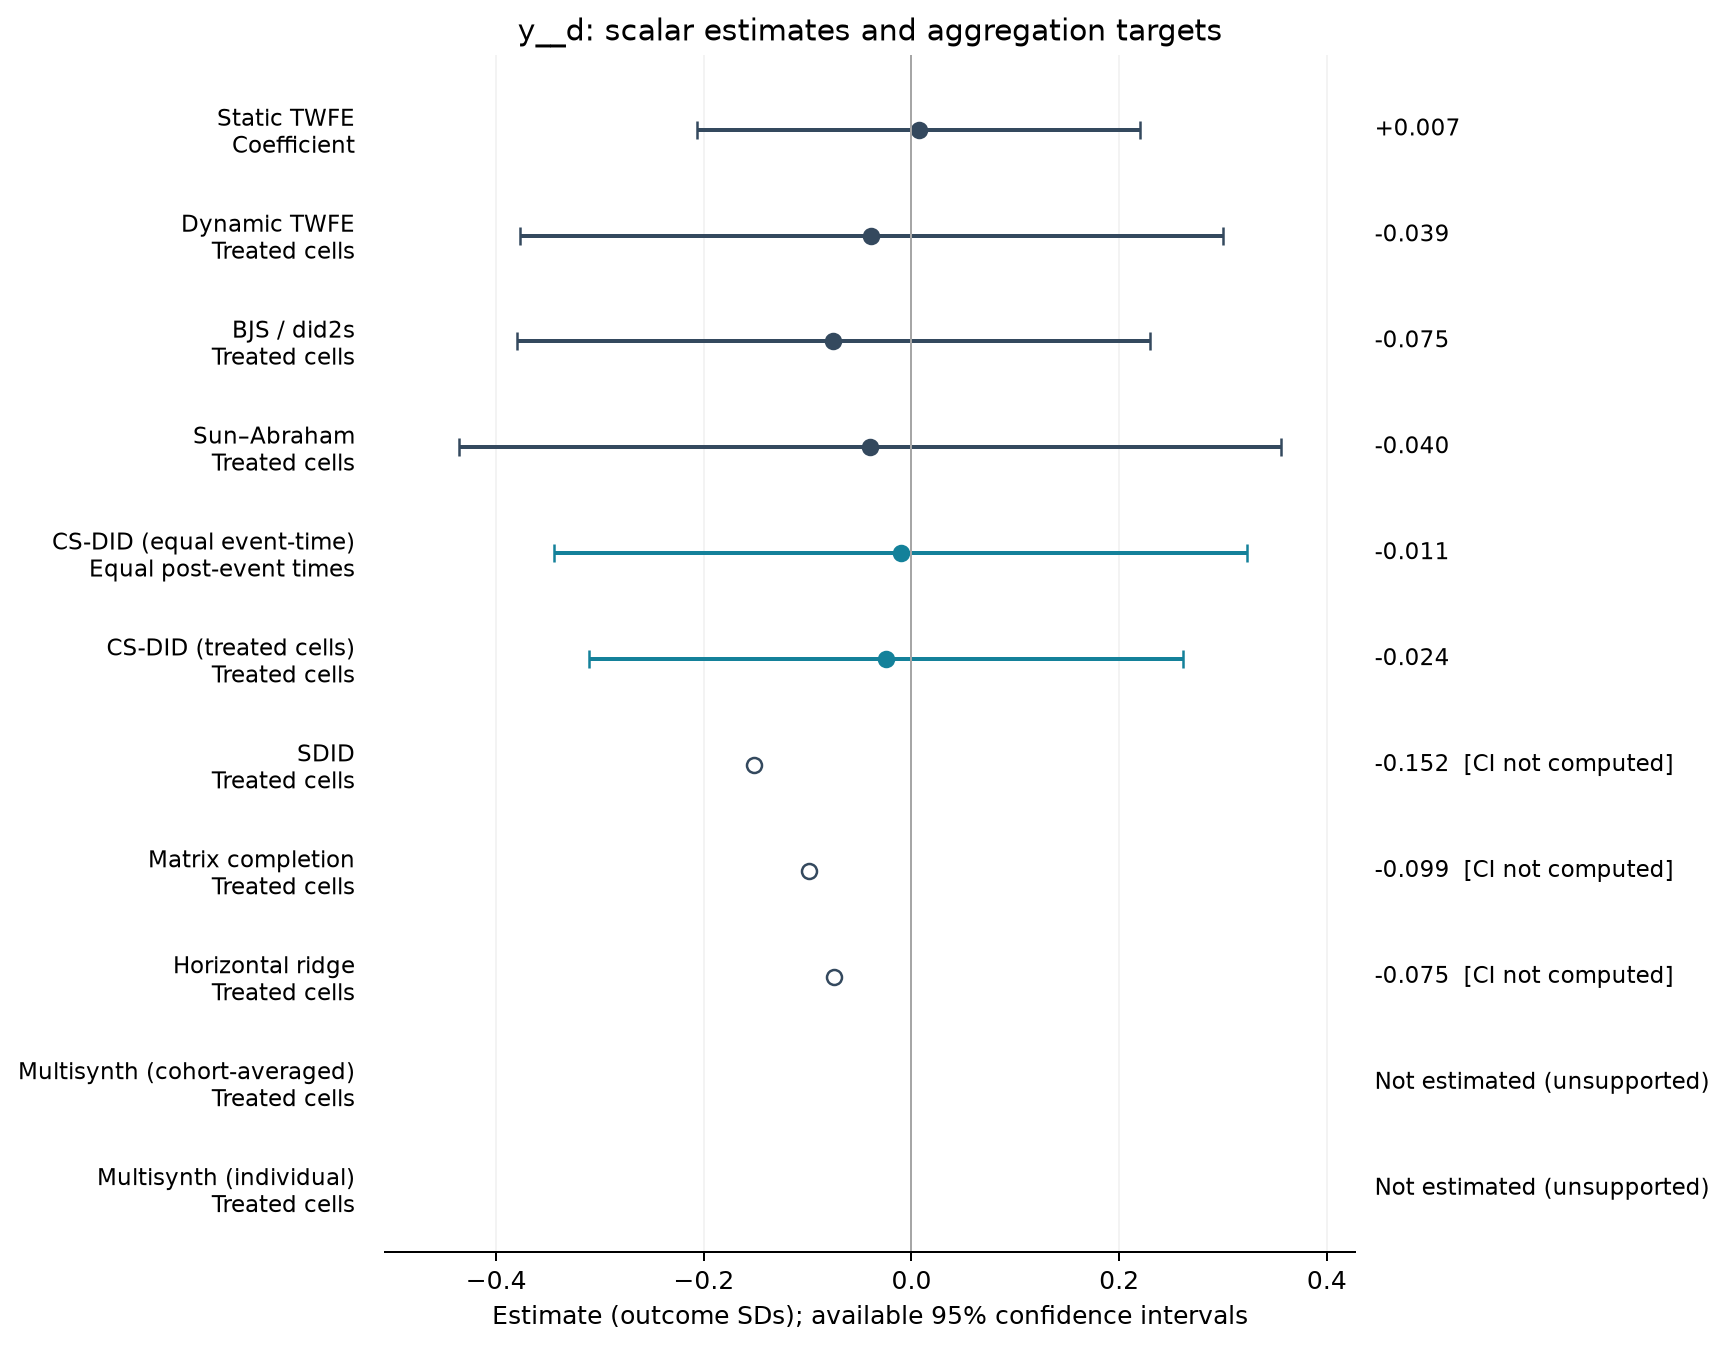
Estimate comparison
| Estimator | Estimate (SDs) | SE | 95% CI | Averaging |
|---|---|---|---|---|
| Static TWFE | 0.007 | 0.101 | [-0.206, 0.220] | Coefficient |
| Dynamic TWFE | -0.039 | 0.161 | [-0.377, 0.300] | Treated cells |
| BJS / did2s | -0.075 | 0.145 | [-0.380, 0.230] | Treated cells |
| Sun–Abraham | -0.040 | 0.188 | [-0.436, 0.356] | Treated cells |
| CS-DID (equal event-time) | -0.011 | 0.170 | [-0.344, 0.323] | Equal post-event times |
| CS-DID (treated cells) | -0.024 | 0.146 | [-0.310, 0.262] | Treated cells |
| SDID | -0.152 | — | — | Treated cells |
| Matrix completion | -0.099 | — | — | Treated cells |
| Horizontal ridge | -0.075 | — | — | Treated cells |
Event studies
Periods −10 to +10; pointwise 95% intervals where available.
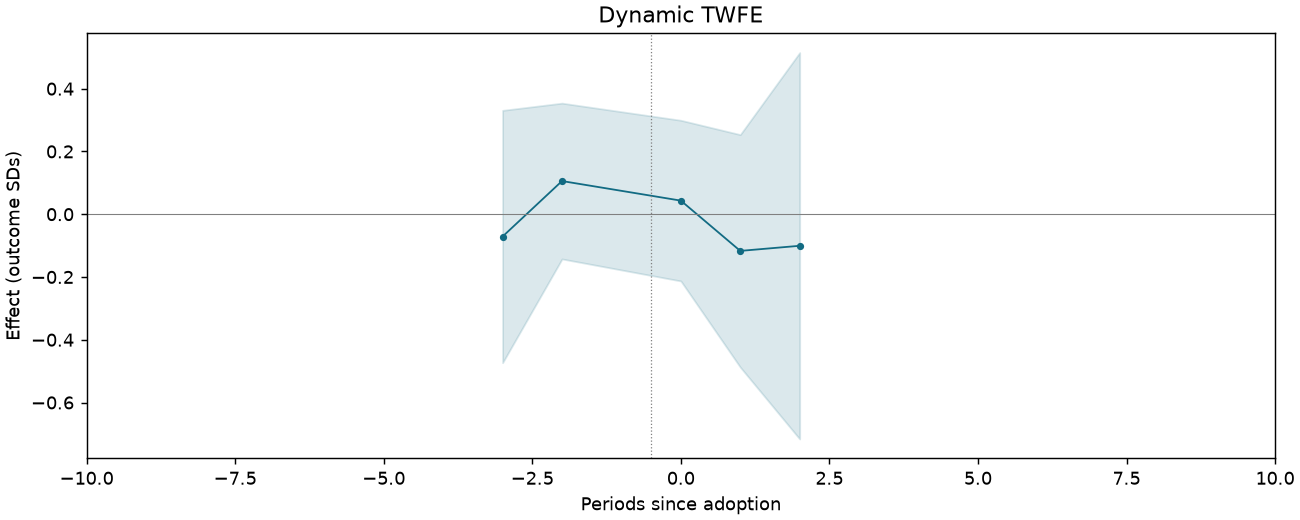
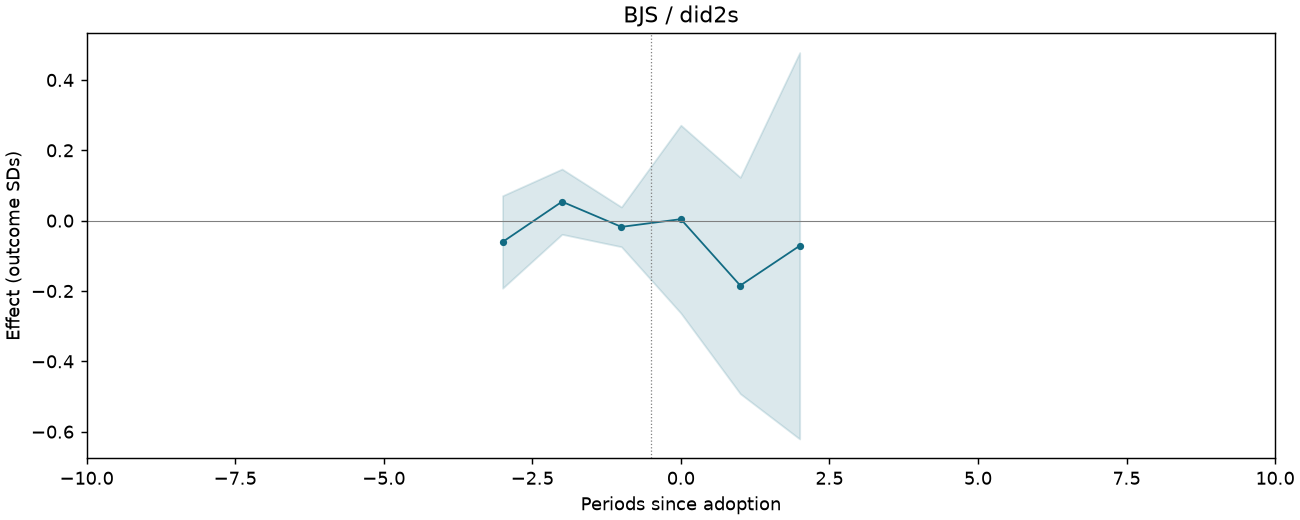
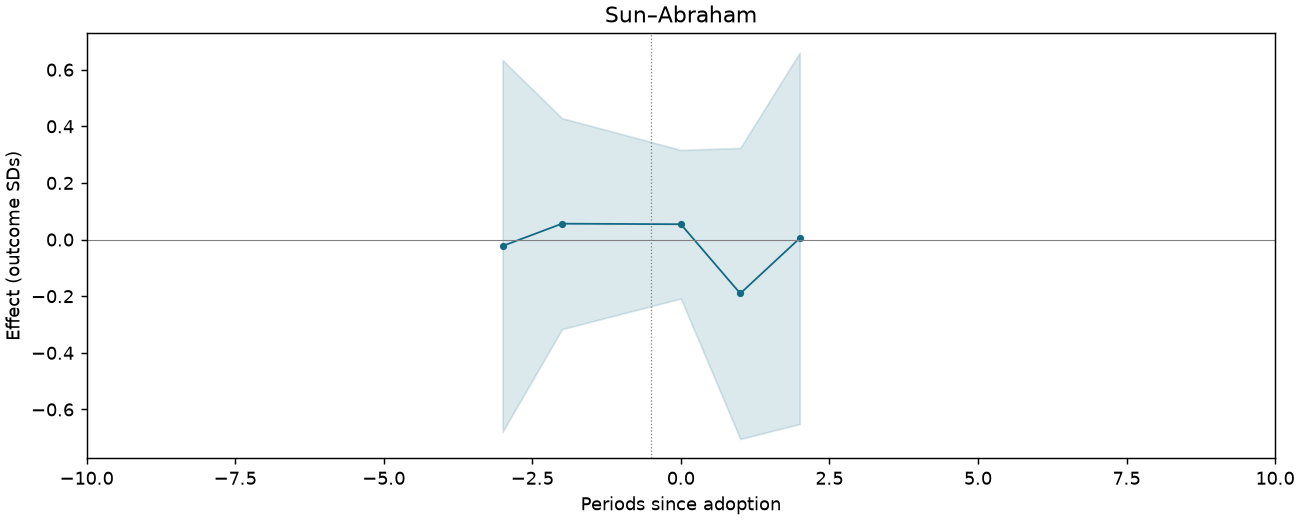
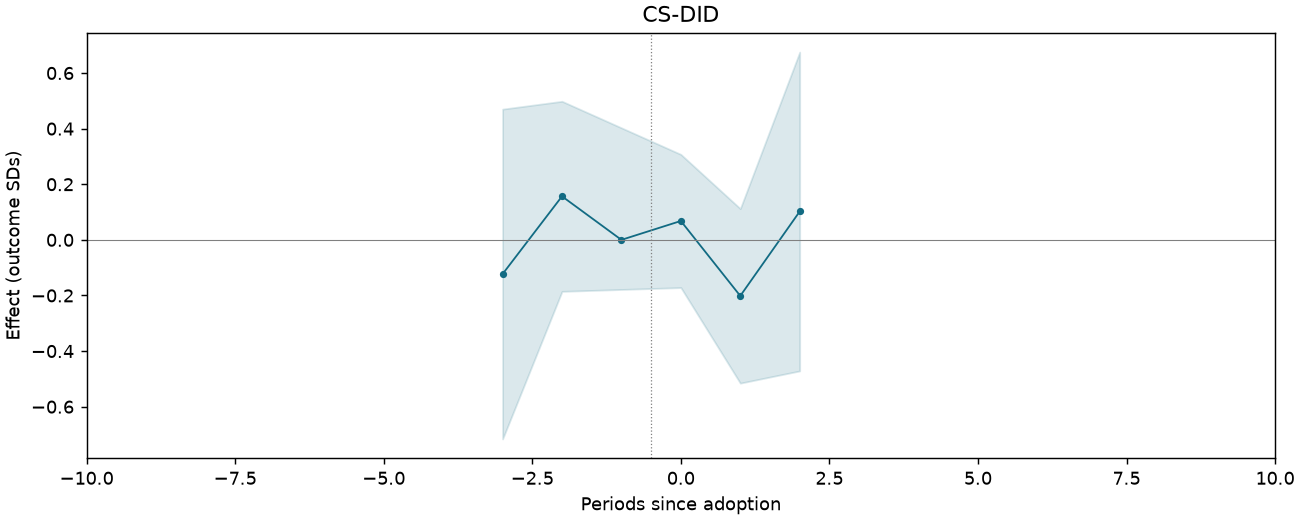
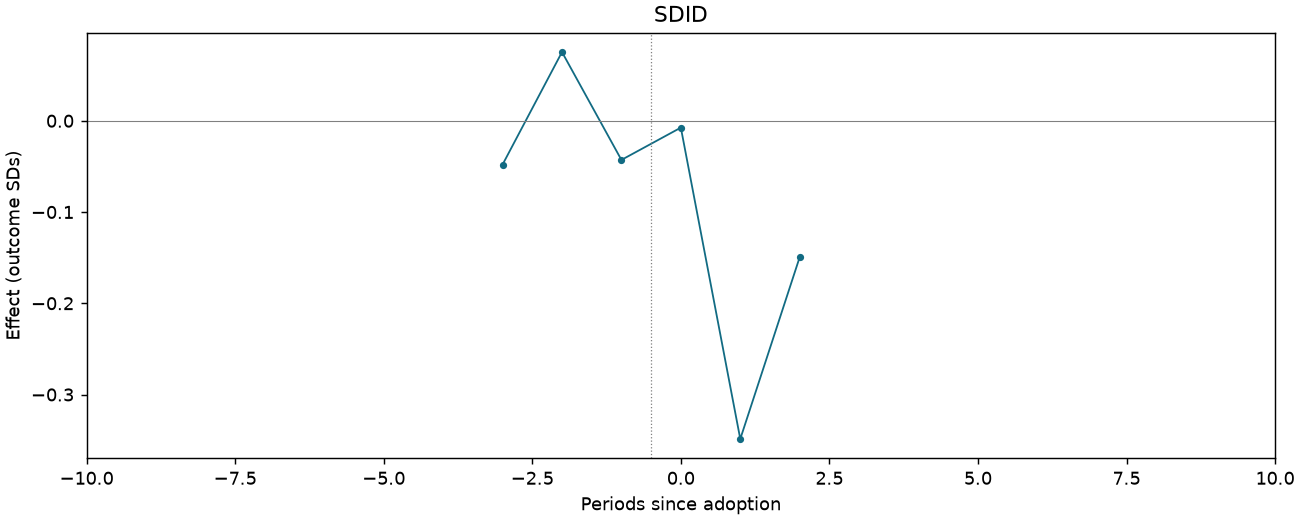
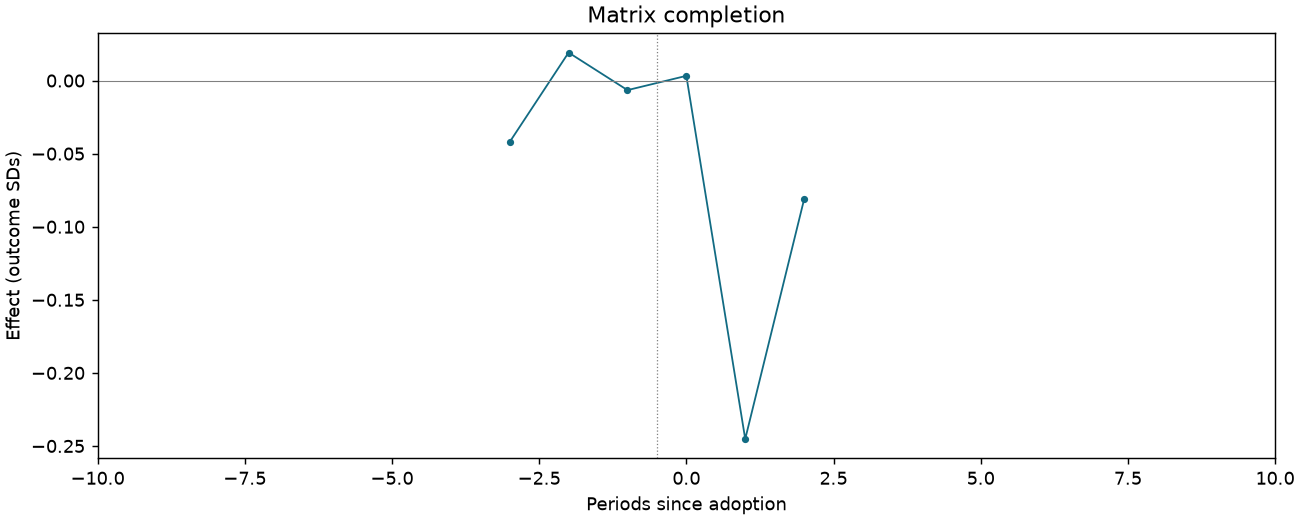
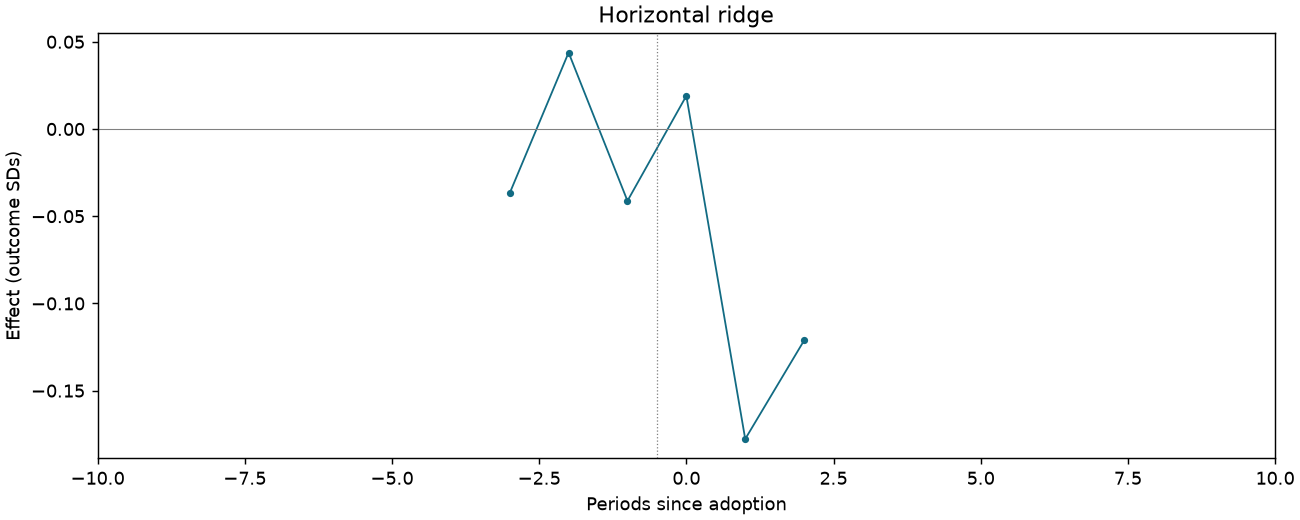
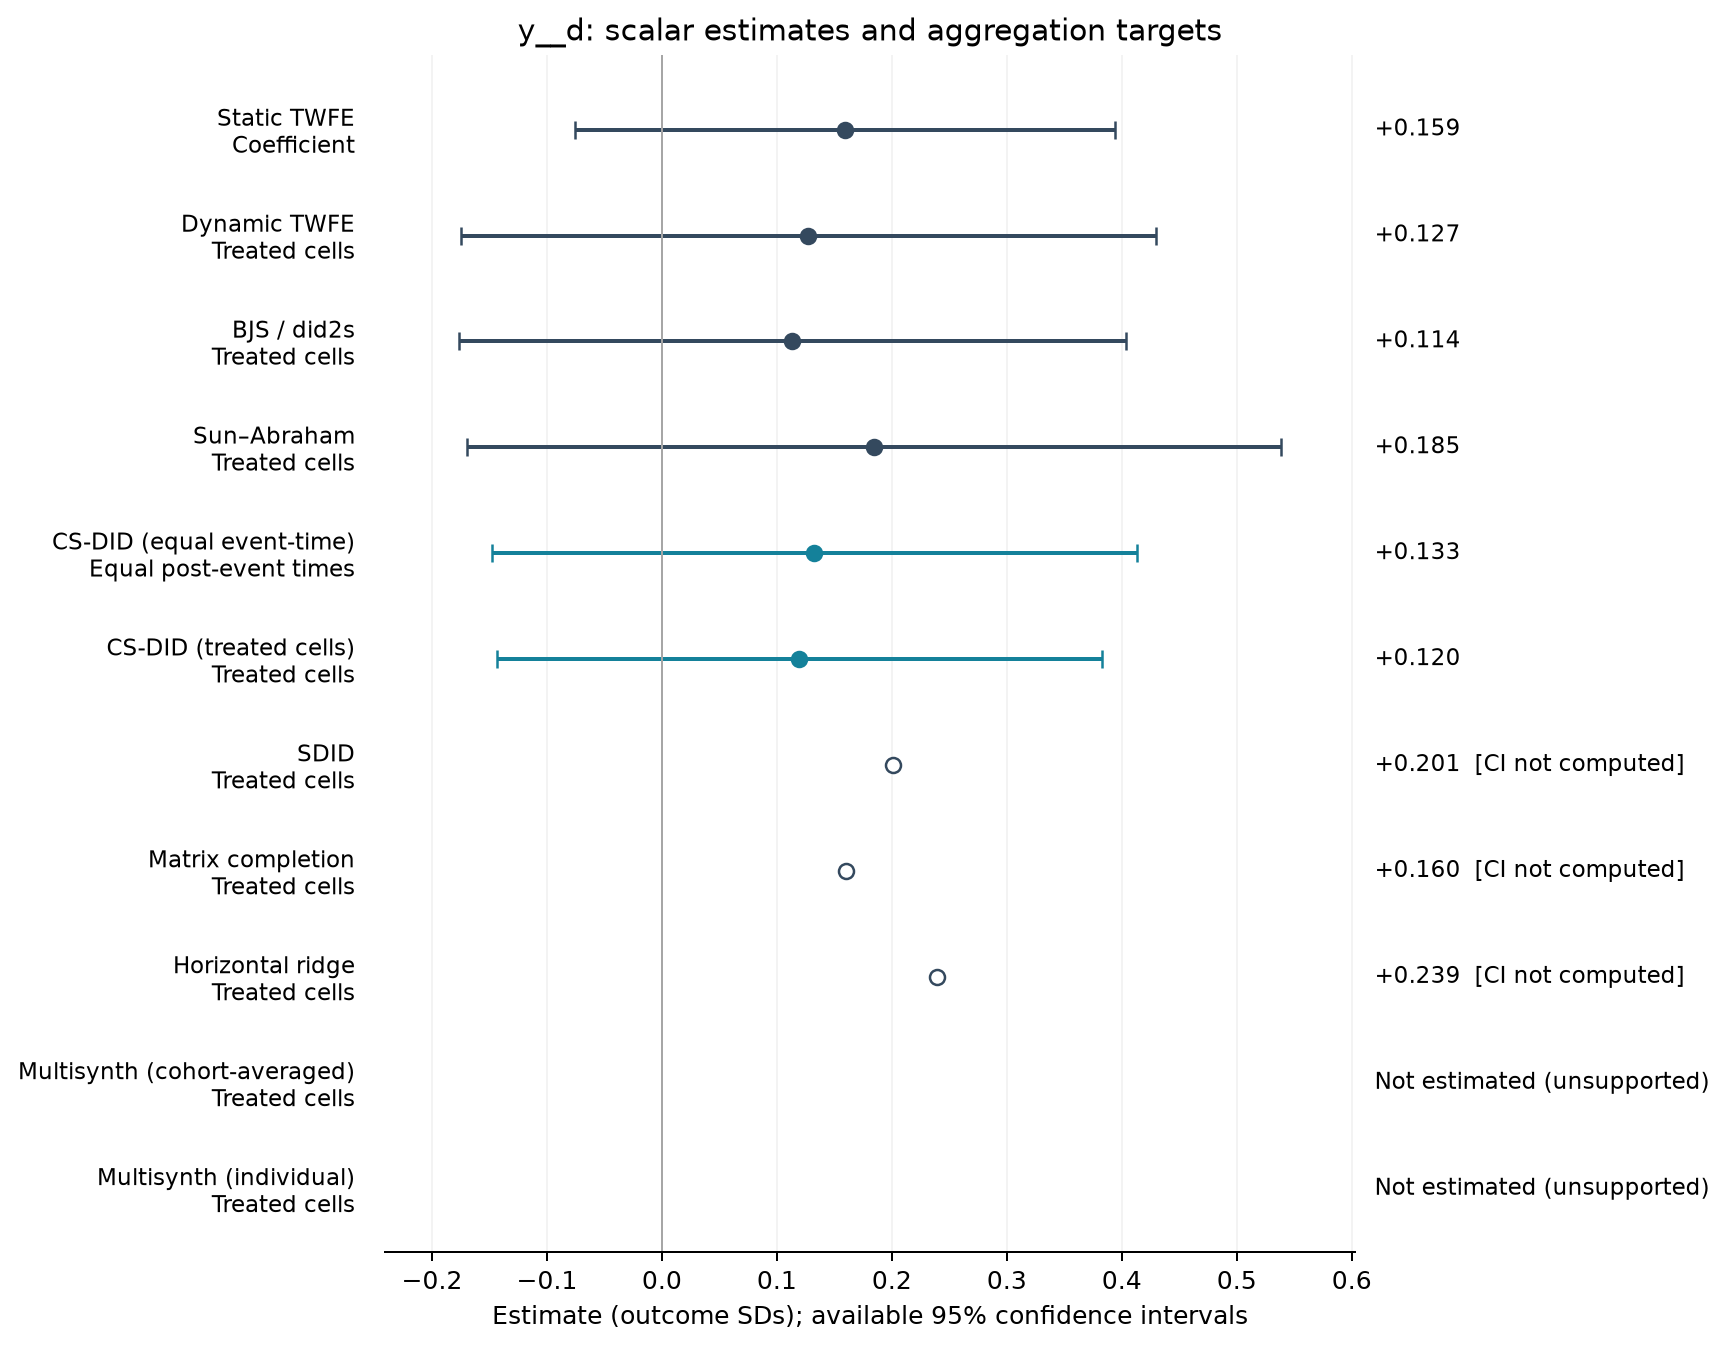
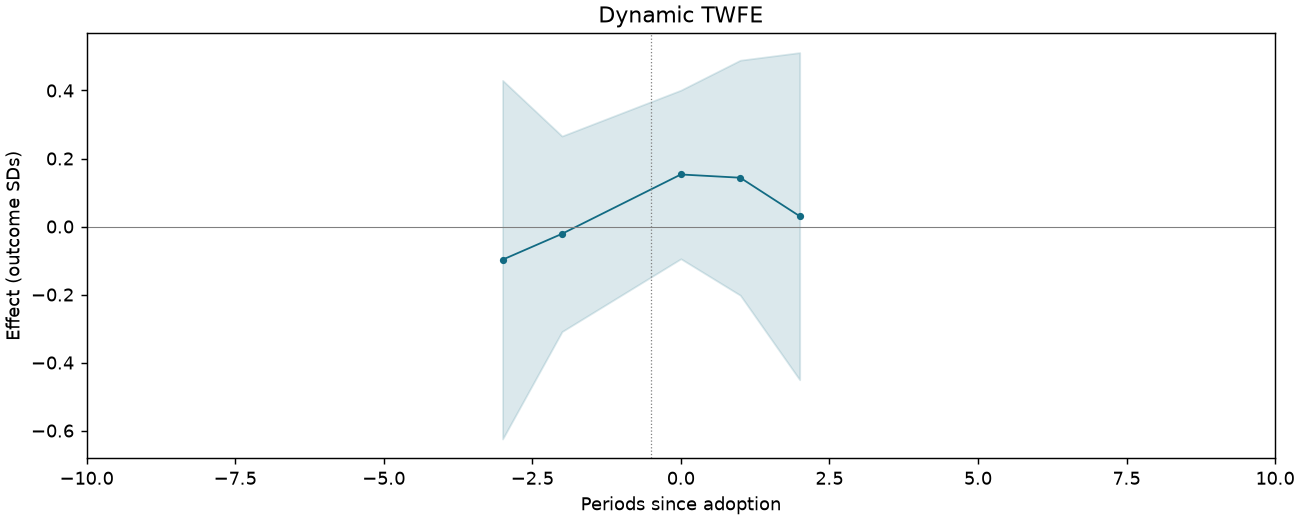
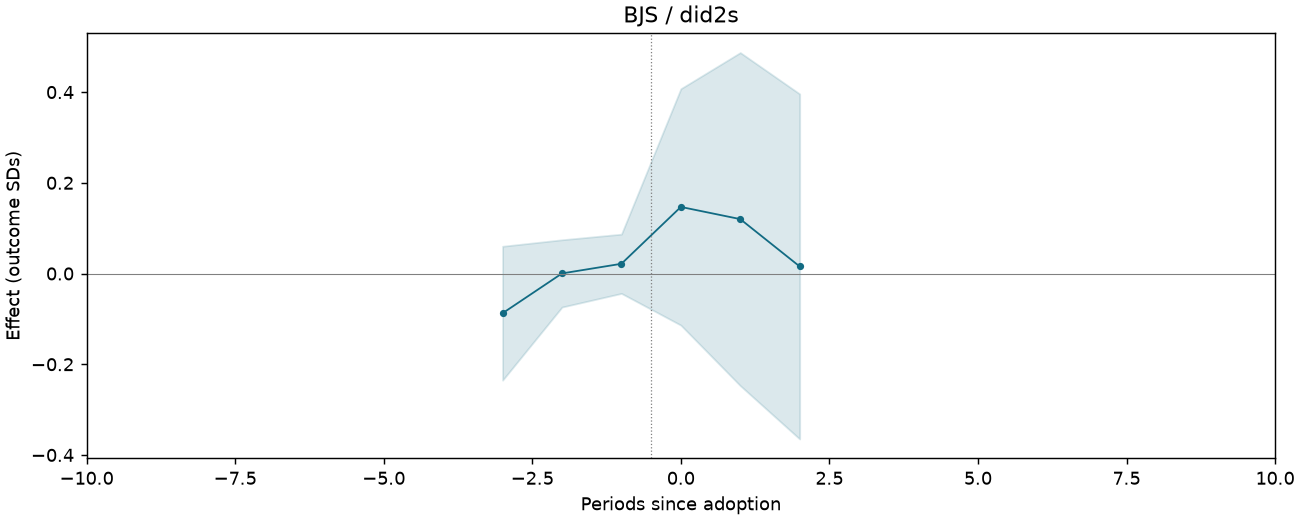
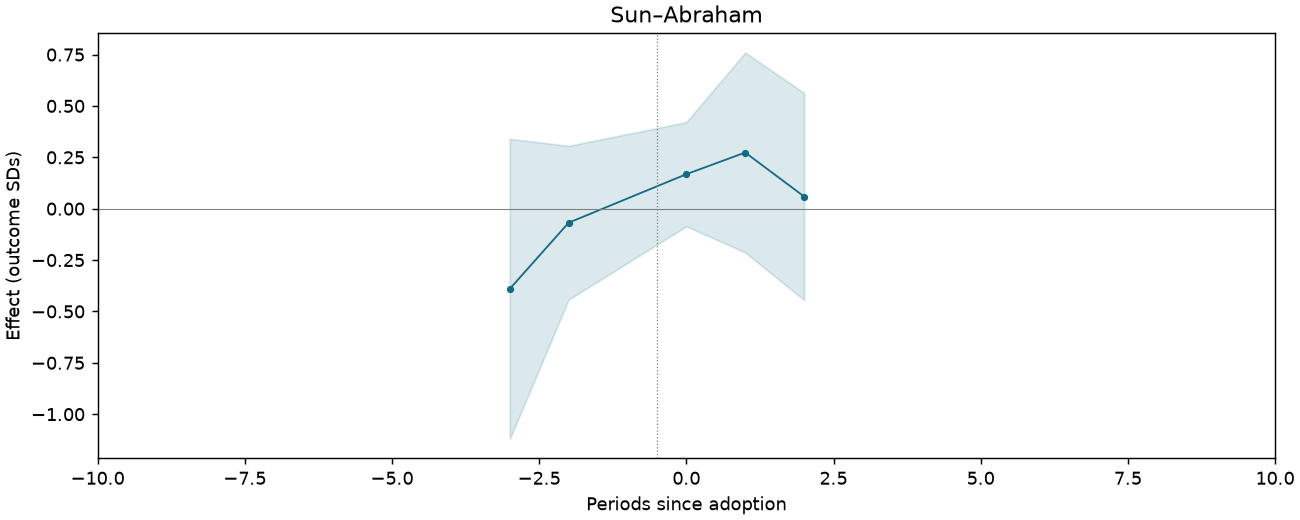
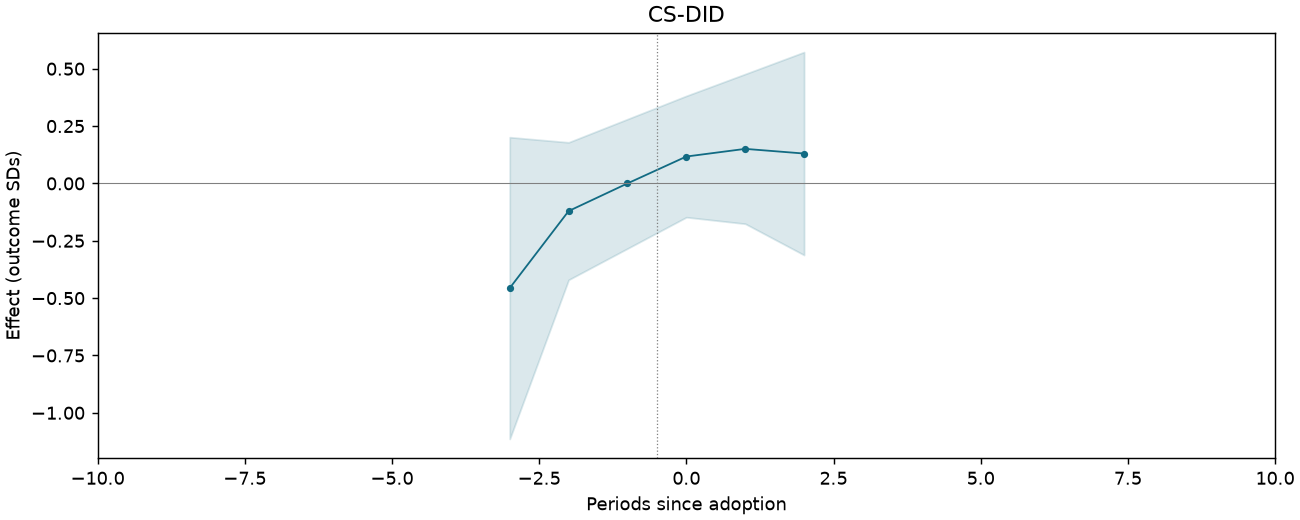
Bribery and civic-mindedness z-score index [Table 3 original scale]
1,090 observations · 19 units · 19 clusters · 13 treated / 6 control units.
Estimate comparison
| Estimator | Estimate (SDs) | SE | 95% CI | Averaging |
|---|---|---|---|---|
| Static TWFE | 0.159 | 0.112 | [-0.076, 0.394] | Coefficient |
| Dynamic TWFE | 0.127 | 0.144 | [-0.175, 0.429] | Treated cells |
| BJS / did2s | 0.114 | 0.138 | [-0.176, 0.404] | Treated cells |
| Sun–Abraham | 0.185 | 0.168 | [-0.169, 0.539] | Treated cells |
| CS-DID (equal event-time) | 0.133 | 0.143 | [-0.148, 0.413] | Equal post-event times |
| CS-DID (treated cells) | 0.120 | 0.134 | [-0.143, 0.382] | Treated cells |
| SDID | 0.201 | — | — | Treated cells |
| Matrix completion | 0.160 | — | — | Treated cells |
| Horizontal ridge | 0.239 | — | — | Treated cells |
Event studies
Periods −10 to +10; pointwise 95% intervals where available.
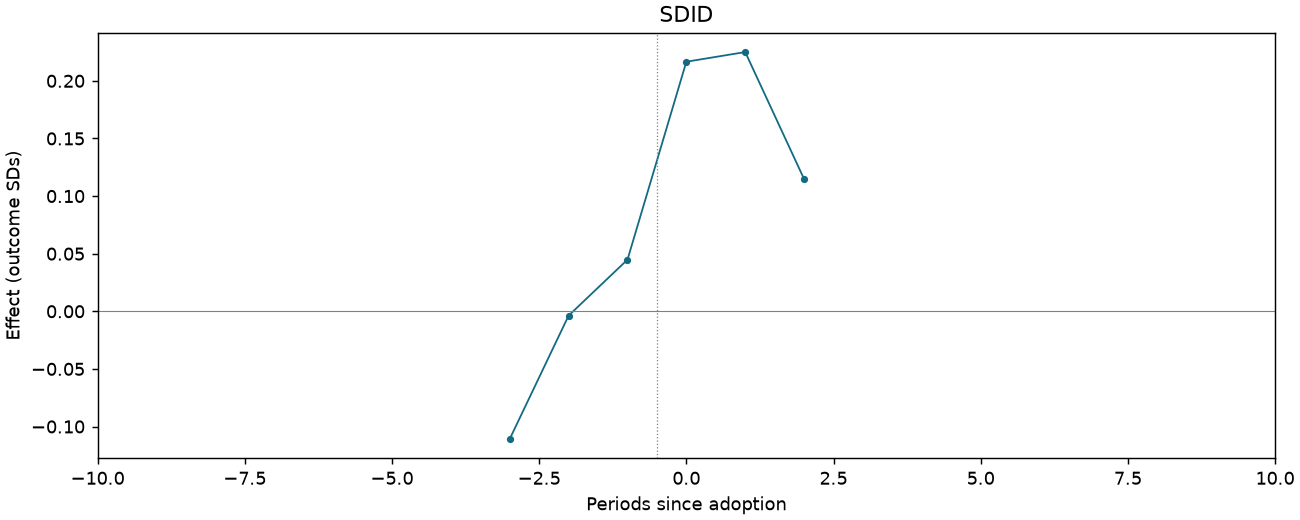
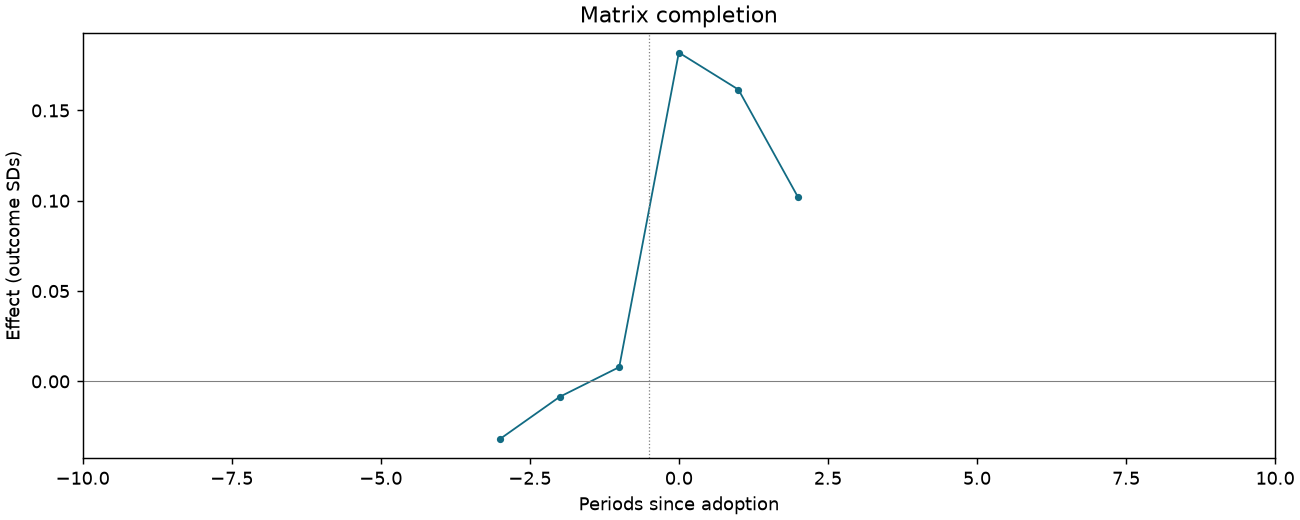
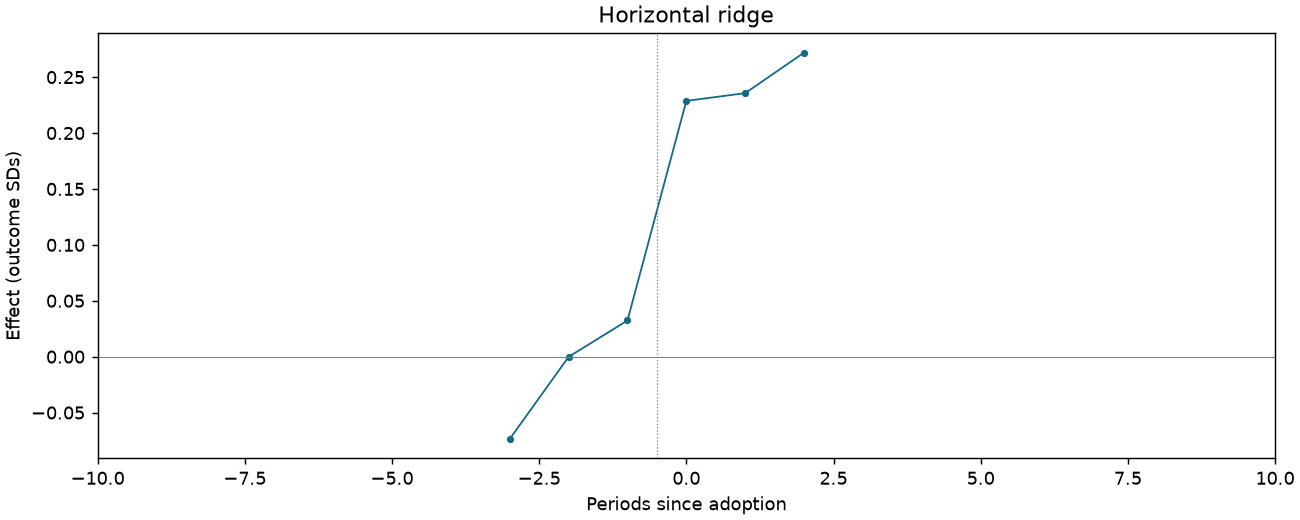
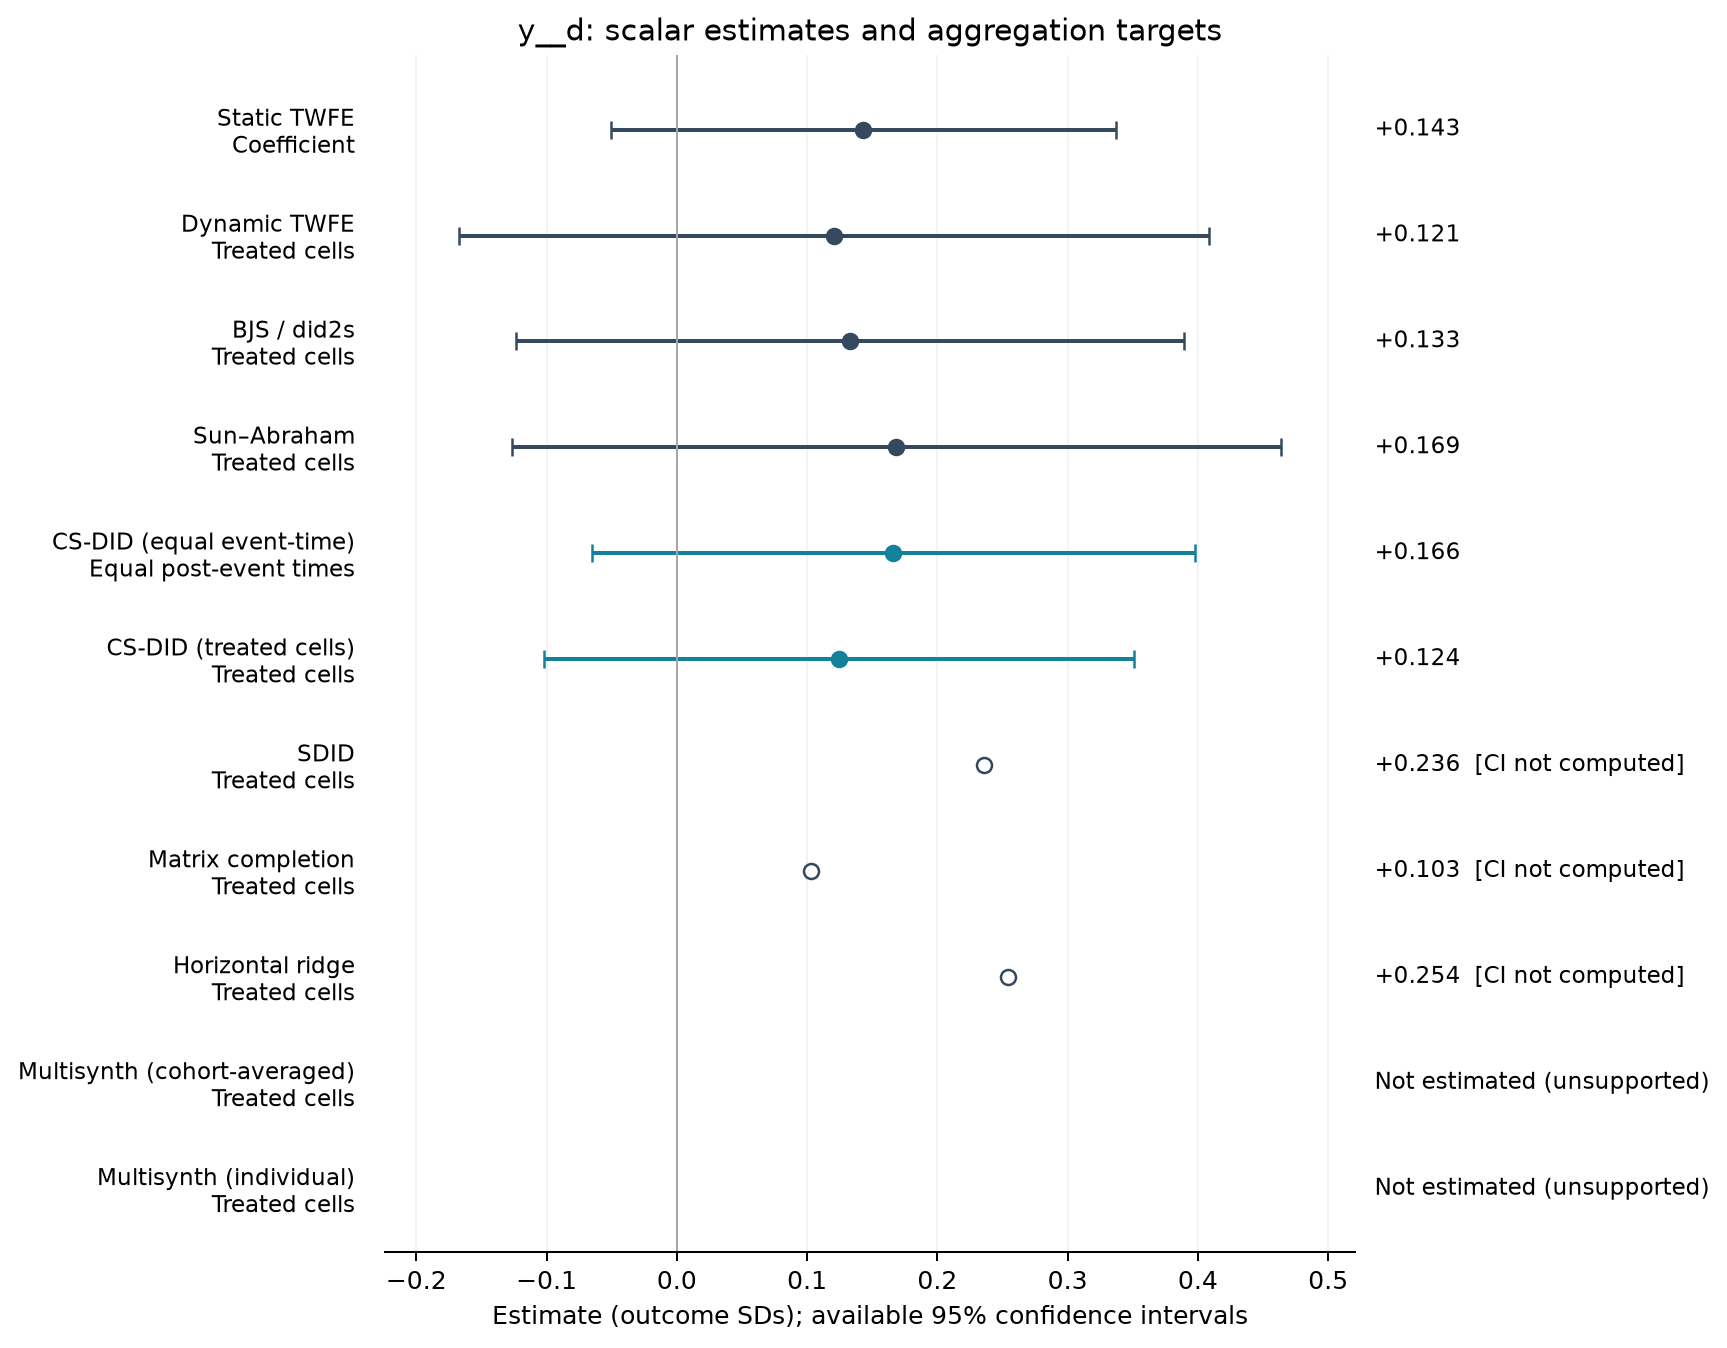
How democratic is China [Table 3 original scale]
1,083 observations · 19 units · 19 clusters · 13 treated / 6 control units.
Estimate comparison
| Estimator | Estimate (SDs) | SE | 95% CI | Averaging |
|---|---|---|---|---|
| Static TWFE | 0.143 | 0.092 | [-0.051, 0.337] | Coefficient |
| Dynamic TWFE | 0.121 | 0.137 | [-0.167, 0.408] | Treated cells |
| BJS / did2s | 0.133 | 0.122 | [-0.123, 0.389] | Treated cells |
| Sun–Abraham | 0.169 | 0.141 | [-0.127, 0.464] | Treated cells |
| CS-DID (equal event-time) | 0.166 | 0.118 | [-0.065, 0.398] | Equal post-event times |
| CS-DID (treated cells) | 0.124 | 0.116 | [-0.102, 0.351] | Treated cells |
| SDID | 0.236 | — | — | Treated cells |
| Matrix completion | 0.103 | — | — | Treated cells |
| Horizontal ridge | 0.254 | — | — | Treated cells |
Event studies
Periods −10 to +10; pointwise 95% intervals where available.
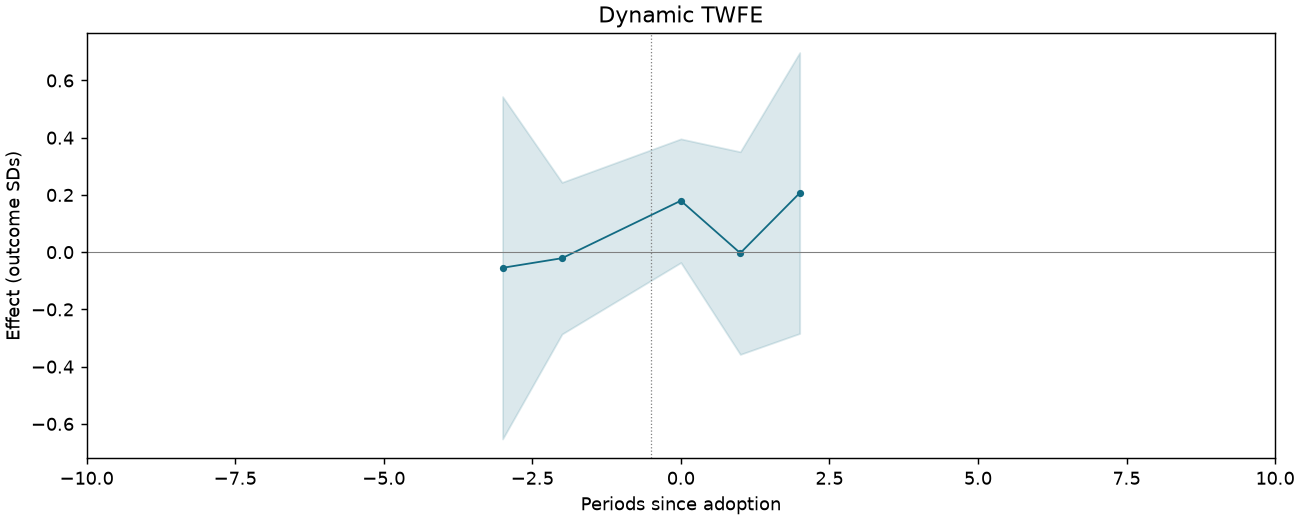
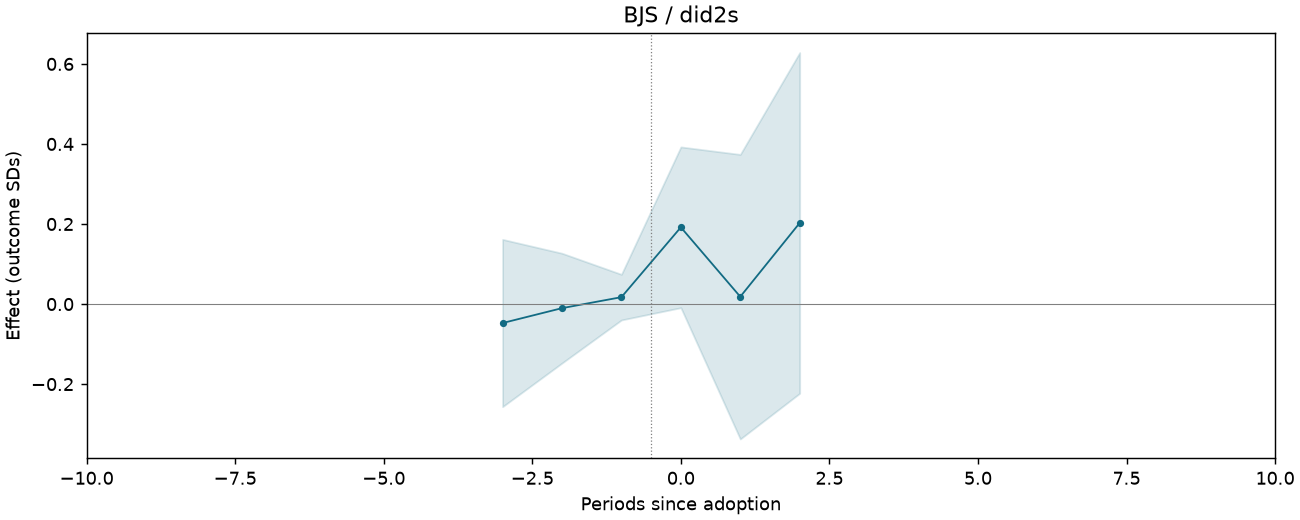
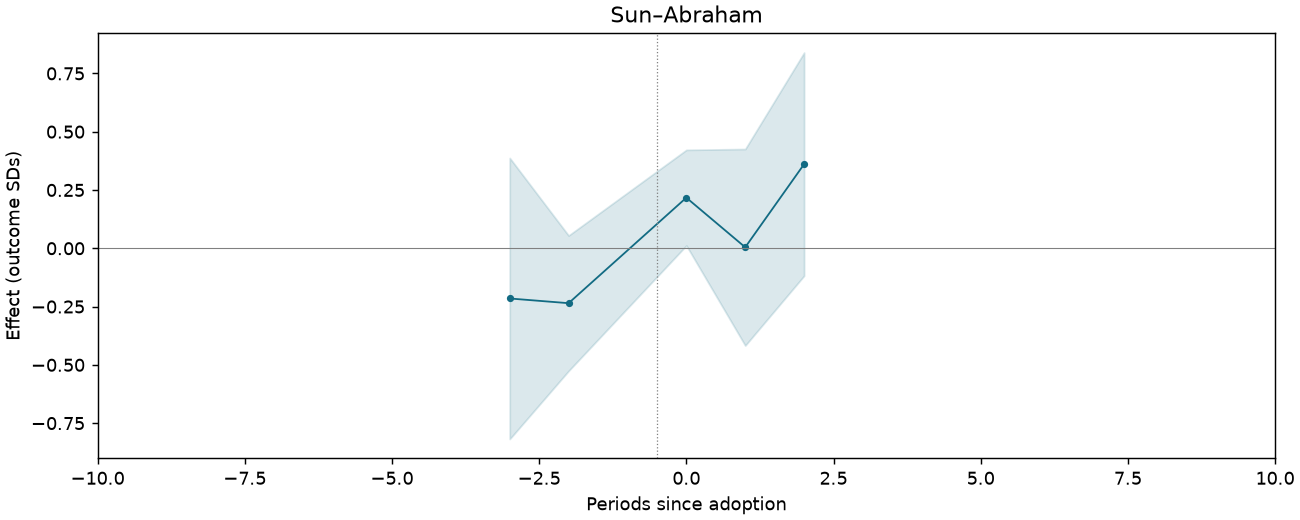
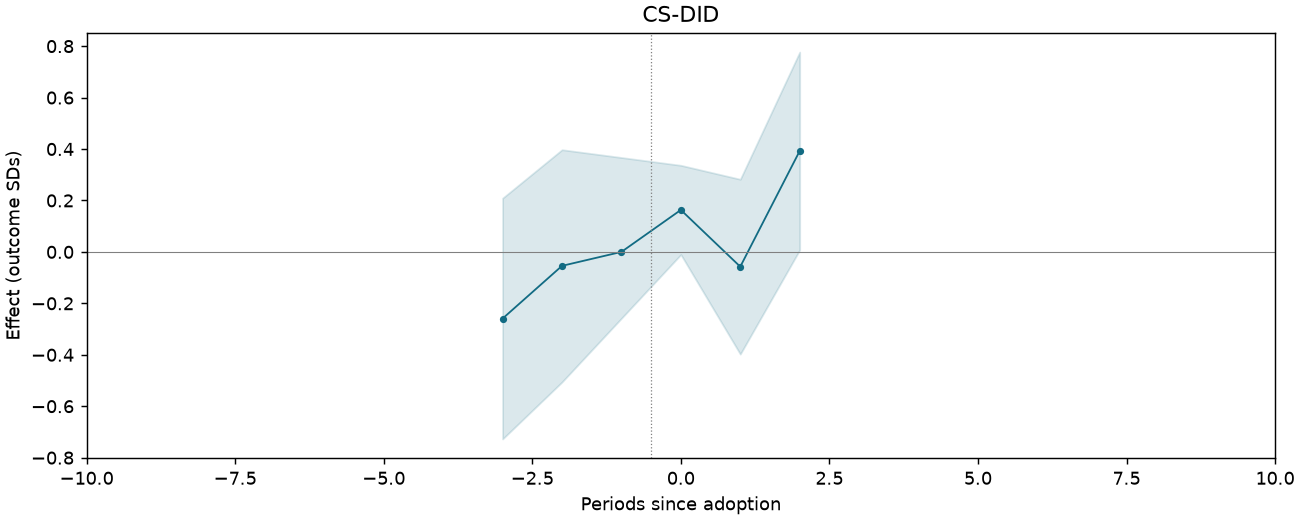
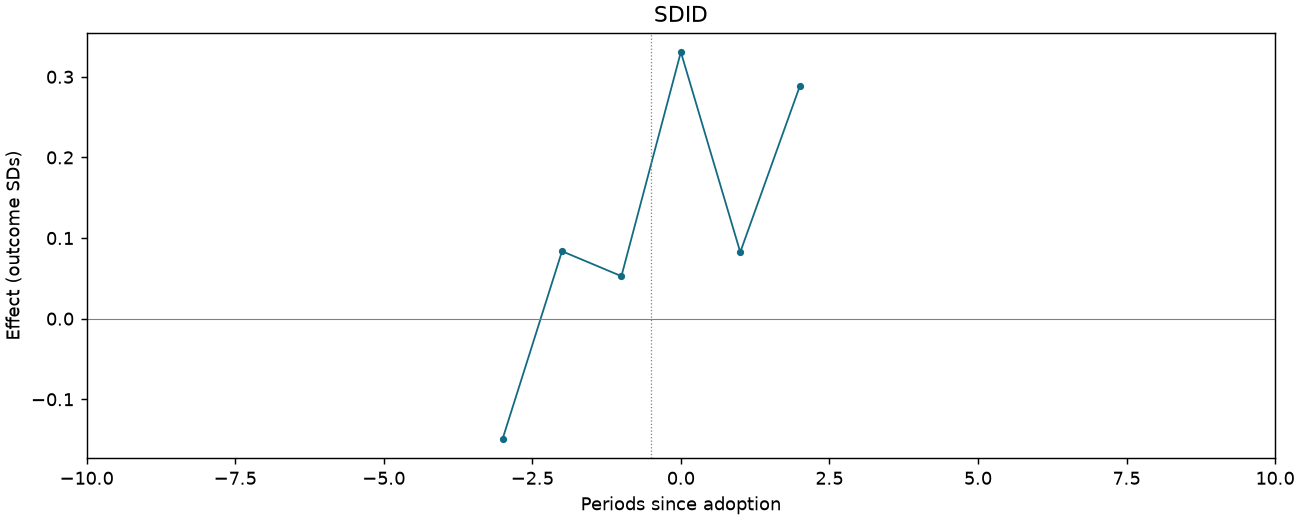
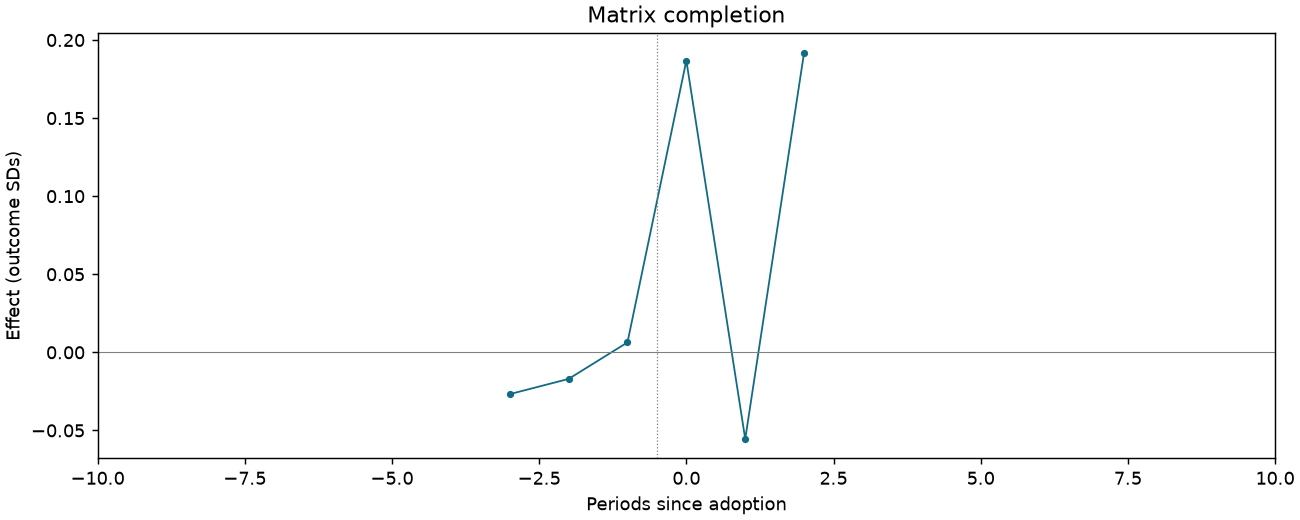
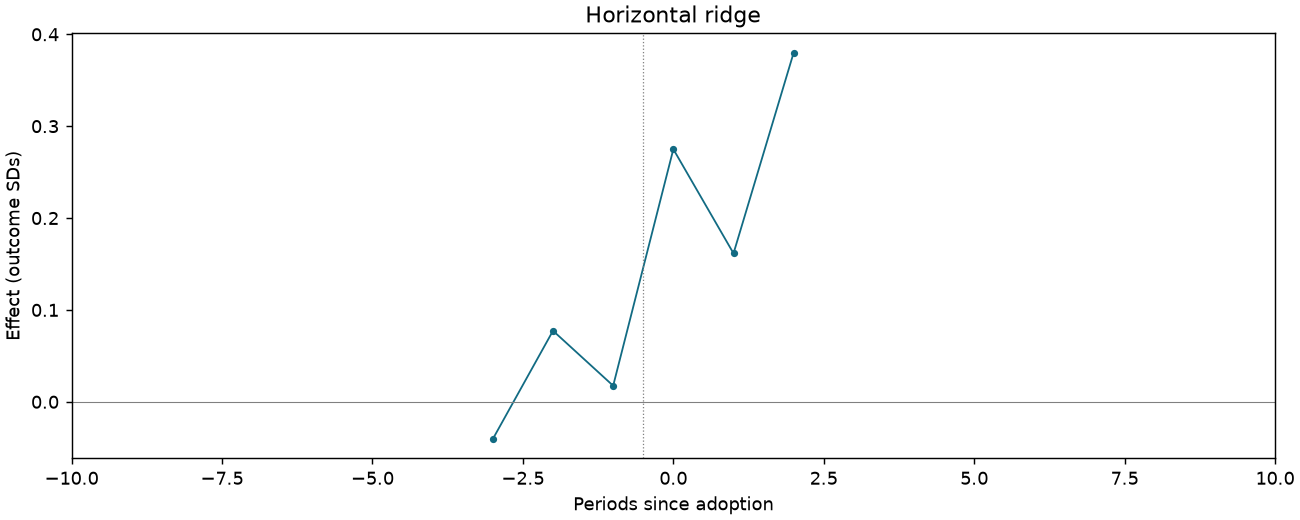
People can influence elections [Table 3 original scale]
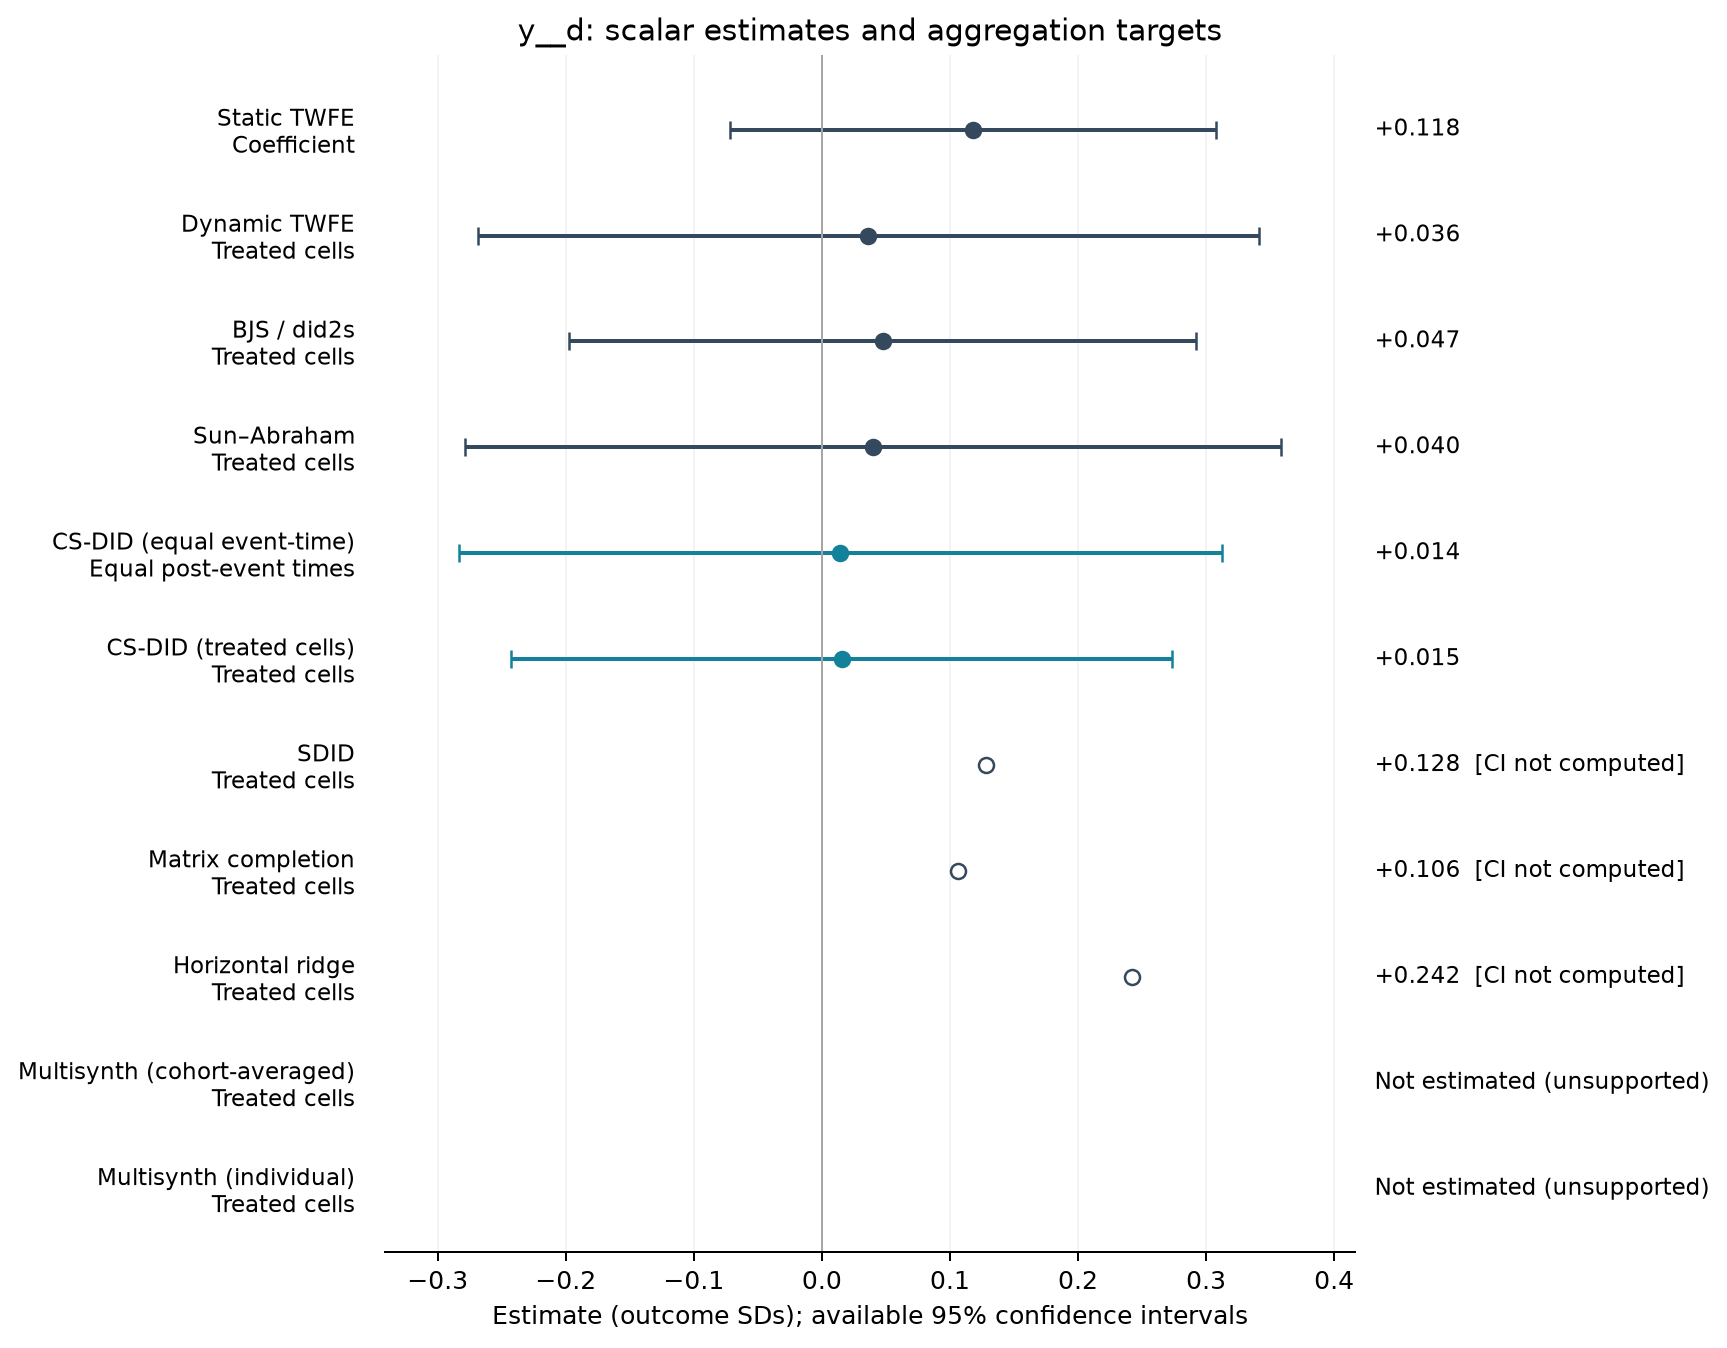
1,100 observations · 19 units · 19 clusters · 13 treated / 6 control units.
Estimate comparison
| Estimator | Estimate (SDs) | SE | 95% CI | Averaging |
|---|---|---|---|---|
| Static TWFE | 0.118 | 0.090 | [-0.072, 0.308] | Coefficient |
| Dynamic TWFE | 0.036 | 0.145 | [-0.269, 0.341] | Treated cells |
| BJS / did2s | 0.047 | 0.117 | [-0.198, 0.292] | Treated cells |
| Sun–Abraham | 0.040 | 0.152 | [-0.279, 0.359] | Treated cells |
| CS-DID (equal event-time) | 0.014 | 0.152 | [-0.283, 0.312] | Equal post-event times |
| CS-DID (treated cells) | 0.015 | 0.132 | [-0.243, 0.274] | Treated cells |
| SDID | 0.128 | — | — | Treated cells |
| Matrix completion | 0.106 | — | — | Treated cells |
| Horizontal ridge | 0.242 | — | — | Treated cells |
Event studies
Periods −10 to +10; pointwise 95% intervals where available.
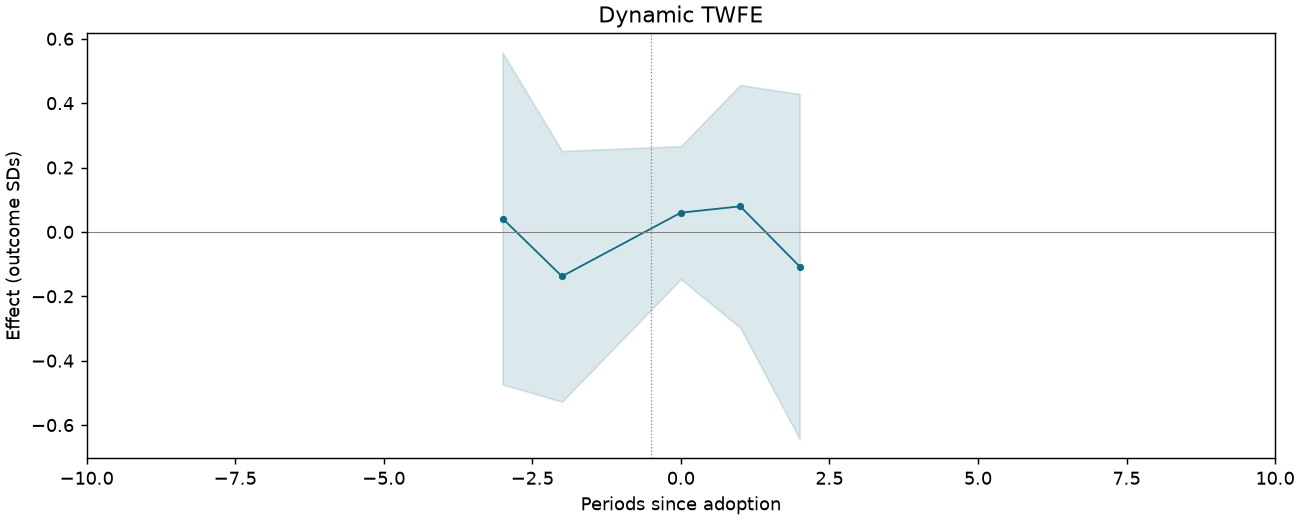
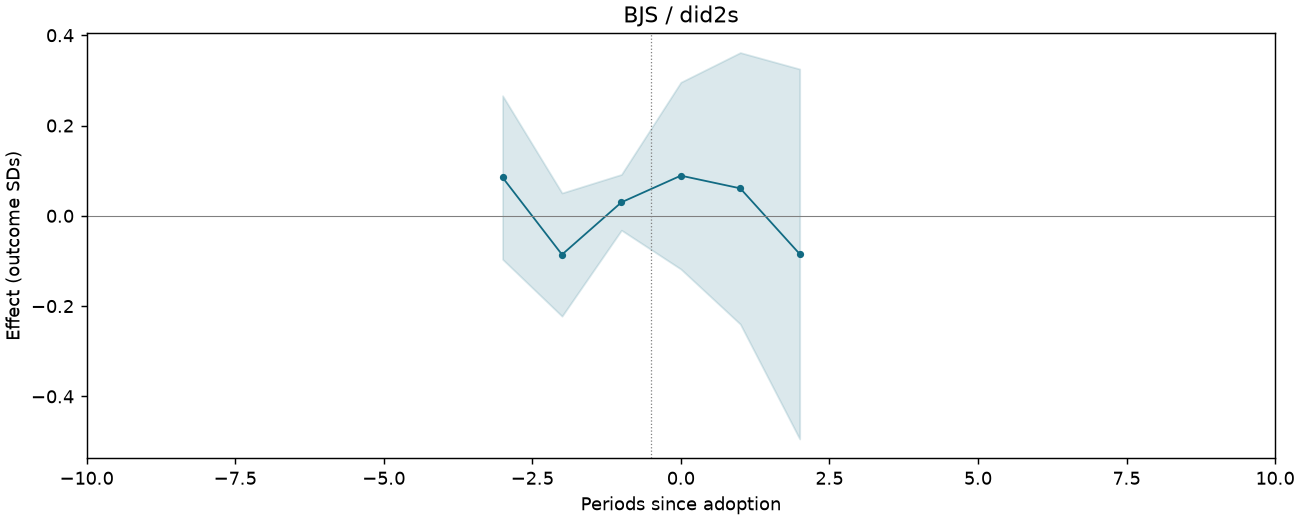
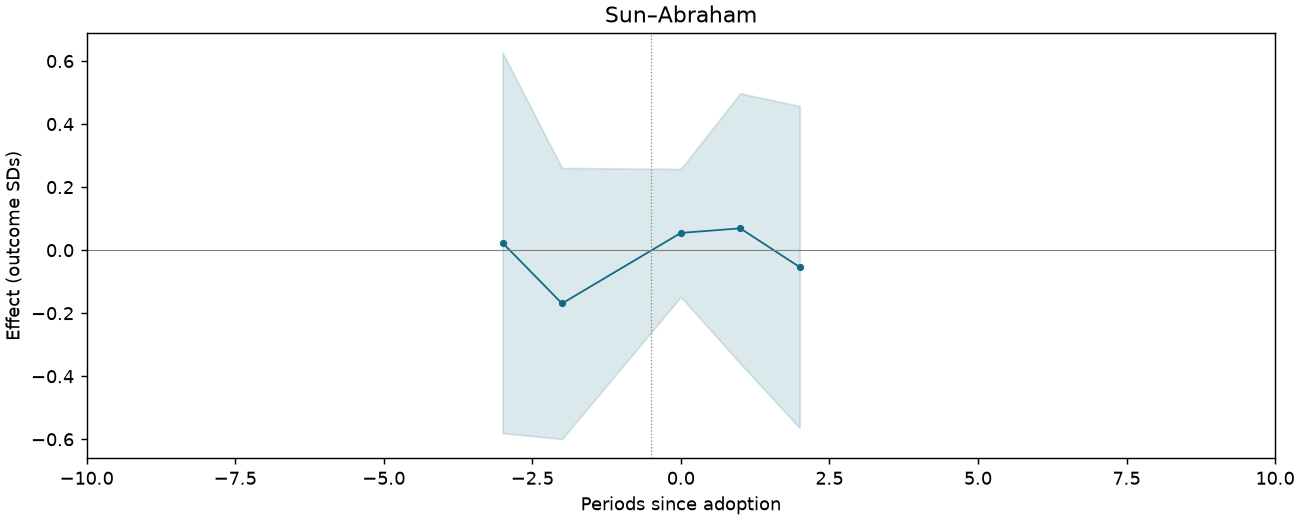
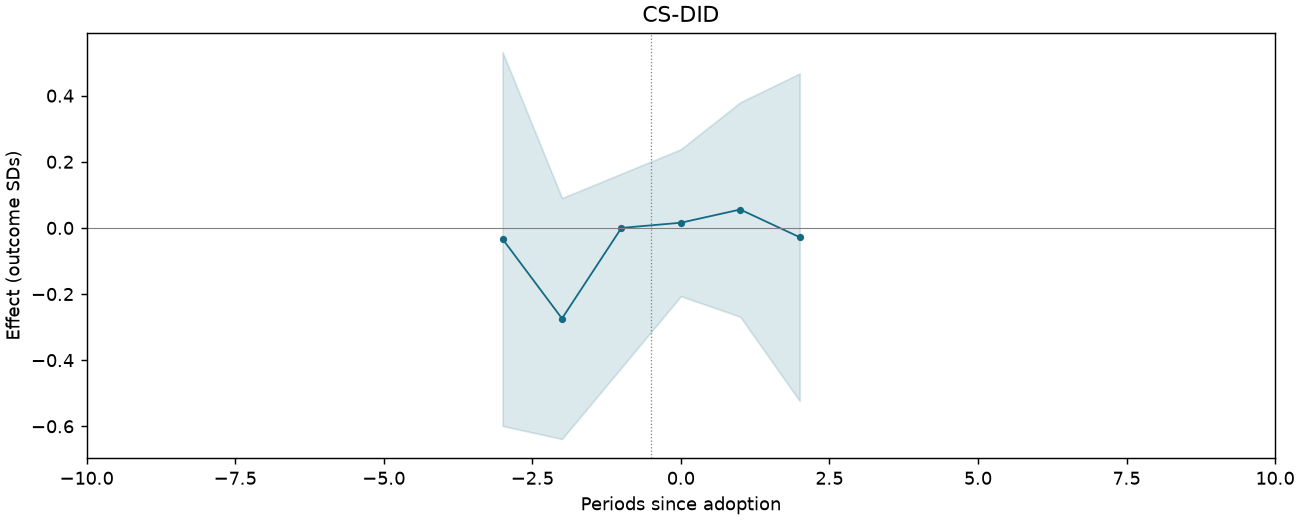
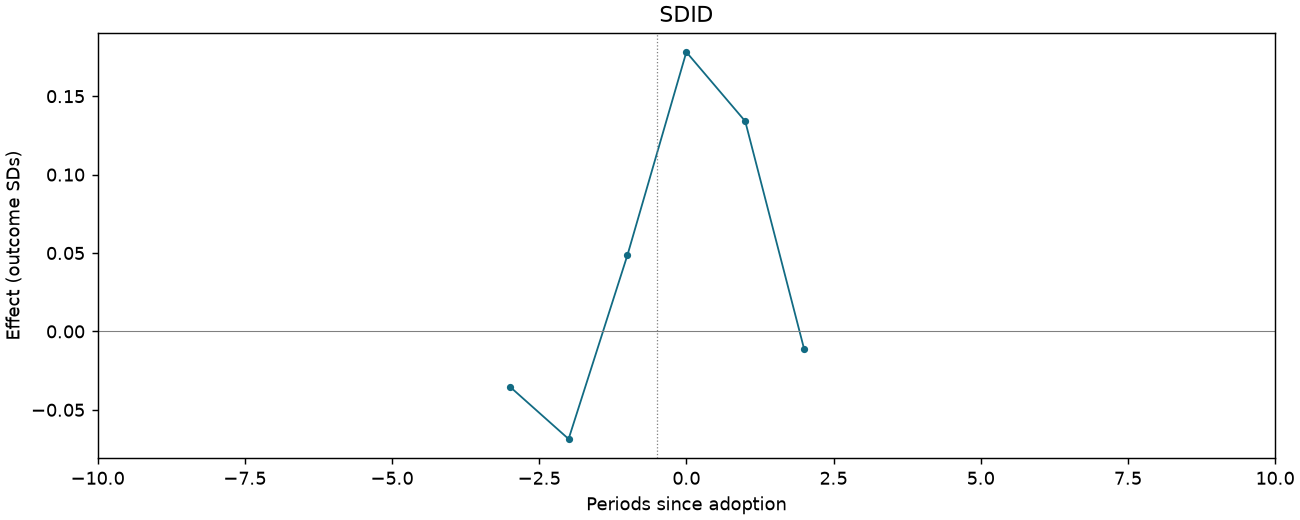
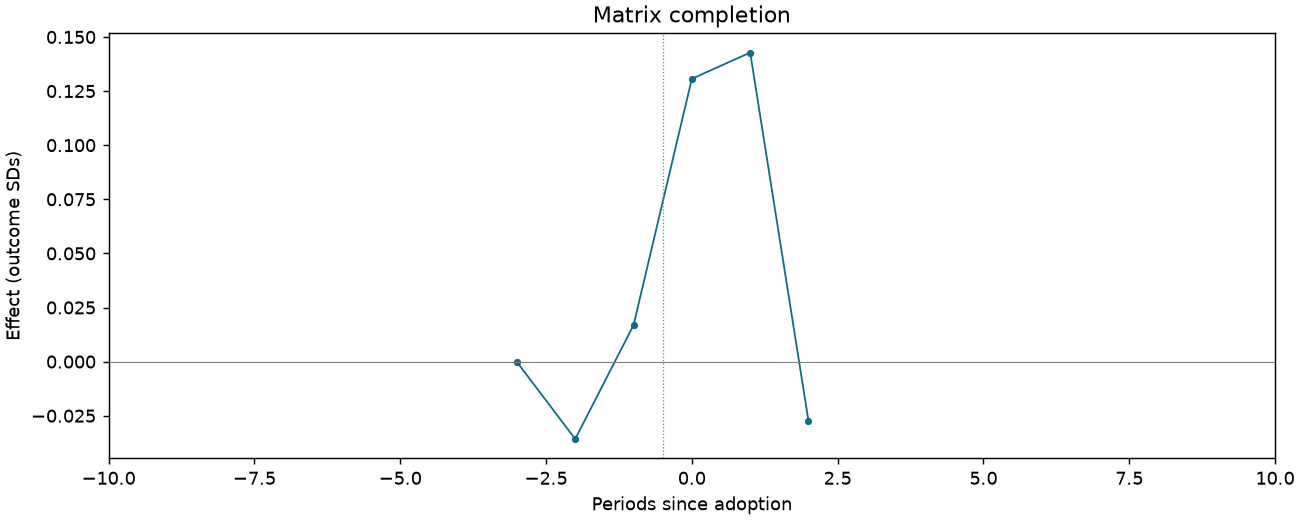
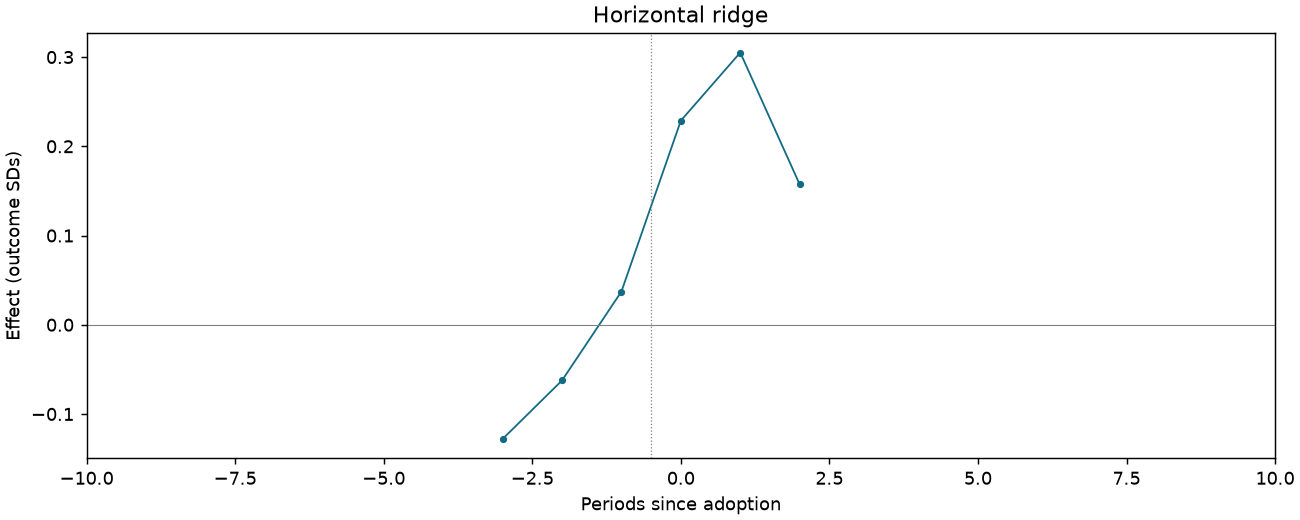
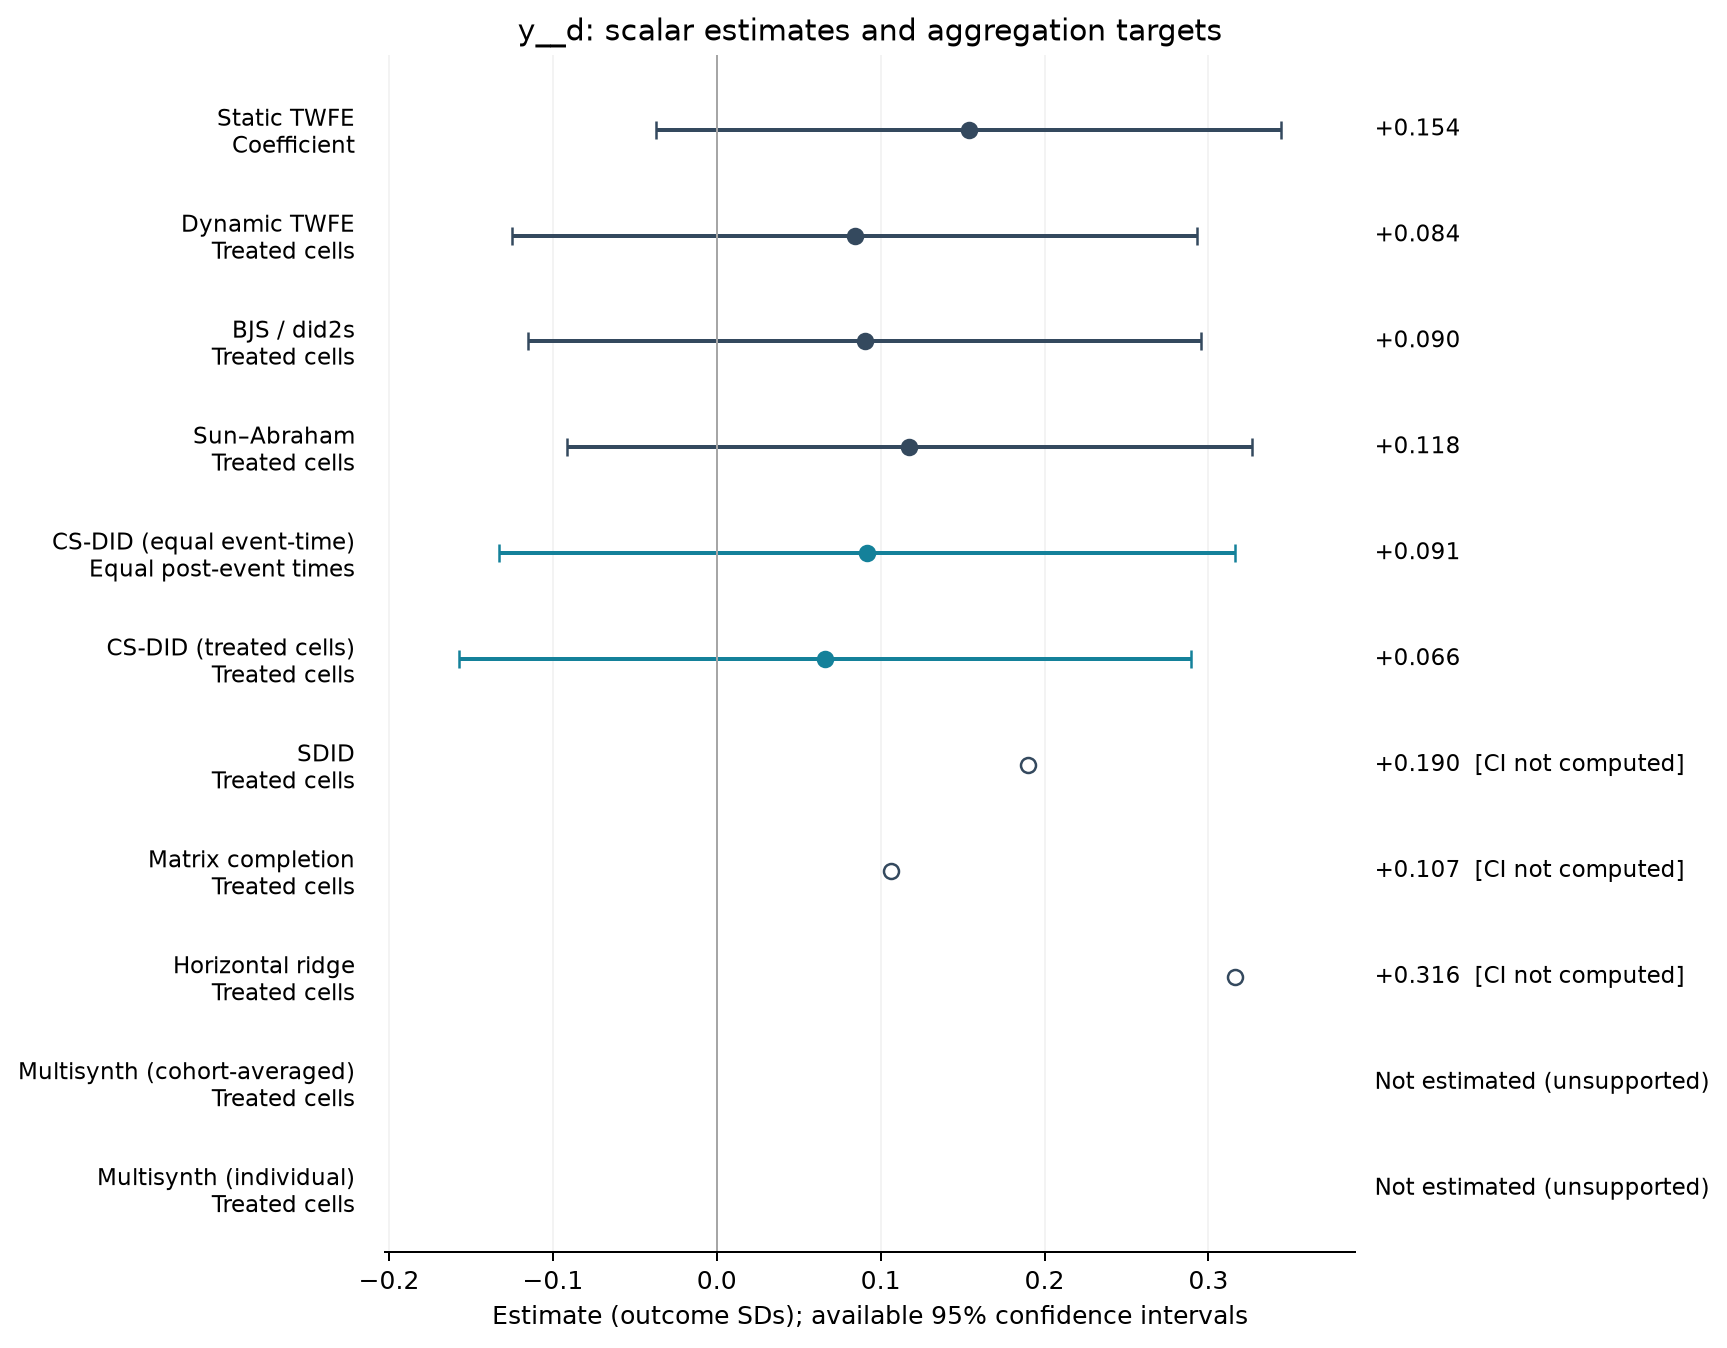
Perception of Chinese democracy z-score index [Table 3 original scale]
1,083 observations · 19 units · 19 clusters · 13 treated / 6 control units.
Estimate comparison
| Estimator | Estimate (SDs) | SE | 95% CI | Averaging |
|---|---|---|---|---|
| Static TWFE | 0.154 | 0.091 | [-0.037, 0.344] | Coefficient |
| Dynamic TWFE | 0.084 | 0.099 | [-0.125, 0.293] | Treated cells |
| BJS / did2s | 0.090 | 0.098 | [-0.115, 0.296] | Treated cells |
| Sun–Abraham | 0.118 | 0.099 | [-0.091, 0.326] | Treated cells |
| CS-DID (equal event-time) | 0.091 | 0.115 | [-0.133, 0.316] | Equal post-event times |
| CS-DID (treated cells) | 0.066 | 0.114 | [-0.157, 0.290] | Treated cells |
| SDID | 0.190 | — | — | Treated cells |
| Matrix completion | 0.107 | — | — | Treated cells |
| Horizontal ridge | 0.316 | — | — | Treated cells |
Event studies
Periods −10 to +10; pointwise 95% intervals where available.
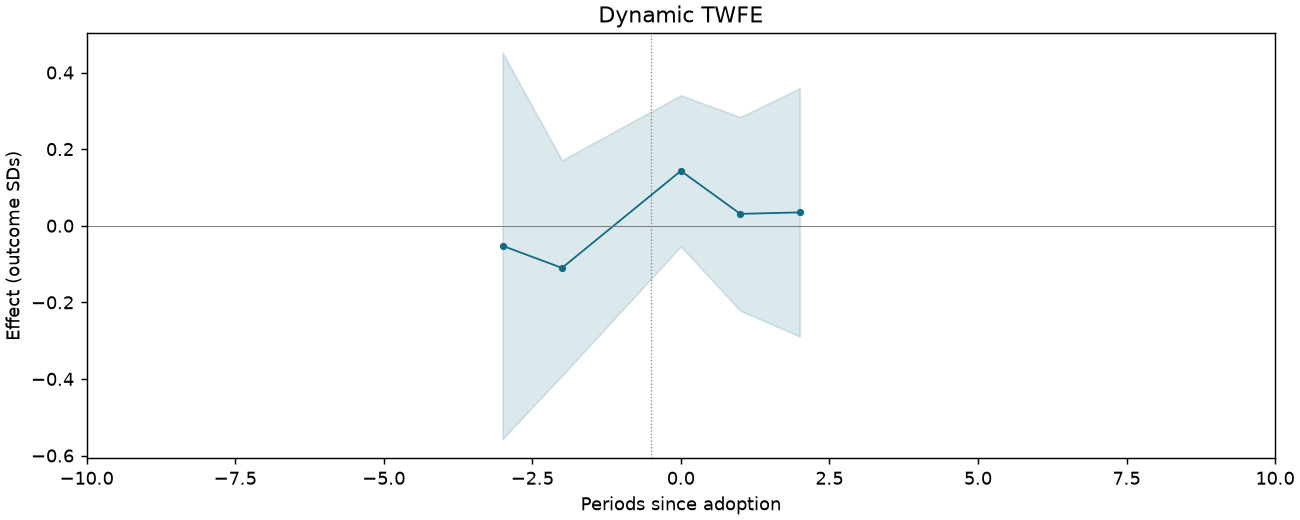
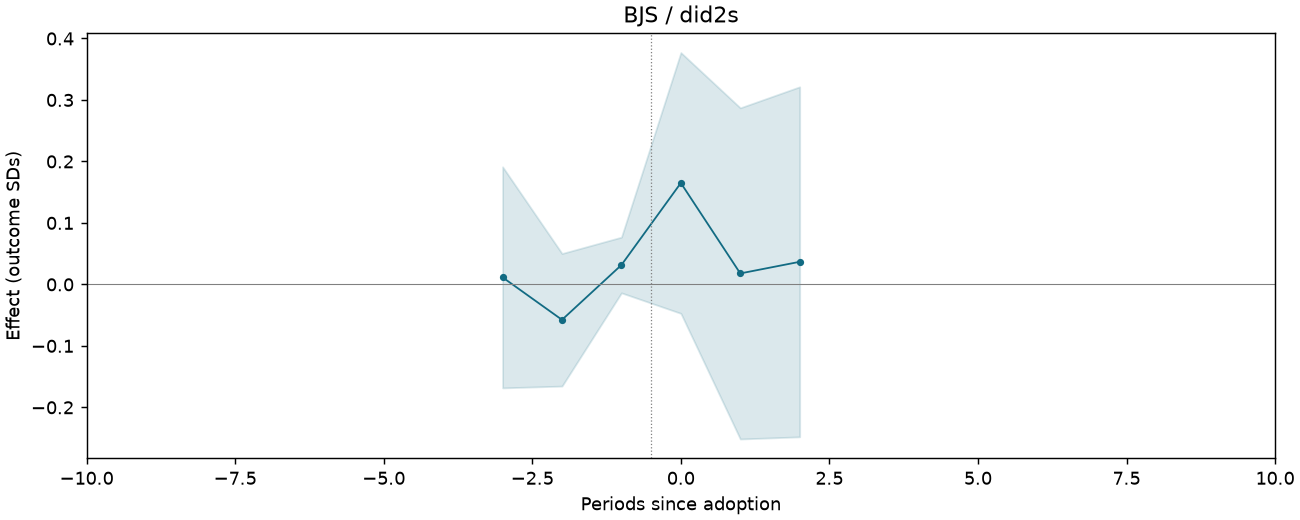
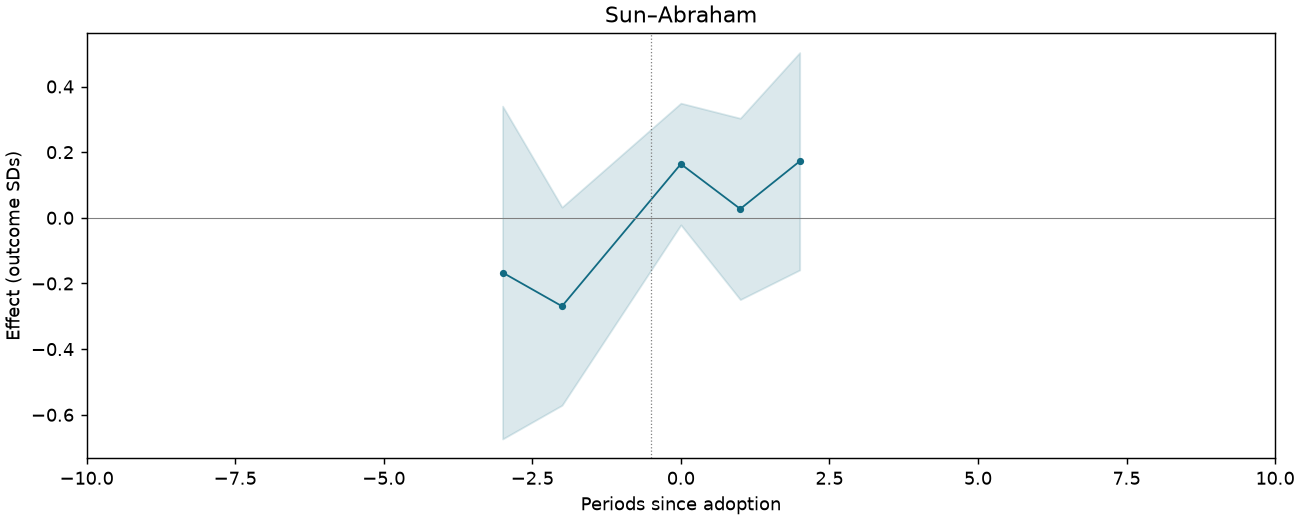
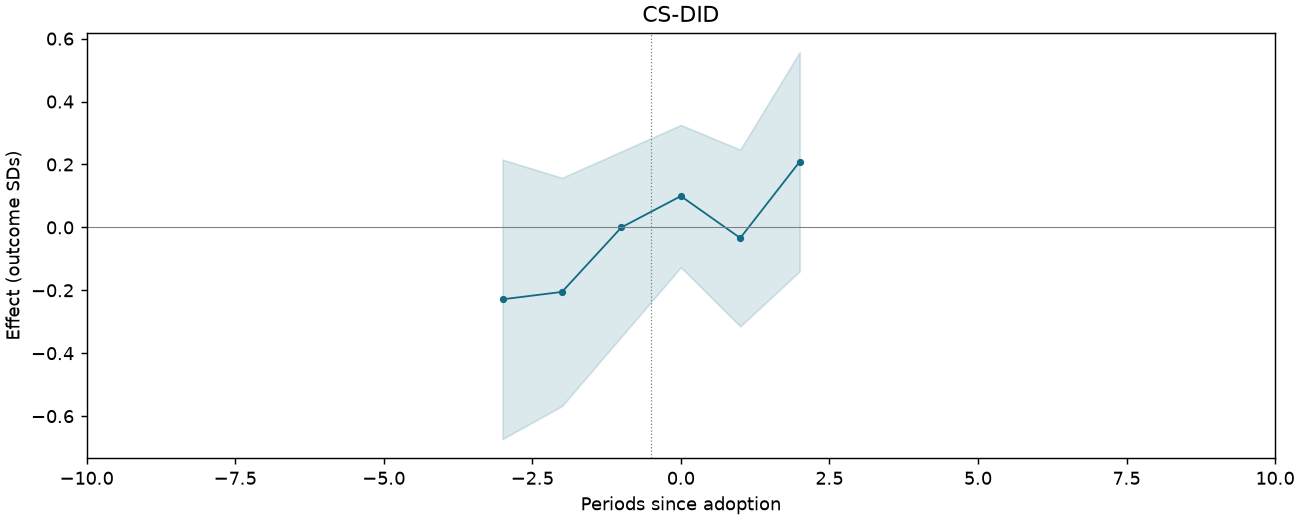
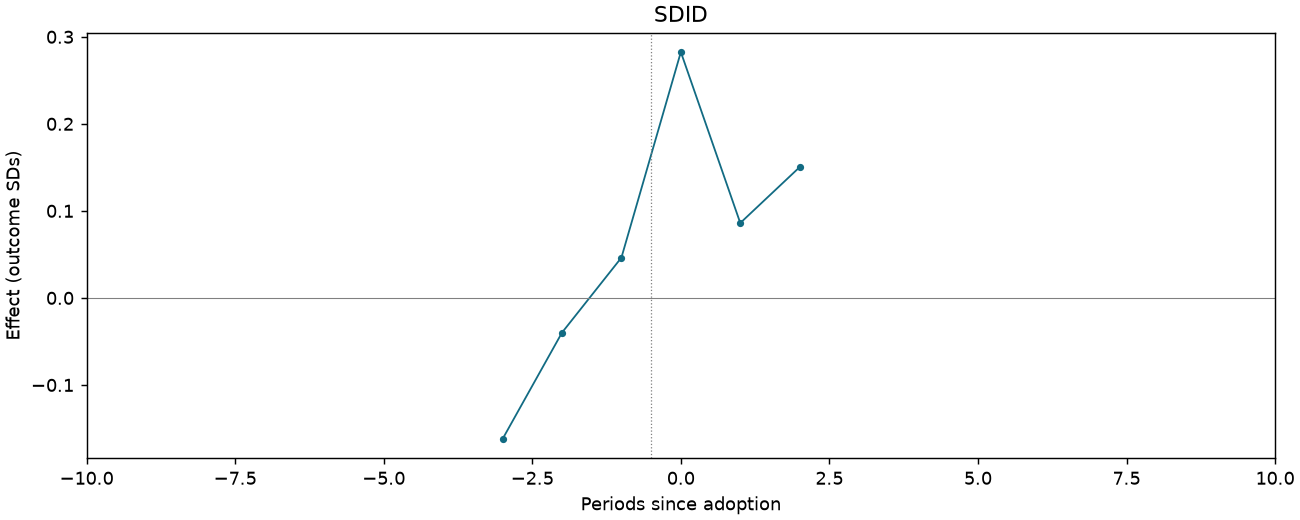
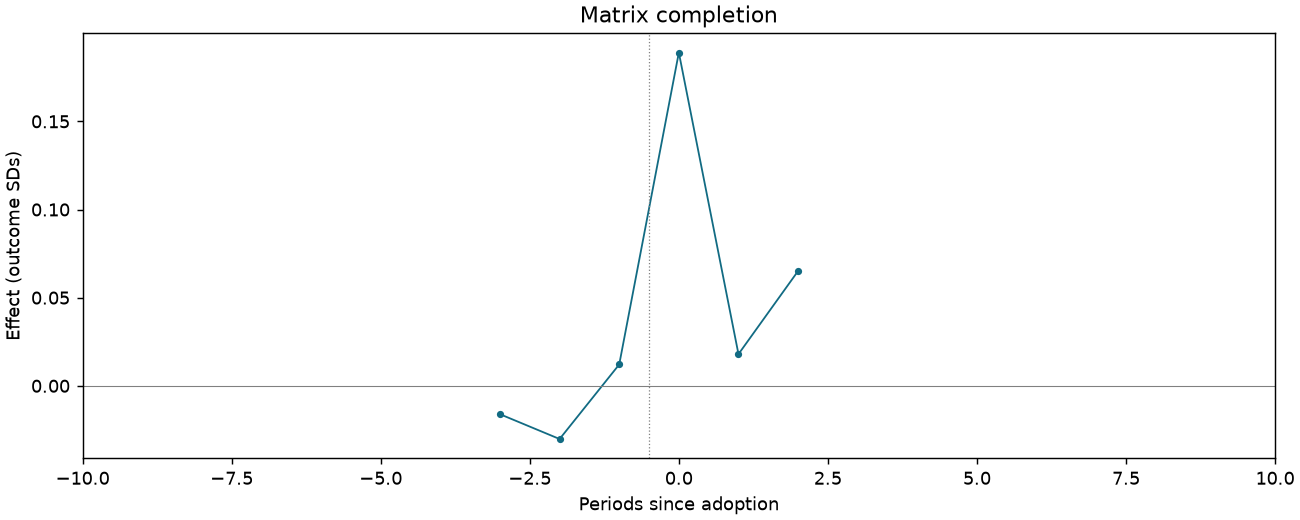
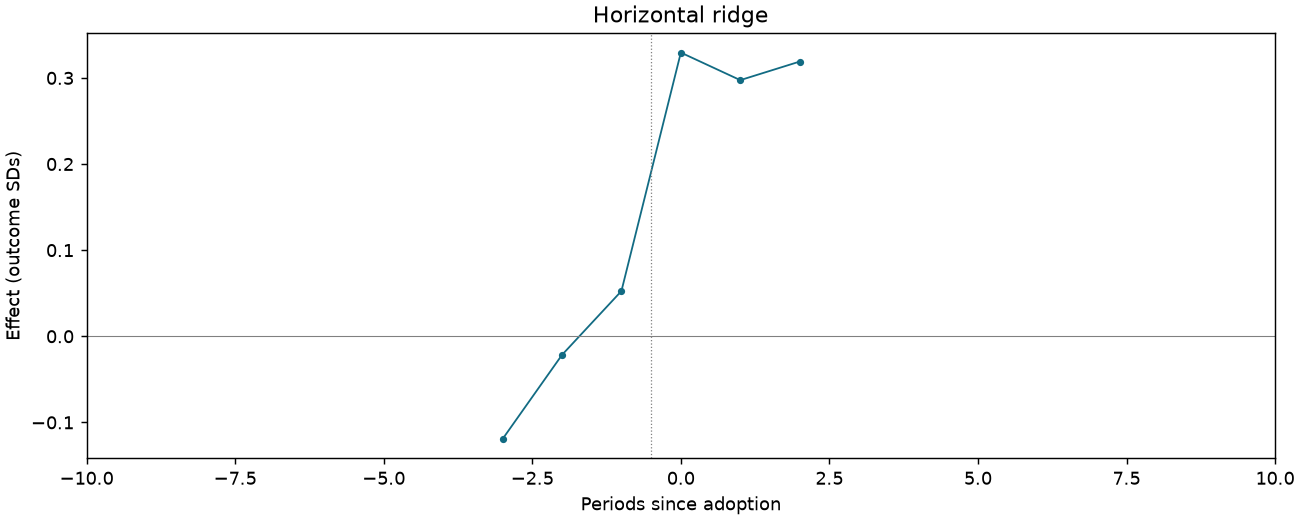
People cannot judge village head [Table 3 original scale]
1,101 observations · 19 units · 19 clusters · 13 treated / 6 control units.
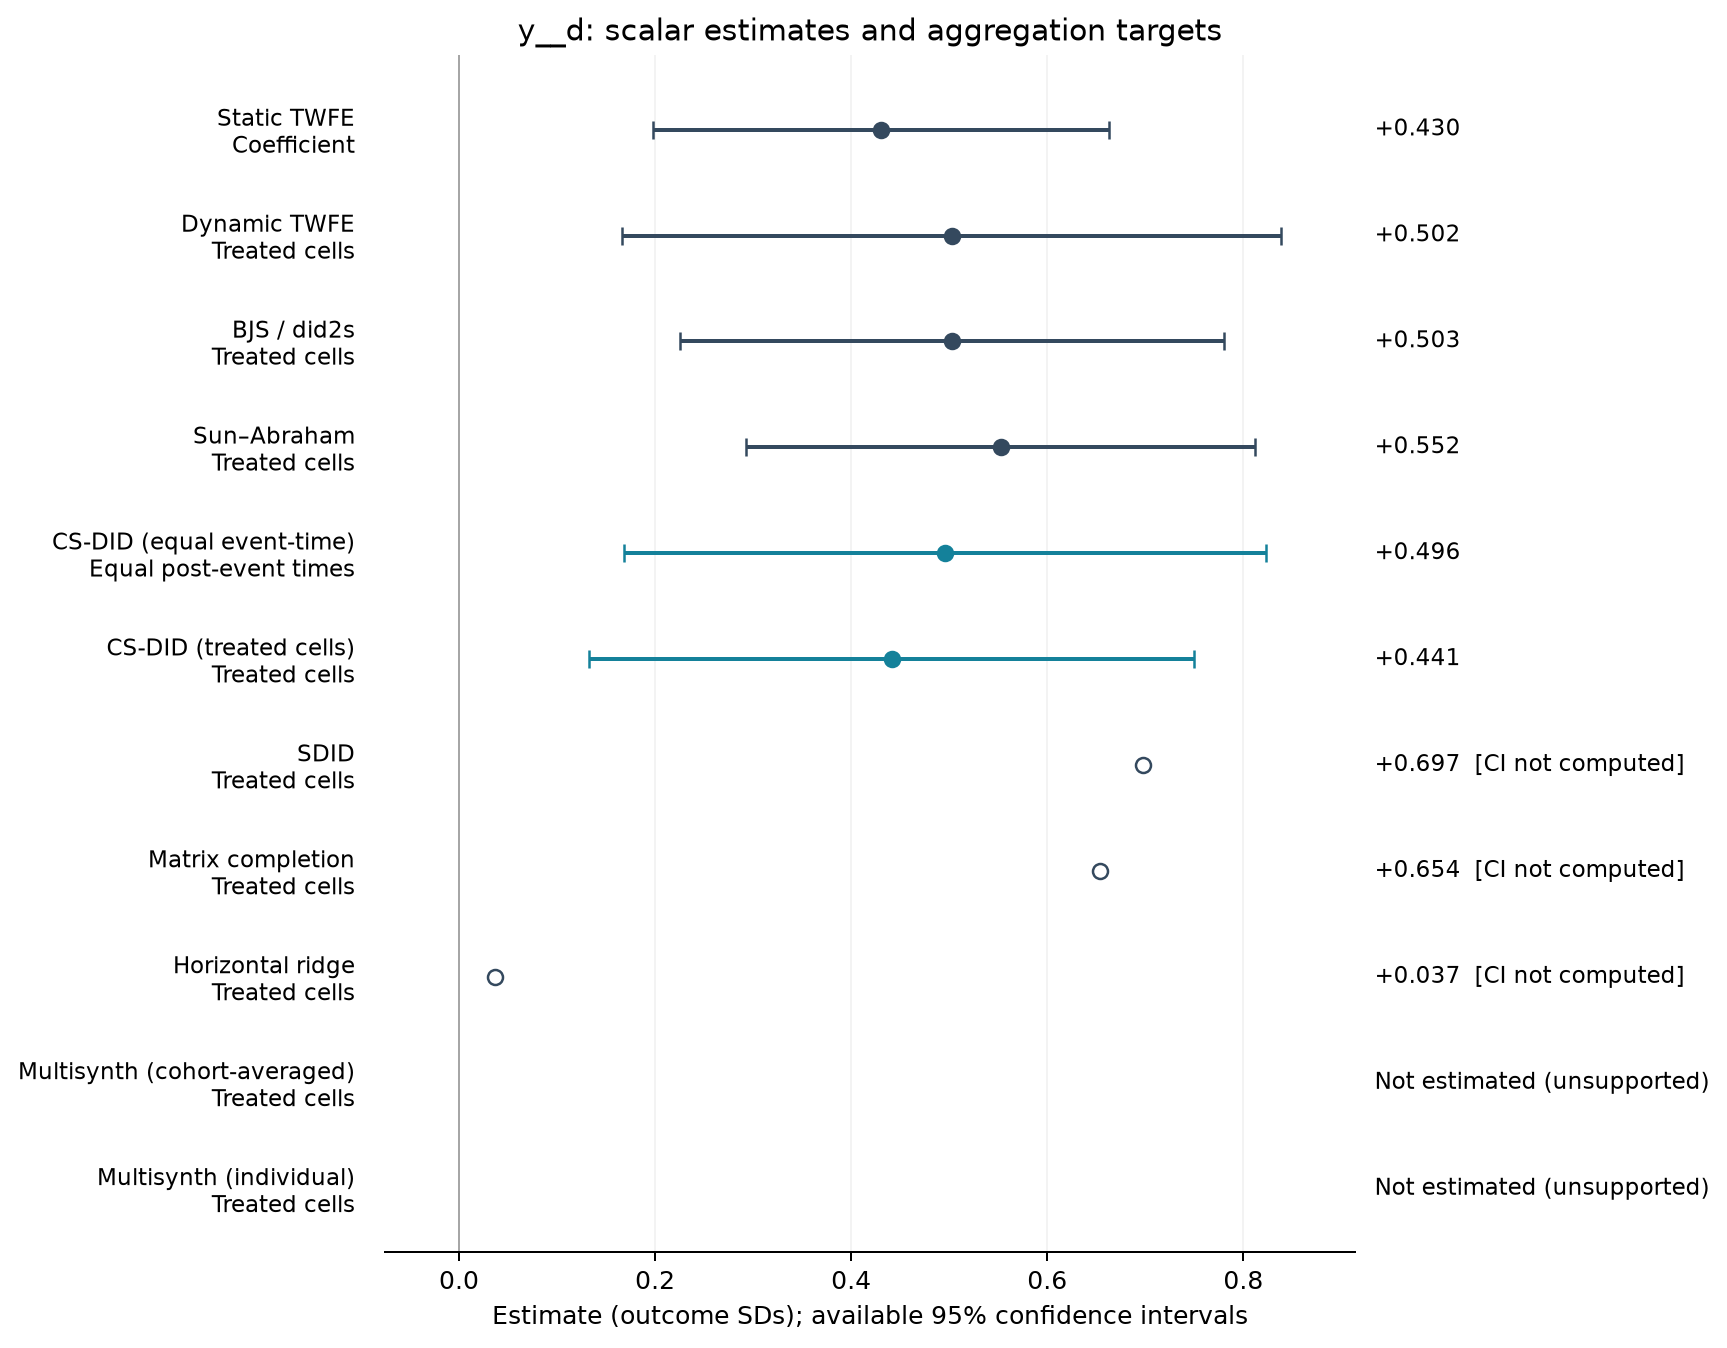
Estimate comparison
| Estimator | Estimate (SDs) | SE | 95% CI | Averaging |
|---|---|---|---|---|
| Static TWFE | 0.430 | 0.111 | [0.197, 0.663] | Coefficient |
| Dynamic TWFE | 0.502 | 0.160 | [0.166, 0.839] | Treated cells |
| BJS / did2s | 0.503 | 0.132 | [0.226, 0.780] | Treated cells |
| Sun–Abraham | 0.552 | 0.124 | [0.292, 0.812] | Treated cells |
| CS-DID (equal event-time) | 0.496 | 0.167 | [0.168, 0.823] | Equal post-event times |
| CS-DID (treated cells) | 0.441 | 0.157 | [0.133, 0.749] | Treated cells |
| SDID | 0.697 | — | — | Treated cells |
| Matrix completion | 0.654 | — | — | Treated cells |
| Horizontal ridge | 0.037 | — | — | Treated cells |
Event studies
Periods −10 to +10; pointwise 95% intervals where available.
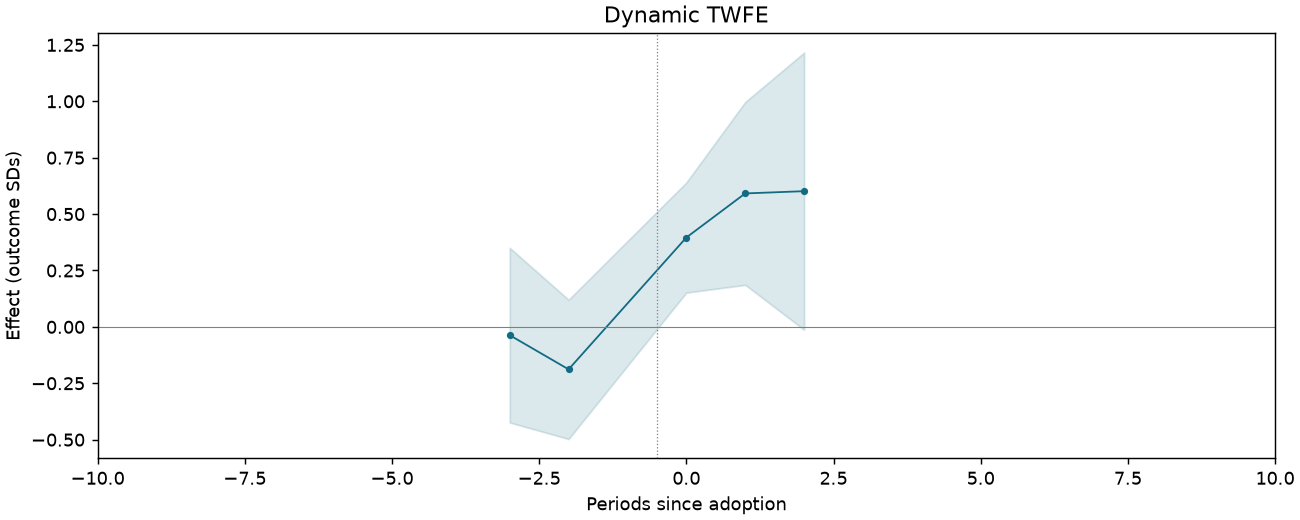
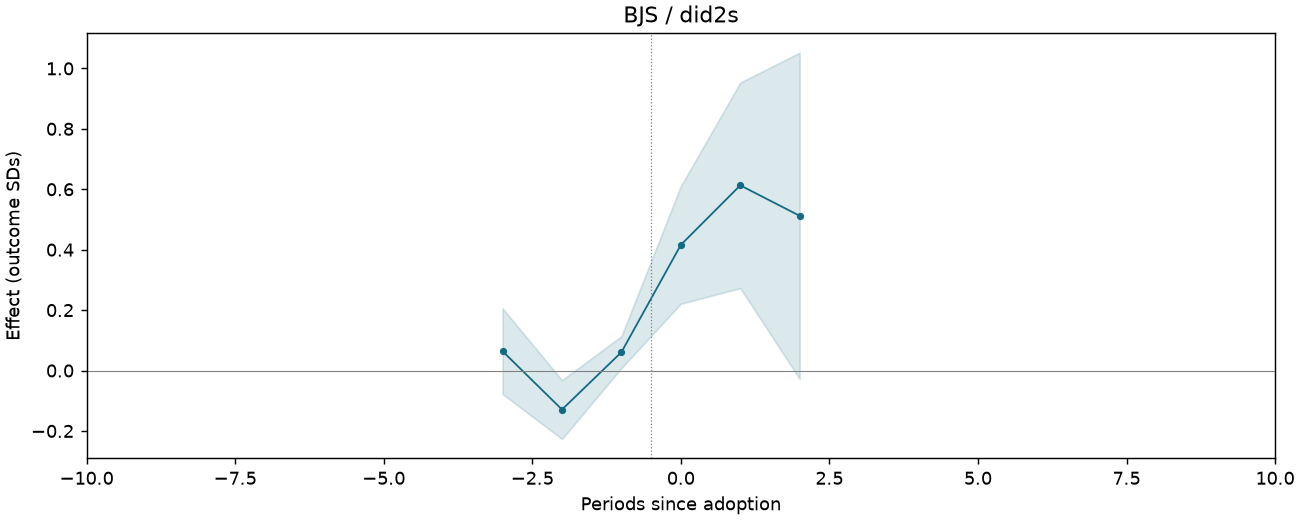
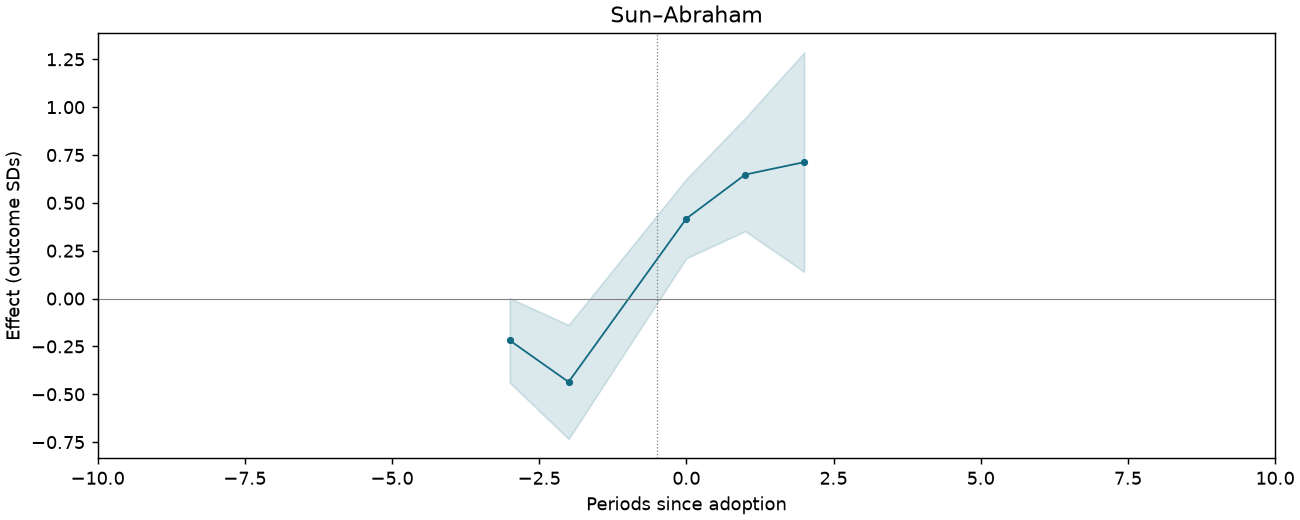
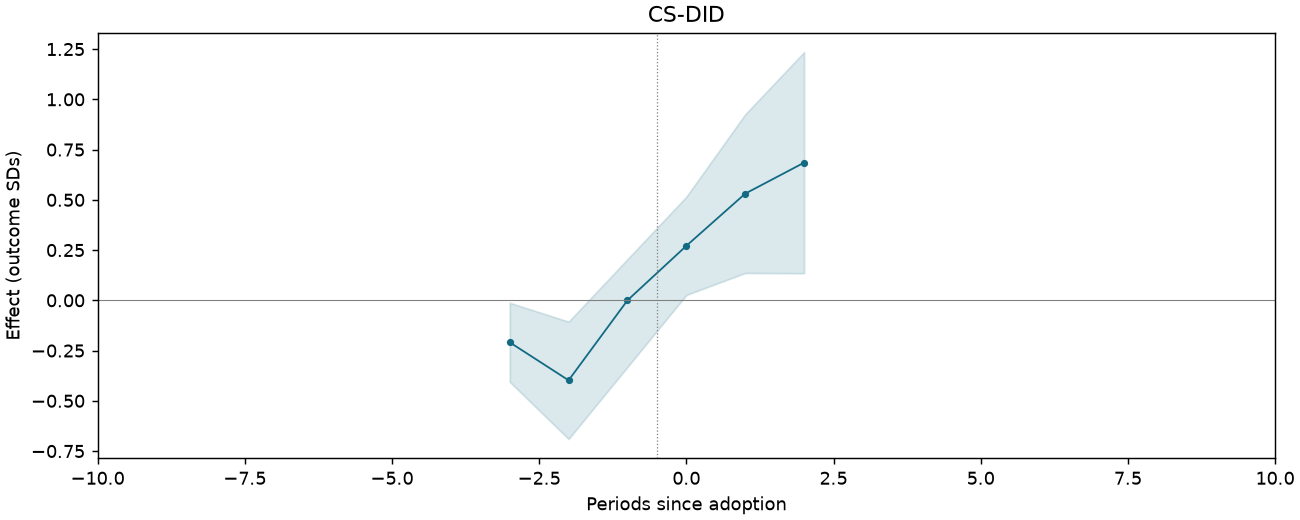
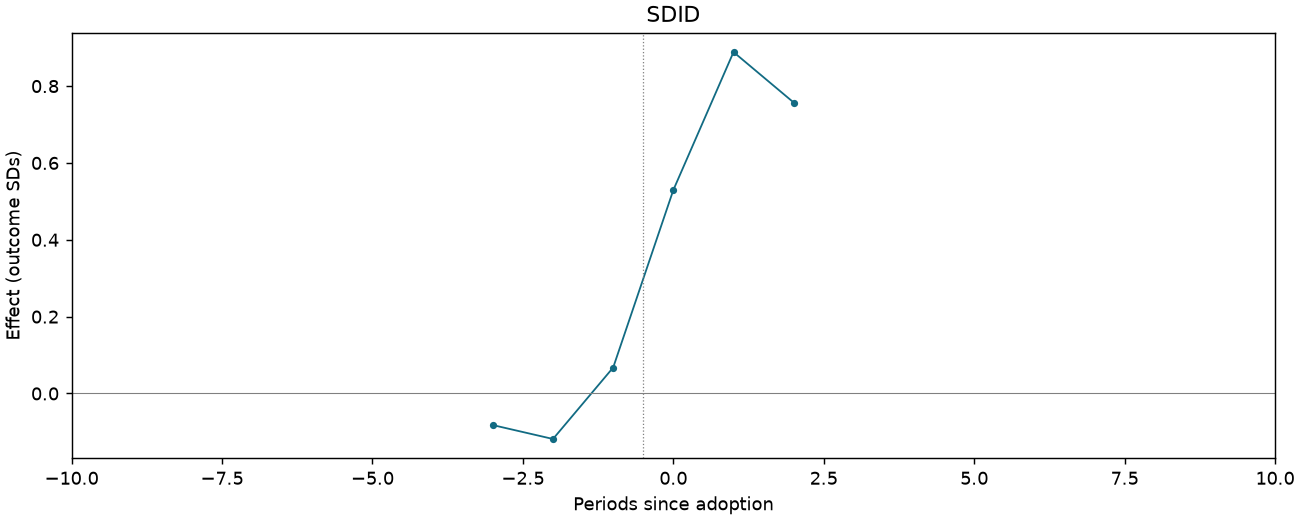
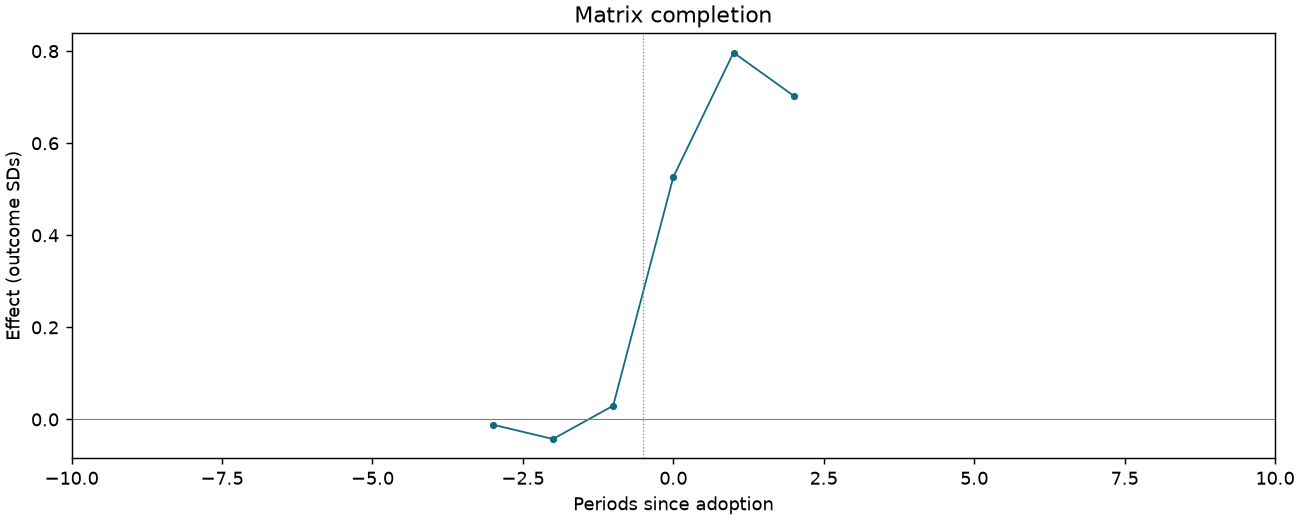
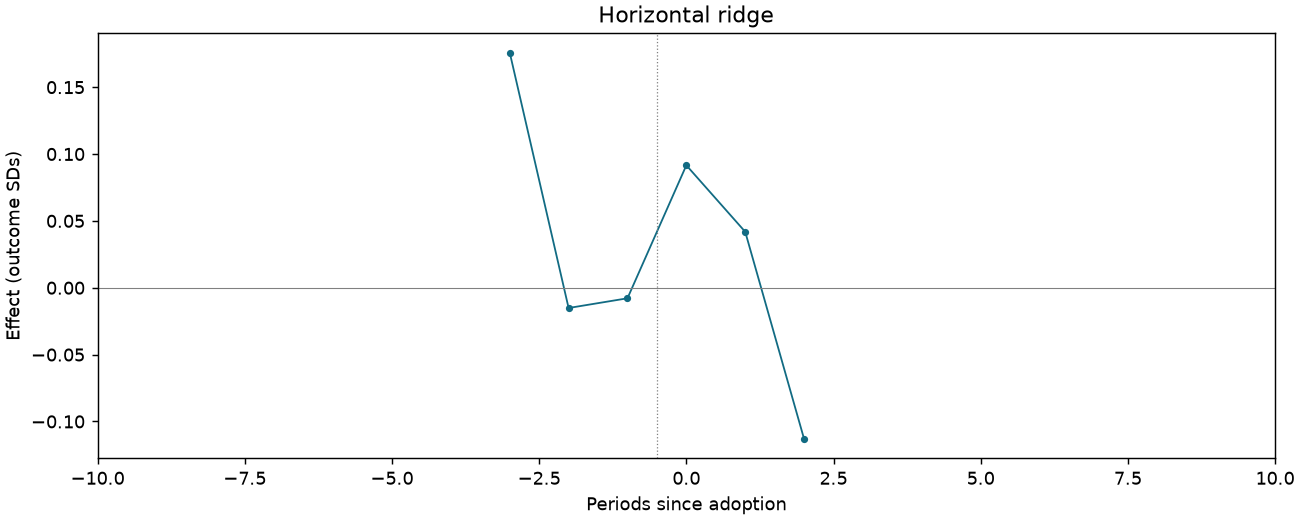
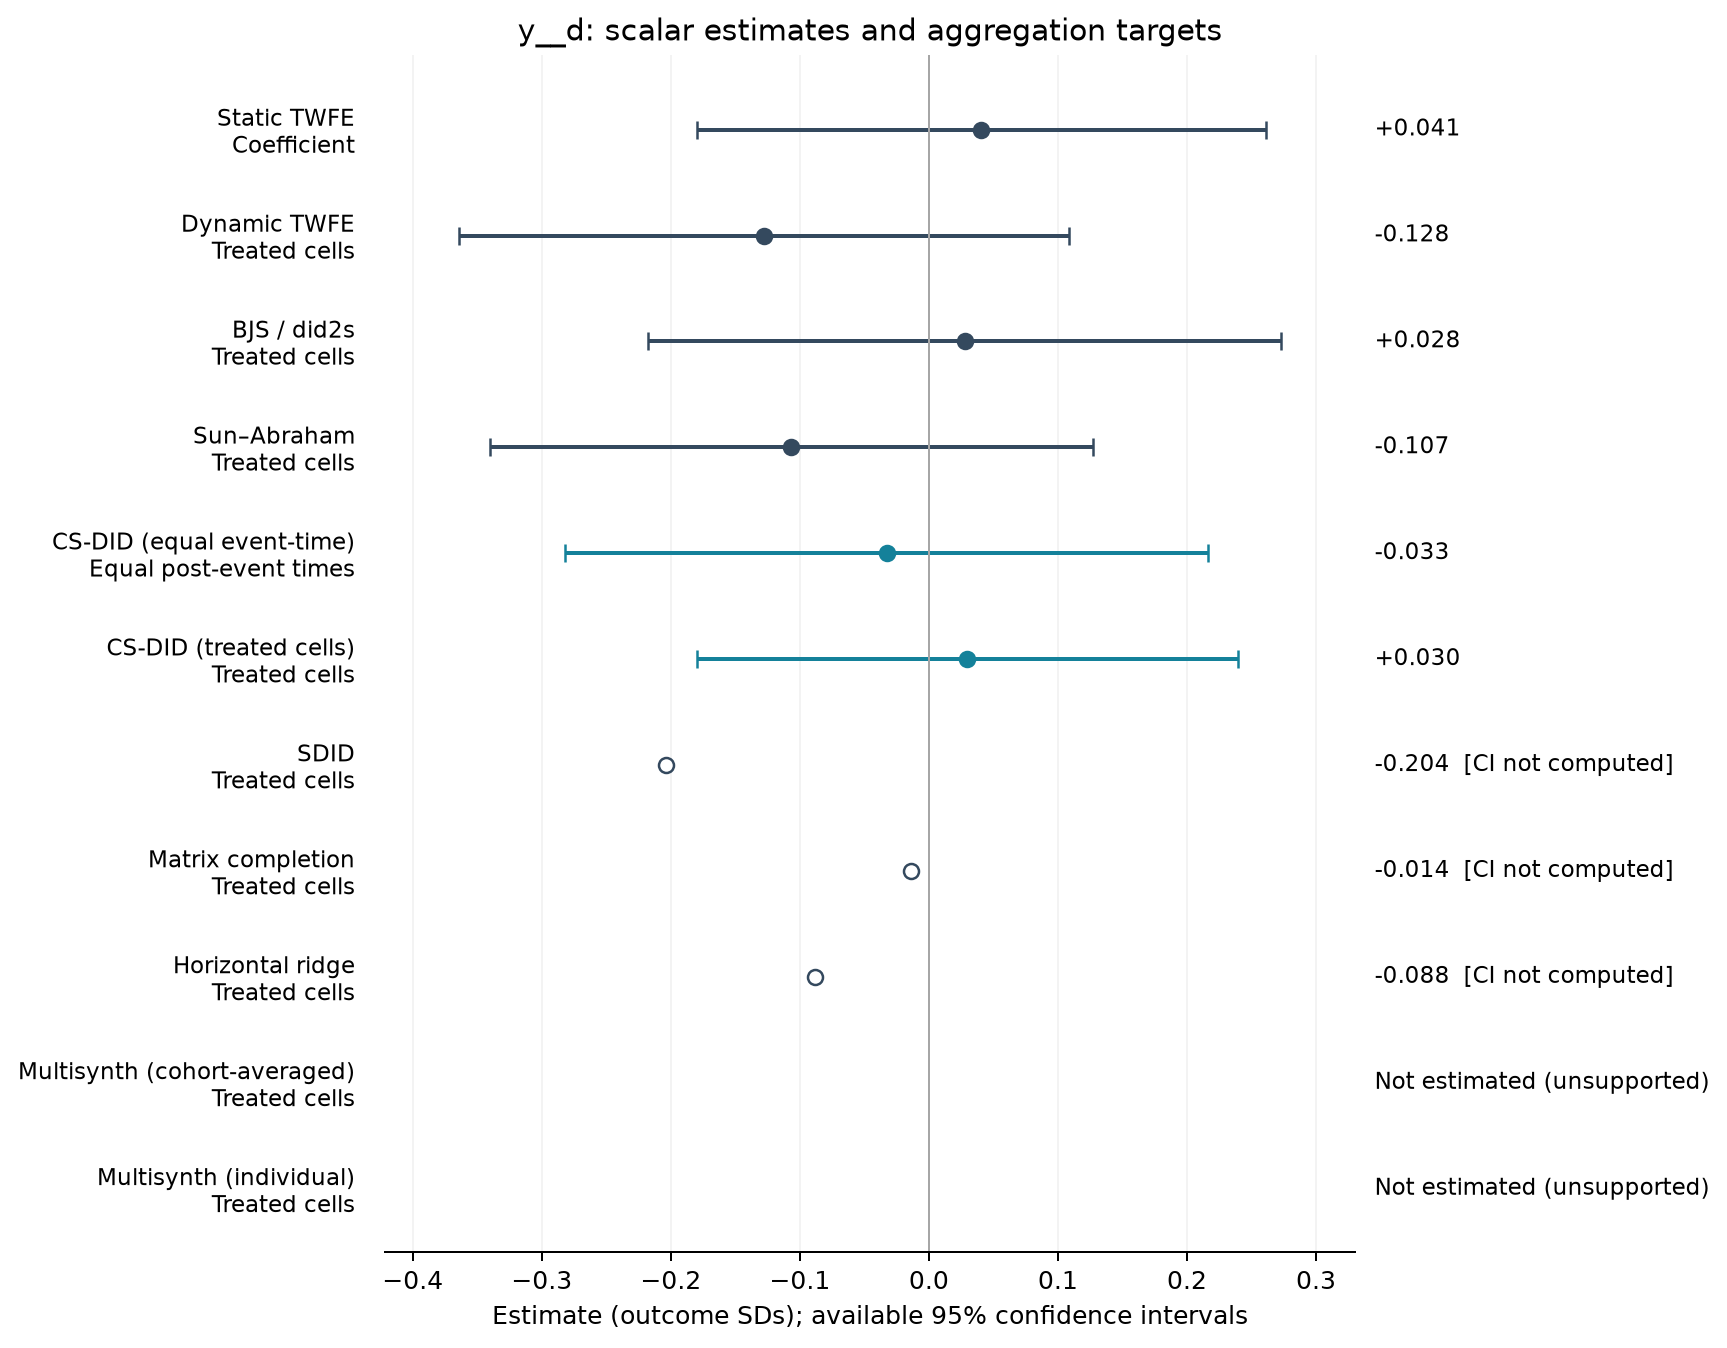
People should not influence elections [Table 3 original scale]
1,102 observations · 19 units · 19 clusters · 13 treated / 6 control units.
Estimate comparison
| Estimator | Estimate (SDs) | SE | 95% CI | Averaging |
|---|---|---|---|---|
| Static TWFE | 0.041 | 0.105 | [-0.180, 0.261] | Coefficient |
| Dynamic TWFE | -0.128 | 0.112 | [-0.364, 0.108] | Treated cells |
| BJS / did2s | 0.028 | 0.117 | [-0.218, 0.273] | Treated cells |
| Sun–Abraham | -0.107 | 0.111 | [-0.340, 0.127] | Treated cells |
| CS-DID (equal event-time) | -0.033 | 0.127 | [-0.282, 0.217] | Equal post-event times |
| CS-DID (treated cells) | 0.030 | 0.107 | [-0.180, 0.240] | Treated cells |
| SDID | -0.204 | — | — | Treated cells |
| Matrix completion | -0.014 | — | — | Treated cells |
| Horizontal ridge | -0.088 | — | — | Treated cells |
Event studies
Periods −10 to +10; pointwise 95% intervals where available.
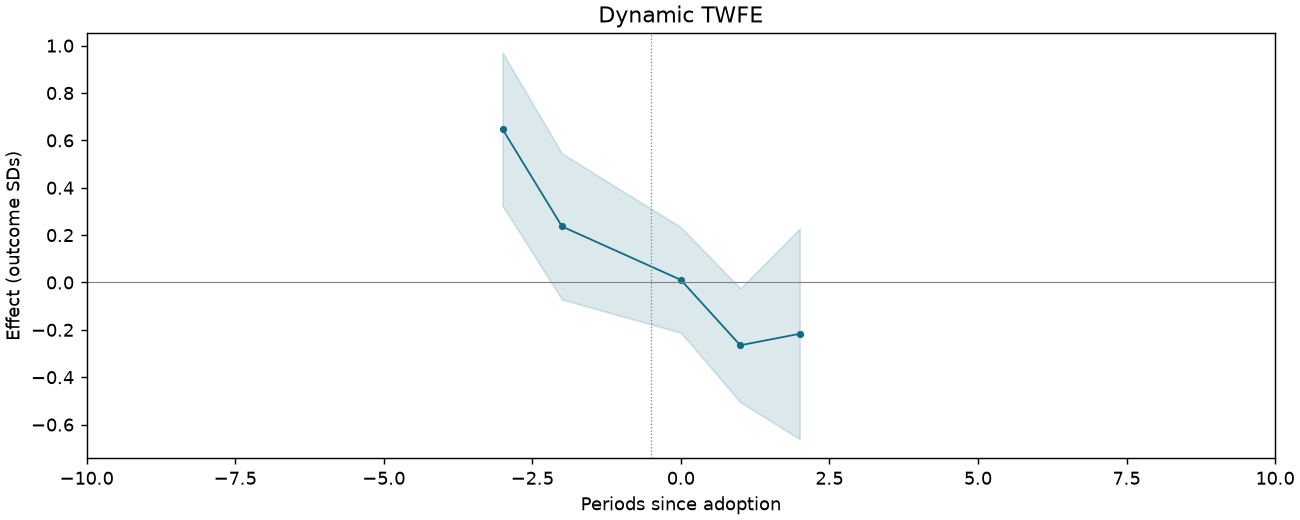
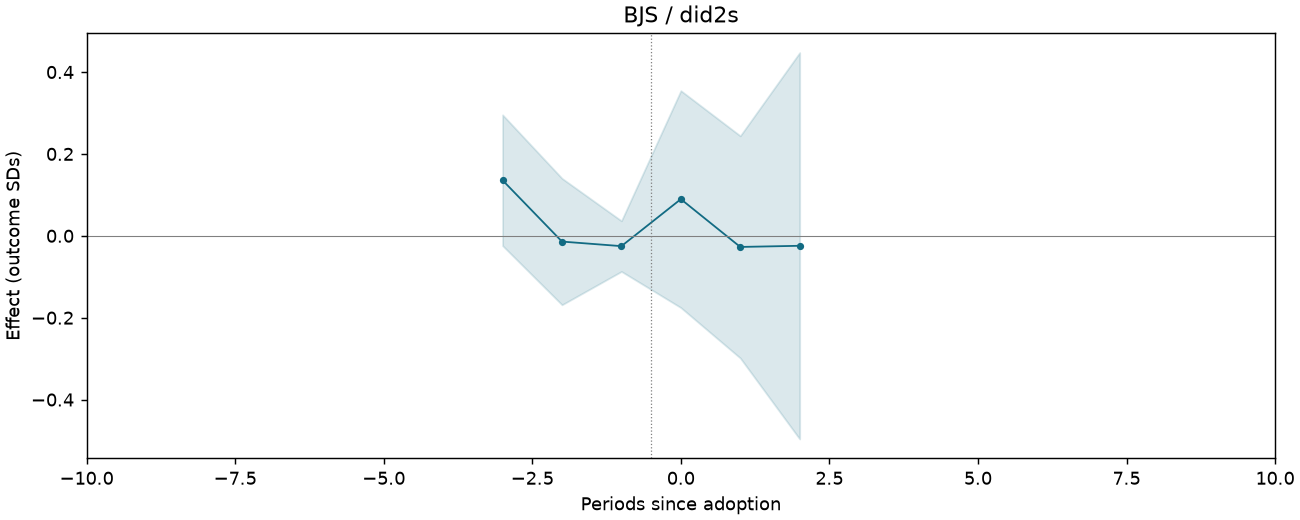
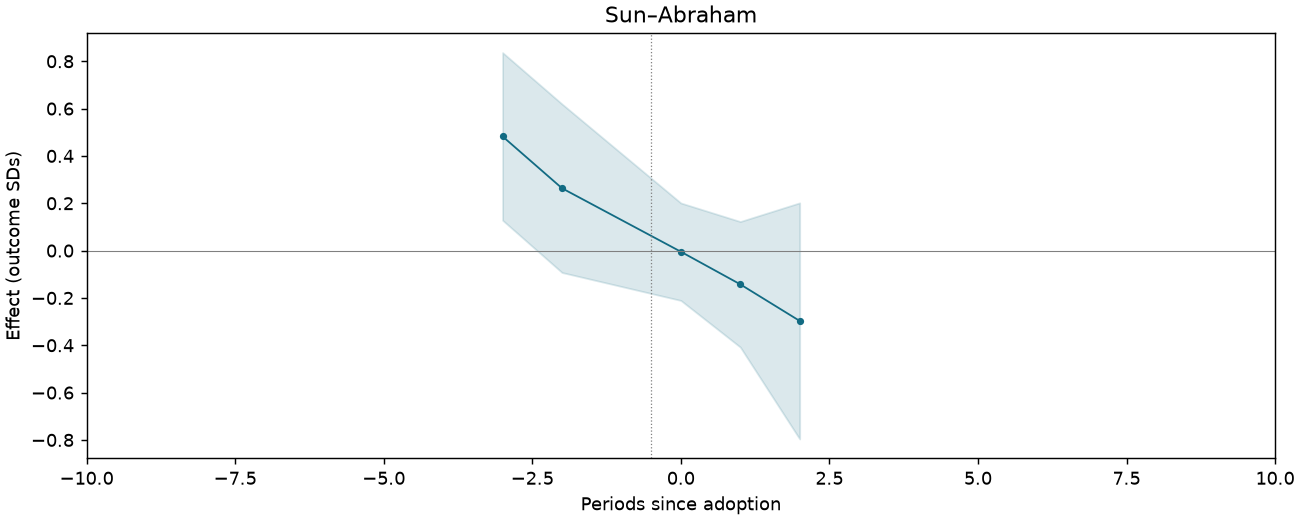
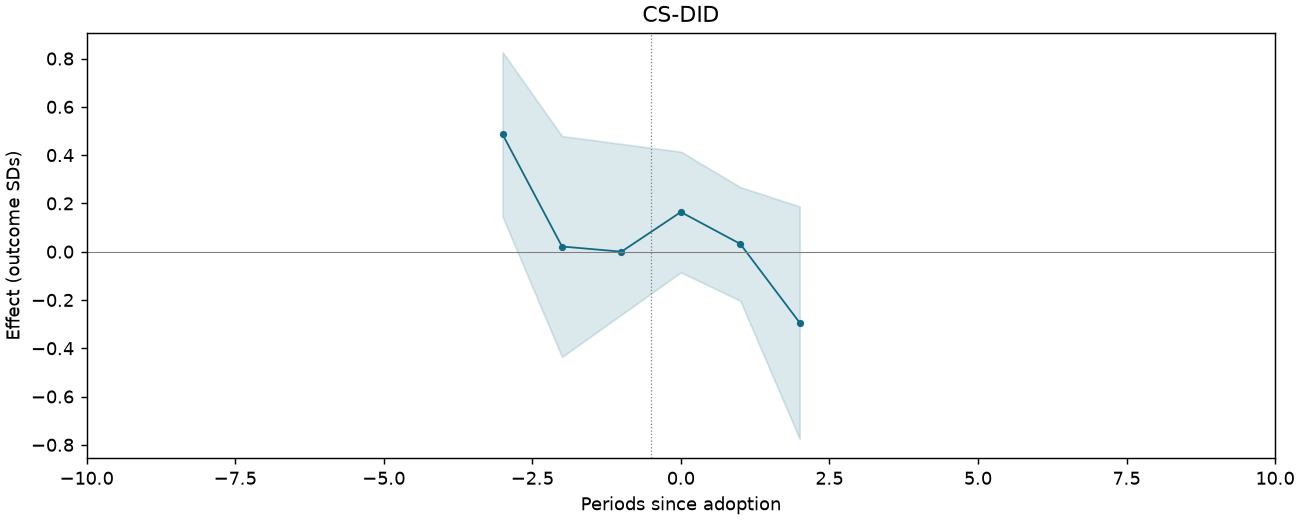
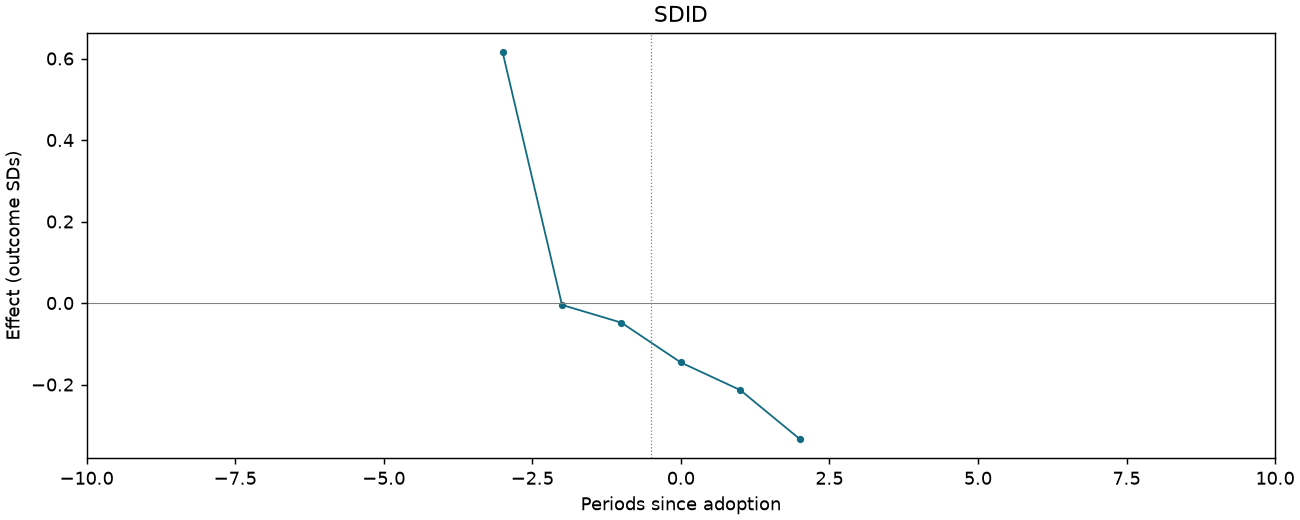
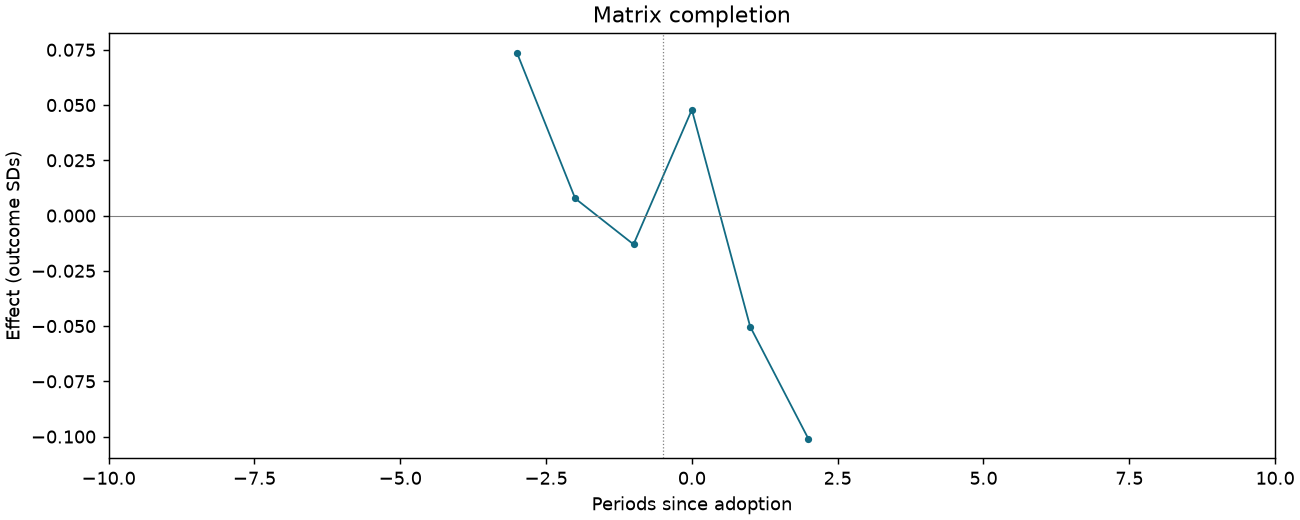
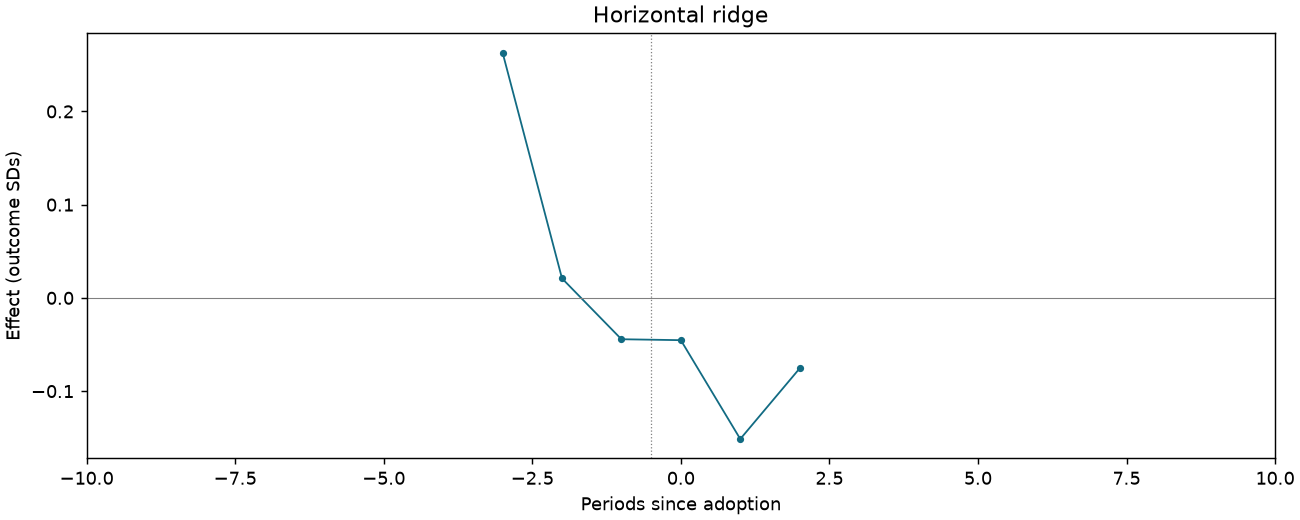
People do not know better leaders [Table 3 original scale]
1,101 observations · 19 units · 19 clusters · 13 treated / 6 control units.
Estimate comparison
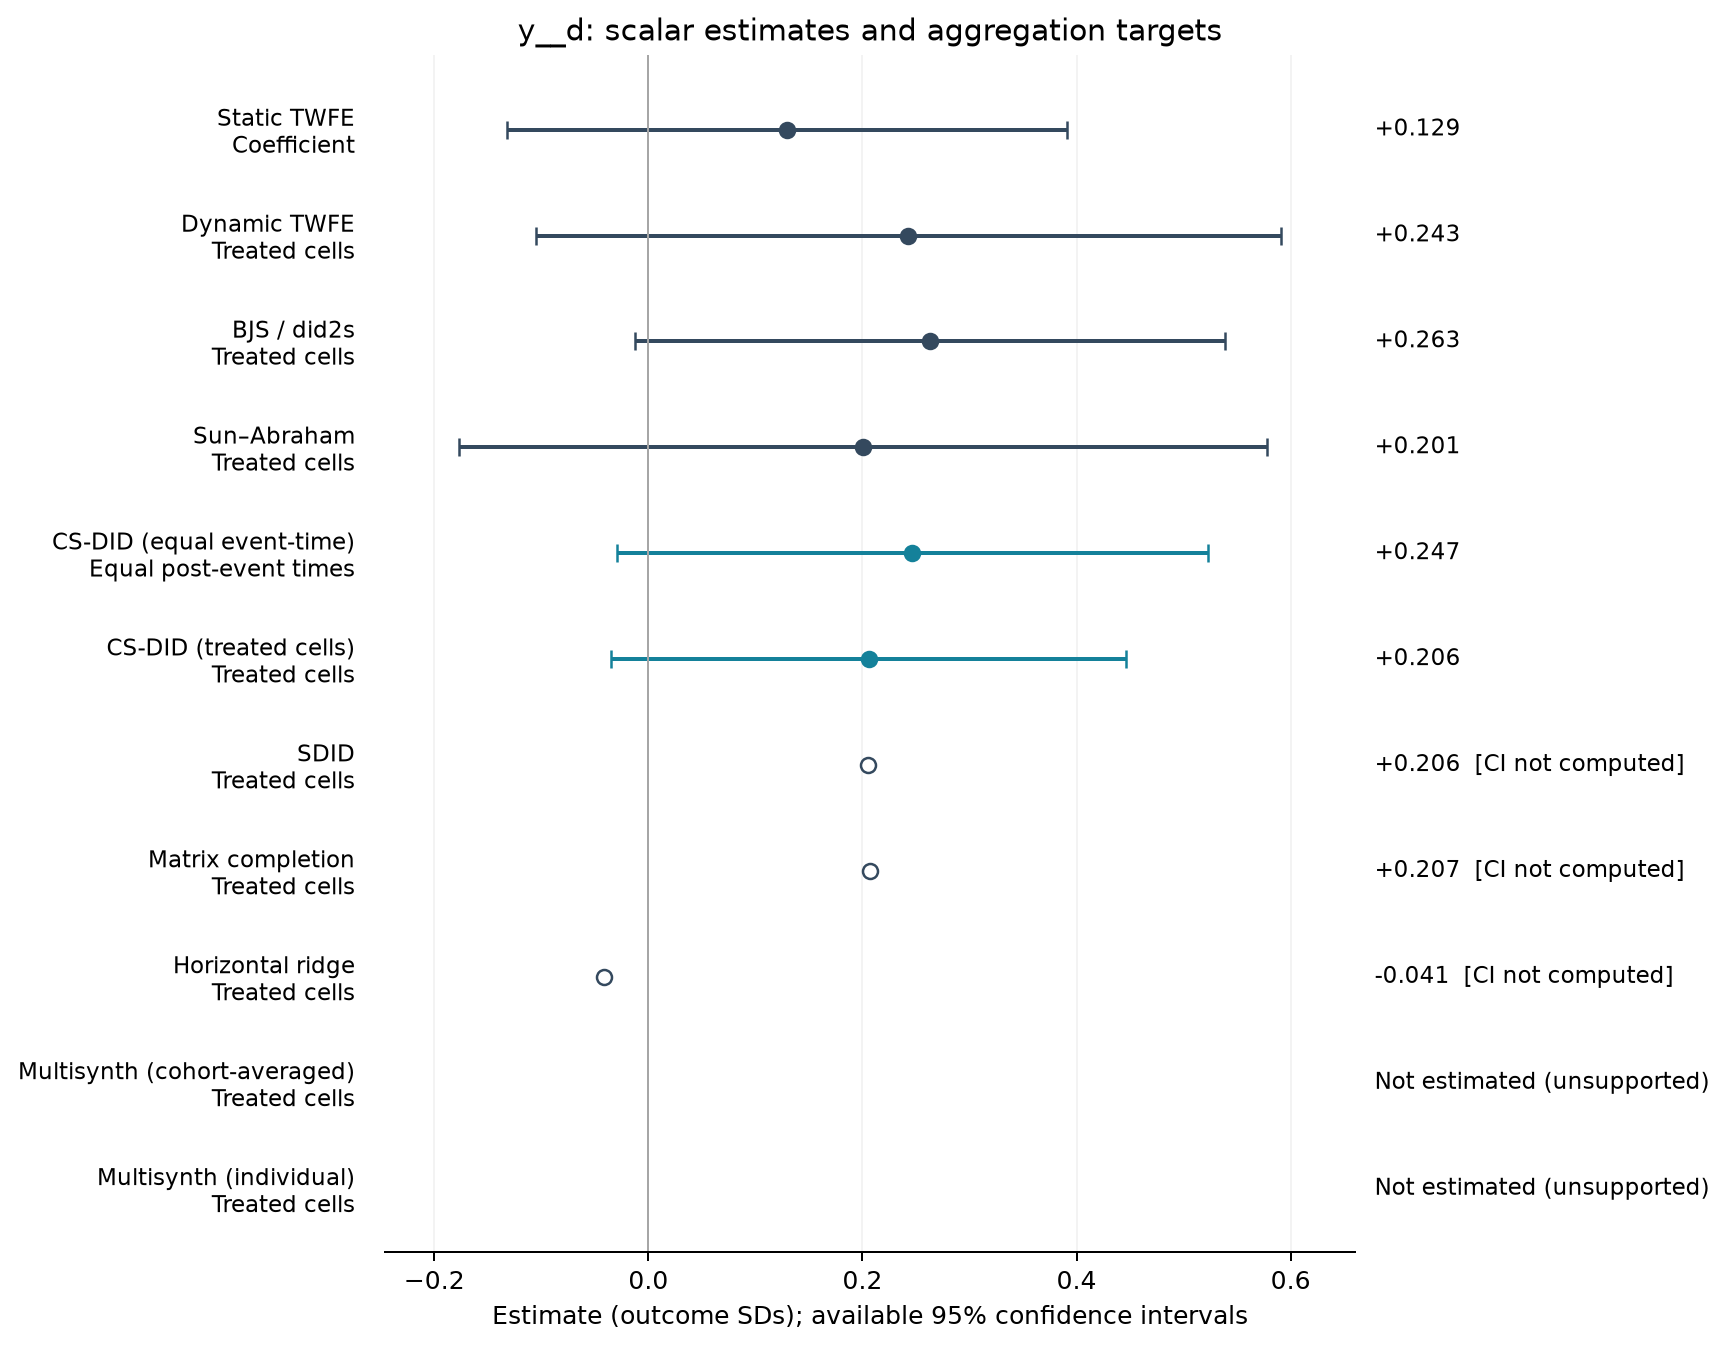
| Estimator | Estimate (SDs) | SE | 95% CI | Averaging |
|---|---|---|---|---|
| Static TWFE | 0.129 | 0.124 | [-0.132, 0.391] | Coefficient |
| Dynamic TWFE | 0.243 | 0.166 | [-0.105, 0.591] | Treated cells |
| BJS / did2s | 0.263 | 0.131 | [-0.012, 0.539] | Treated cells |
| Sun–Abraham | 0.201 | 0.180 | [-0.177, 0.578] | Treated cells |
| CS-DID (equal event-time) | 0.247 | 0.141 | [-0.029, 0.523] | Equal post-event times |
| CS-DID (treated cells) | 0.206 | 0.123 | [-0.035, 0.446] | Treated cells |
| SDID | 0.206 | — | — | Treated cells |
| Matrix completion | 0.207 | — | — | Treated cells |
| Horizontal ridge | -0.041 | — | — | Treated cells |
Event studies
Periods −10 to +10; pointwise 95% intervals where available.
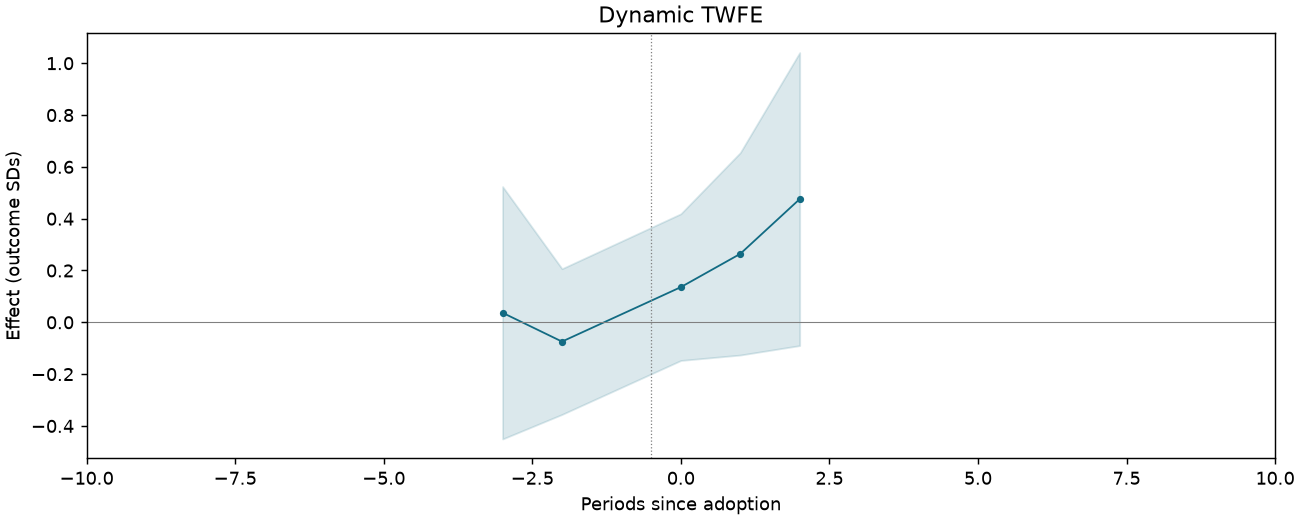
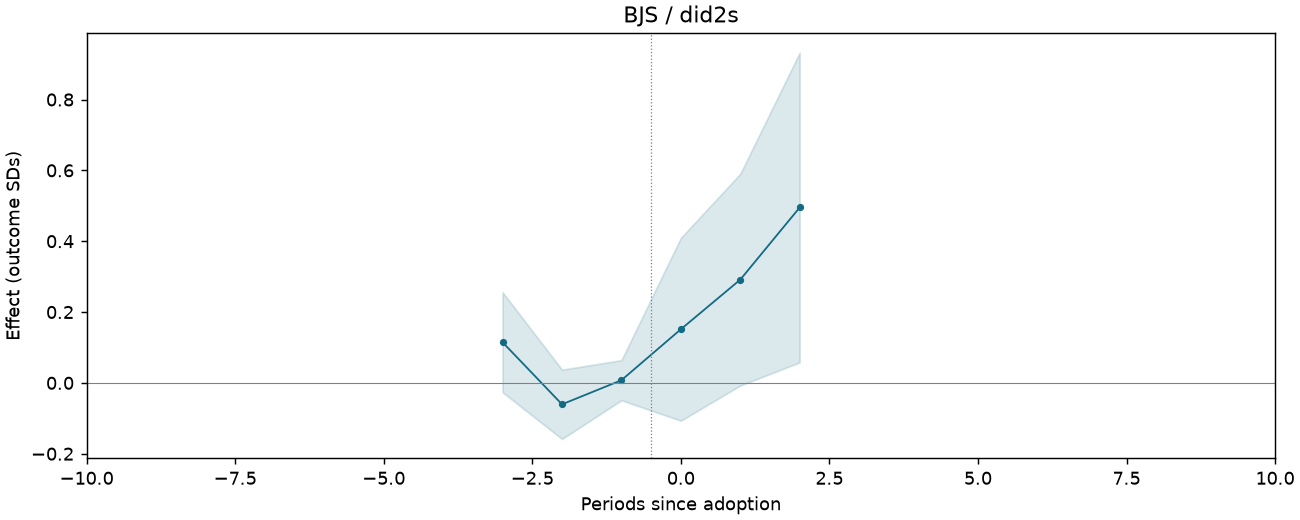
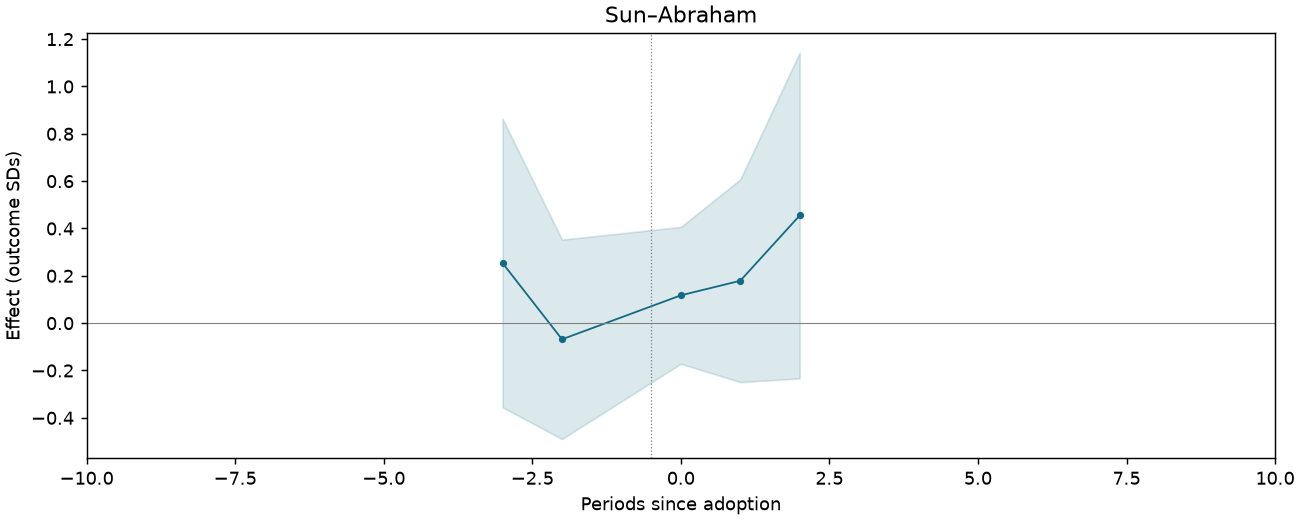
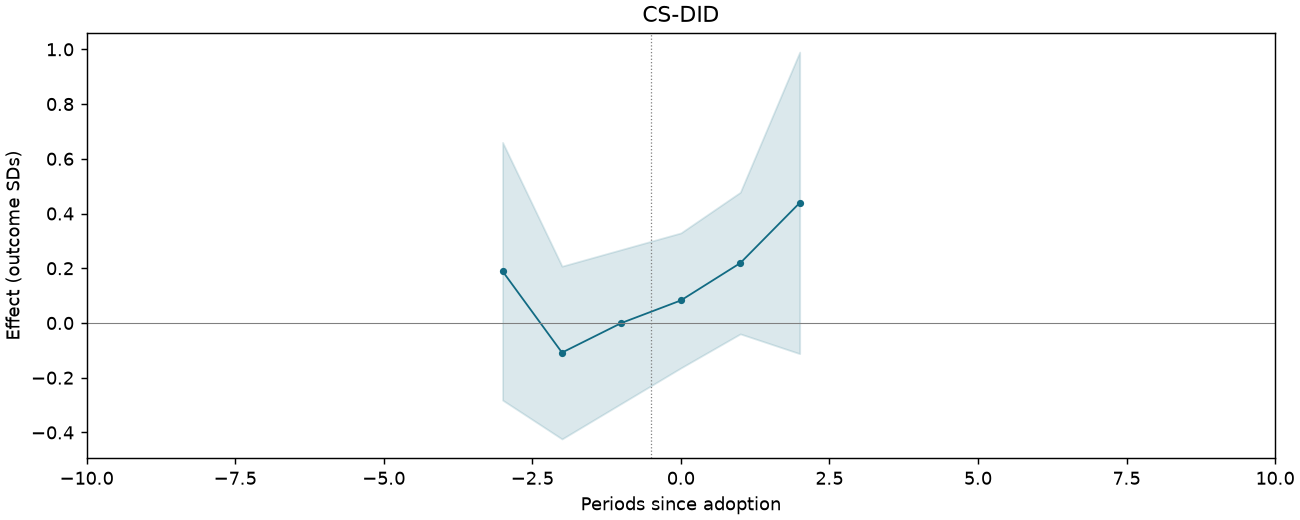
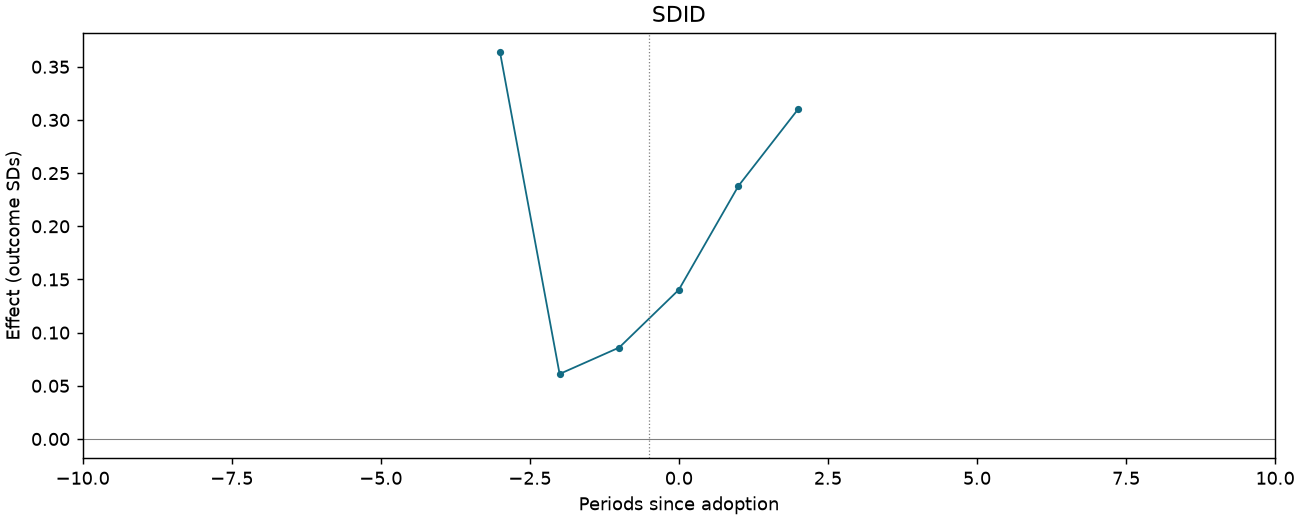
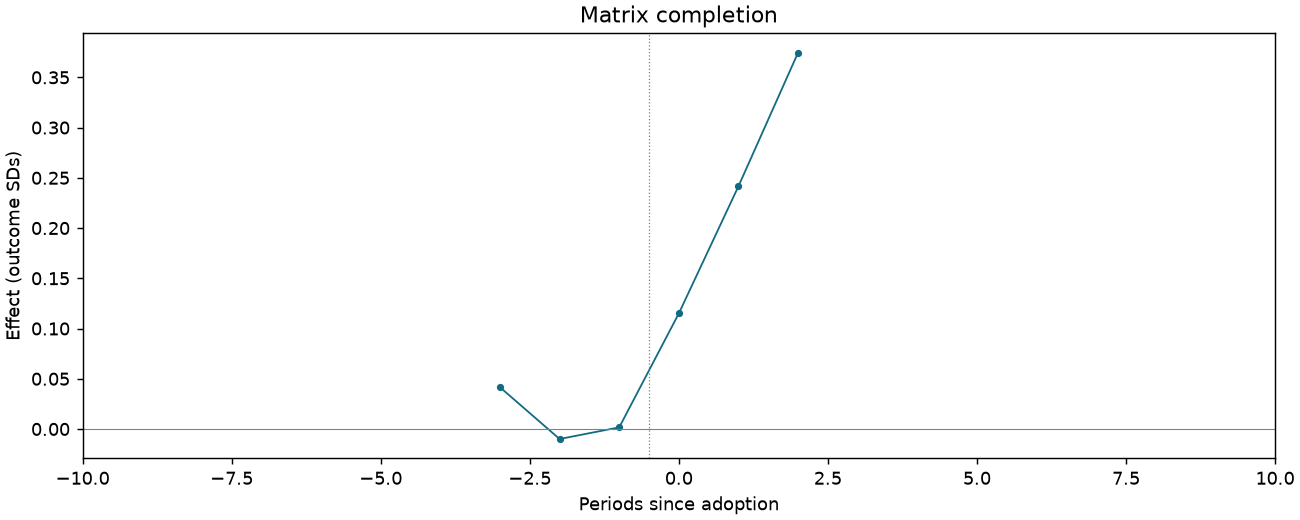
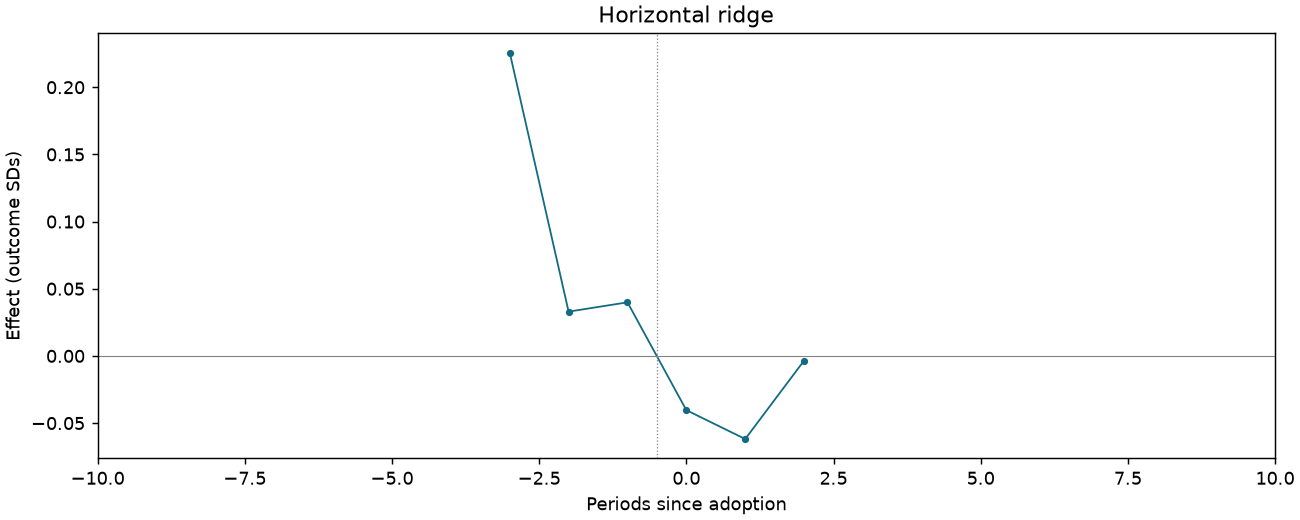
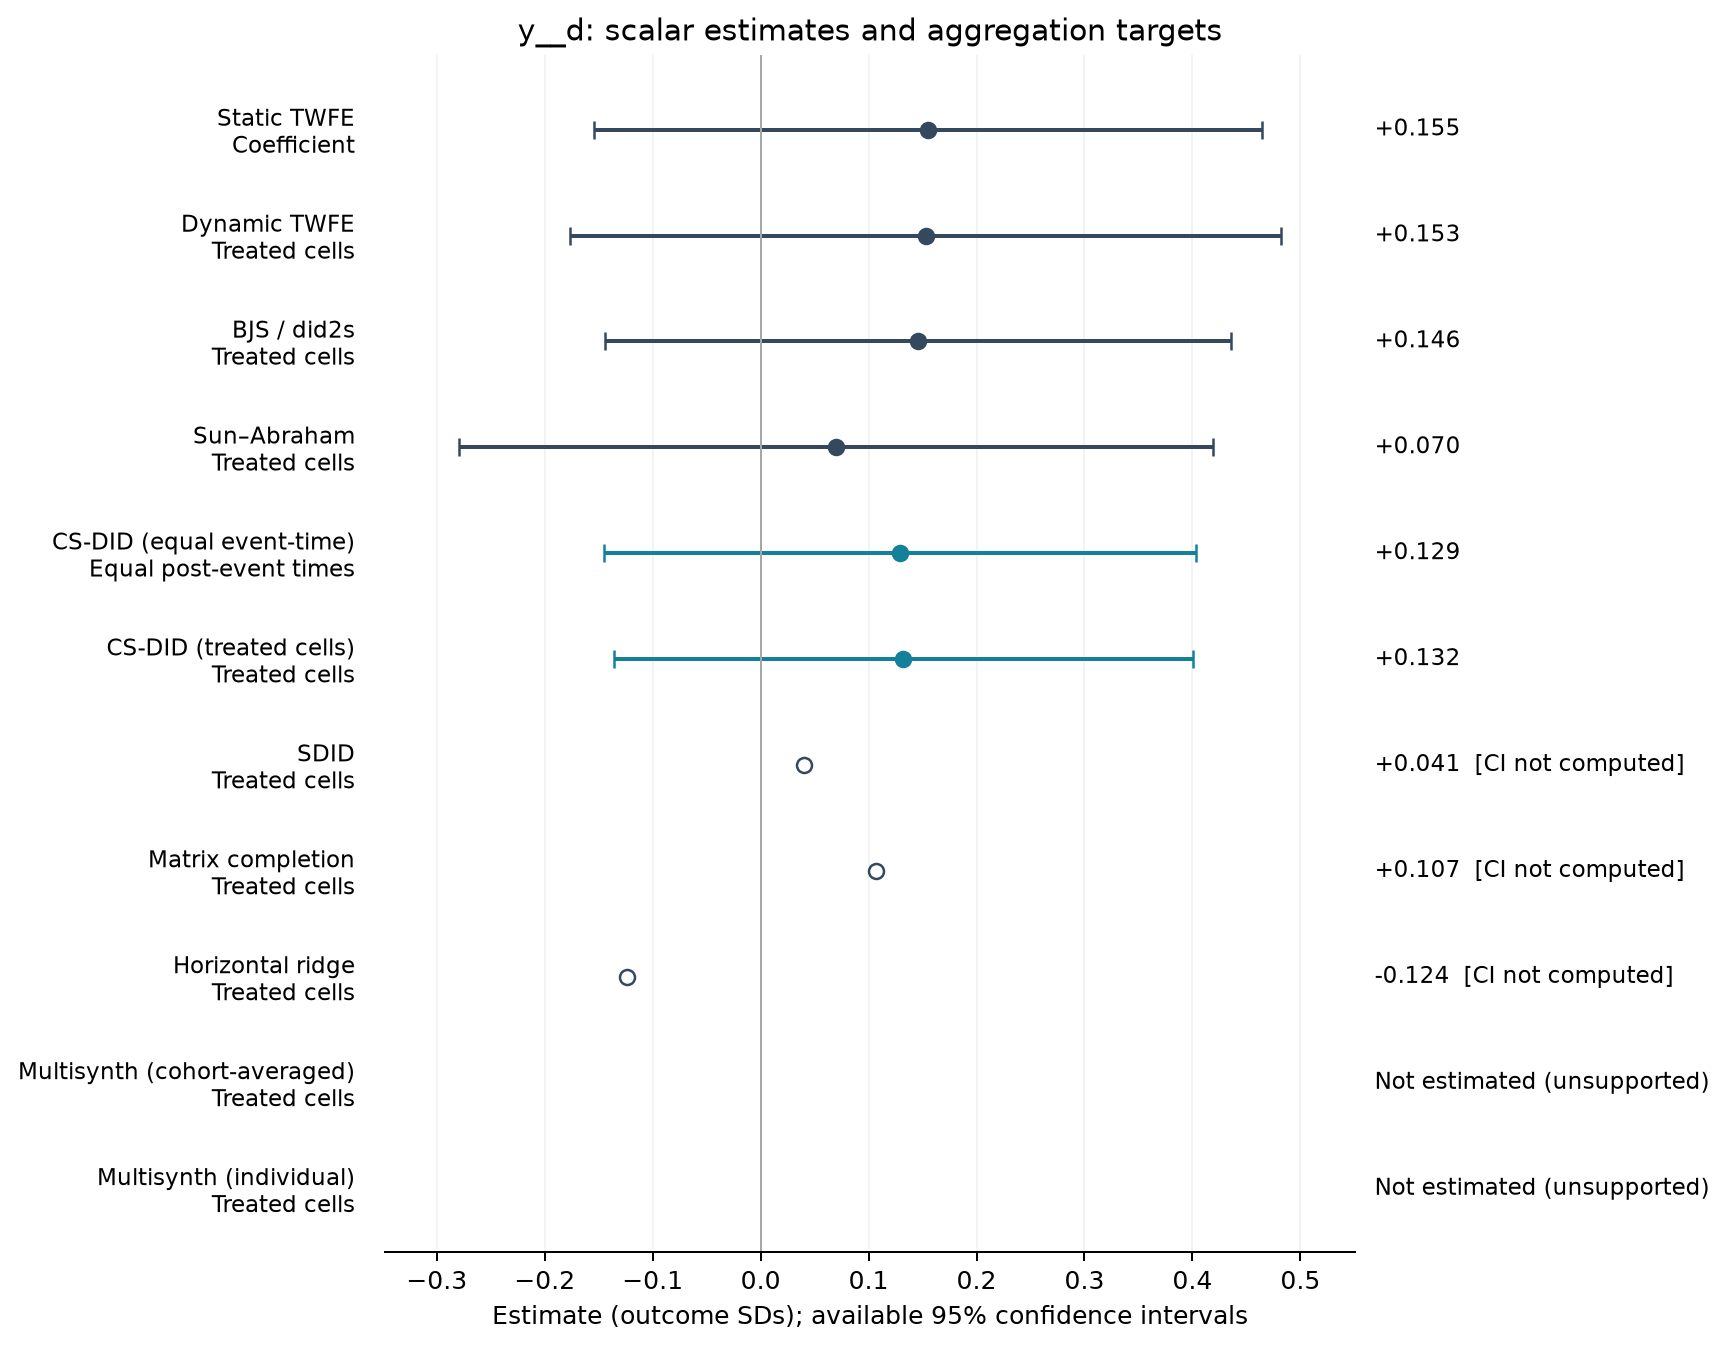
Democracy is not always preferable [Table 3 original scale]
1,037 observations · 19 units · 19 clusters · 13 treated / 6 control units.
Estimate comparison
| Estimator | Estimate (SDs) | SE | 95% CI | Averaging |
|---|---|---|---|---|
| Static TWFE | 0.155 | 0.147 | [-0.155, 0.465] | Coefficient |
| Dynamic TWFE | 0.153 | 0.157 | [-0.176, 0.482] | Treated cells |
| BJS / did2s | 0.146 | 0.138 | [-0.145, 0.436] | Treated cells |
| Sun–Abraham | 0.070 | 0.166 | [-0.279, 0.419] | Treated cells |
| CS-DID (equal event-time) | 0.129 | 0.140 | [-0.145, 0.403] | Equal post-event times |
| CS-DID (treated cells) | 0.132 | 0.137 | [-0.136, 0.400] | Treated cells |
| SDID | 0.041 | — | — | Treated cells |
| Matrix completion | 0.107 | — | — | Treated cells |
| Horizontal ridge | -0.124 | — | — | Treated cells |
Event studies
Periods −10 to +10; pointwise 95% intervals where available.
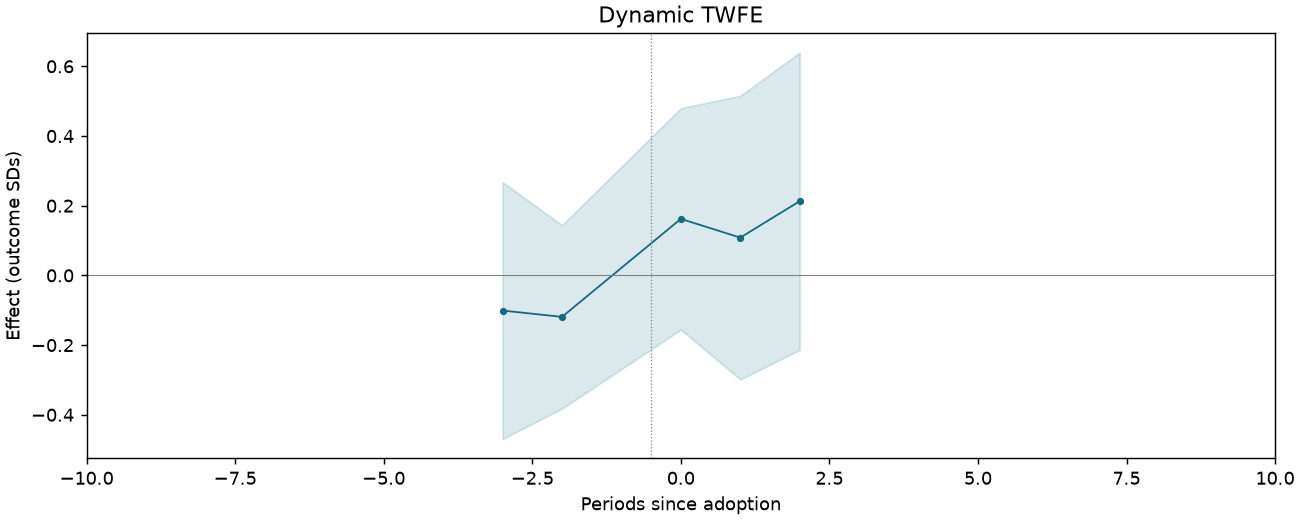
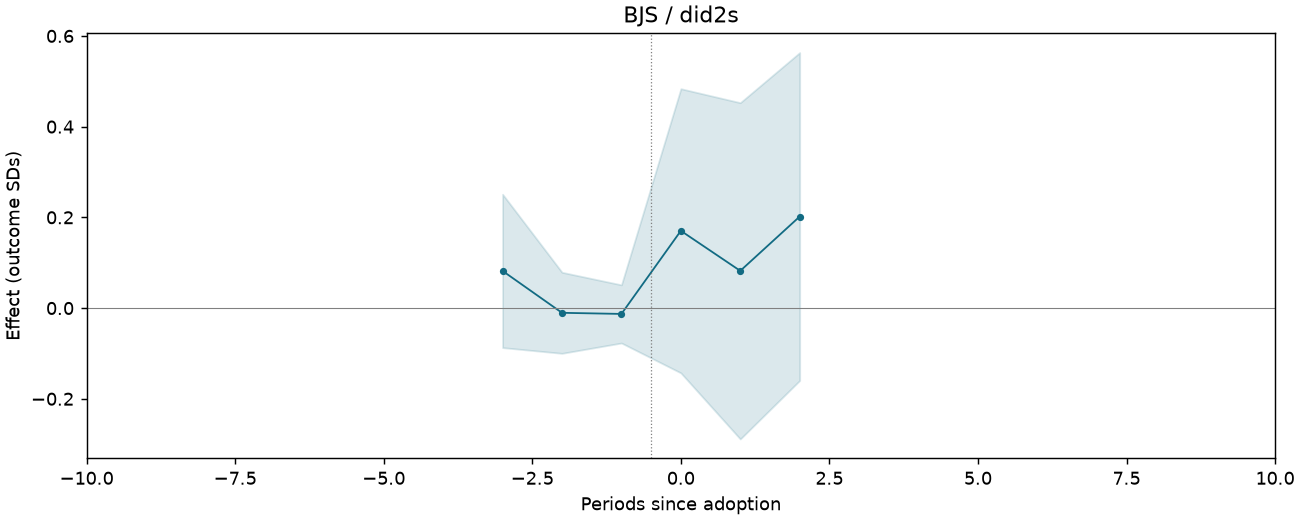
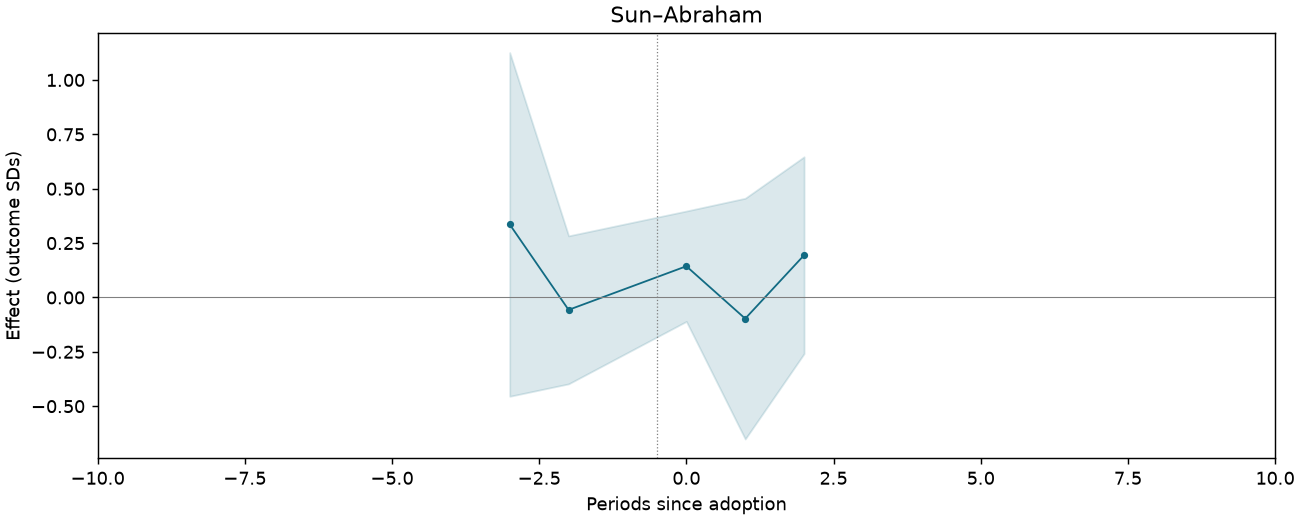
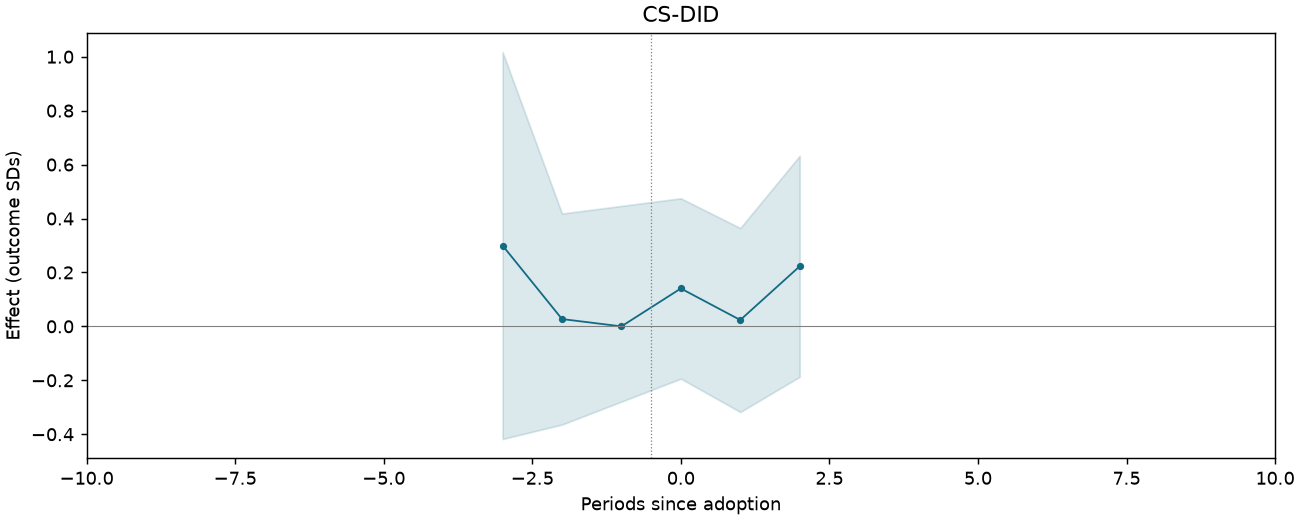
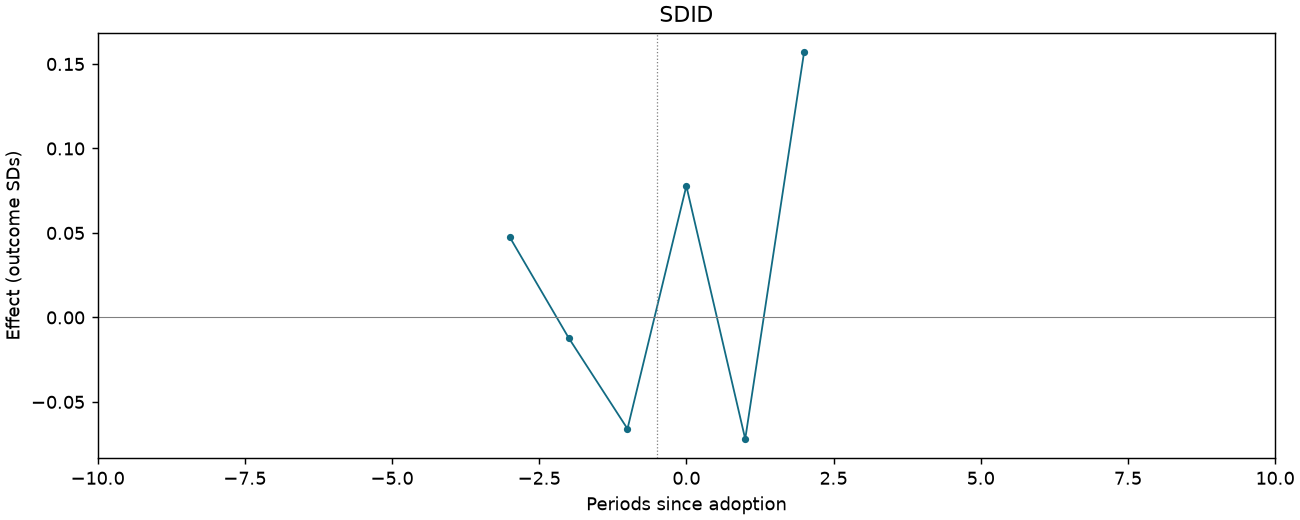
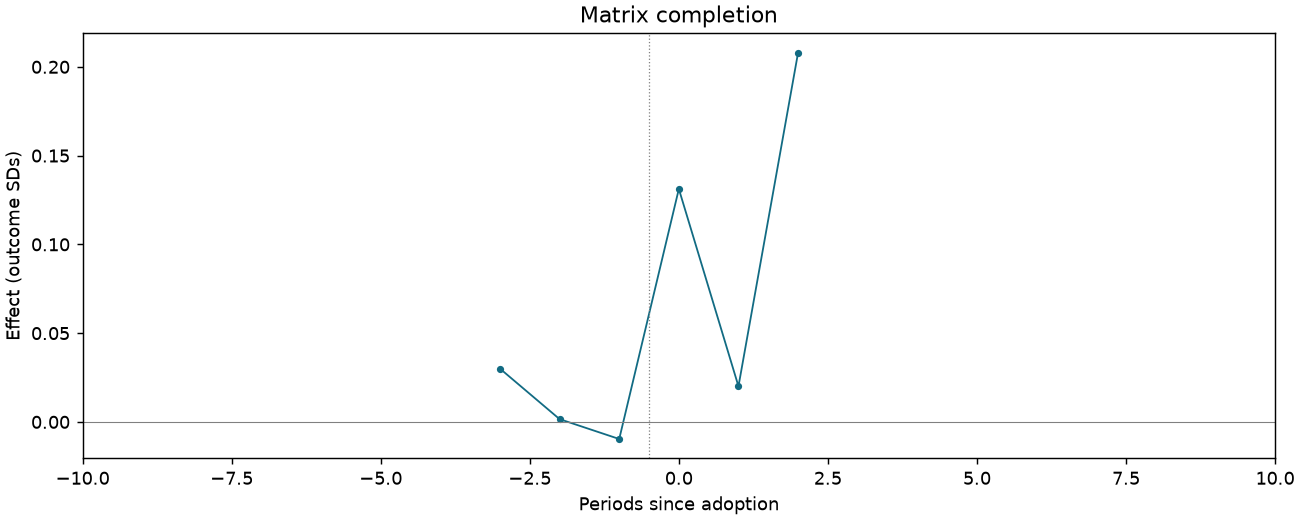
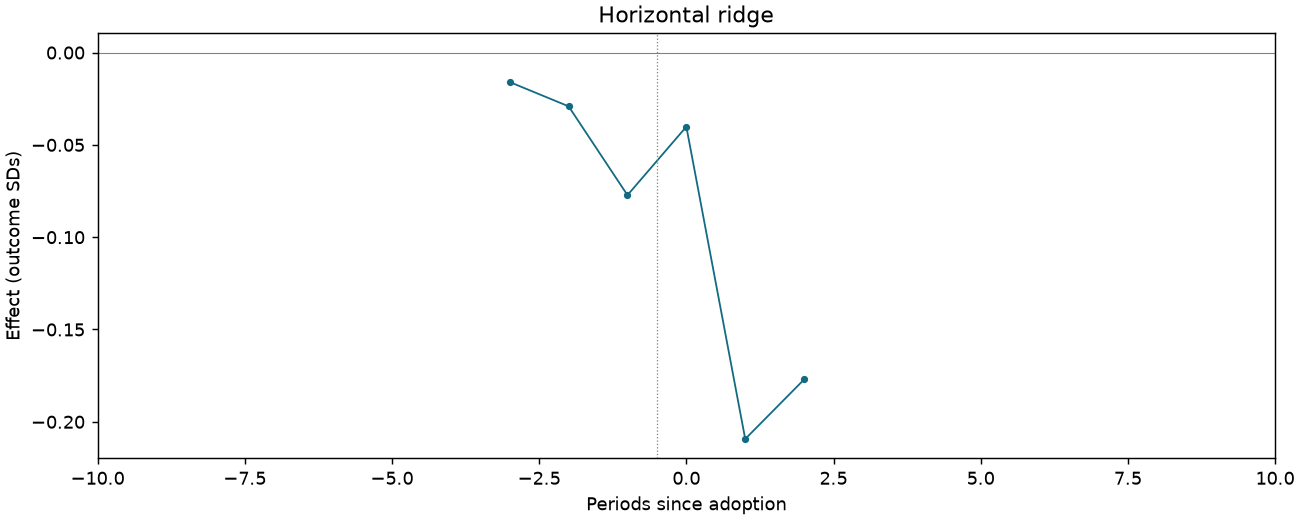
China is not suitable for democracy [Table 3 original scale]
1,083 observations · 19 units · 19 clusters · 13 treated / 6 control units.
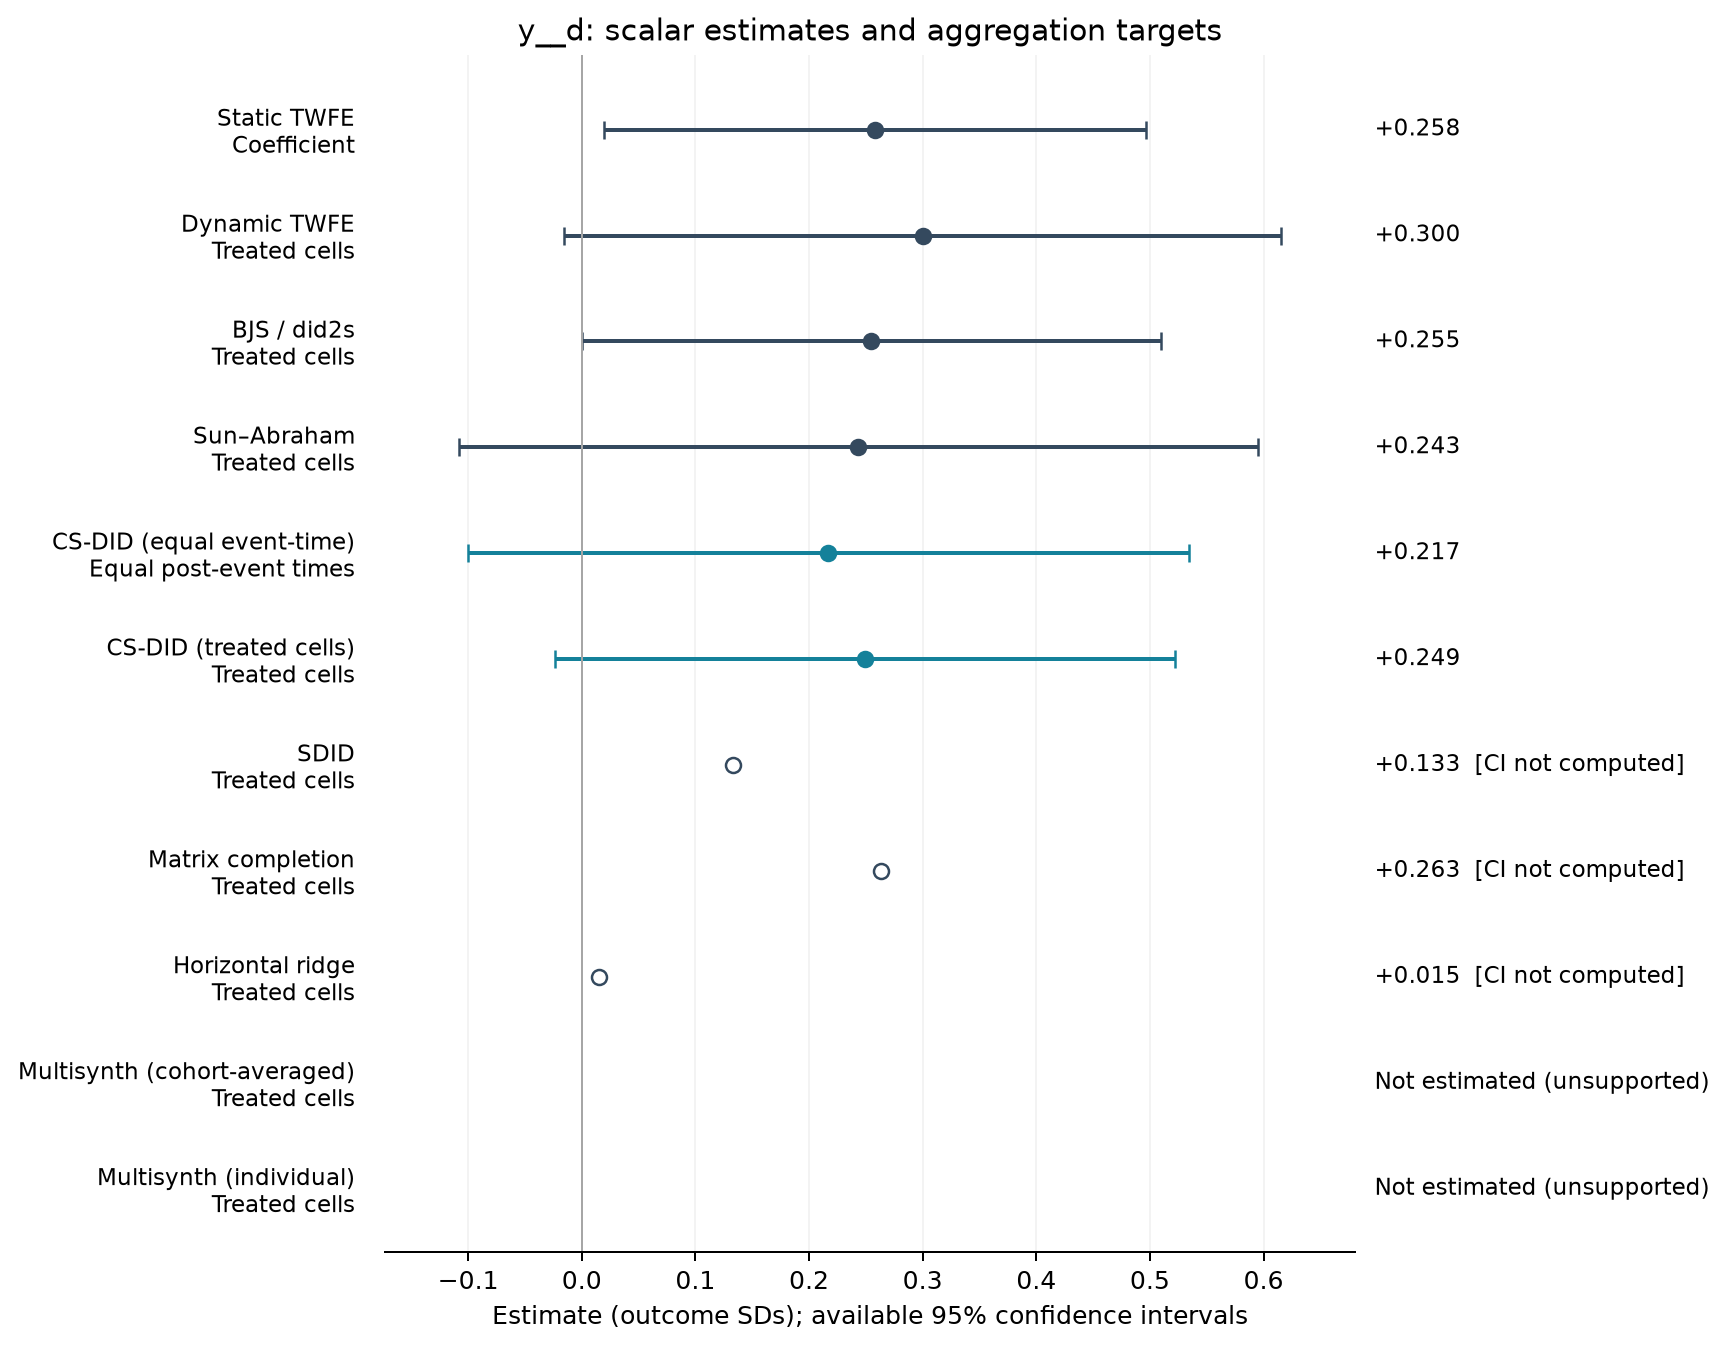
Estimate comparison
| Estimator | Estimate (SDs) | SE | 95% CI | Averaging |
|---|---|---|---|---|
| Static TWFE | 0.258 | 0.114 | [0.019, 0.497] | Coefficient |
| Dynamic TWFE | 0.300 | 0.150 | [-0.015, 0.616] | Treated cells |
| BJS / did2s | 0.255 | 0.121 | [-0.000, 0.510] | Treated cells |
| Sun–Abraham | 0.243 | 0.167 | [-0.108, 0.595] | Treated cells |
| CS-DID (equal event-time) | 0.217 | 0.162 | [-0.100, 0.535] | Equal post-event times |
| CS-DID (treated cells) | 0.249 | 0.139 | [-0.024, 0.522] | Treated cells |
| SDID | 0.133 | — | — | Treated cells |
| Matrix completion | 0.263 | — | — | Treated cells |
| Horizontal ridge | 0.015 | — | — | Treated cells |
Event studies
Periods −10 to +10; pointwise 95% intervals where available.
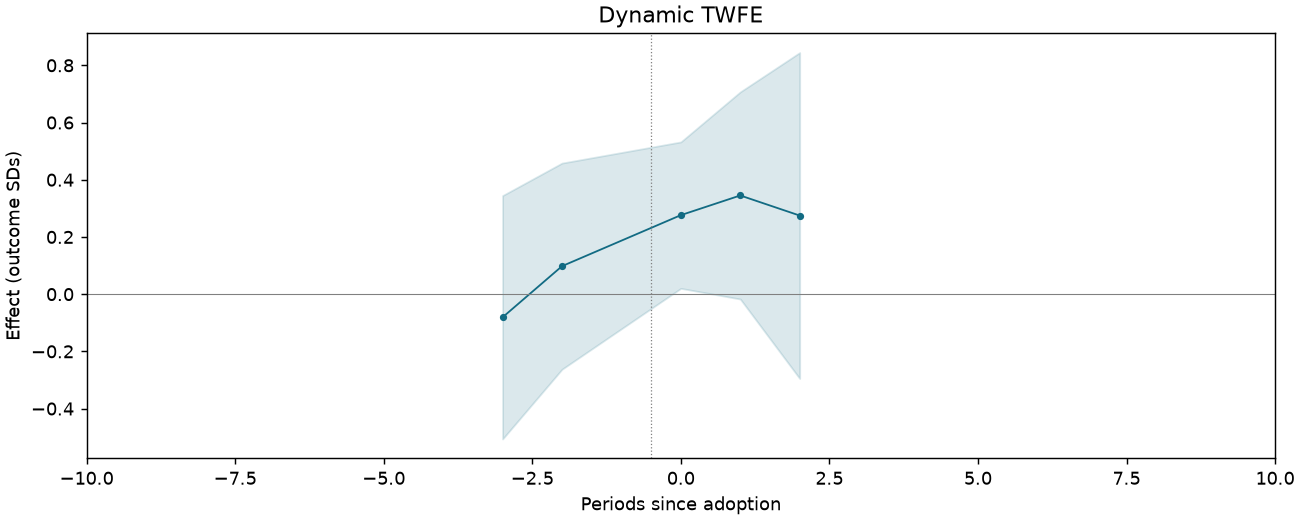
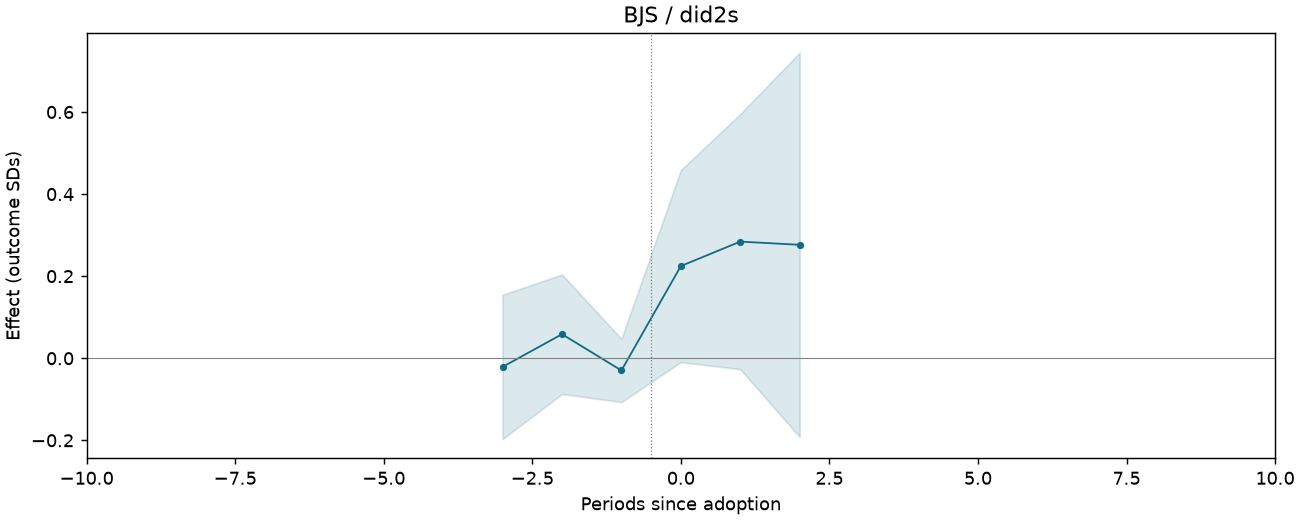
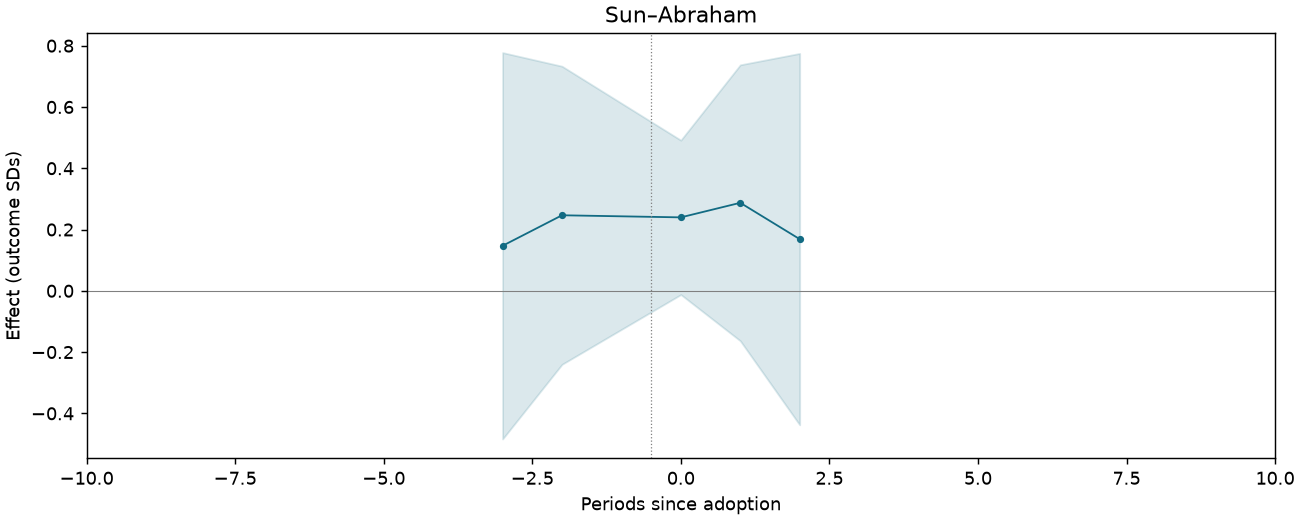
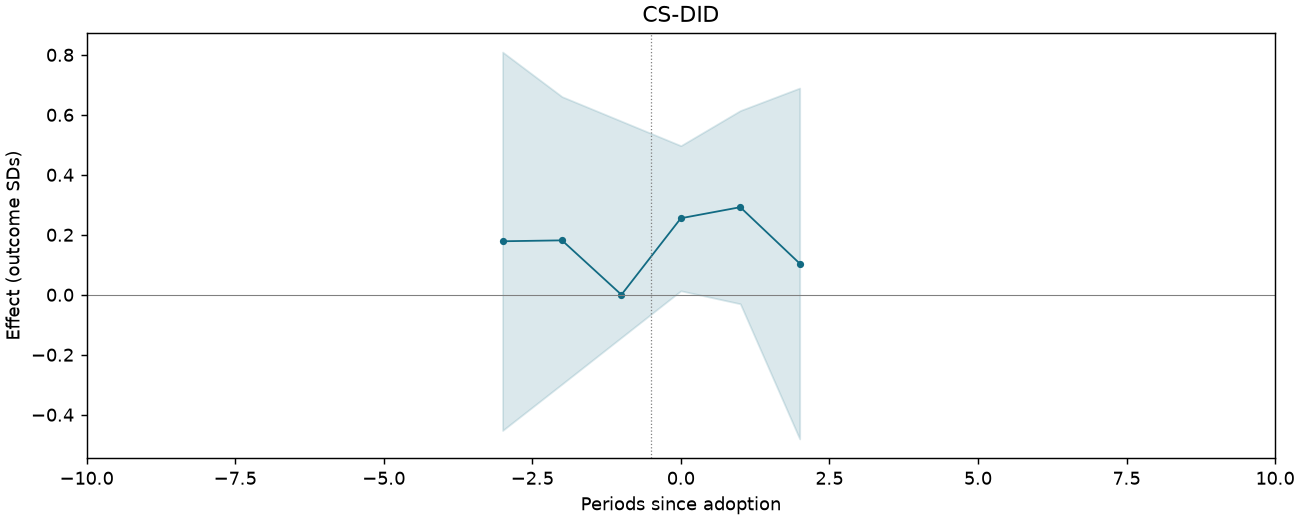
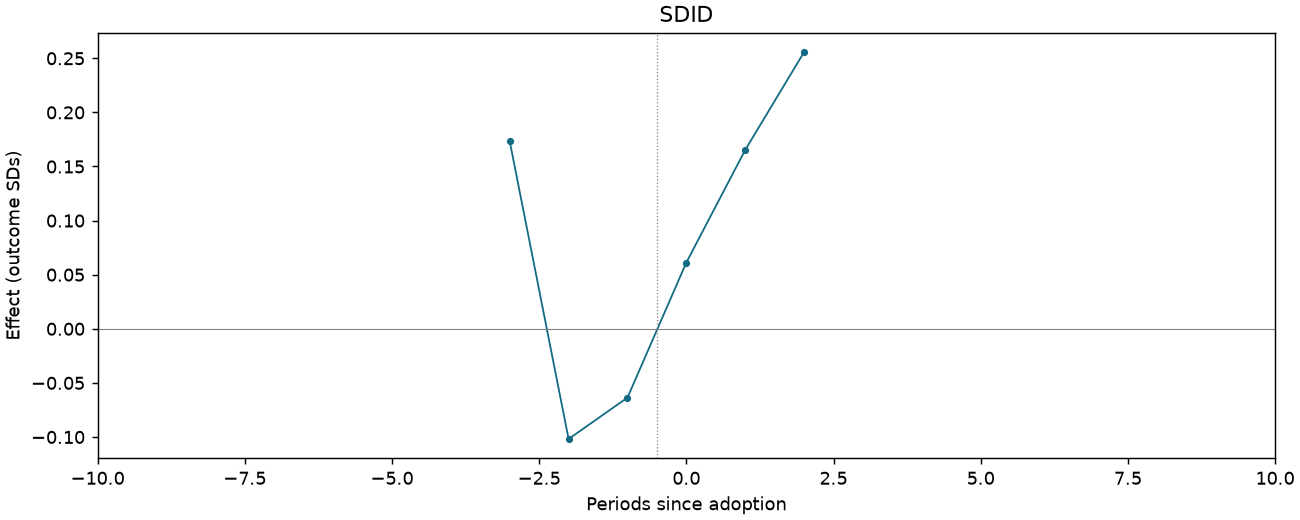
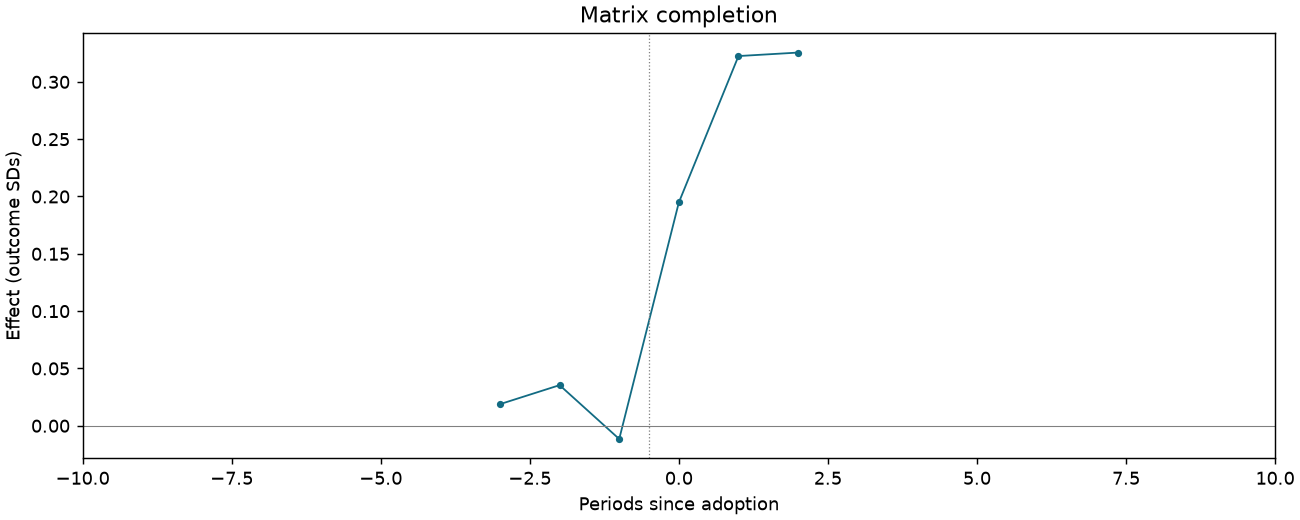
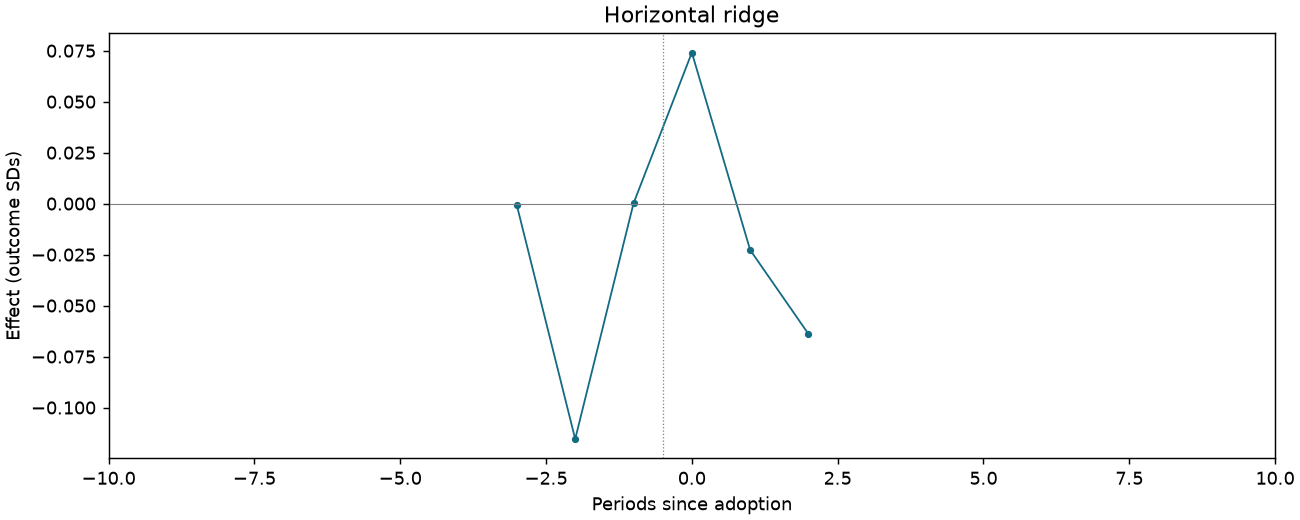
Wisdom of the masses z-score index [Table 3 original scale]
1,036 observations · 19 units · 19 clusters · 13 treated / 6 control units.
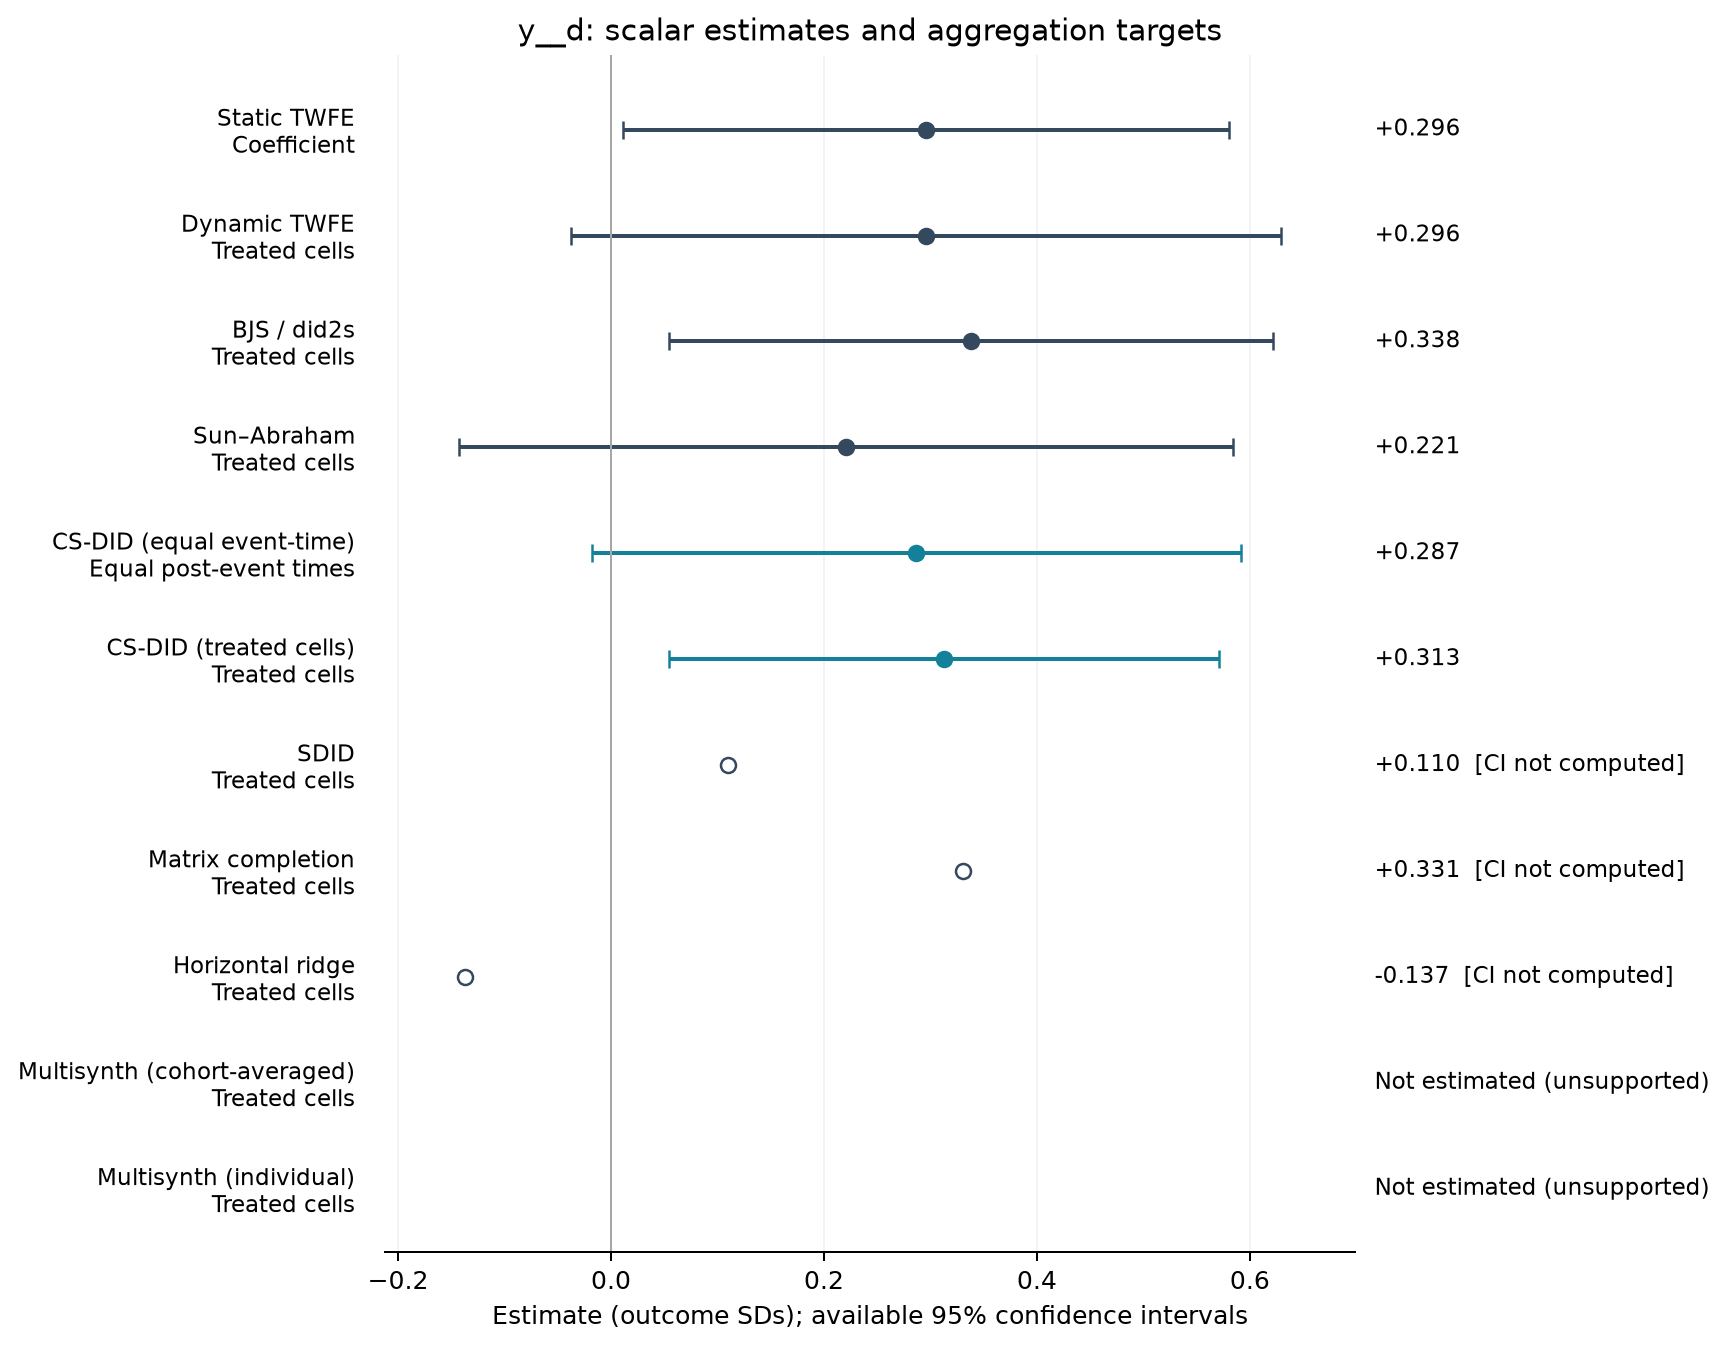
Estimate comparison
| Estimator | Estimate (SDs) | SE | 95% CI | Averaging |
|---|---|---|---|---|
| Static TWFE | 0.296 | 0.135 | [0.011, 0.580] | Coefficient |
| Dynamic TWFE | 0.296 | 0.159 | [-0.038, 0.629] | Treated cells |
| BJS / did2s | 0.338 | 0.135 | [0.054, 0.622] | Treated cells |
| Sun–Abraham | 0.221 | 0.173 | [-0.143, 0.584] | Treated cells |
| CS-DID (equal event-time) | 0.287 | 0.155 | [-0.018, 0.591] | Equal post-event times |
| CS-DID (treated cells) | 0.313 | 0.132 | [0.055, 0.571] | Treated cells |
| SDID | 0.110 | — | — | Treated cells |
| Matrix completion | 0.331 | — | — | Treated cells |
| Horizontal ridge | -0.137 | — | — | Treated cells |
Event studies
Periods −10 to +10; pointwise 95% intervals where available.
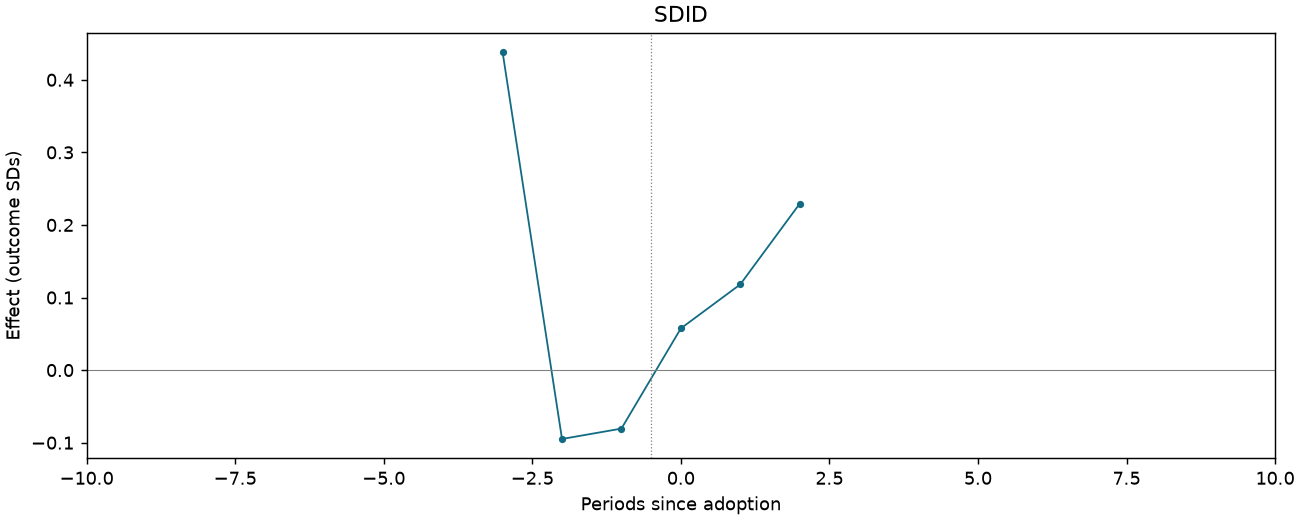
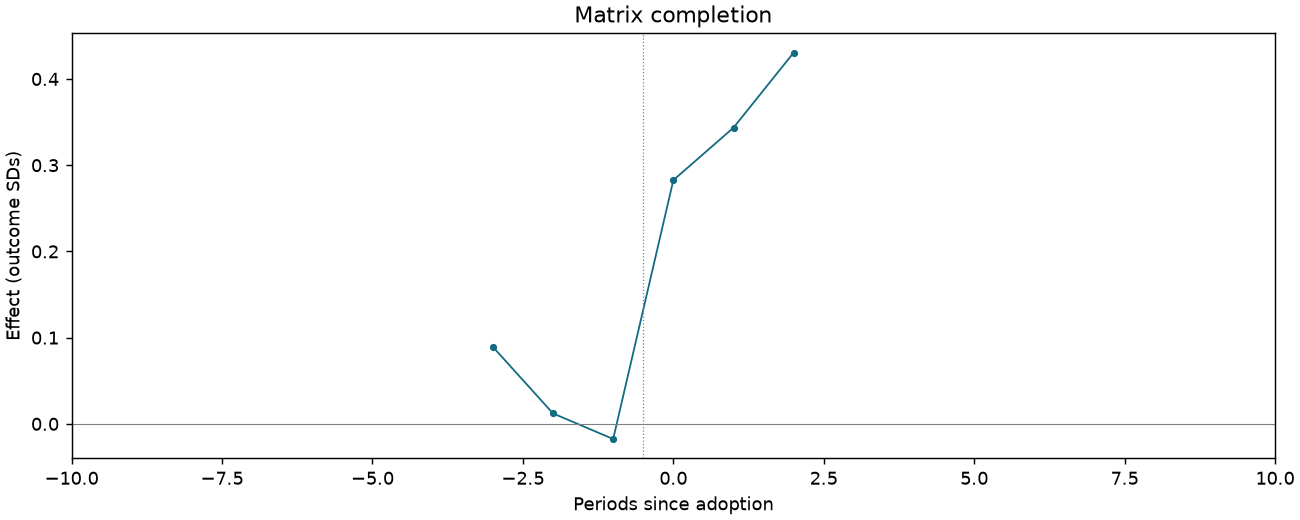
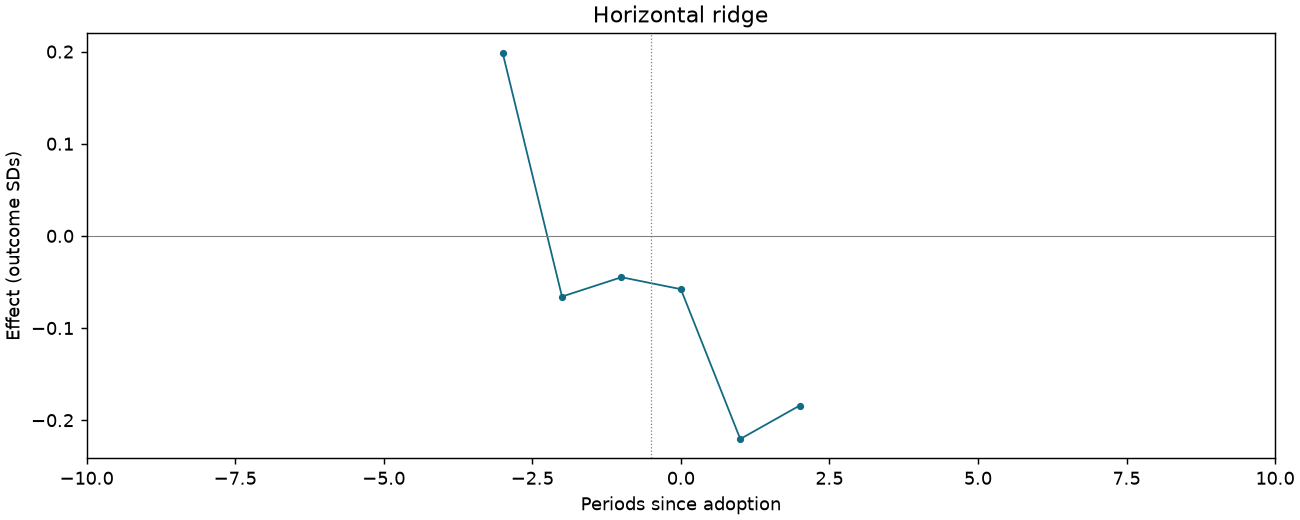
Participation is key for democracy [Table 3 original scale]
1,083 observations · 19 units · 19 clusters · 13 treated / 6 control units.
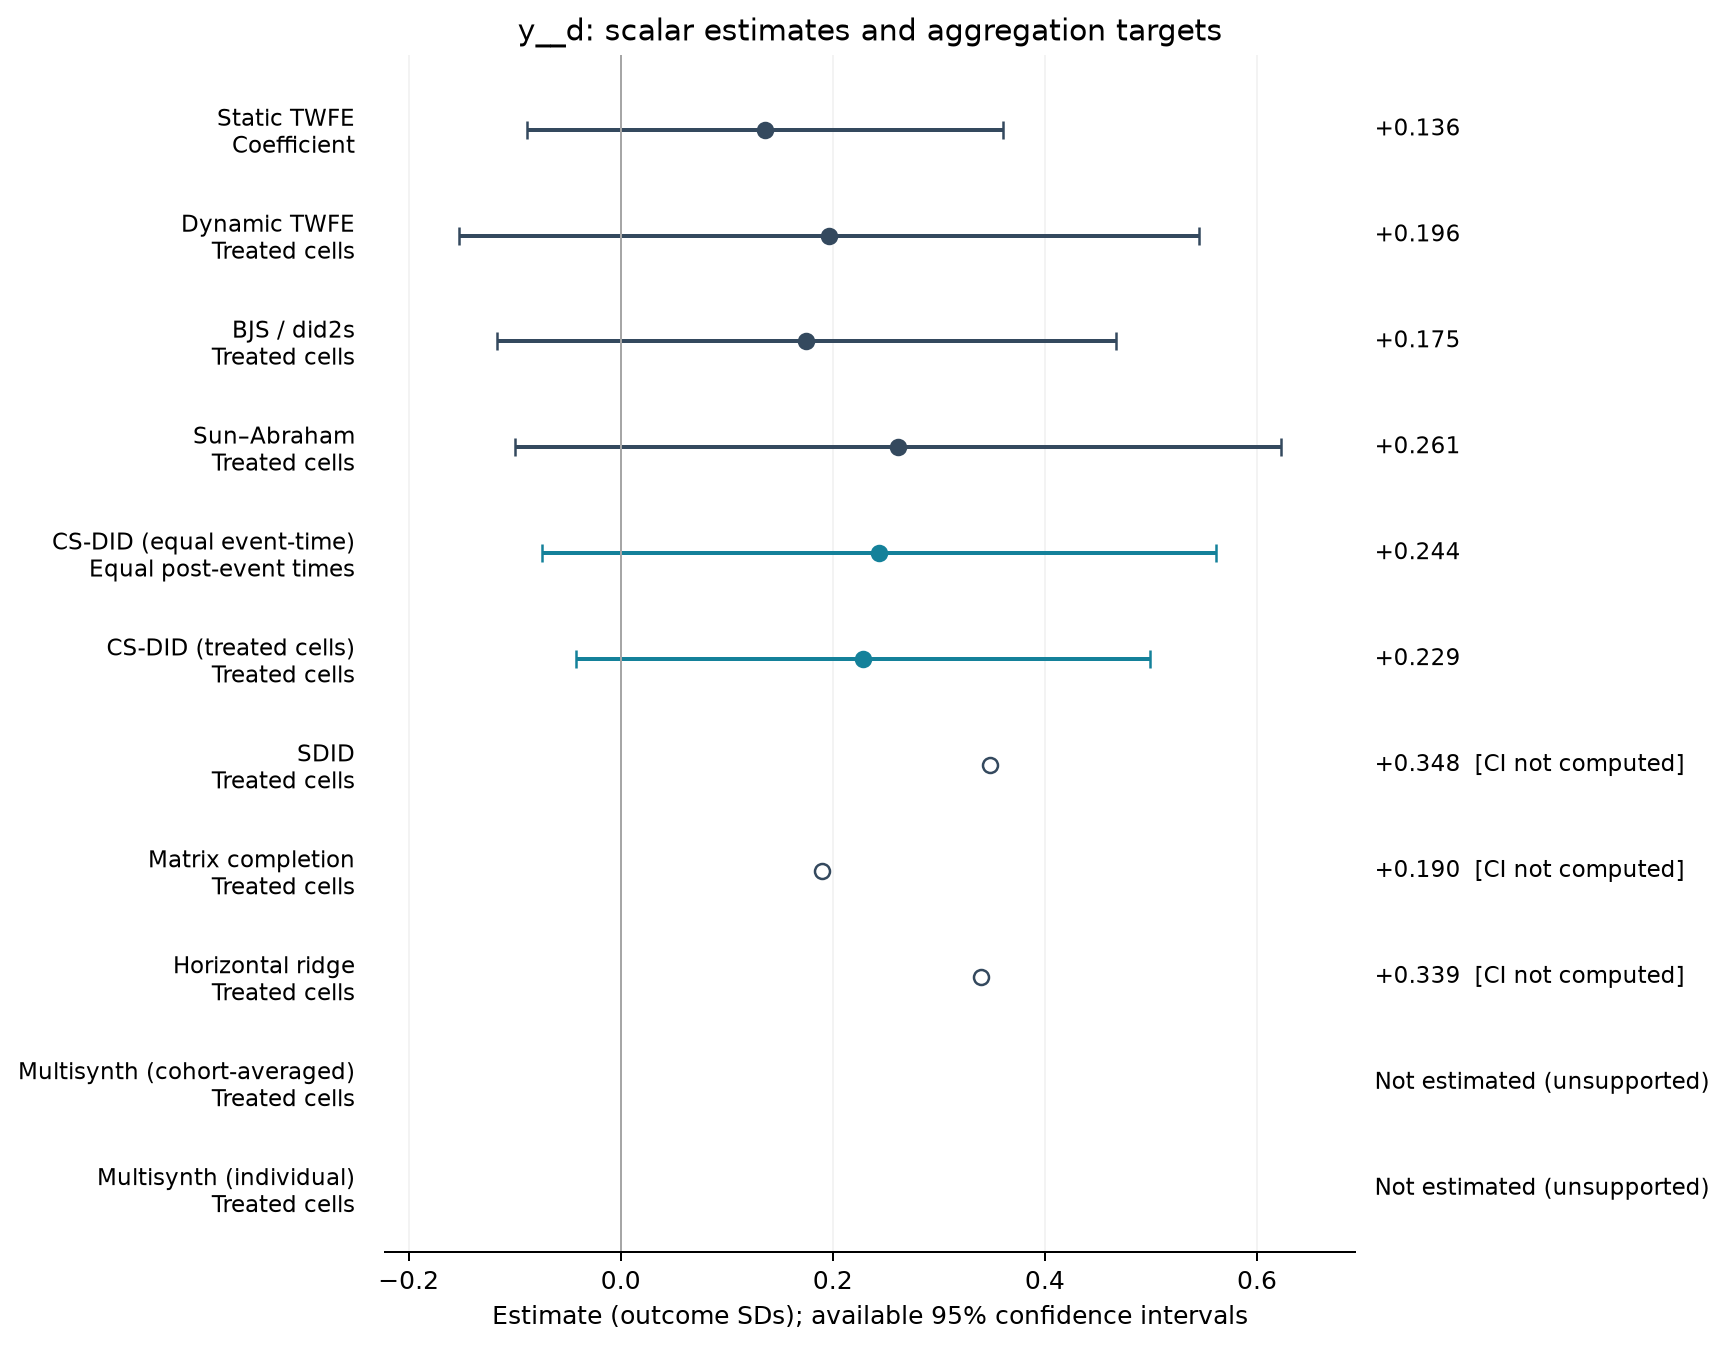
Estimate comparison
| Estimator | Estimate (SDs) | SE | 95% CI | Averaging |
|---|---|---|---|---|
| Static TWFE | 0.136 | 0.107 | [-0.088, 0.361] | Coefficient |
| Dynamic TWFE | 0.196 | 0.166 | [-0.152, 0.545] | Treated cells |
| BJS / did2s | 0.175 | 0.139 | [-0.117, 0.467] | Treated cells |
| Sun–Abraham | 0.261 | 0.172 | [-0.100, 0.623] | Treated cells |
| CS-DID (equal event-time) | 0.244 | 0.162 | [-0.074, 0.562] | Equal post-event times |
| CS-DID (treated cells) | 0.229 | 0.138 | [-0.042, 0.499] | Treated cells |
| SDID | 0.348 | — | — | Treated cells |
| Matrix completion | 0.190 | — | — | Treated cells |
| Horizontal ridge | 0.339 | — | — | Treated cells |
Event studies
Periods −10 to +10; pointwise 95% intervals where available.
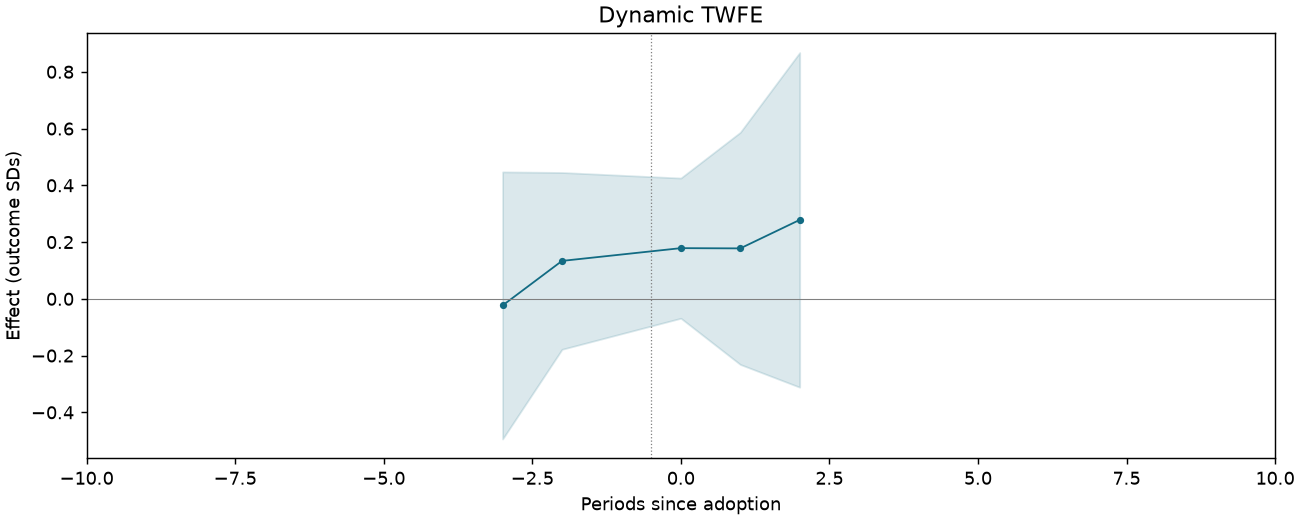
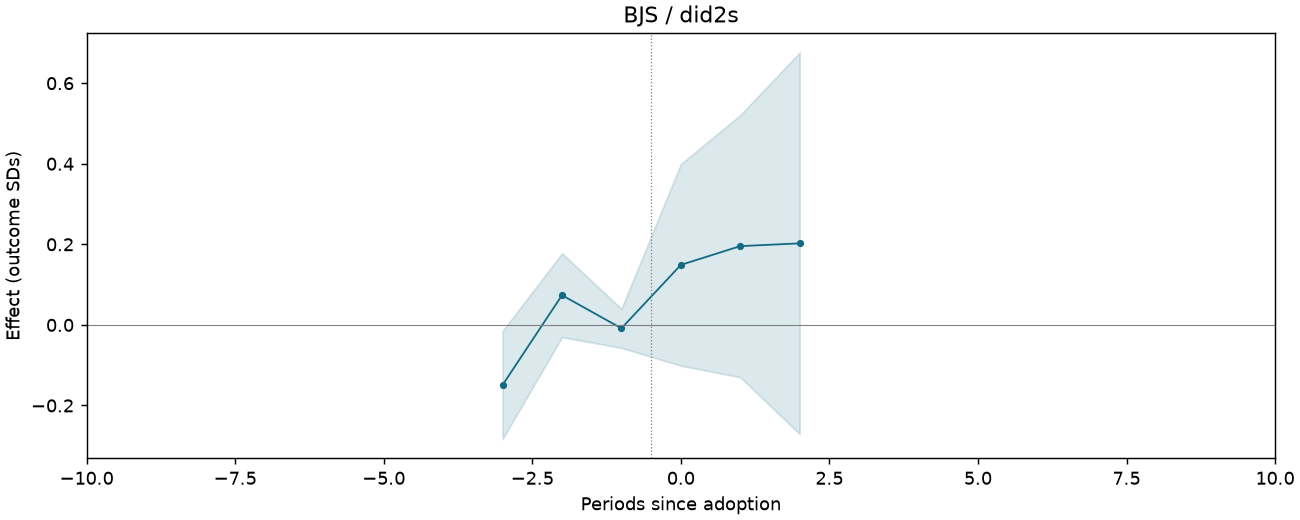
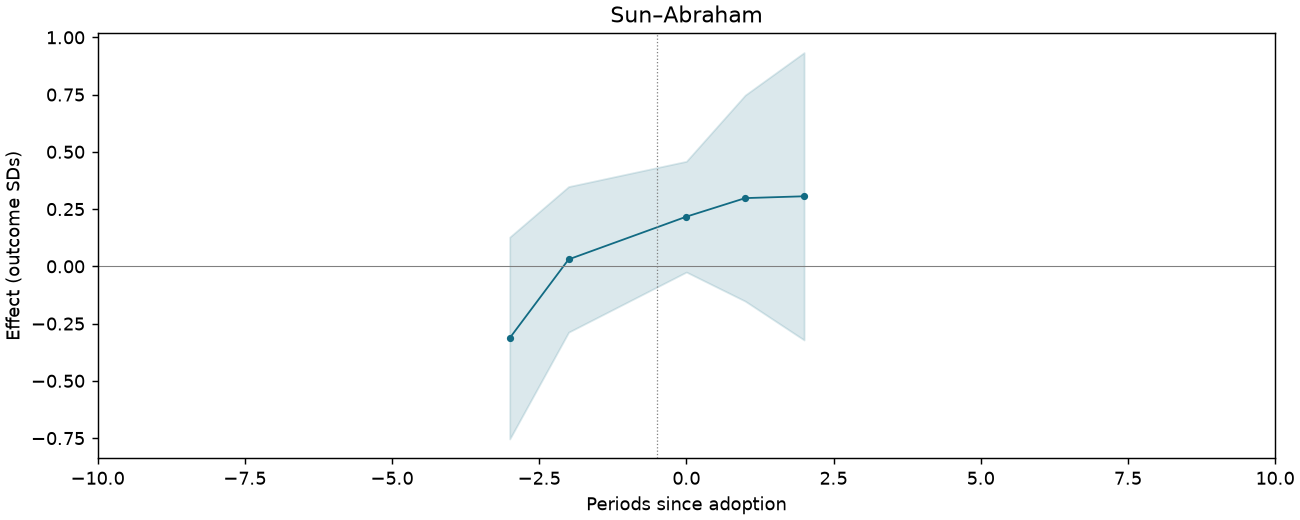
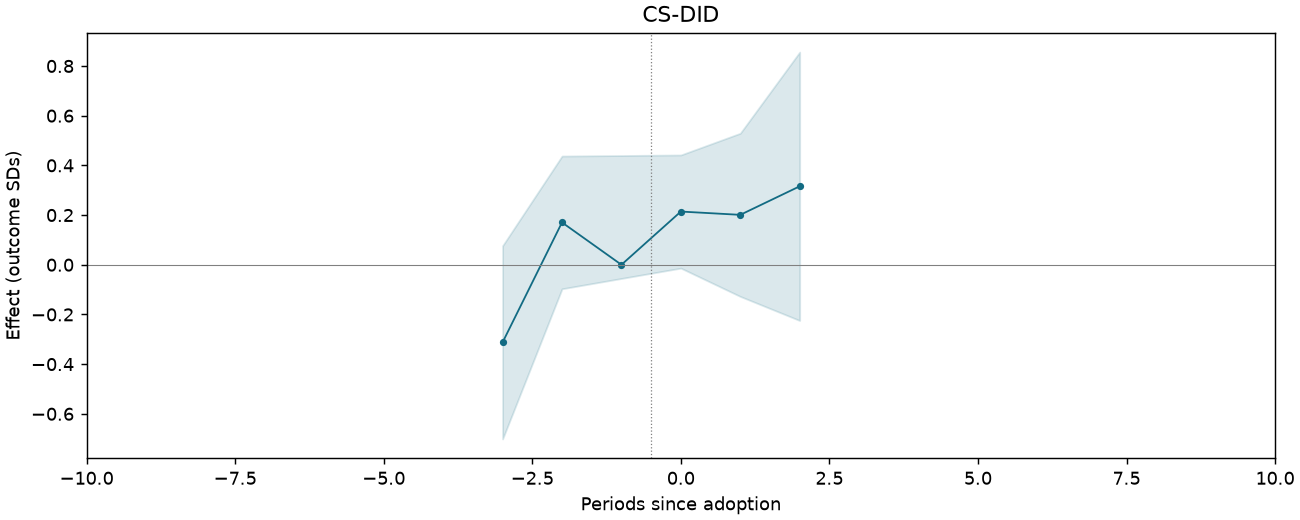
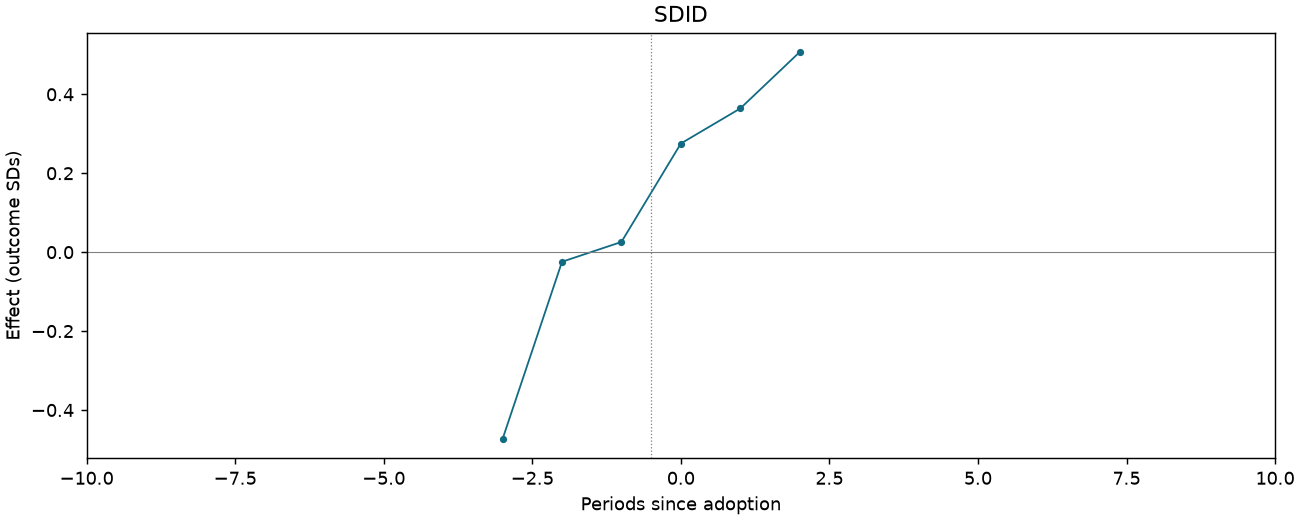
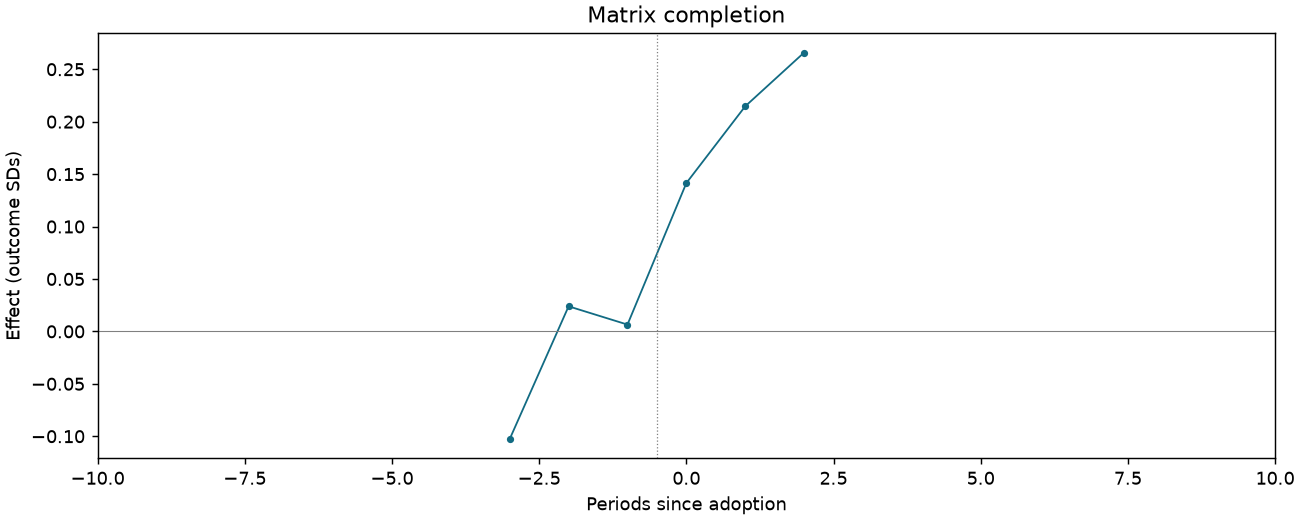
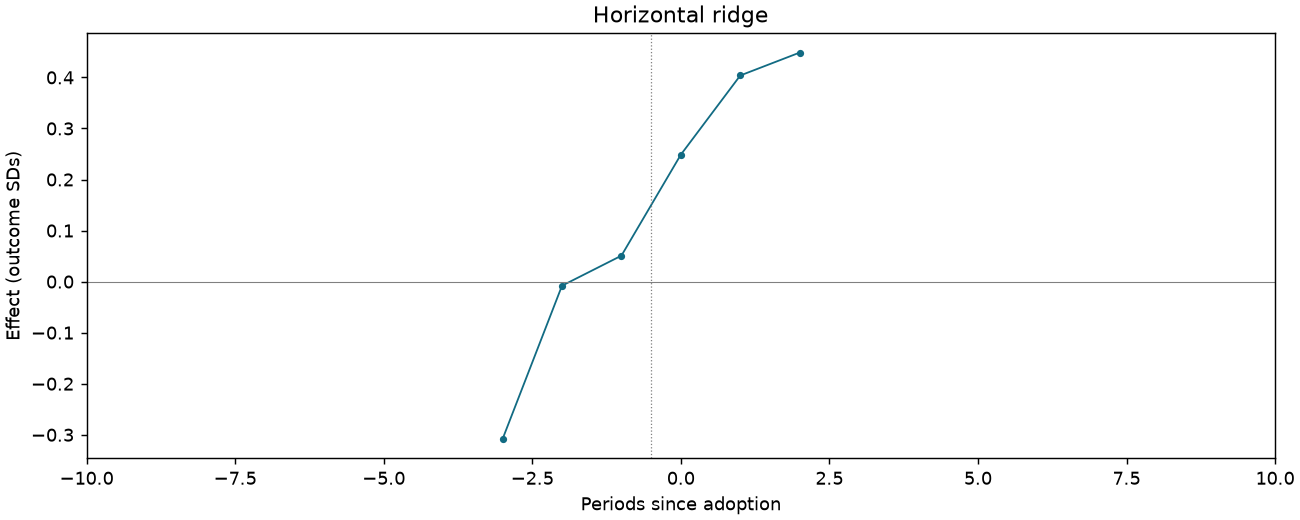
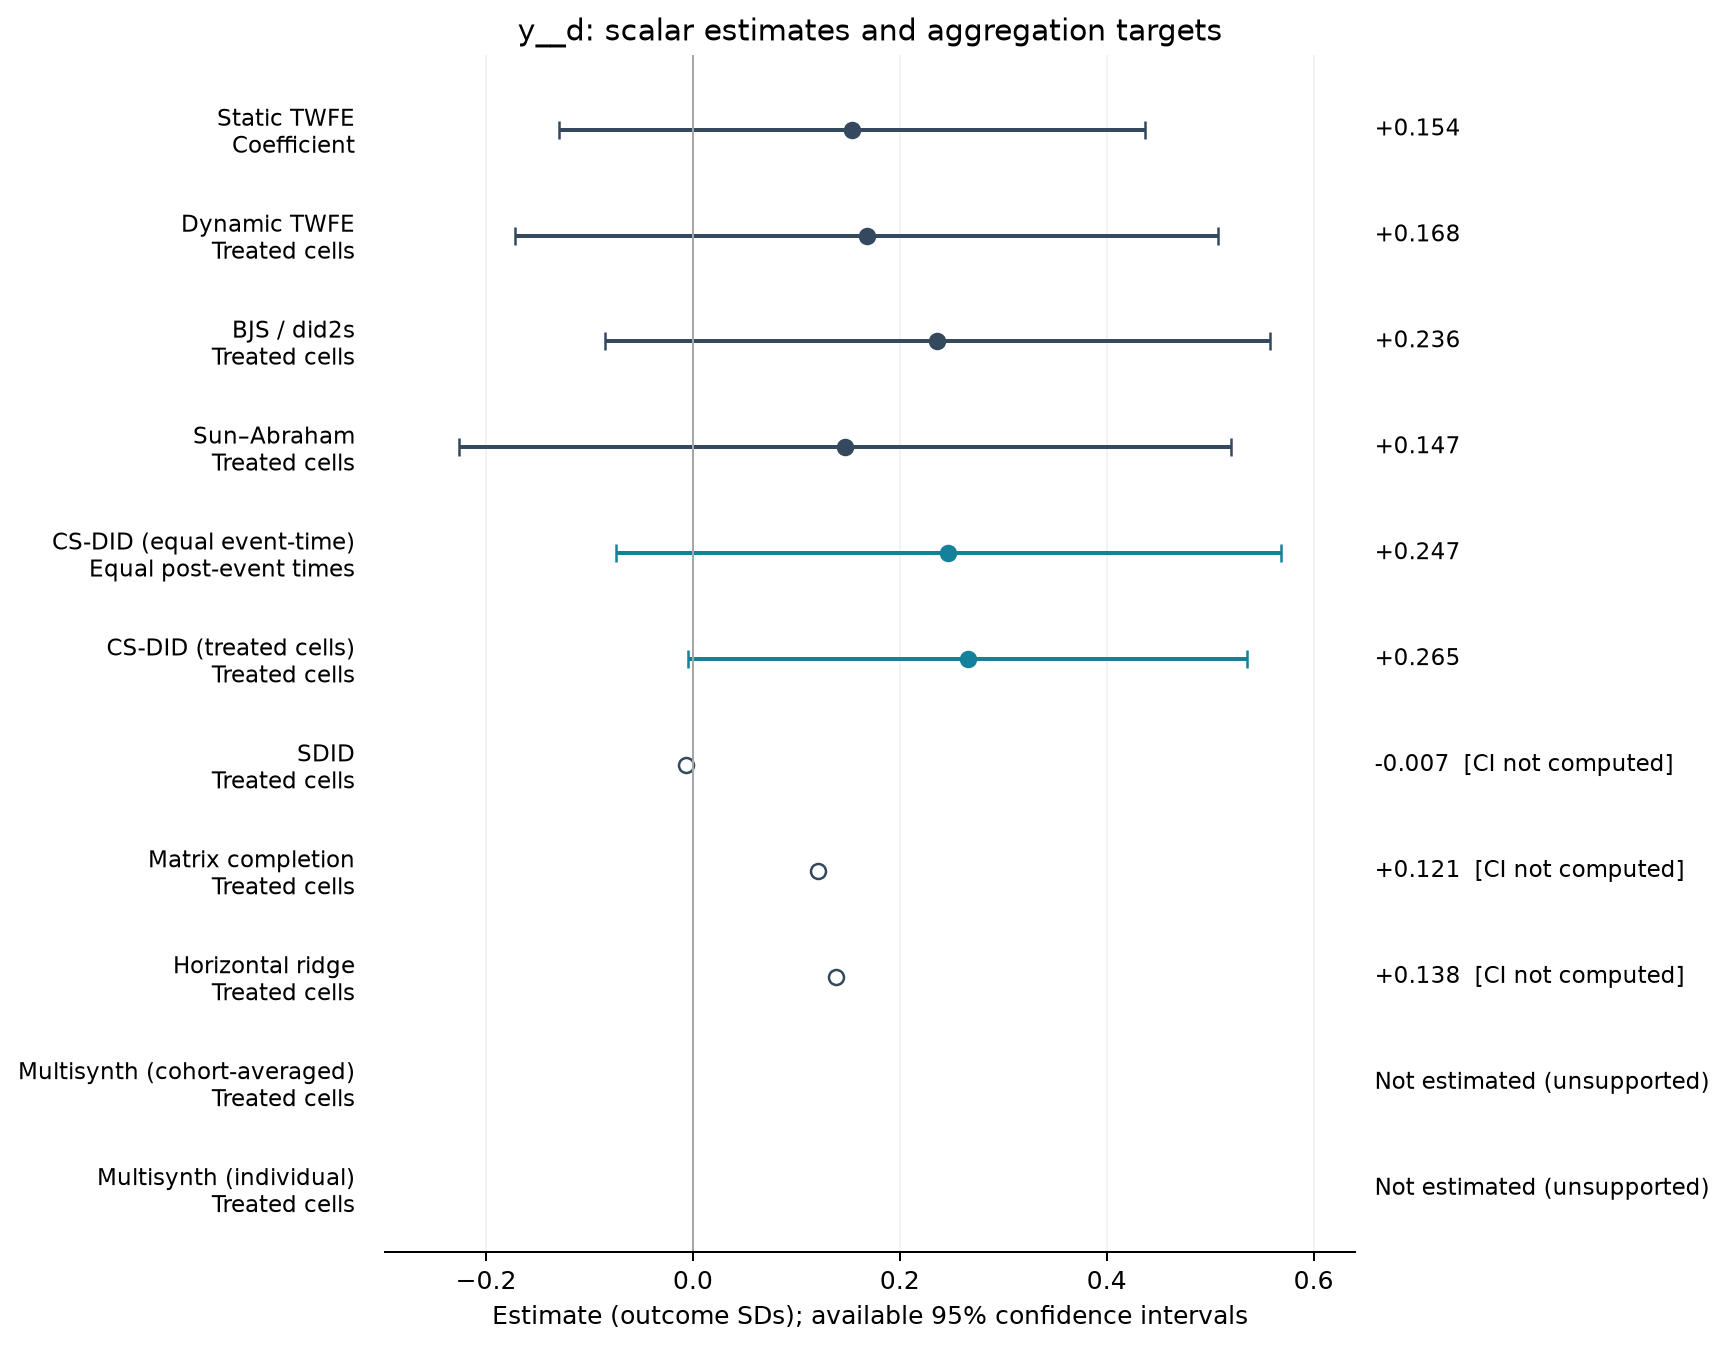
Skeptical of markets [Table 3 original scale]
1,014 observations · 19 units · 19 clusters · 13 treated / 6 control units.
Estimate comparison
| Estimator | Estimate (SDs) | SE | 95% CI | Averaging |
|---|---|---|---|---|
| Static TWFE | 0.154 | 0.135 | [-0.130, 0.437] | Coefficient |
| Dynamic TWFE | 0.168 | 0.162 | [-0.172, 0.508] | Treated cells |
| BJS / did2s | 0.236 | 0.153 | [-0.085, 0.557] | Treated cells |
| Sun–Abraham | 0.147 | 0.178 | [-0.226, 0.520] | Treated cells |
| CS-DID (equal event-time) | 0.247 | 0.164 | [-0.075, 0.569] | Equal post-event times |
| CS-DID (treated cells) | 0.265 | 0.138 | [-0.004, 0.535] | Treated cells |
| SDID | -0.007 | — | — | Treated cells |
| Matrix completion | 0.121 | — | — | Treated cells |
| Horizontal ridge | 0.138 | — | — | Treated cells |
Event studies
Periods −10 to +10; pointwise 95% intervals where available.
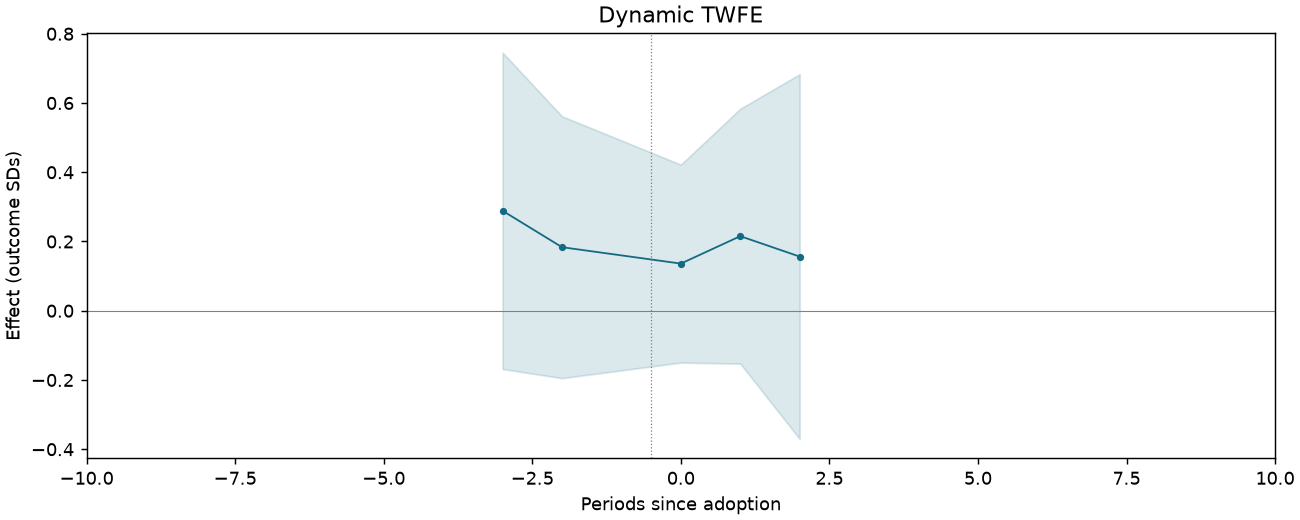
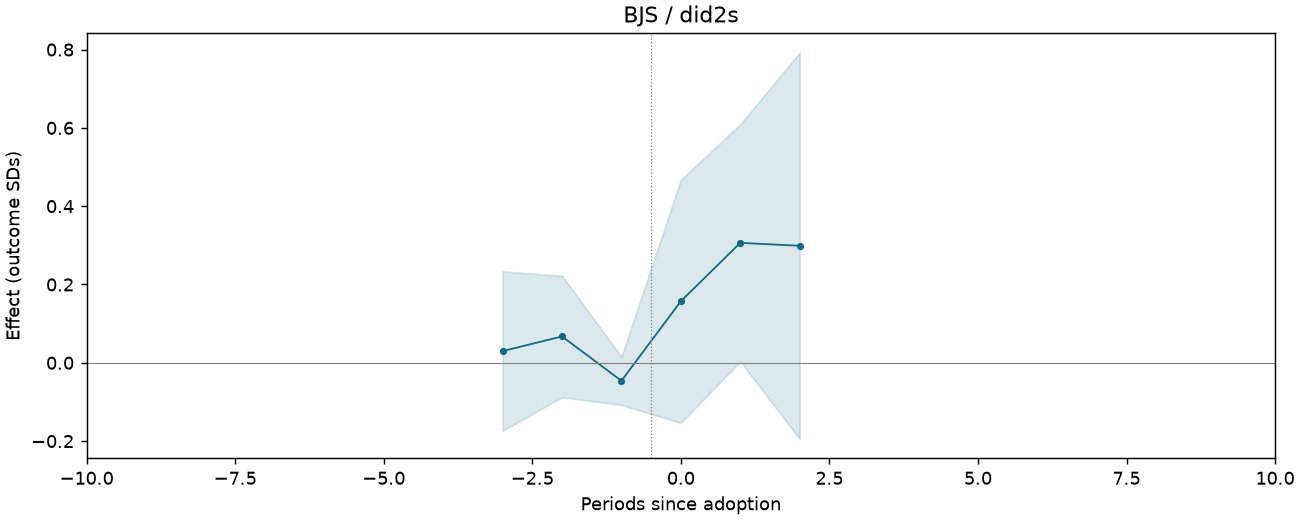
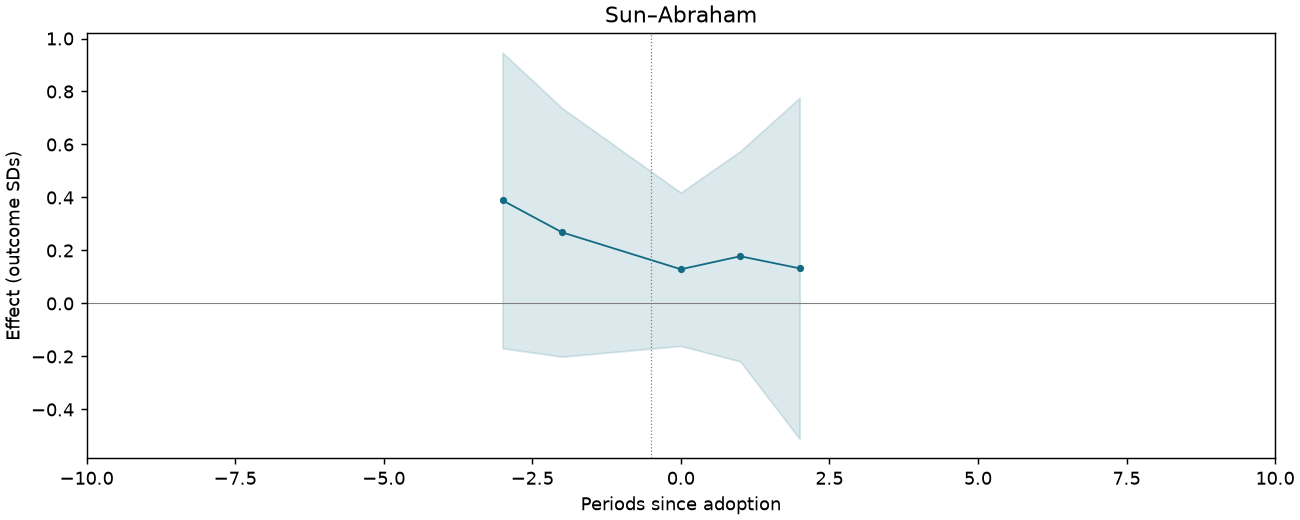
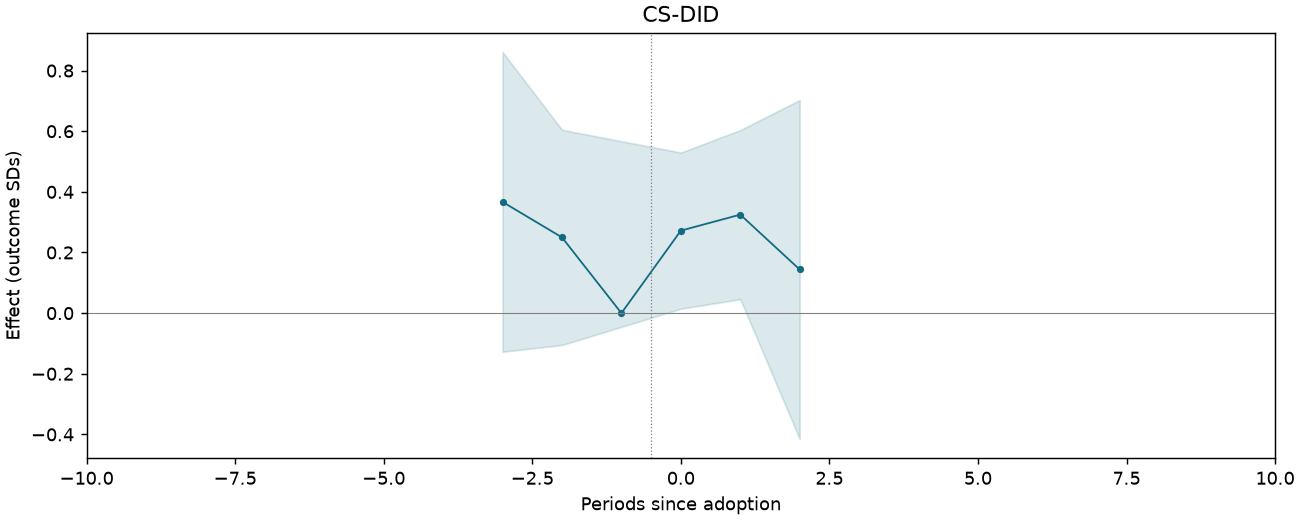
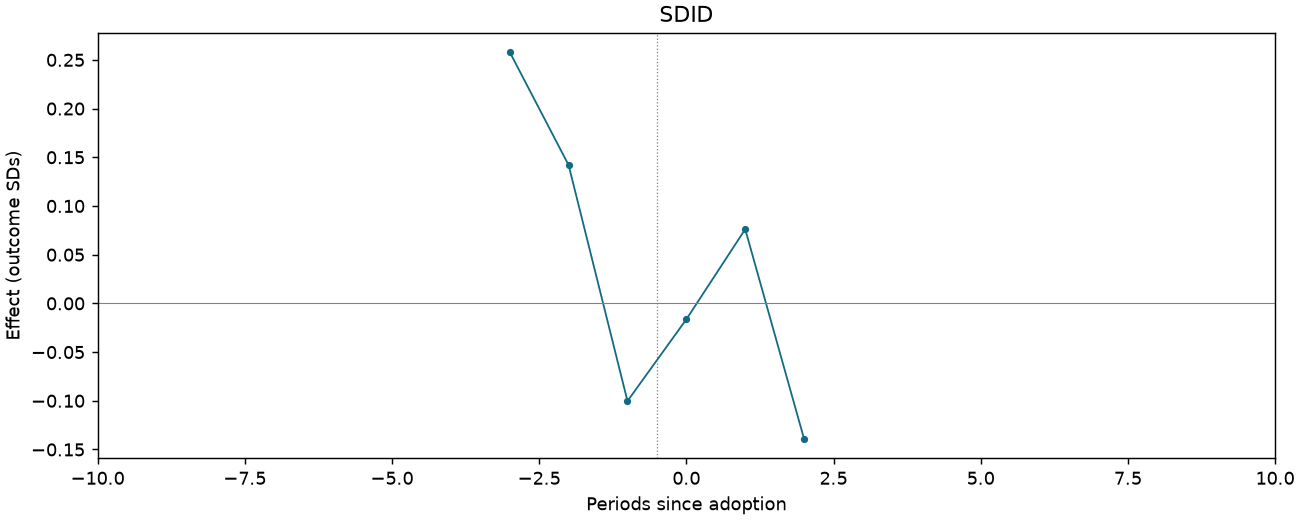
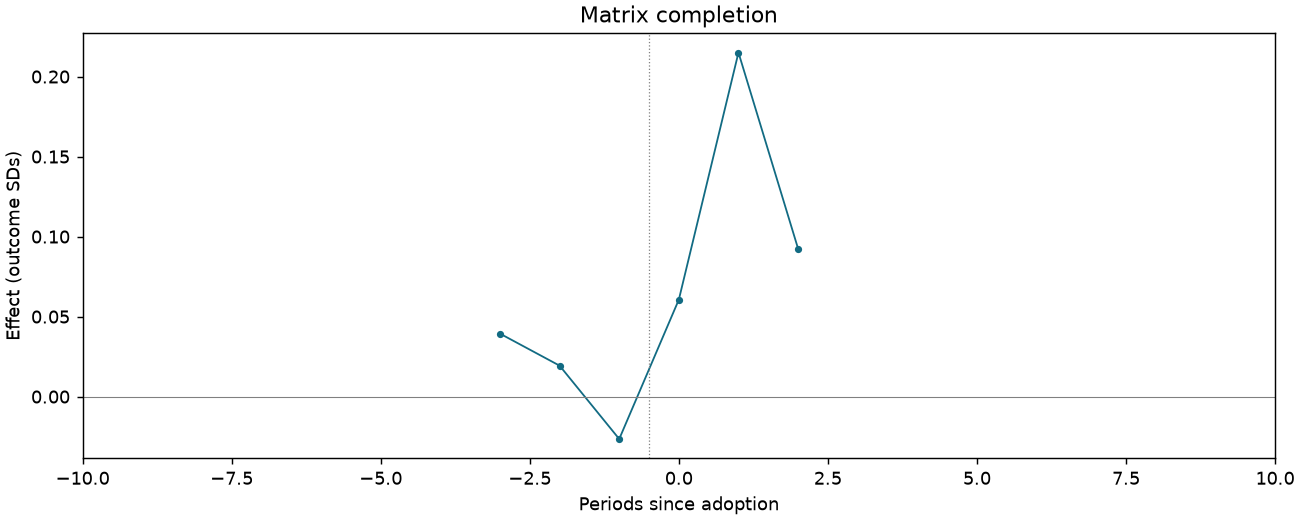
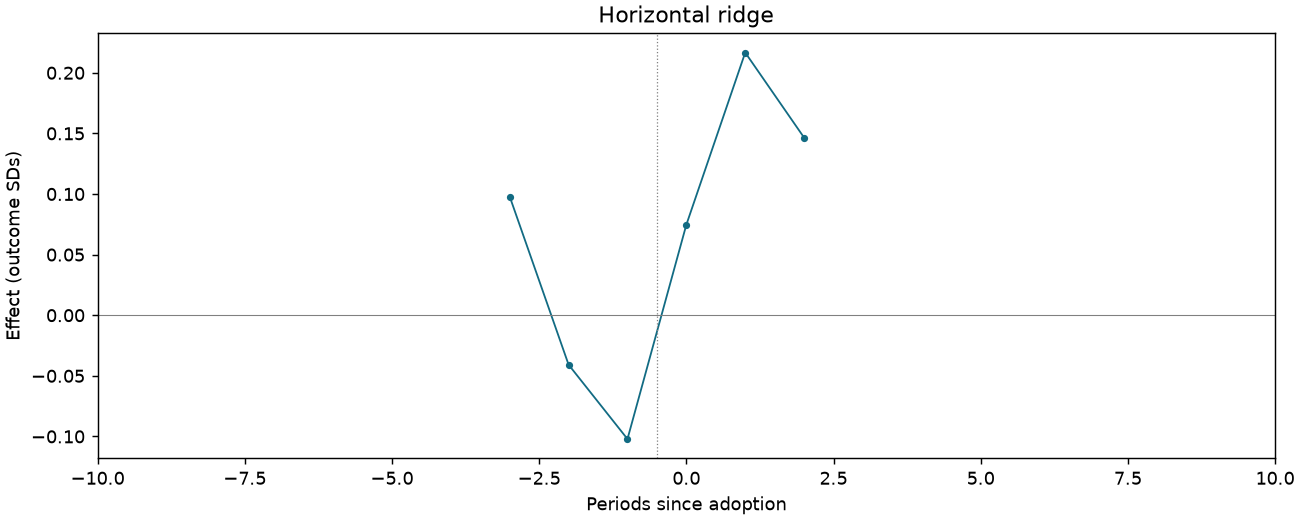
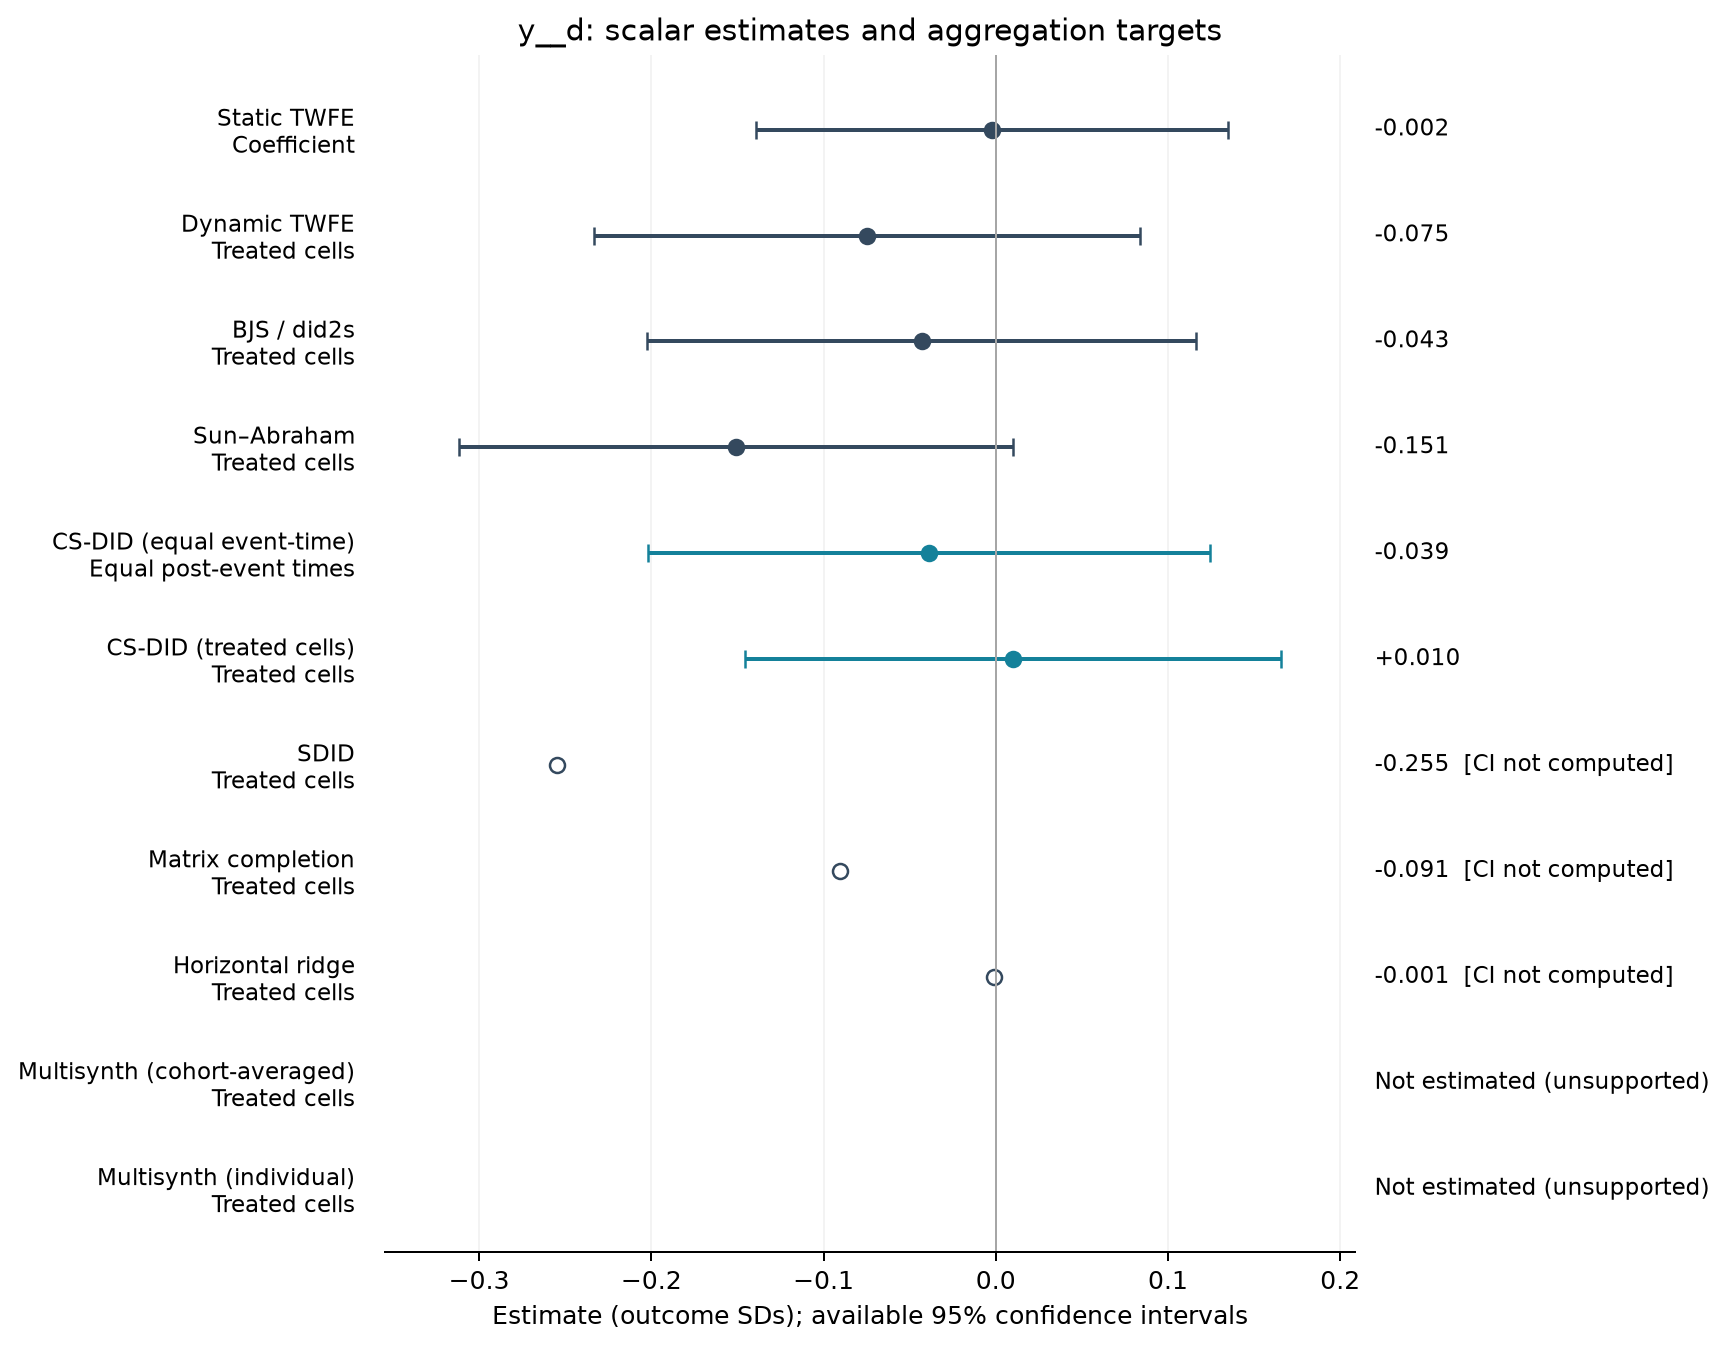
Trust toward minorities [Table 3 original scale]
1,131 observations · 19 units · 19 clusters · 13 treated / 6 control units.
Estimate comparison
| Estimator | Estimate (SDs) | SE | 95% CI | Averaging |
|---|---|---|---|---|
| Static TWFE | -0.002 | 0.065 | [-0.139, 0.135] | Coefficient |
| Dynamic TWFE | -0.075 | 0.075 | [-0.233, 0.084] | Treated cells |
| BJS / did2s | -0.043 | 0.076 | [-0.202, 0.116] | Treated cells |
| Sun–Abraham | -0.151 | 0.077 | [-0.312, 0.010] | Treated cells |
| CS-DID (equal event-time) | -0.039 | 0.083 | [-0.202, 0.124] | Equal post-event times |
| CS-DID (treated cells) | 0.010 | 0.079 | [-0.146, 0.166] | Treated cells |
| SDID | -0.255 | — | — | Treated cells |
| Matrix completion | -0.091 | — | — | Treated cells |
| Horizontal ridge | -0.001 | — | — | Treated cells |
Event studies
Periods −10 to +10; pointwise 95% intervals where available.
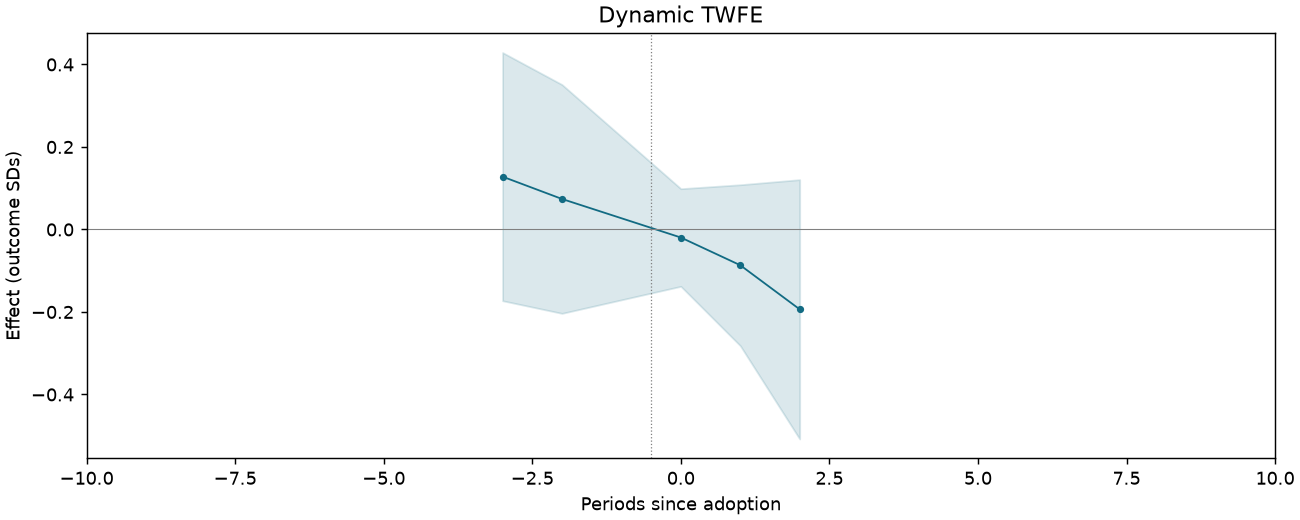
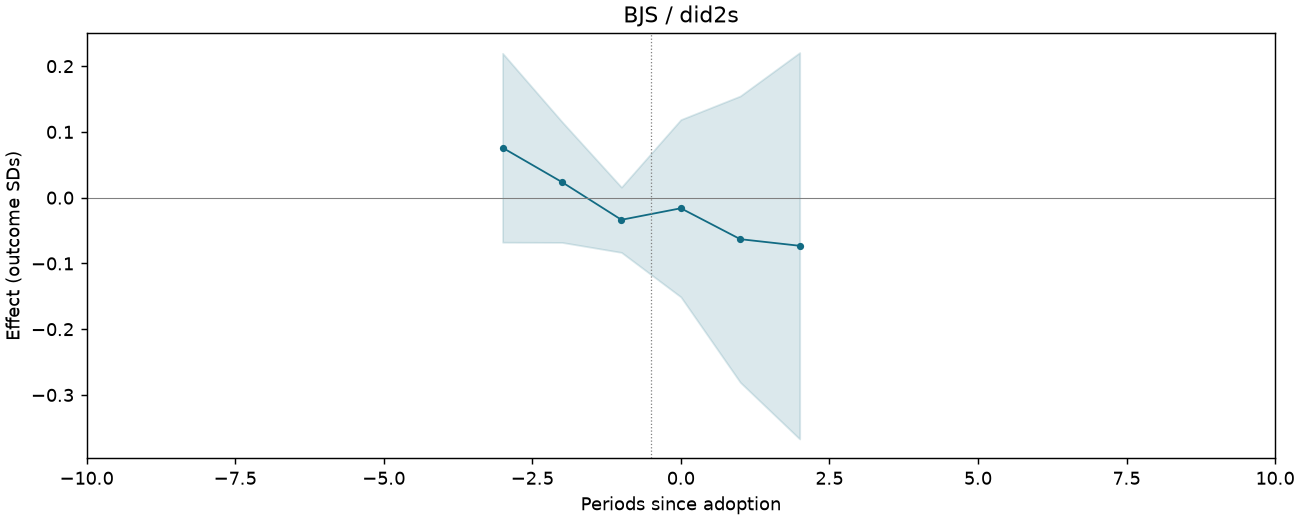
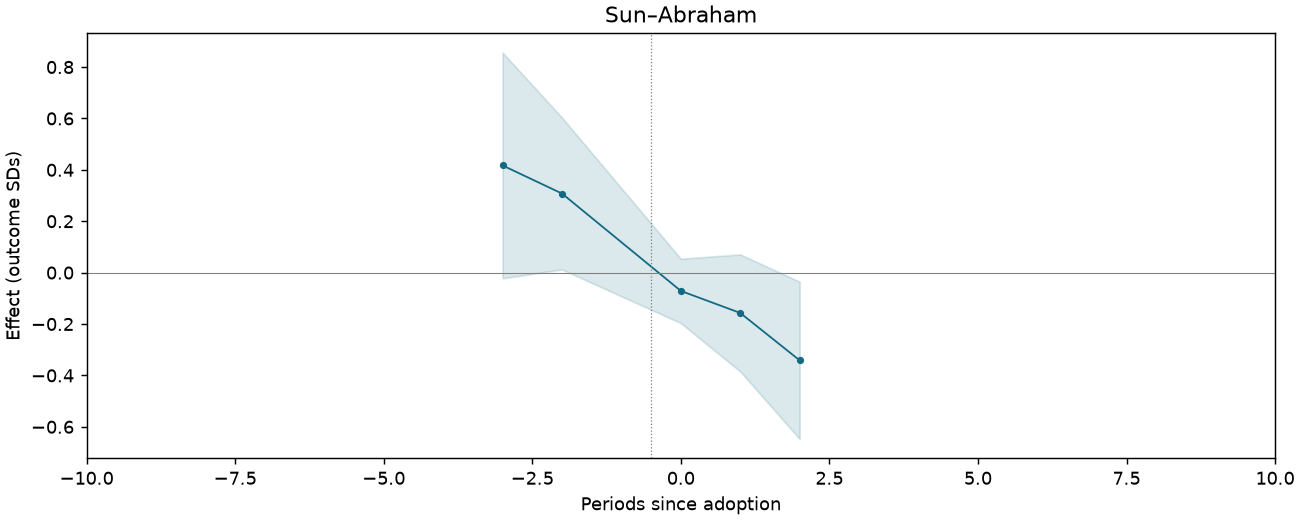
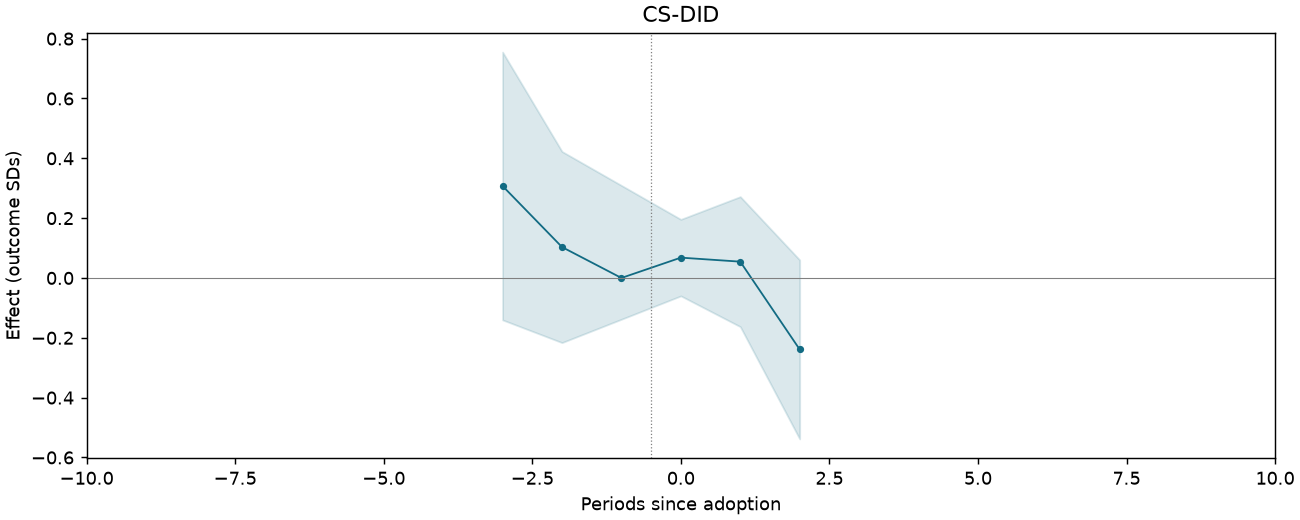
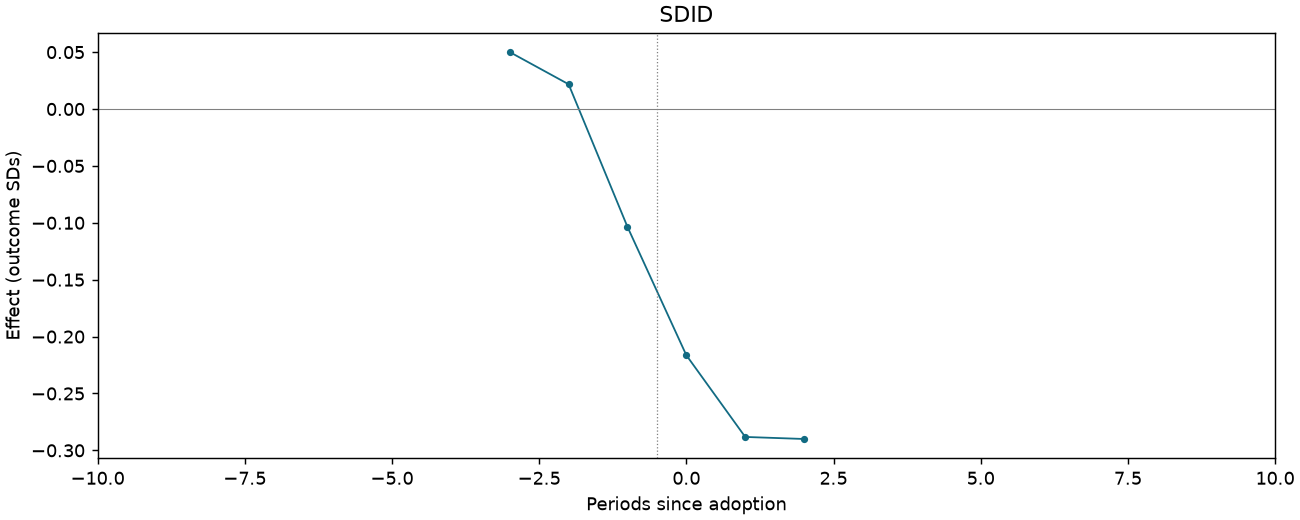
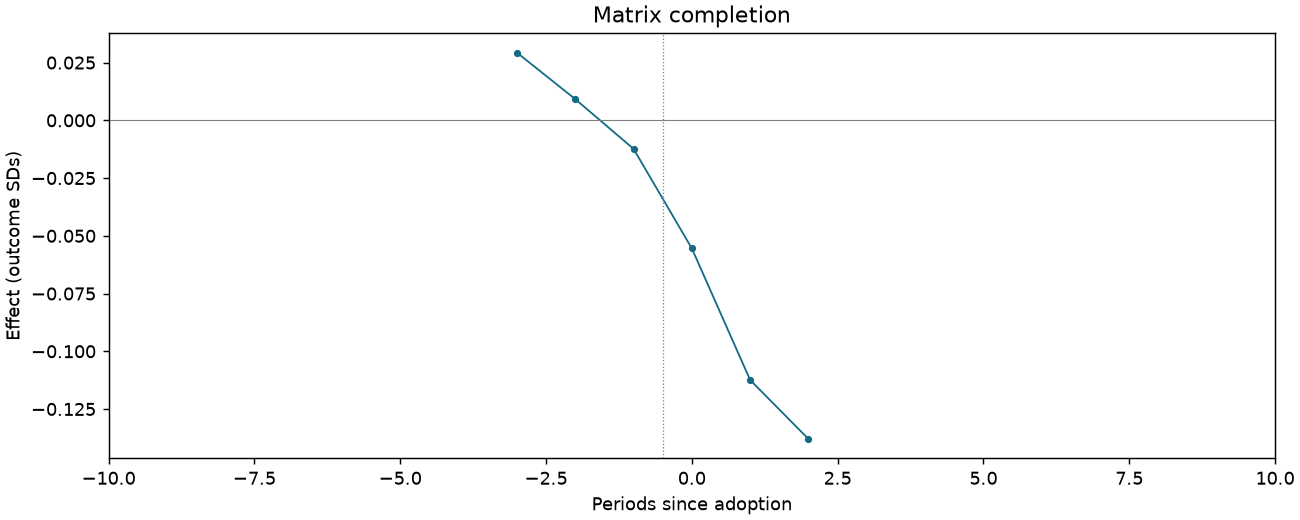
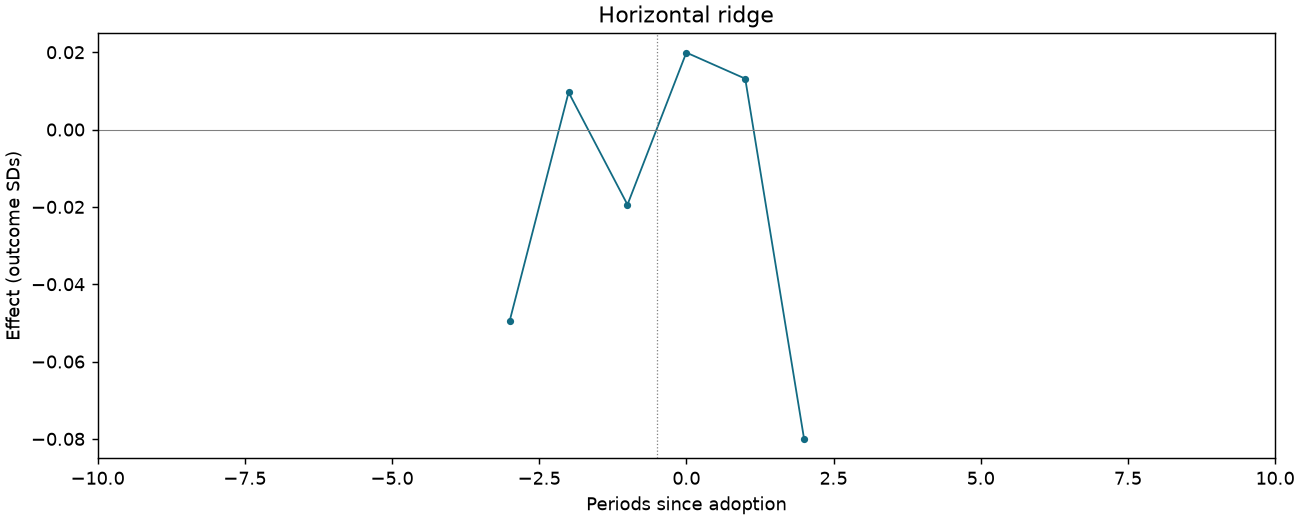
Han and minorities are similar [Table 3 original scale]
1,131 observations · 19 units · 19 clusters · 13 treated / 6 control units.
Estimate comparison
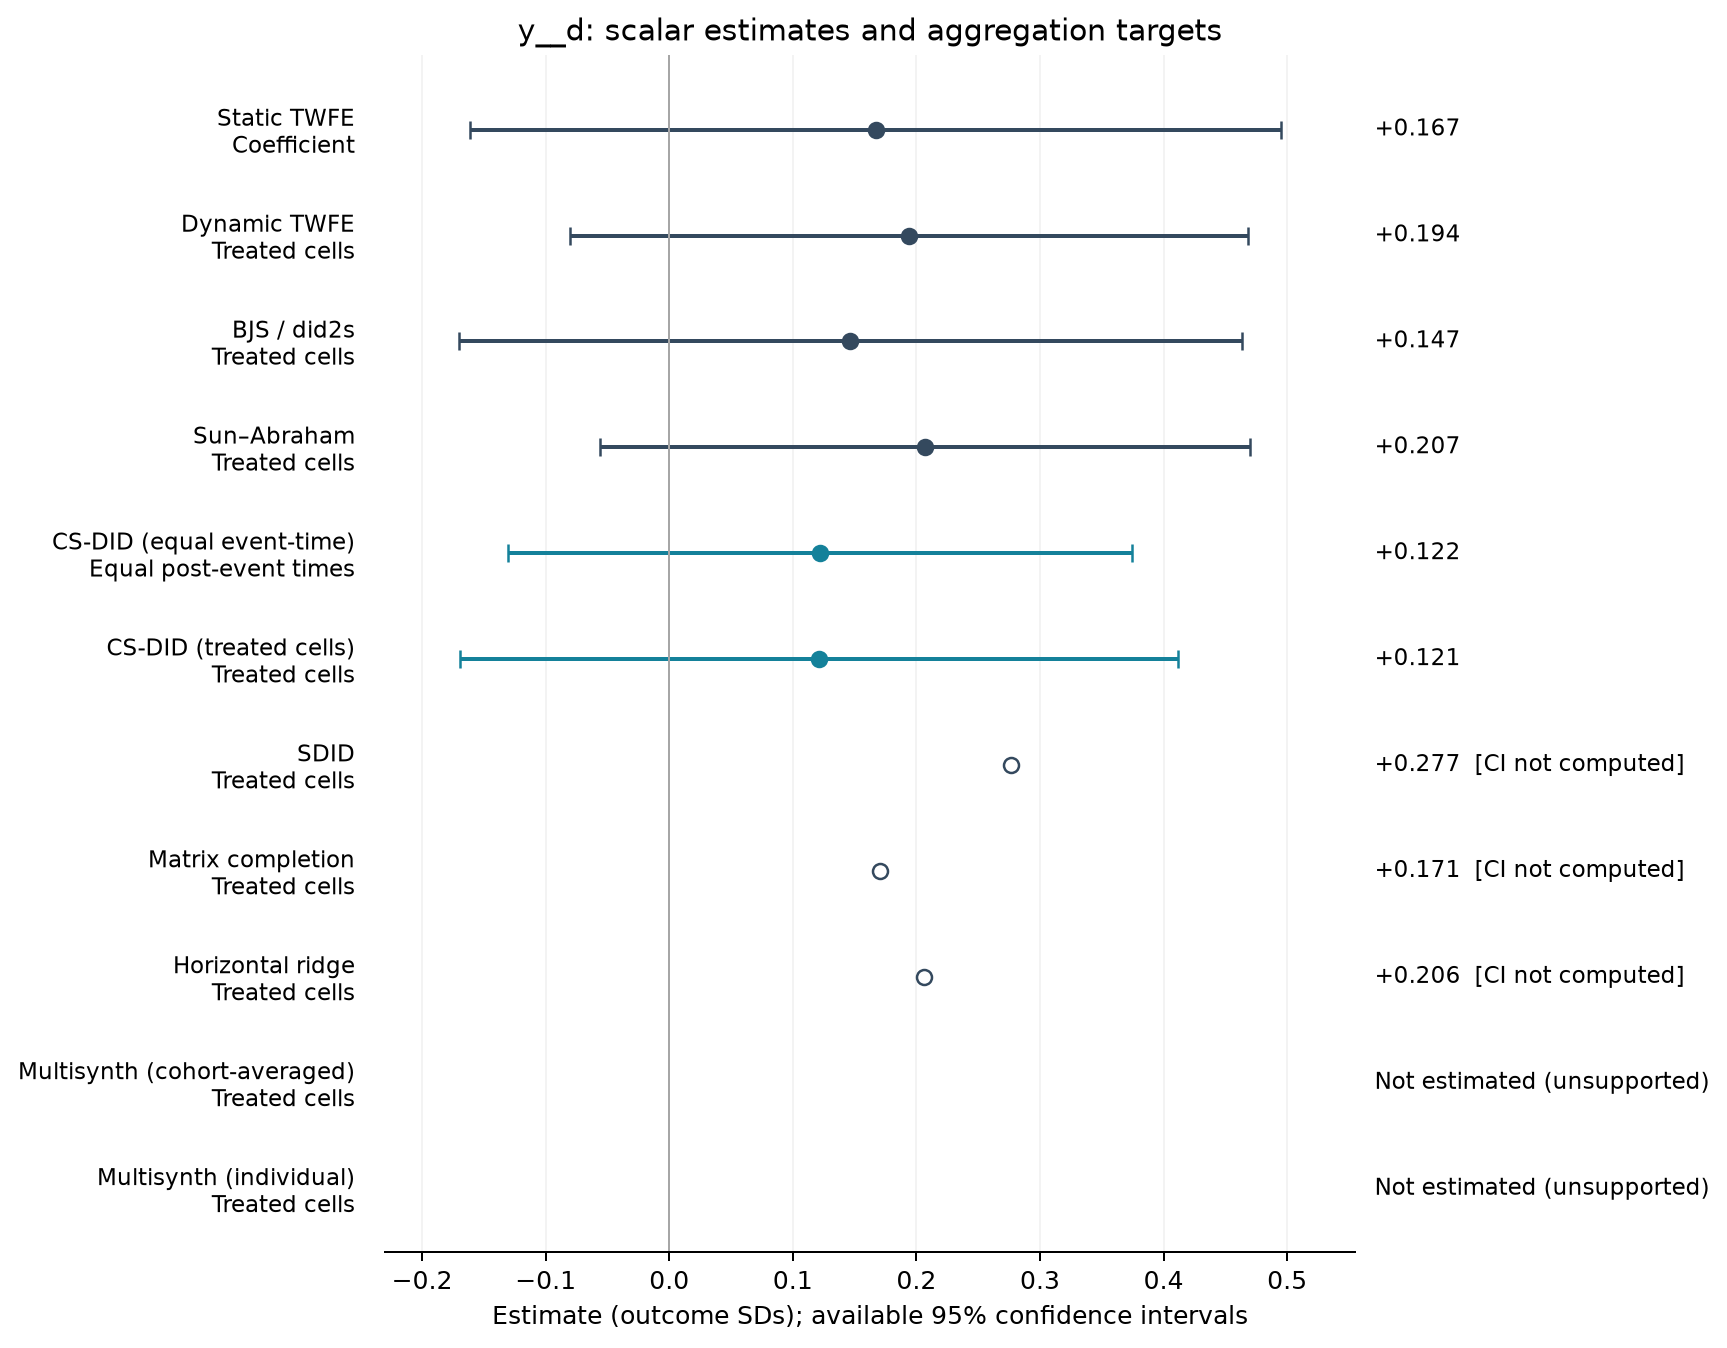
| Estimator | Estimate (SDs) | SE | 95% CI | Averaging |
|---|---|---|---|---|
| Static TWFE | 0.167 | 0.156 | [-0.161, 0.495] | Coefficient |
| Dynamic TWFE | 0.194 | 0.131 | [-0.081, 0.468] | Treated cells |
| BJS / did2s | 0.147 | 0.151 | [-0.170, 0.463] | Treated cells |
| Sun–Abraham | 0.207 | 0.125 | [-0.056, 0.470] | Treated cells |
| CS-DID (equal event-time) | 0.122 | 0.129 | [-0.131, 0.375] | Equal post-event times |
| CS-DID (treated cells) | 0.121 | 0.148 | [-0.170, 0.412] | Treated cells |
| SDID | 0.277 | — | — | Treated cells |
| Matrix completion | 0.171 | — | — | Treated cells |
| Horizontal ridge | 0.206 | — | — | Treated cells |
Event studies
Periods −10 to +10; pointwise 95% intervals where available.
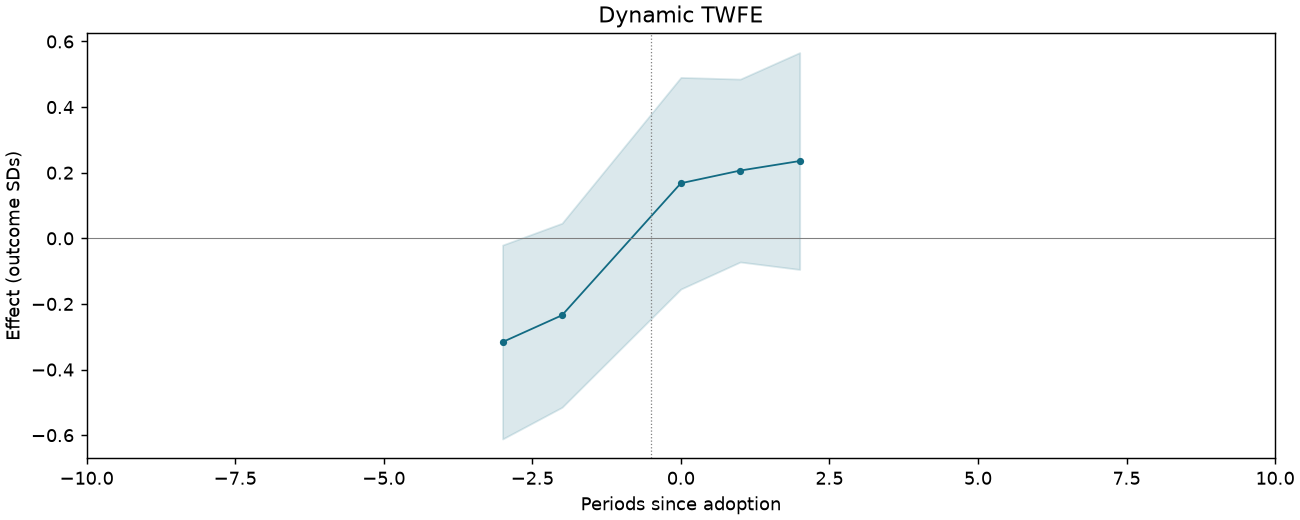
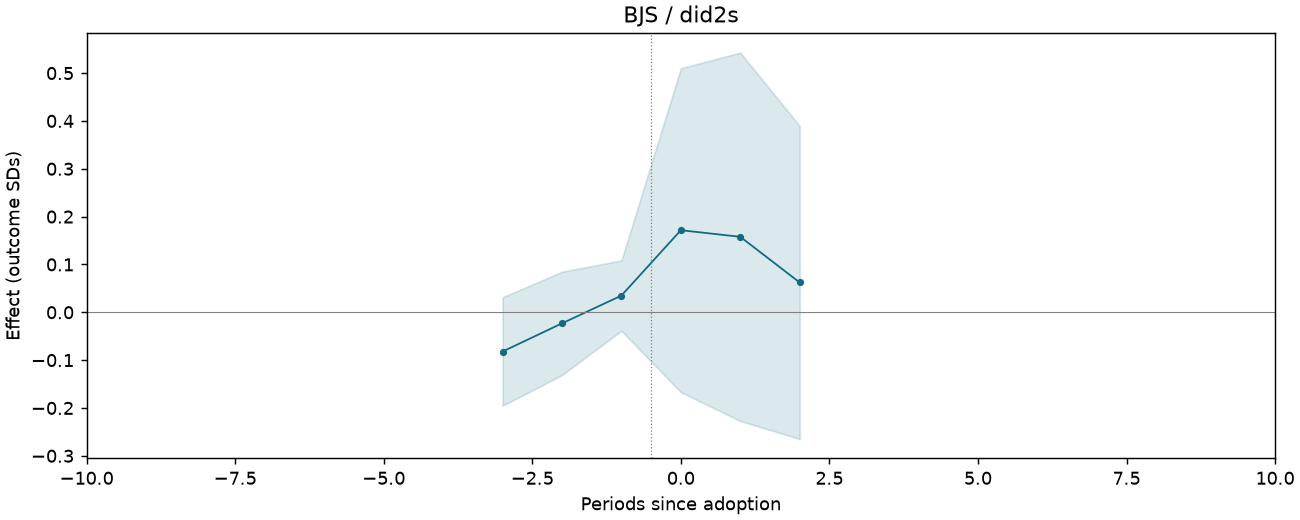
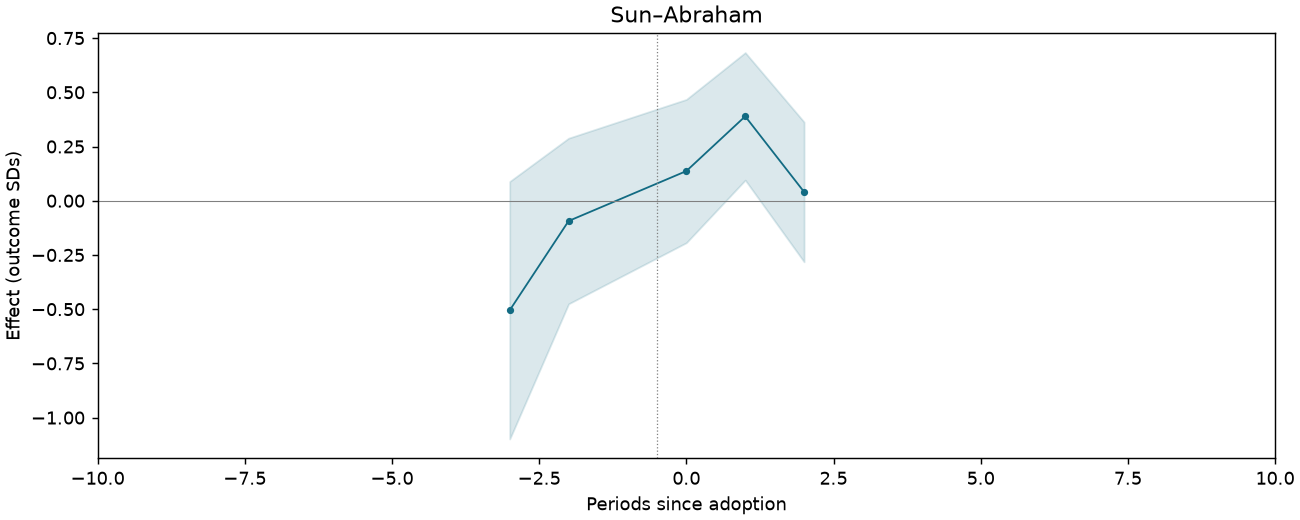
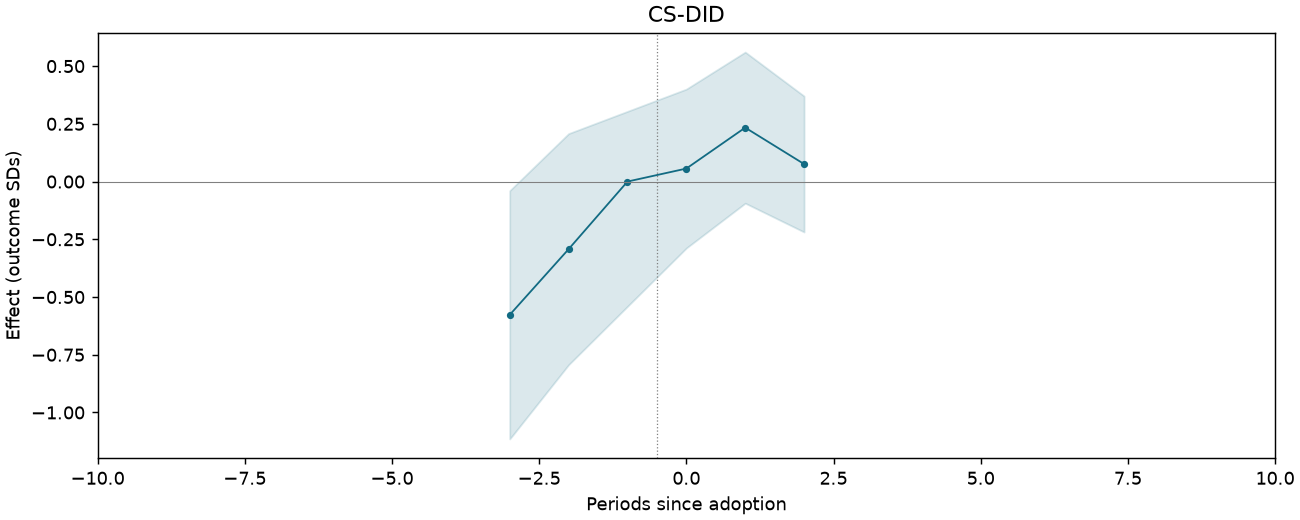
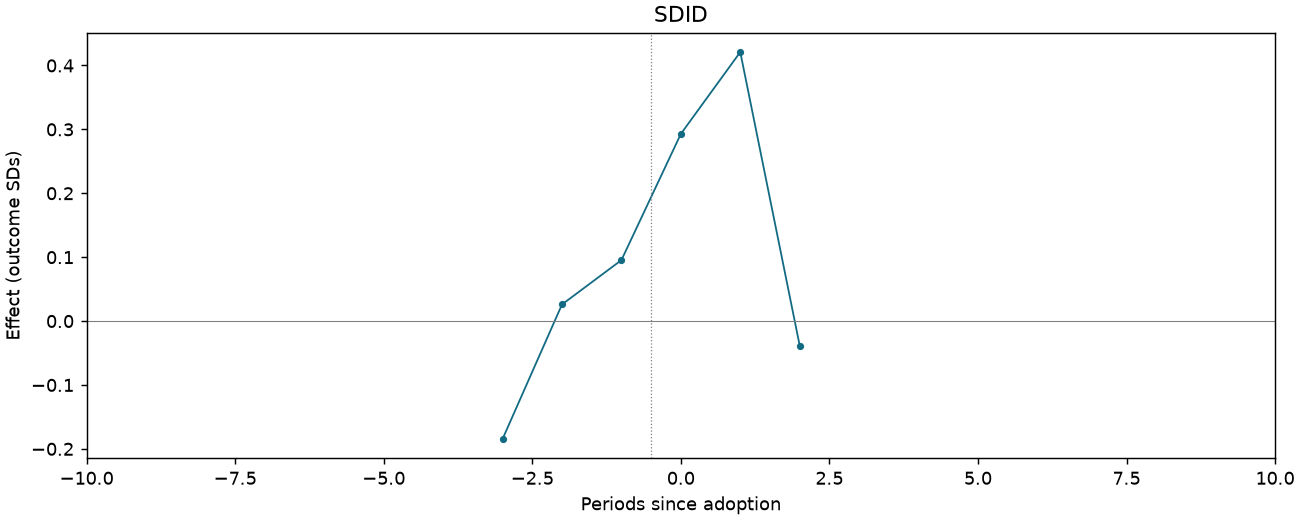
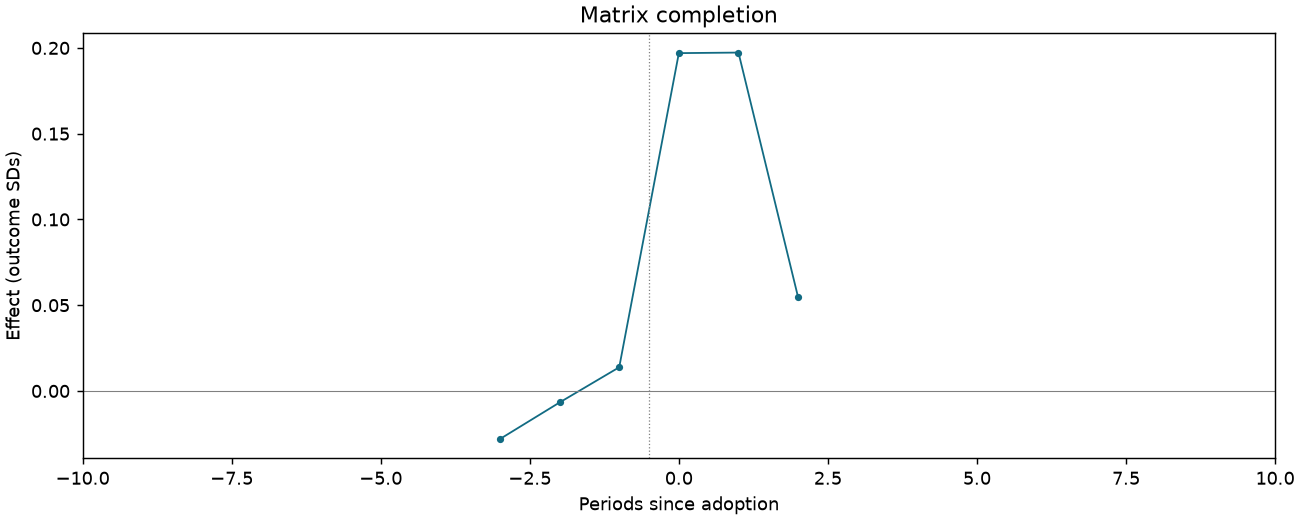
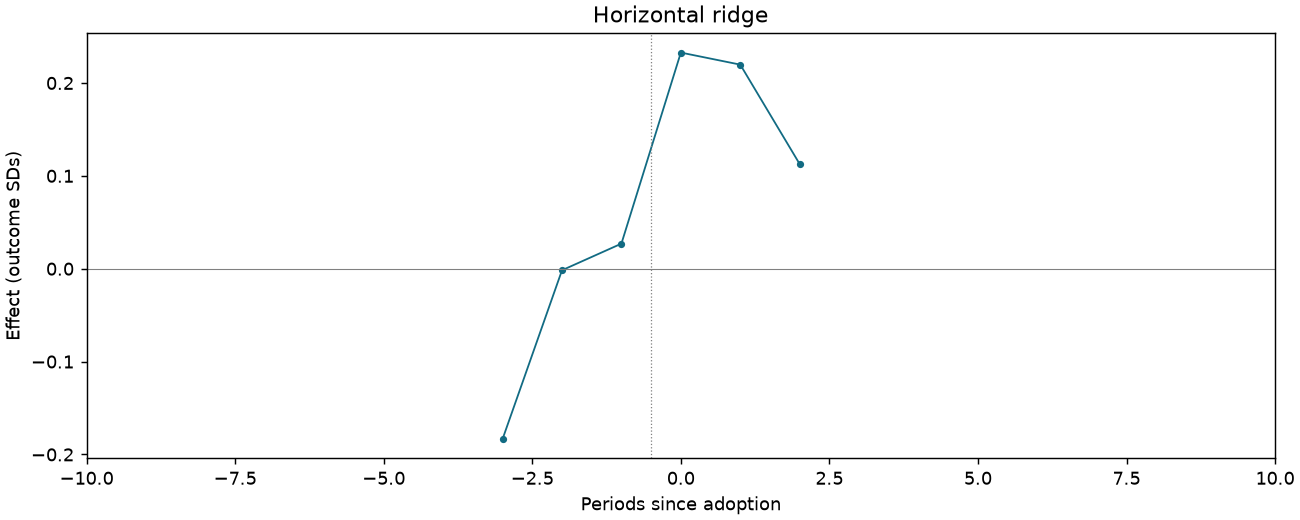
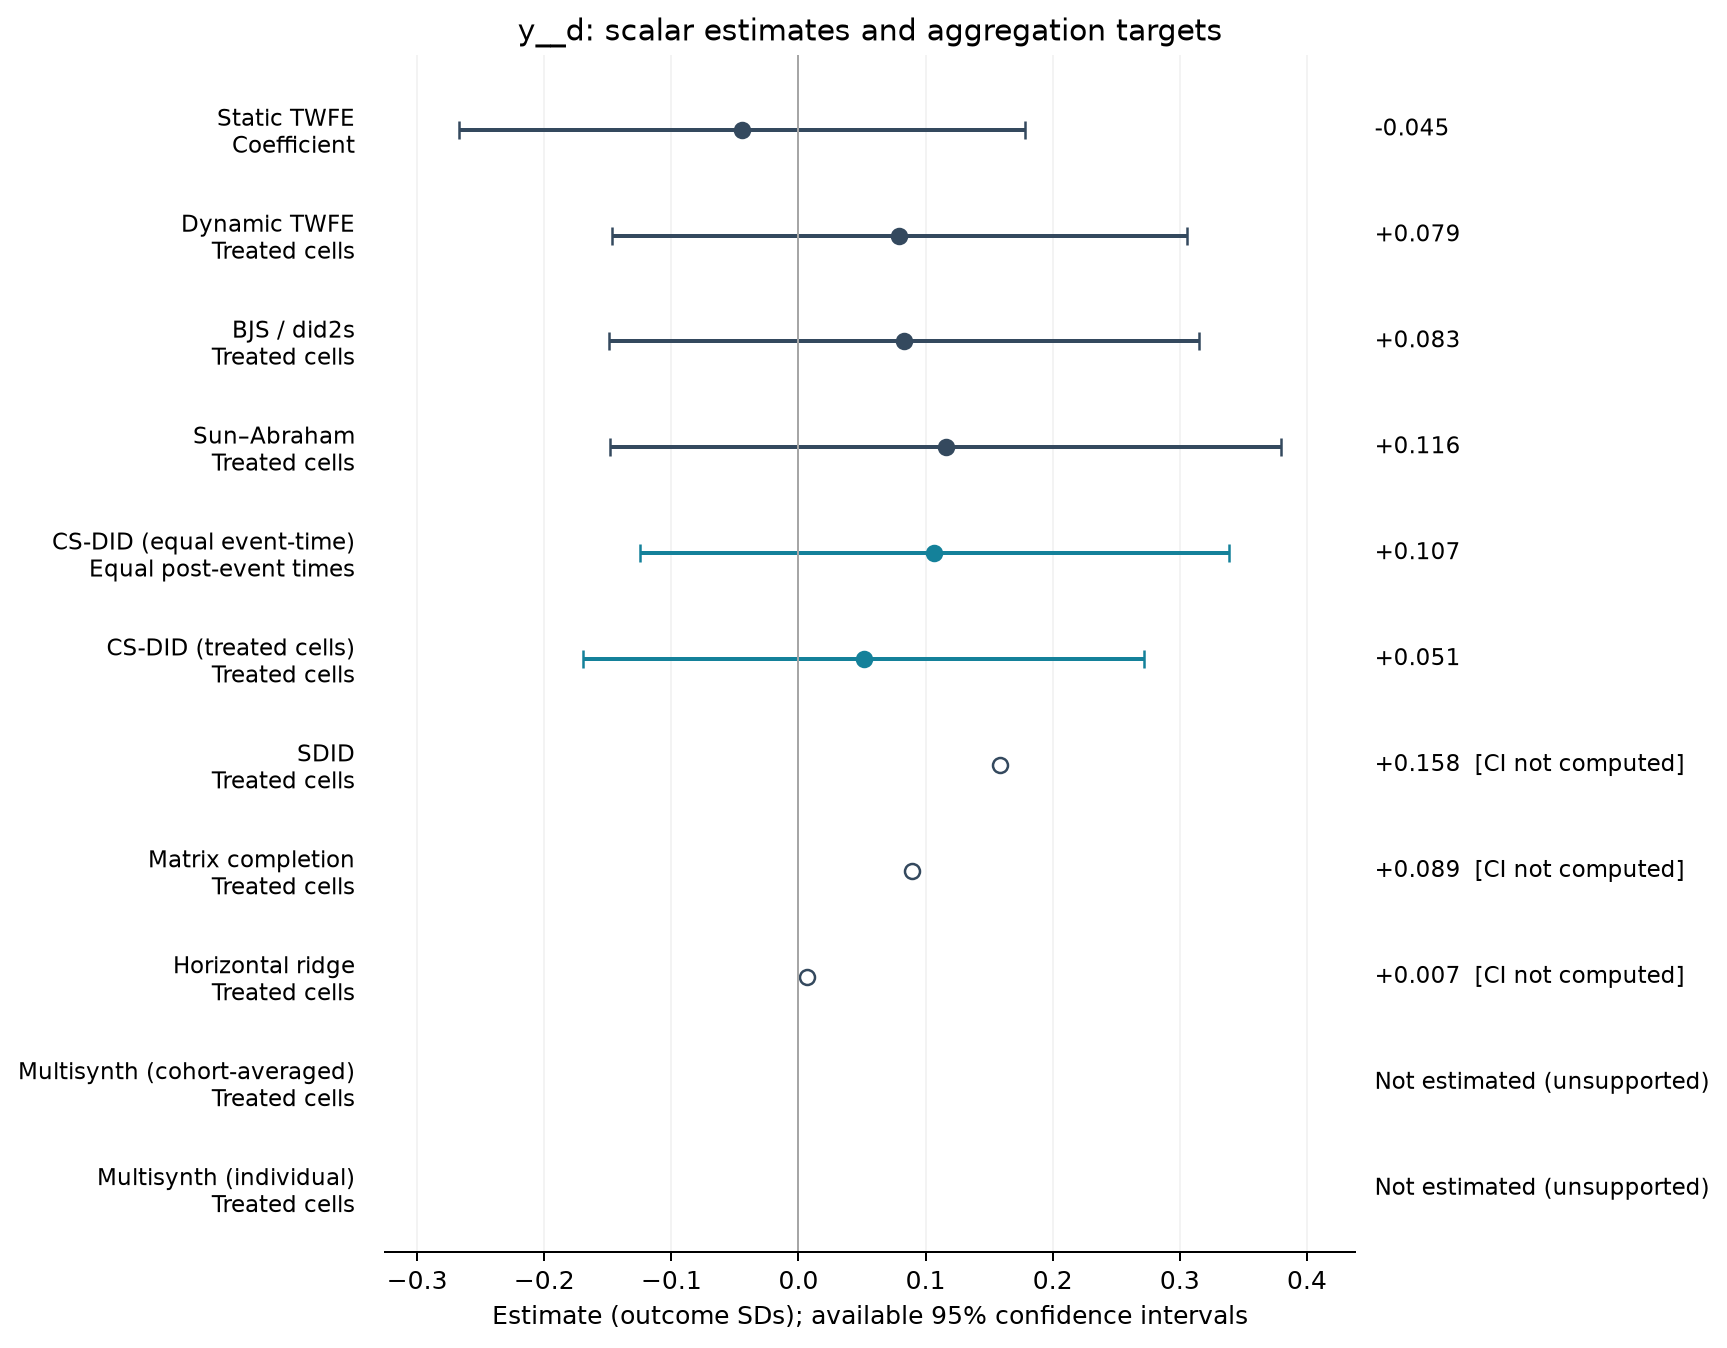
Han and minorities share heritage [Table 3 original scale]
1,131 observations · 19 units · 19 clusters · 13 treated / 6 control units.
Estimate comparison
| Estimator | Estimate (SDs) | SE | 95% CI | Averaging |
|---|---|---|---|---|
| Static TWFE | -0.045 | 0.106 | [-0.267, 0.178] | Coefficient |
| Dynamic TWFE | 0.079 | 0.108 | [-0.147, 0.305] | Treated cells |
| BJS / did2s | 0.083 | 0.110 | [-0.149, 0.315] | Treated cells |
| Sun–Abraham | 0.116 | 0.126 | [-0.148, 0.380] | Treated cells |
| CS-DID (equal event-time) | 0.107 | 0.118 | [-0.125, 0.339] | Equal post-event times |
| CS-DID (treated cells) | 0.051 | 0.113 | [-0.169, 0.272] | Treated cells |
| SDID | 0.158 | — | — | Treated cells |
| Matrix completion | 0.089 | — | — | Treated cells |
| Horizontal ridge | 0.007 | — | — | Treated cells |
Event studies
Periods −10 to +10; pointwise 95% intervals where available.
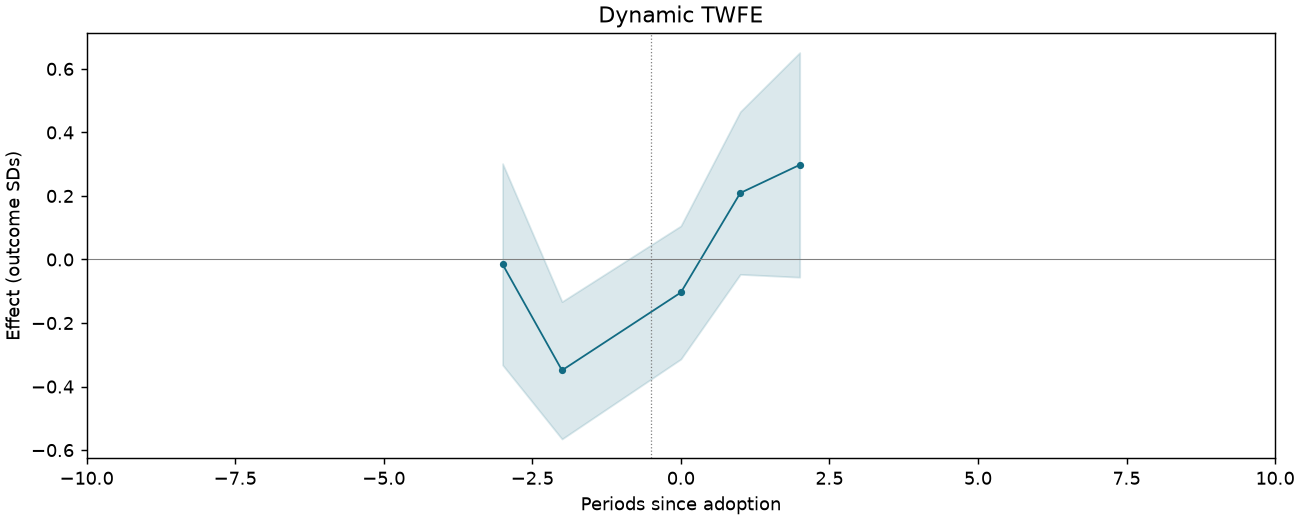
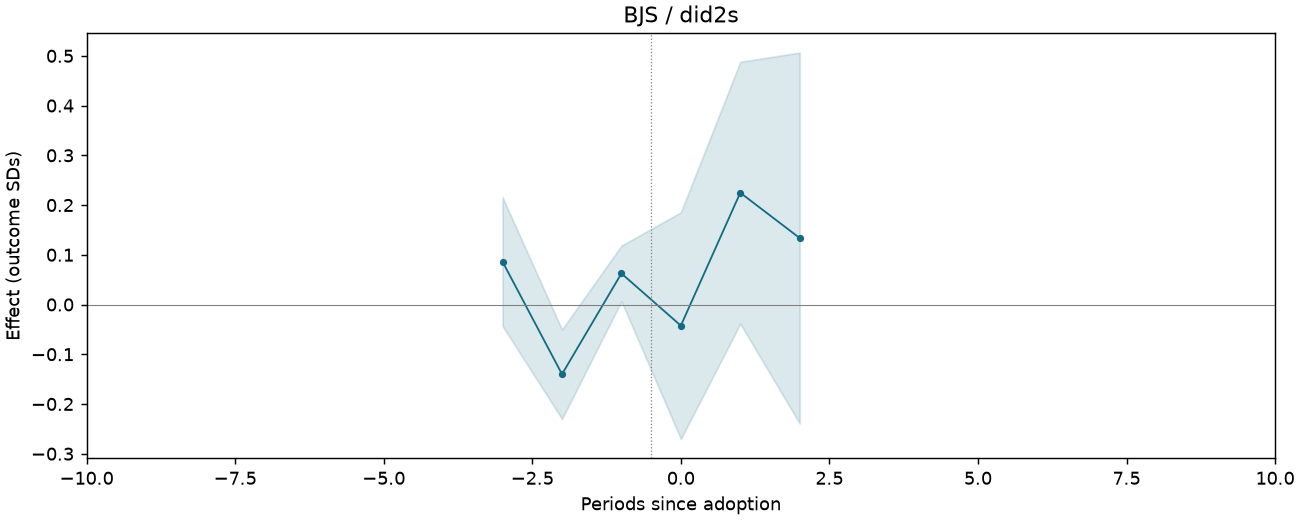
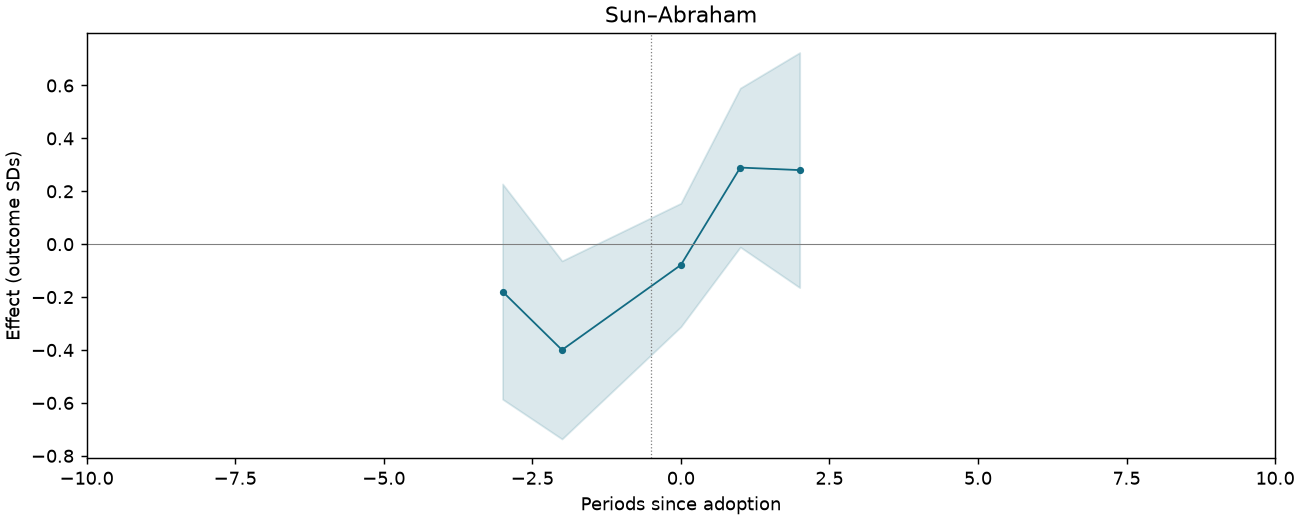
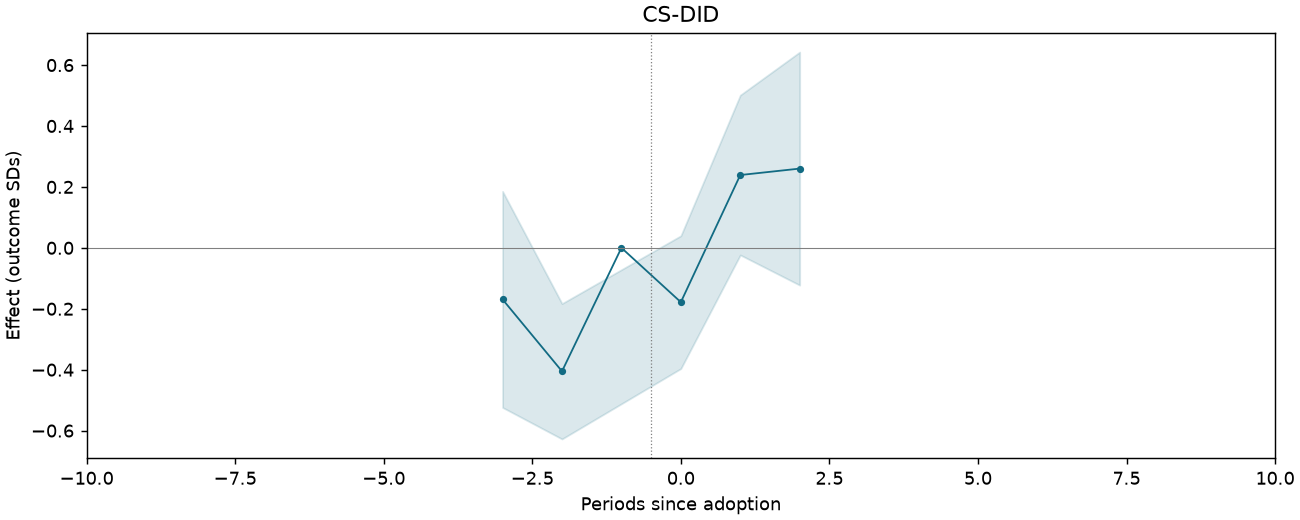
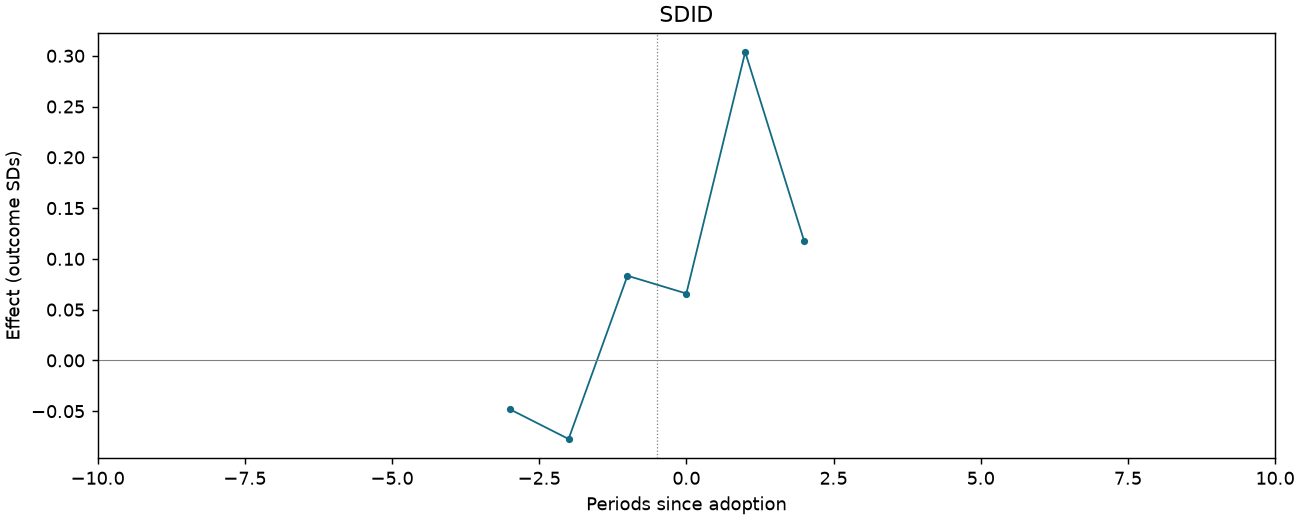
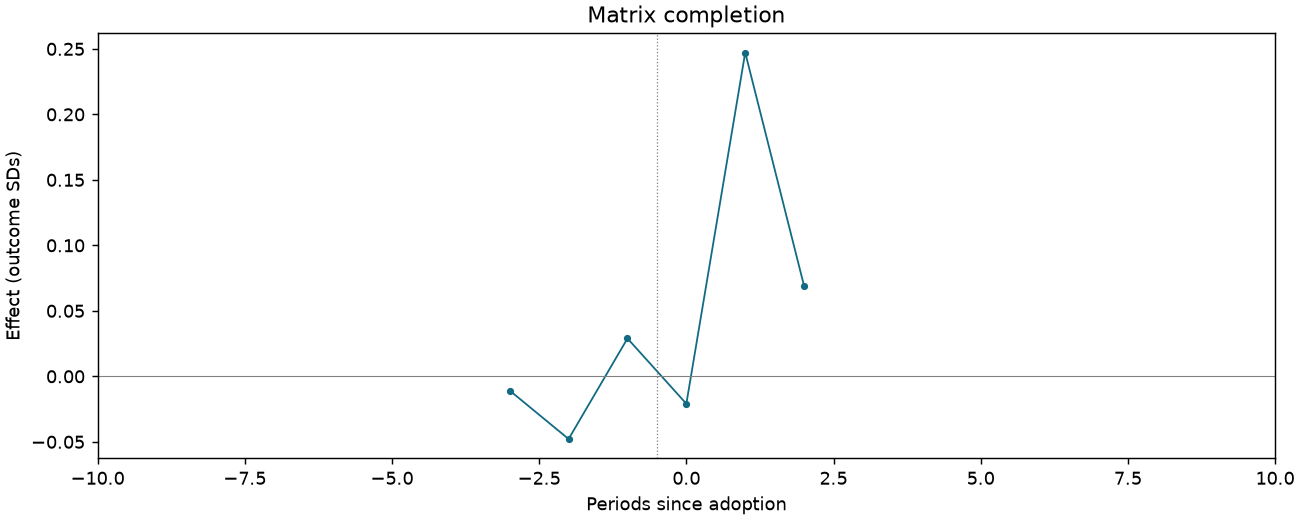
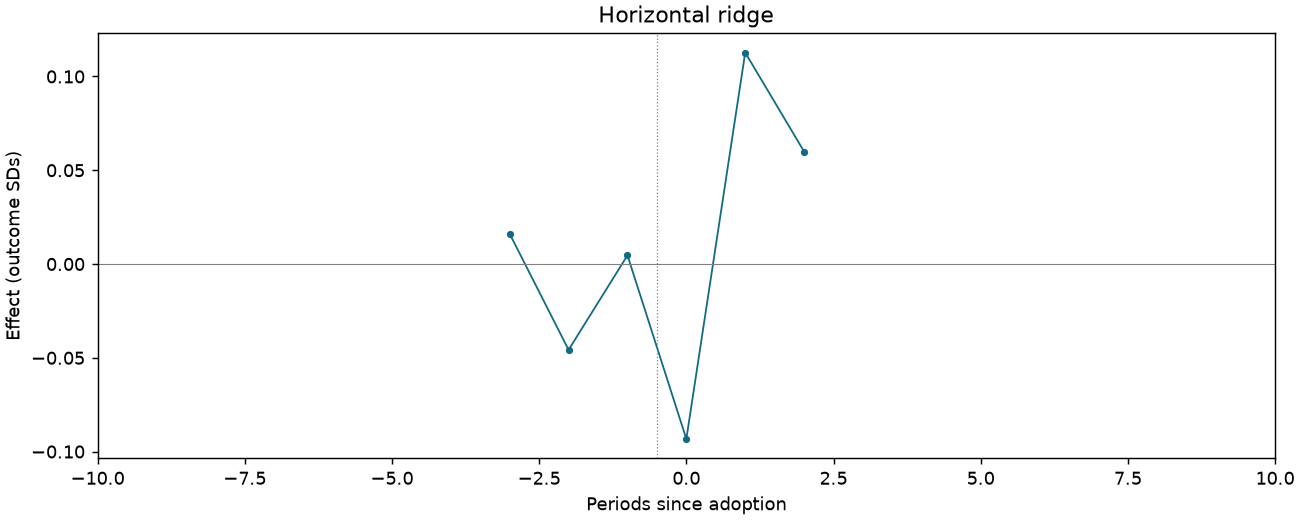
Willing to marry minority [Table 3 original scale]
1,131 observations · 19 units · 19 clusters · 13 treated / 6 control units.
Estimate comparison
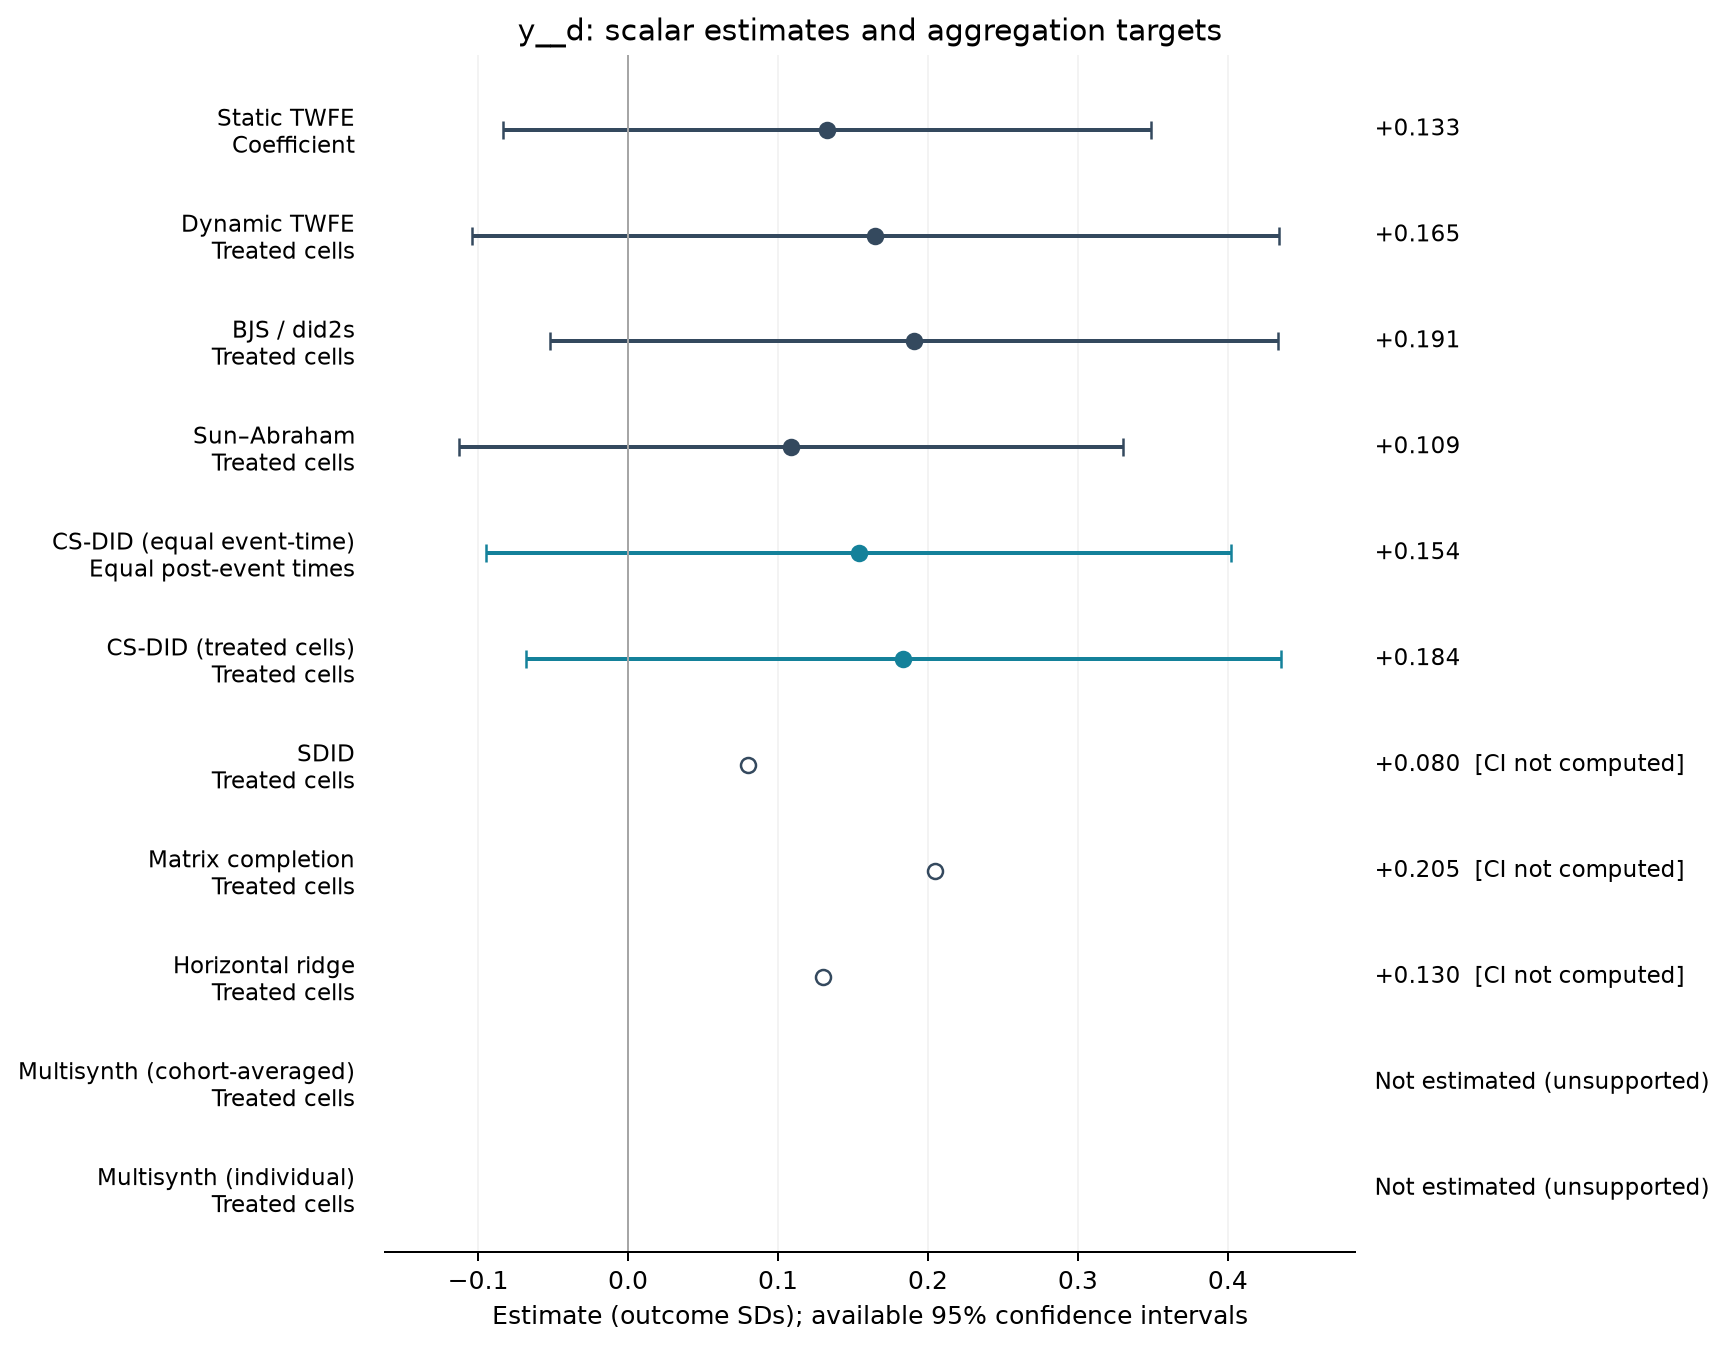
| Estimator | Estimate (SDs) | SE | 95% CI | Averaging |
|---|---|---|---|---|
| Static TWFE | 0.133 | 0.103 | [-0.083, 0.349] | Coefficient |
| Dynamic TWFE | 0.165 | 0.128 | [-0.104, 0.434] | Treated cells |
| BJS / did2s | 0.191 | 0.116 | [-0.052, 0.434] | Treated cells |
| Sun–Abraham | 0.109 | 0.105 | [-0.113, 0.330] | Treated cells |
| CS-DID (equal event-time) | 0.154 | 0.127 | [-0.095, 0.402] | Equal post-event times |
| CS-DID (treated cells) | 0.184 | 0.129 | [-0.068, 0.436] | Treated cells |
| SDID | 0.080 | — | — | Treated cells |
| Matrix completion | 0.205 | — | — | Treated cells |
| Horizontal ridge | 0.130 | — | — | Treated cells |
Event studies
Periods −10 to +10; pointwise 95% intervals where available.
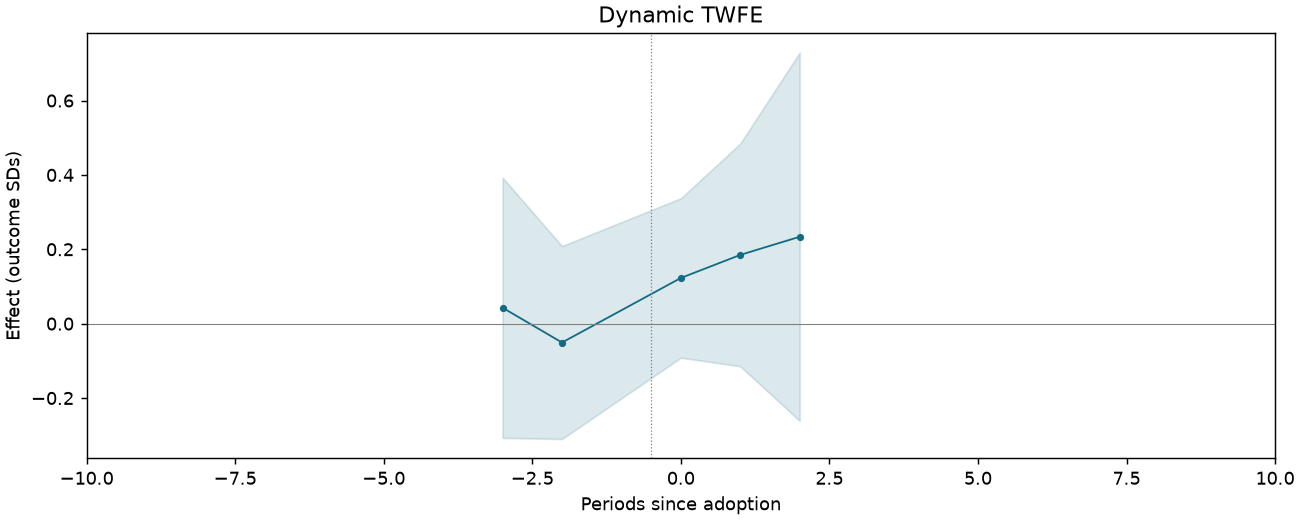
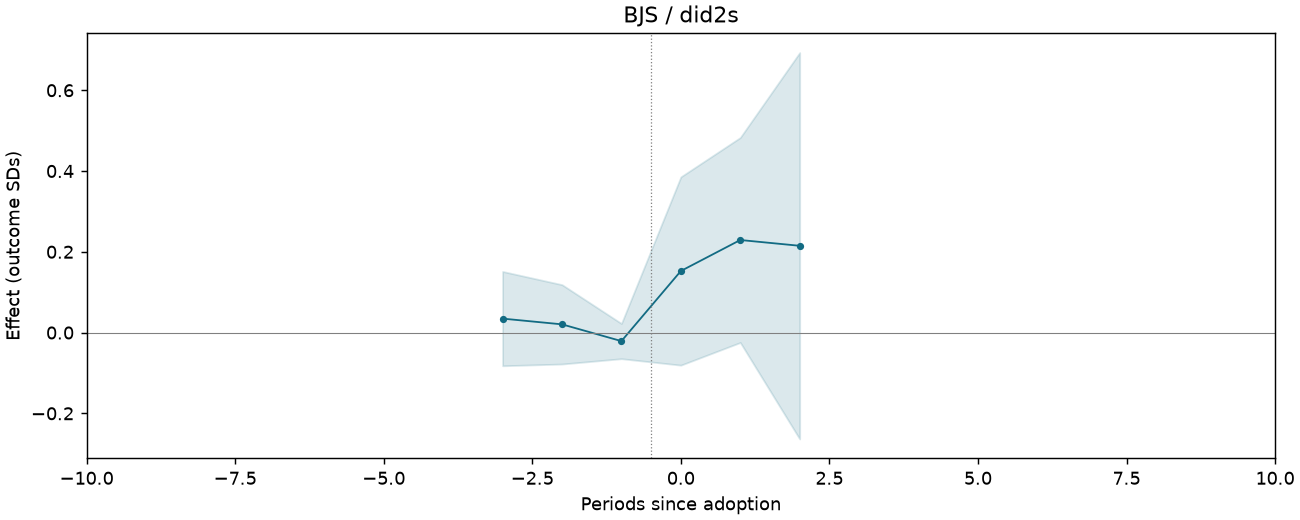
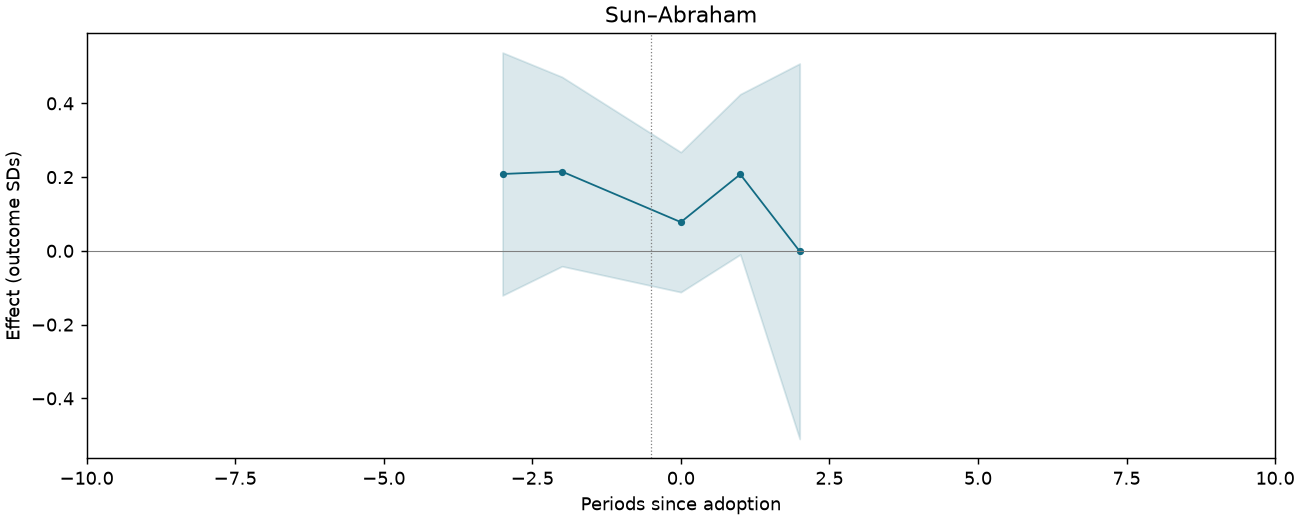
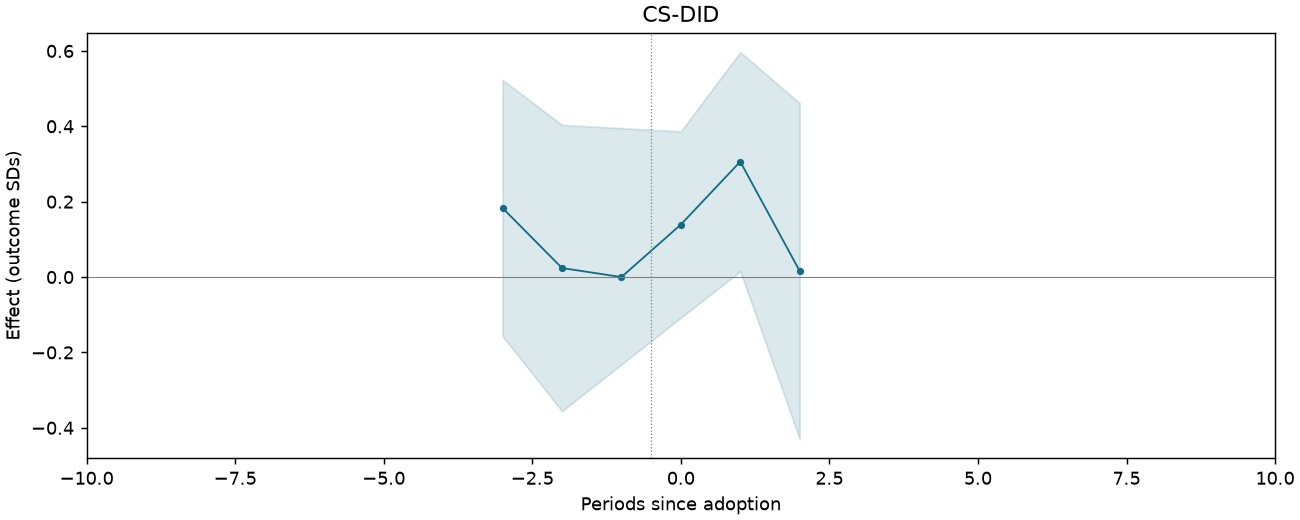
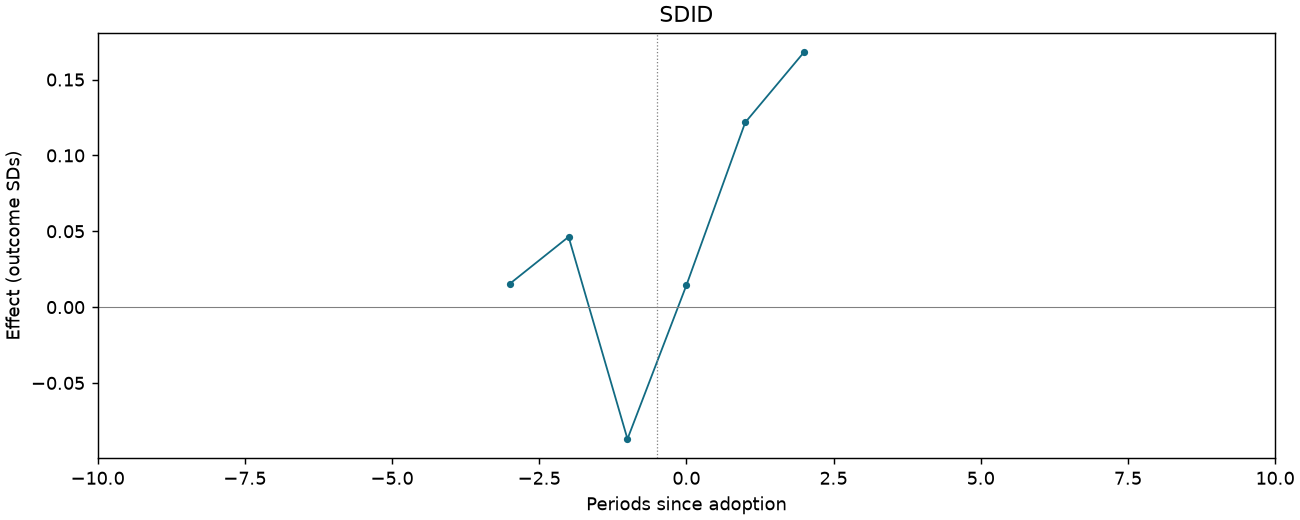
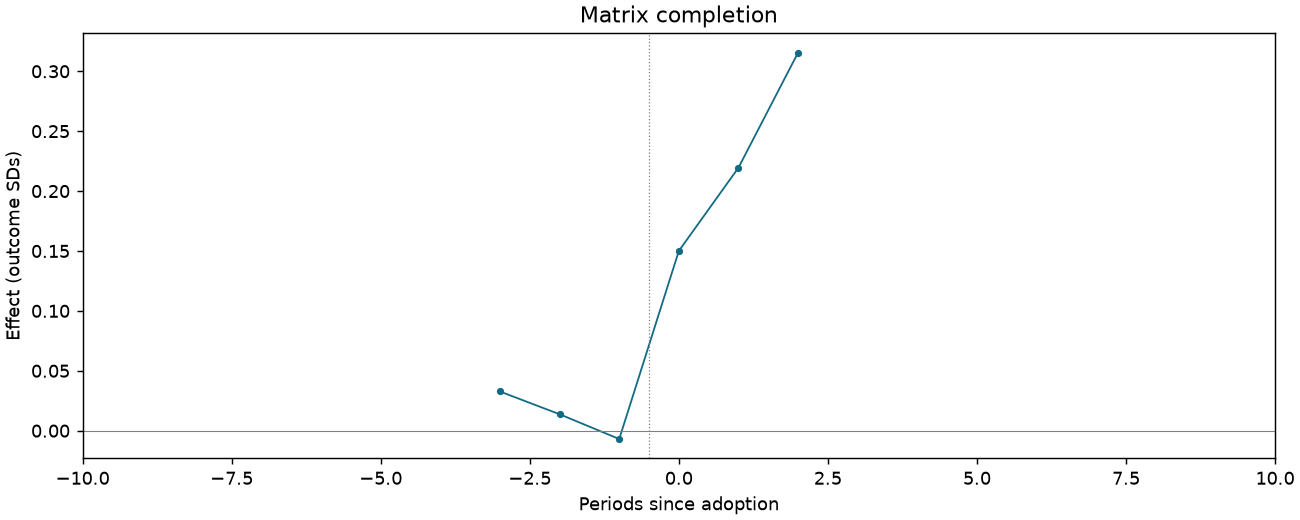
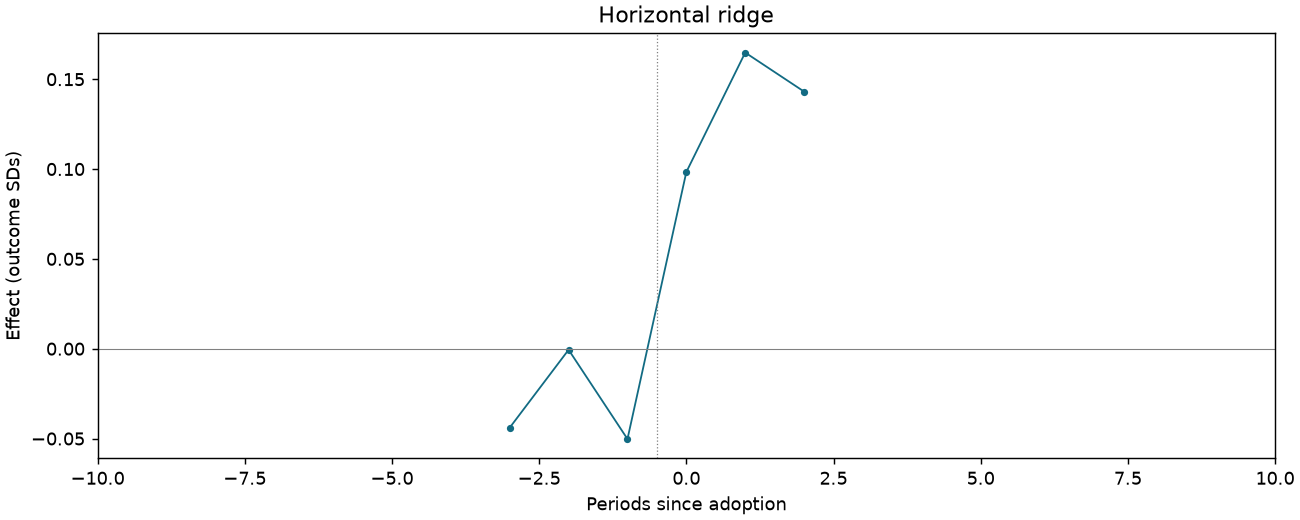
Ethnic identity z-score index [Table 3 original scale]
1,131 observations · 19 units · 19 clusters · 13 treated / 6 control units.
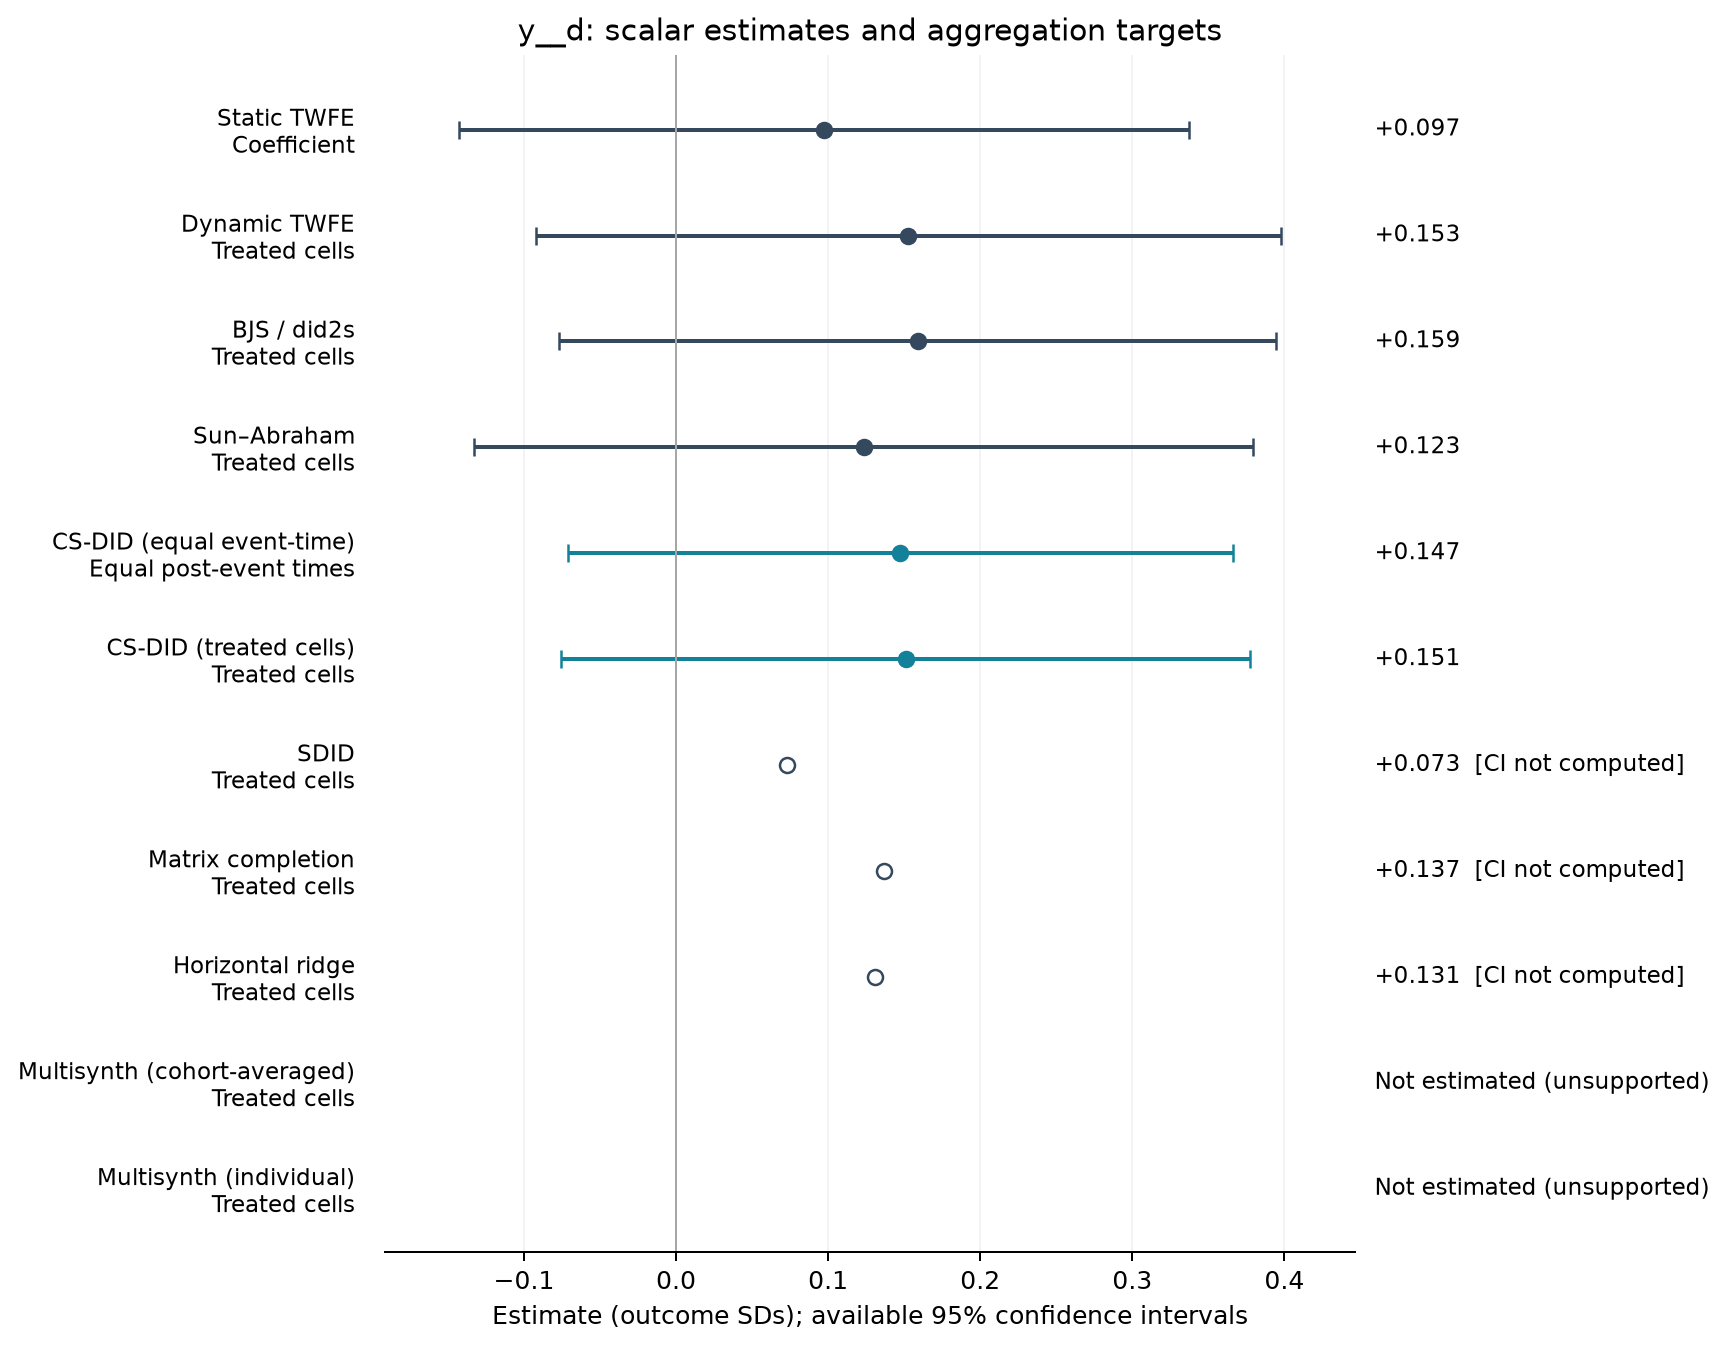
Estimate comparison
| Estimator | Estimate (SDs) | SE | 95% CI | Averaging |
|---|---|---|---|---|
| Static TWFE | 0.097 | 0.114 | [-0.143, 0.337] | Coefficient |
| Dynamic TWFE | 0.153 | 0.117 | [-0.092, 0.398] | Treated cells |
| BJS / did2s | 0.159 | 0.112 | [-0.077, 0.395] | Treated cells |
| Sun–Abraham | 0.123 | 0.122 | [-0.133, 0.380] | Treated cells |
| CS-DID (equal event-time) | 0.147 | 0.111 | [-0.071, 0.366] | Equal post-event times |
| CS-DID (treated cells) | 0.151 | 0.116 | [-0.075, 0.378] | Treated cells |
| SDID | 0.073 | — | — | Treated cells |
| Matrix completion | 0.137 | — | — | Treated cells |
| Horizontal ridge | 0.131 | — | — | Treated cells |
Event studies
Periods −10 to +10; pointwise 95% intervals where available.
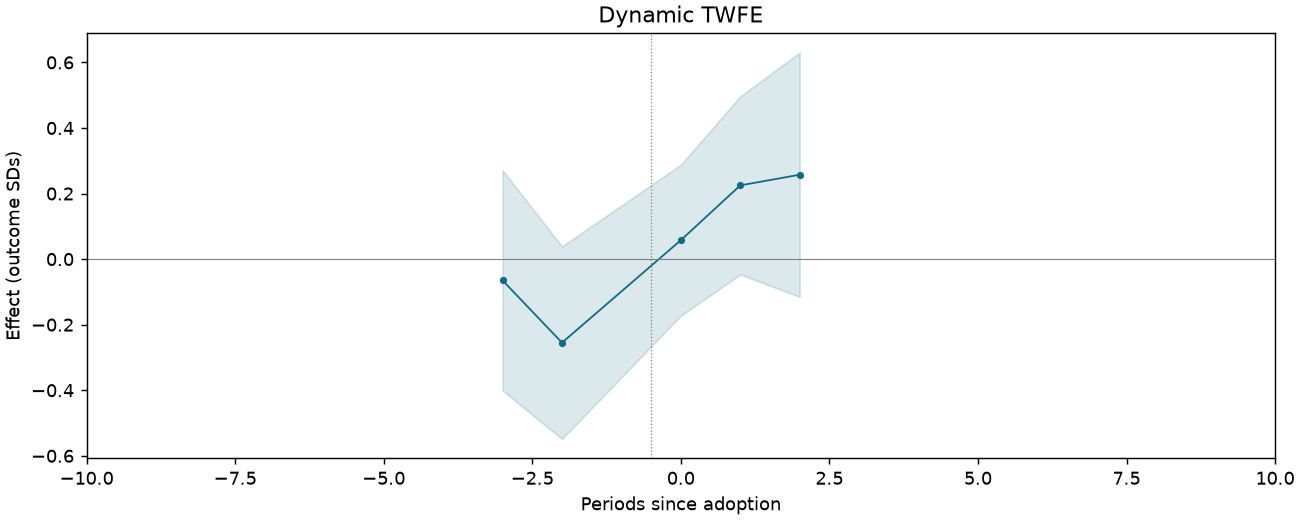
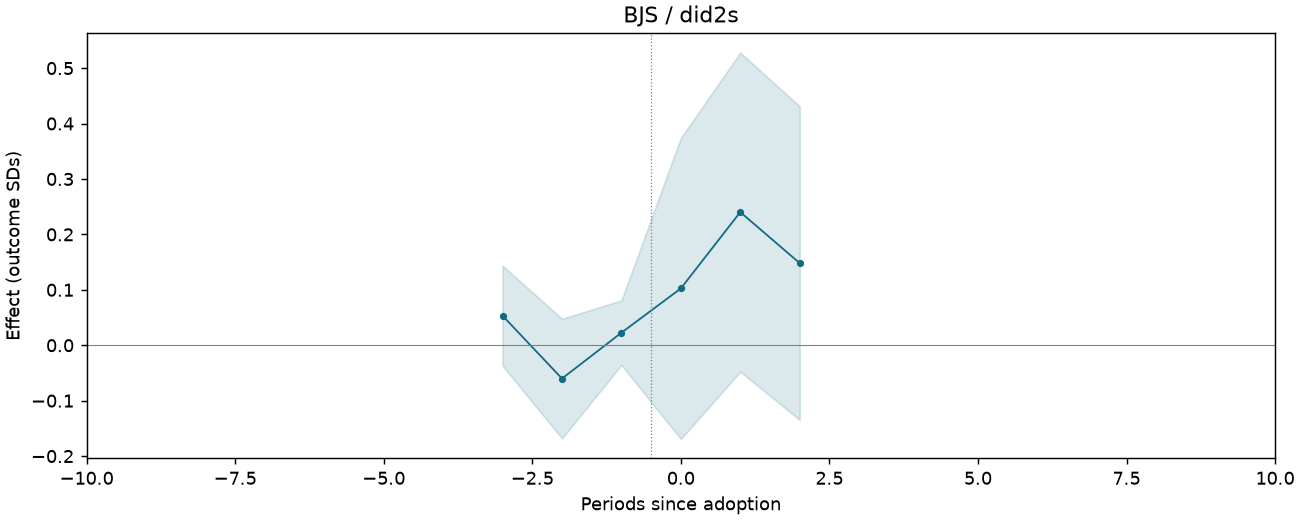
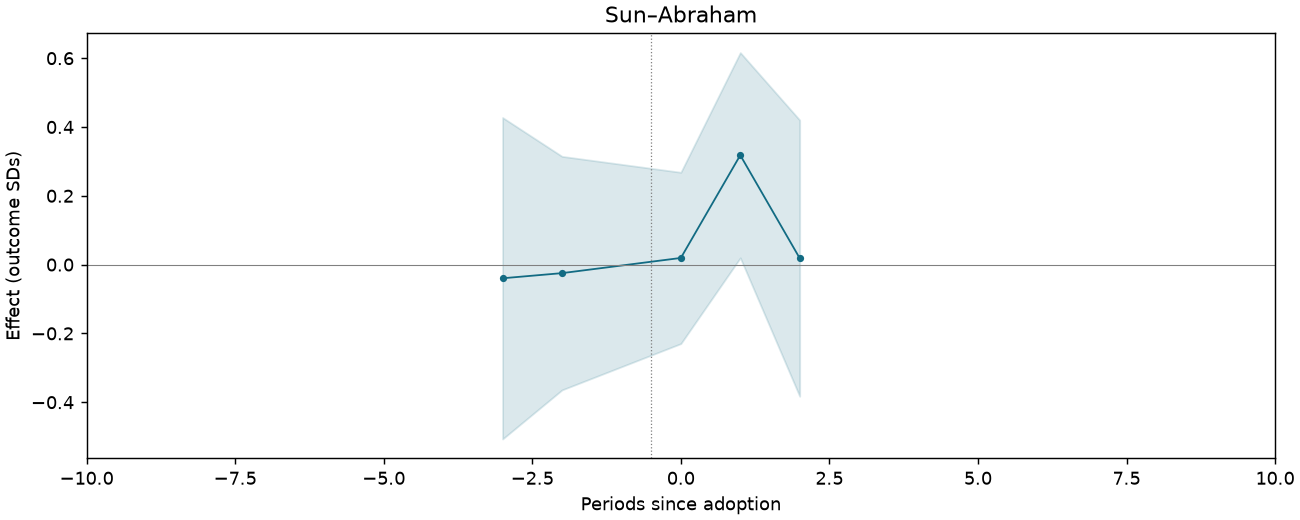
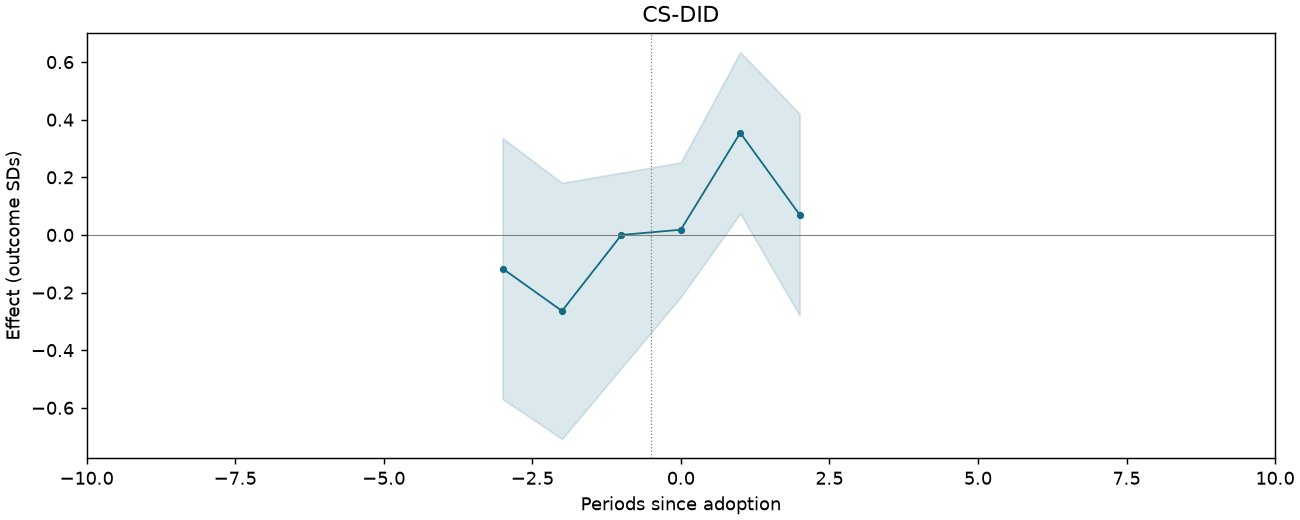
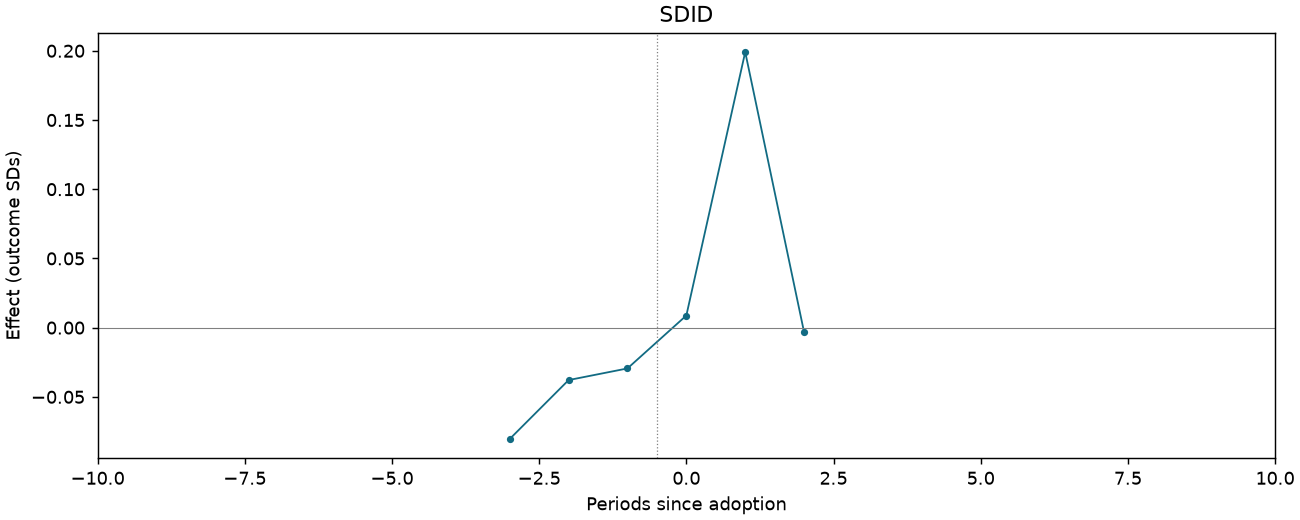
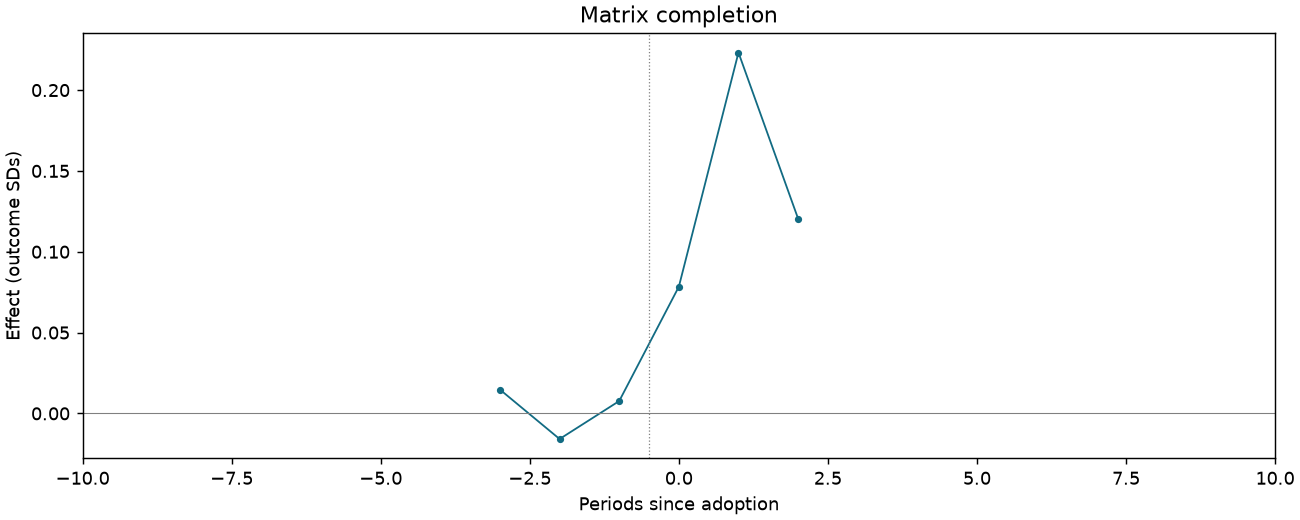
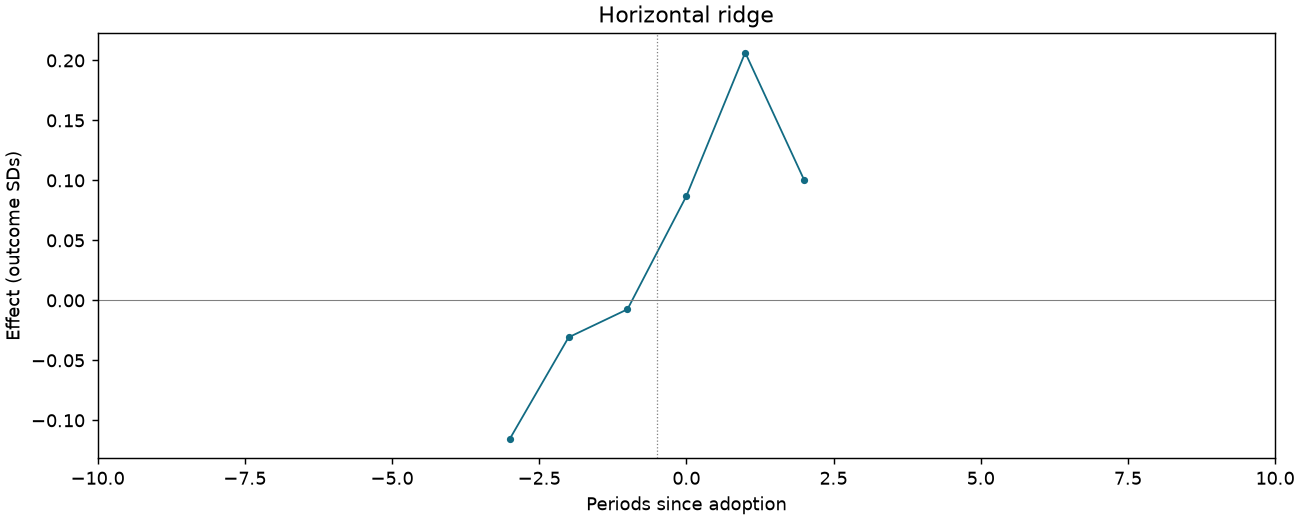
Identity: Chinese [Table 3 original scale]
1,067 observations · 19 units · 19 clusters · 13 treated / 6 control units.
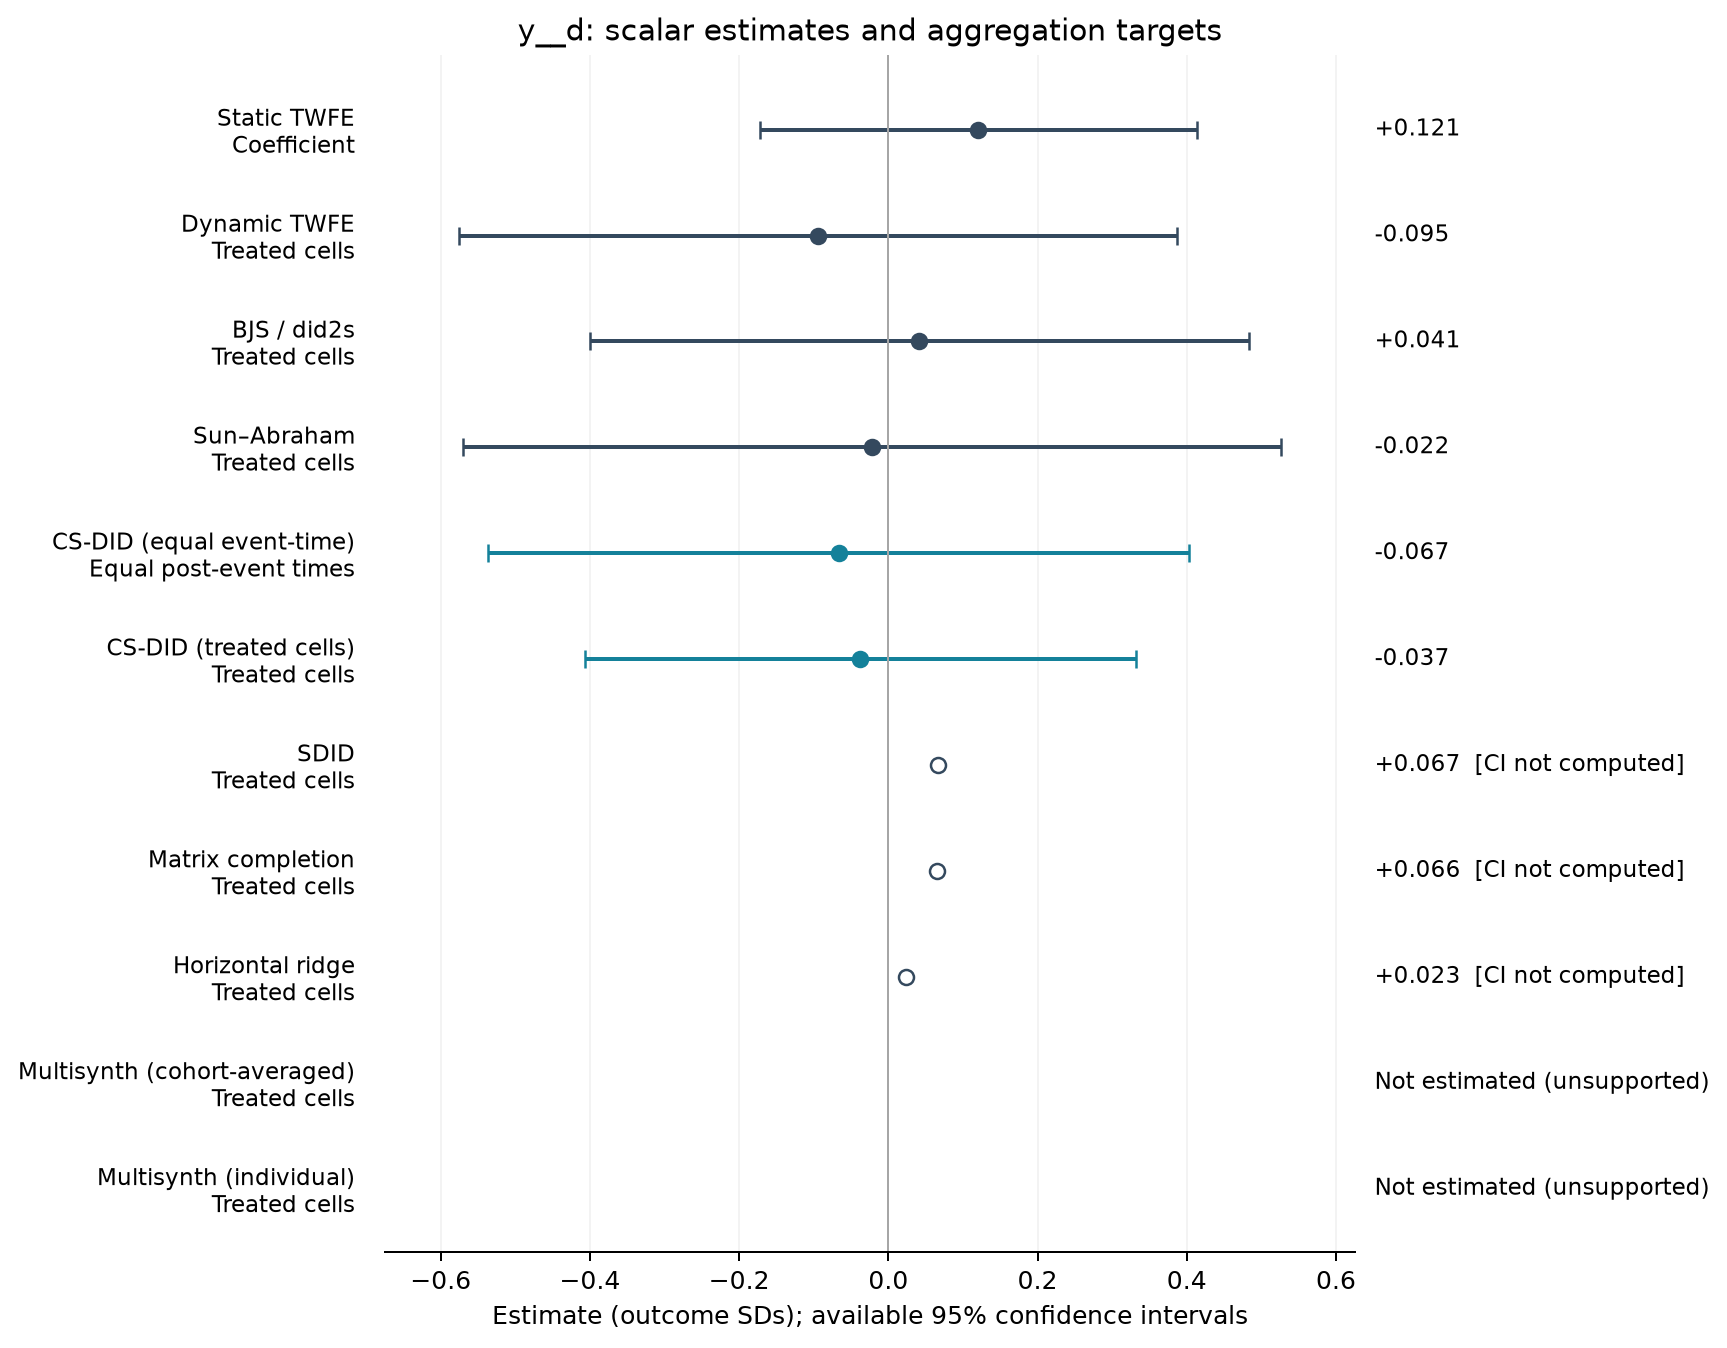
Estimate comparison
| Estimator | Estimate (SDs) | SE | 95% CI | Averaging |
|---|---|---|---|---|
| Static TWFE | 0.121 | 0.139 | [-0.172, 0.413] | Coefficient |
| Dynamic TWFE | -0.095 | 0.229 | [-0.575, 0.386] | Treated cells |
| BJS / did2s | 0.041 | 0.210 | [-0.401, 0.483] | Treated cells |
| Sun–Abraham | -0.022 | 0.261 | [-0.570, 0.527] | Treated cells |
| CS-DID (equal event-time) | -0.067 | 0.240 | [-0.537, 0.403] | Equal post-event times |
| CS-DID (treated cells) | -0.037 | 0.189 | [-0.407, 0.332] | Treated cells |
| SDID | 0.067 | — | — | Treated cells |
| Matrix completion | 0.066 | — | — | Treated cells |
| Horizontal ridge | 0.023 | — | — | Treated cells |
Event studies
Periods −10 to +10; pointwise 95% intervals where available.
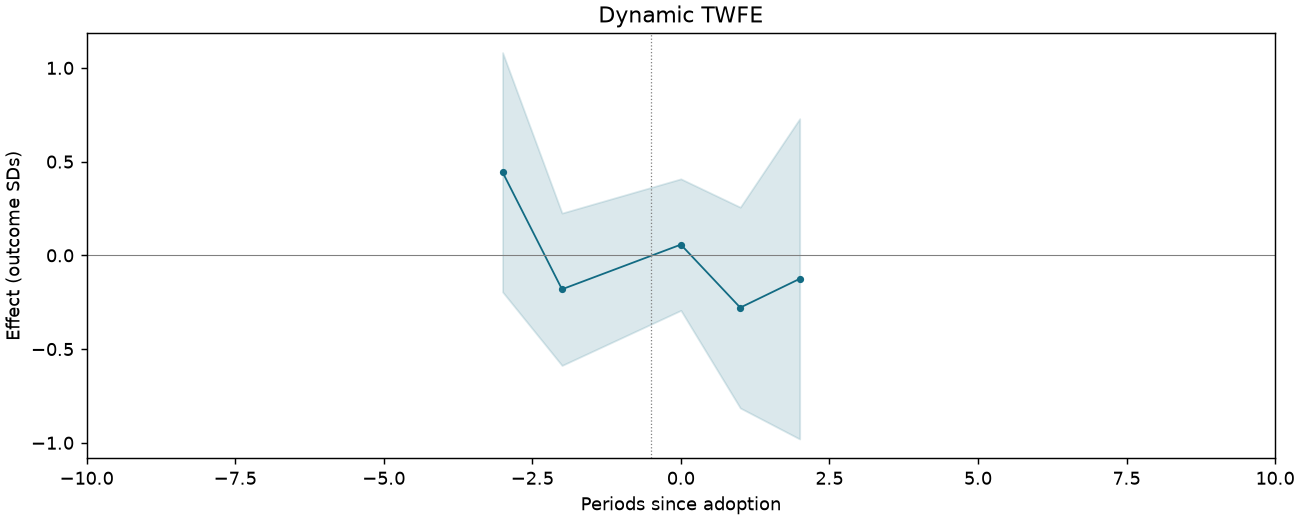
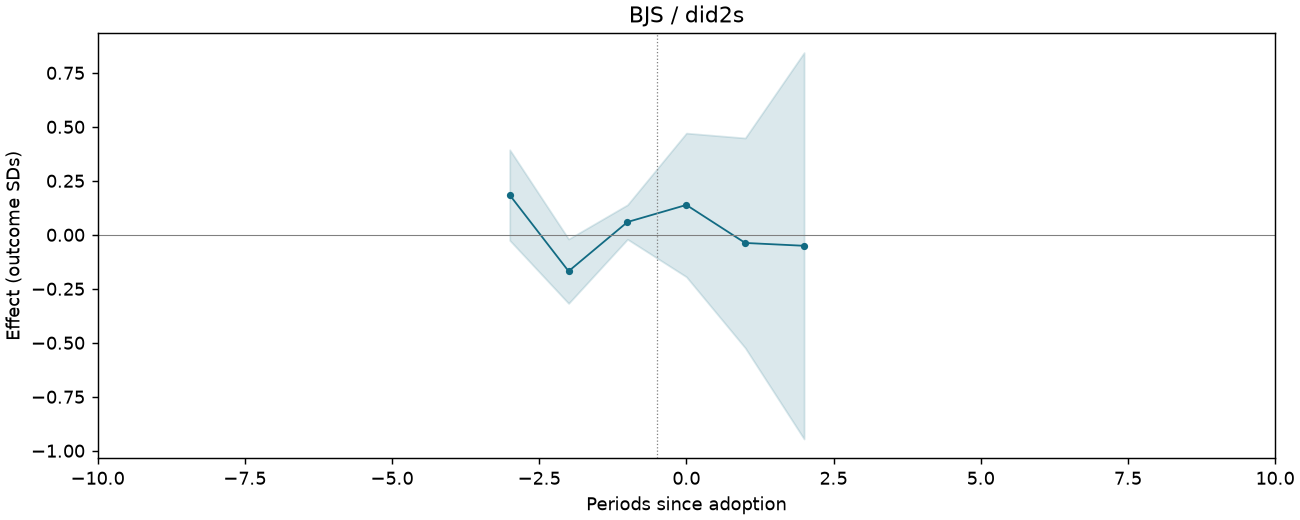
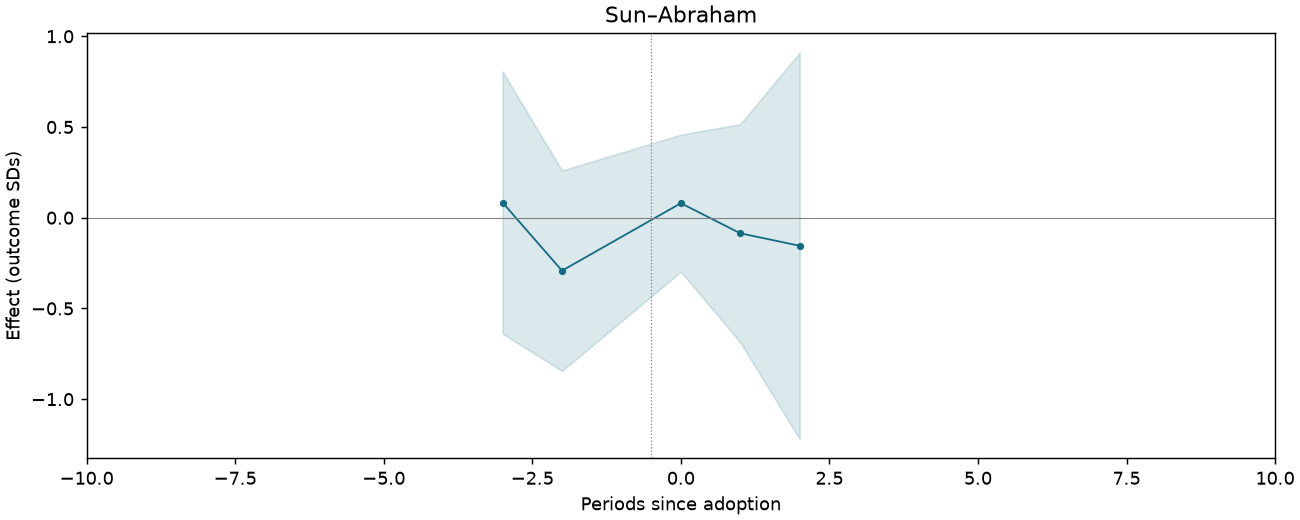
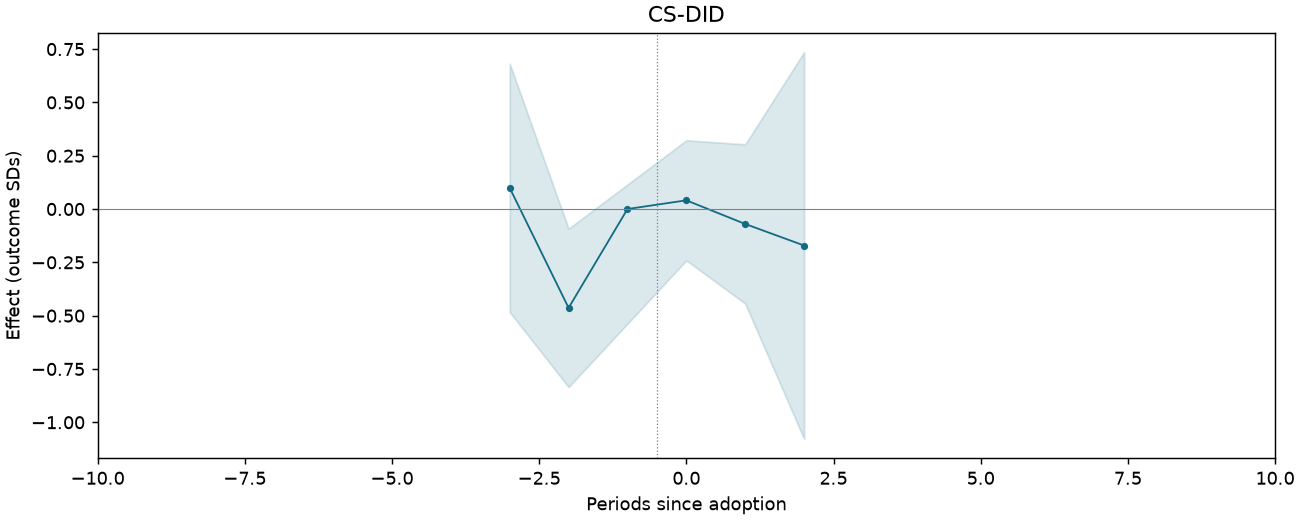
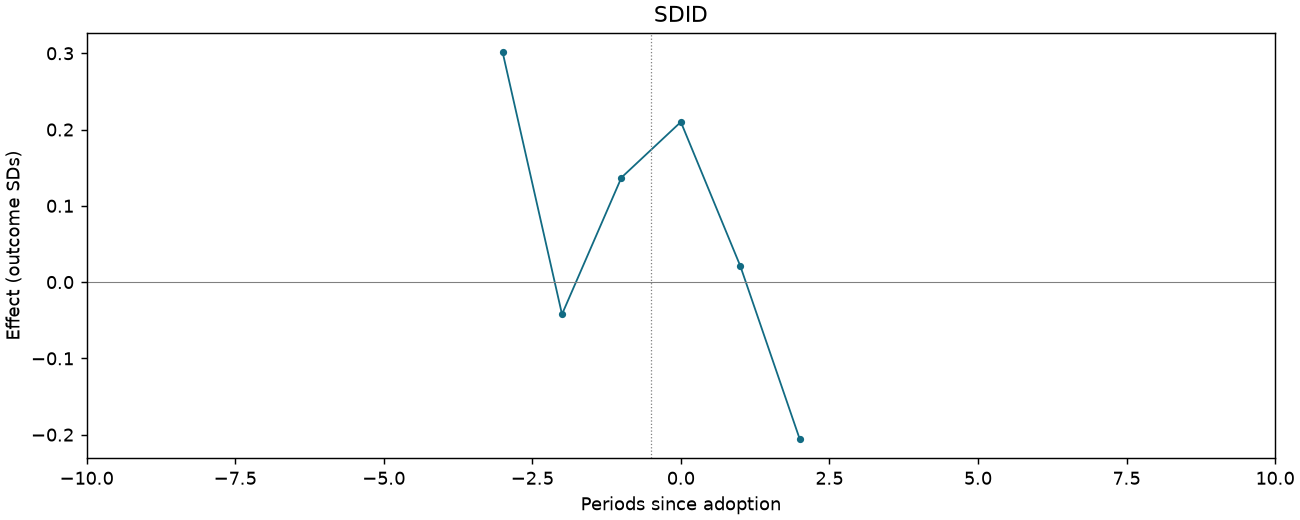
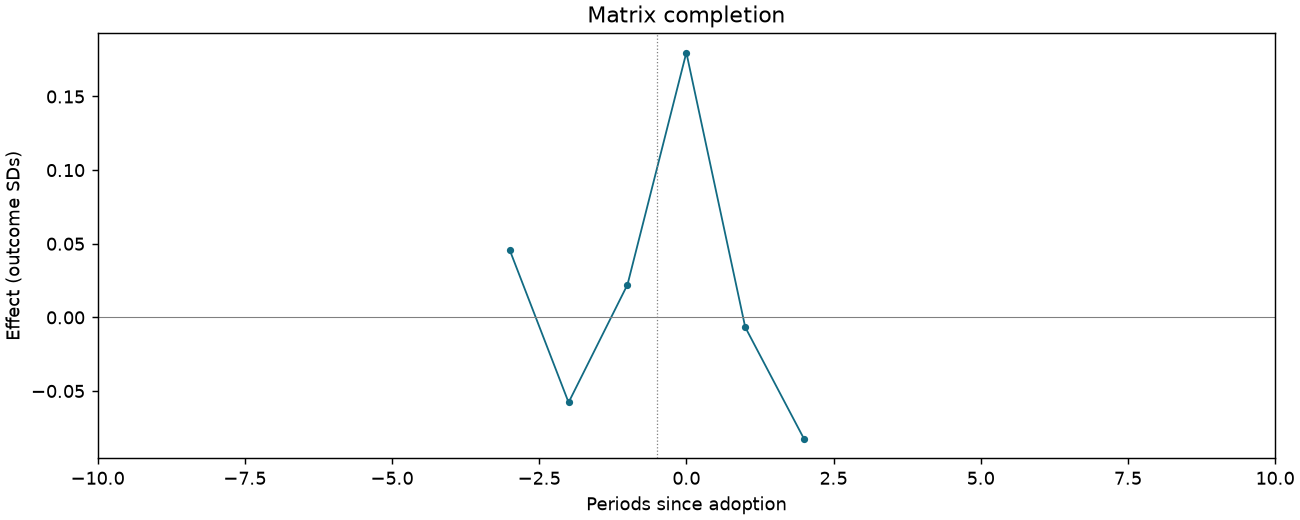
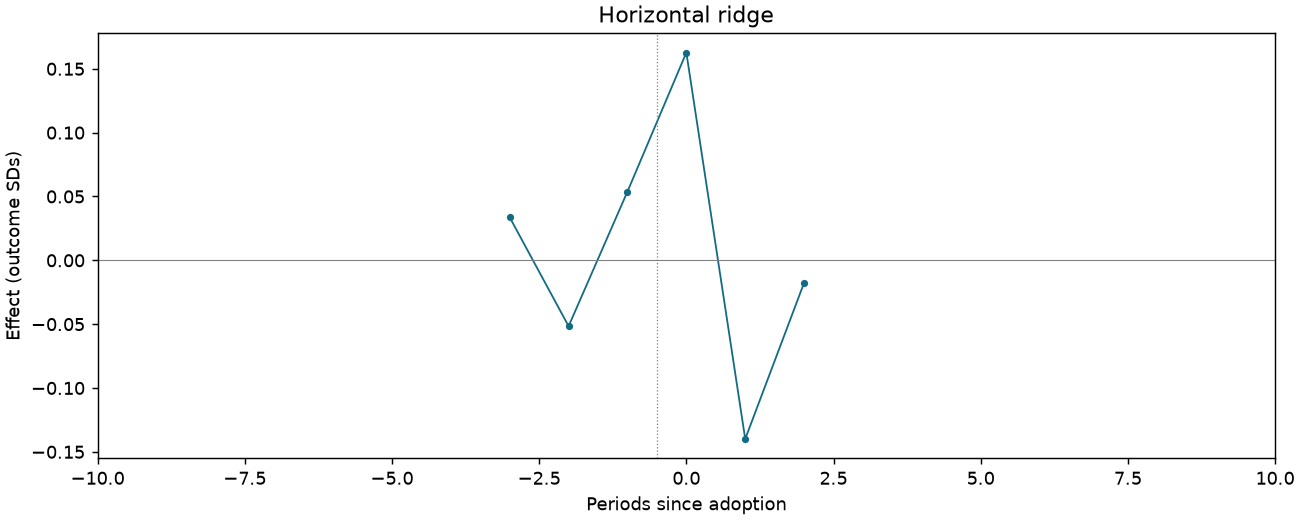
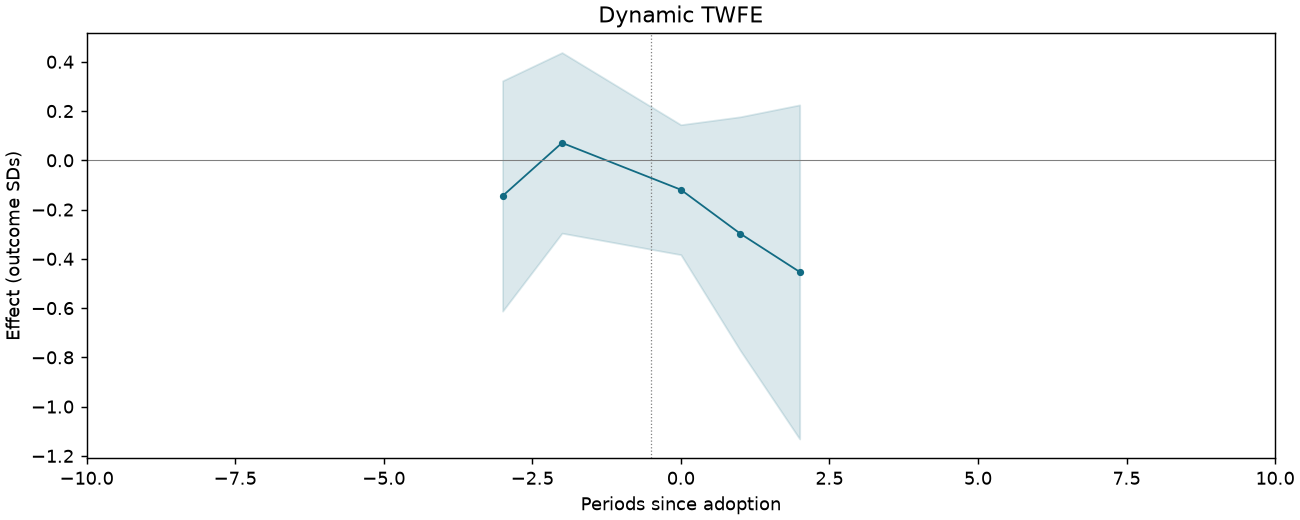
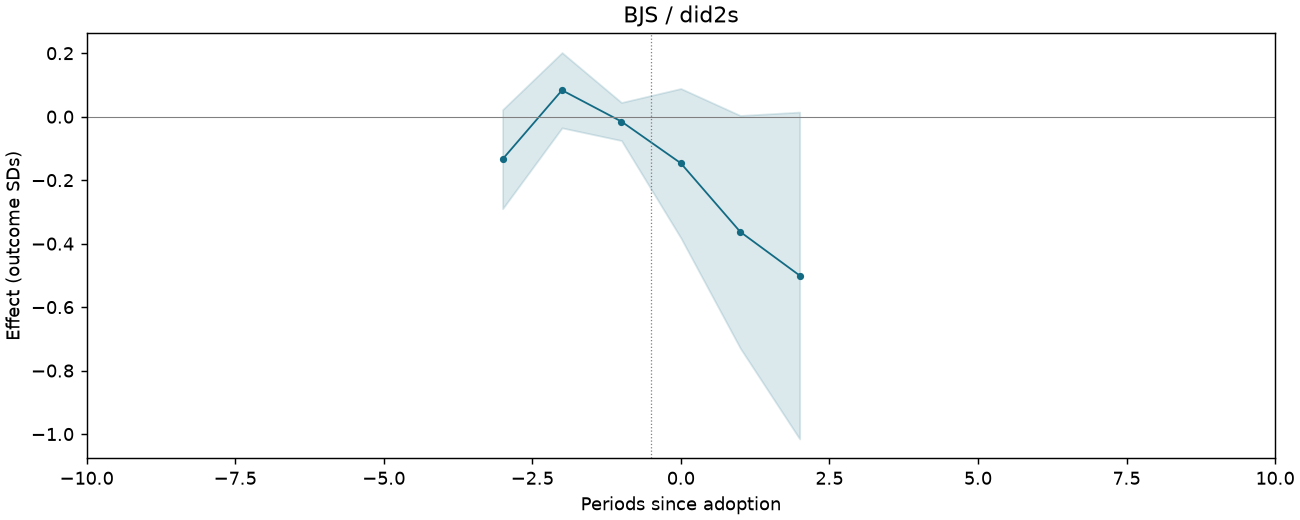
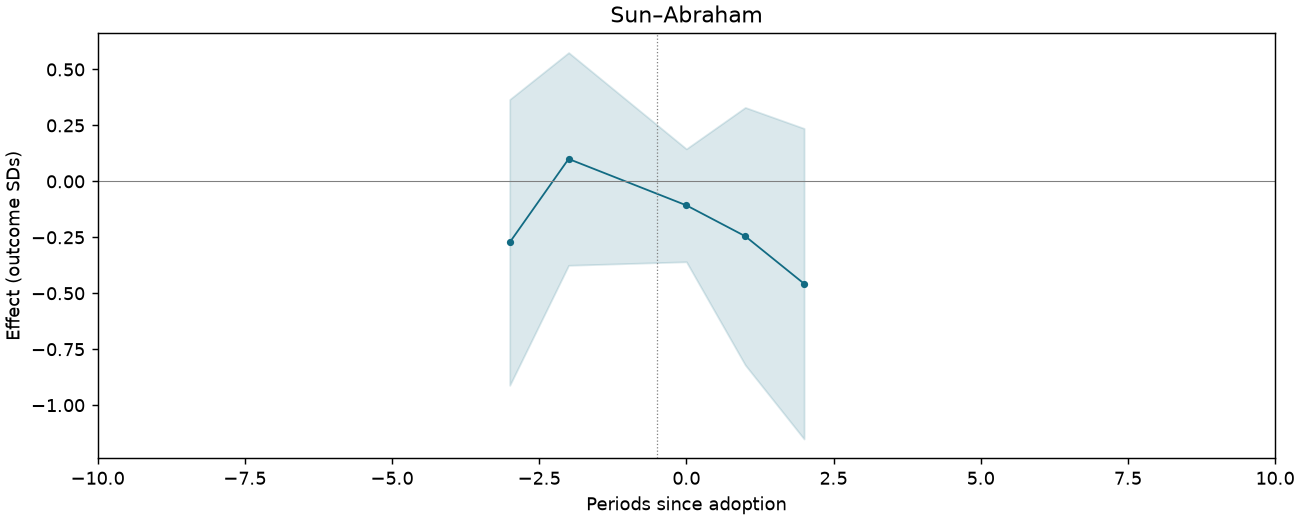
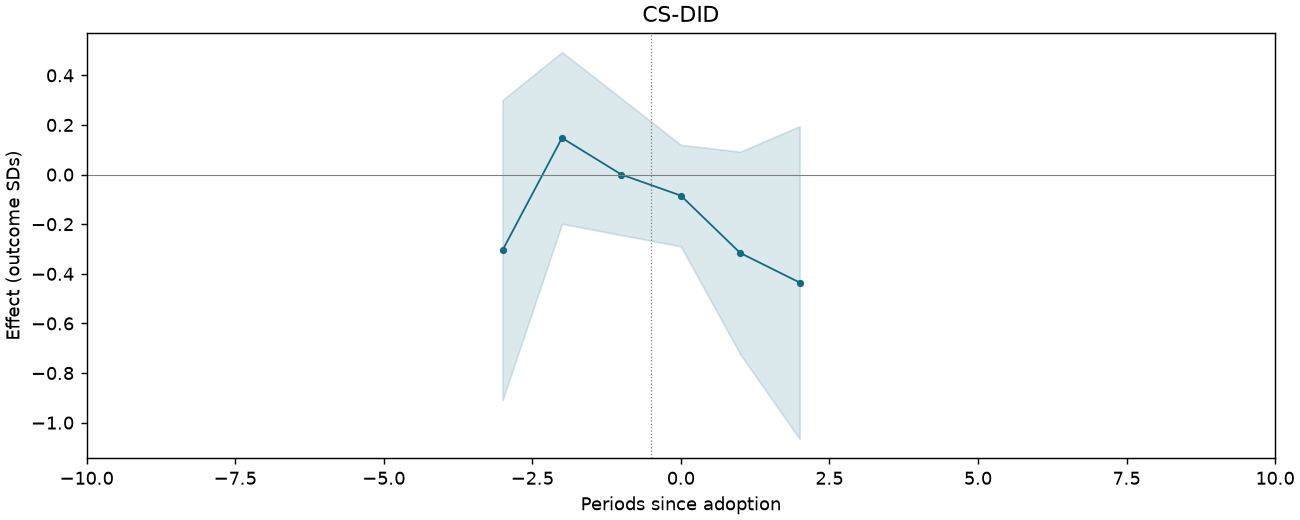
Support environment spending [Table 3 original scale]
1,123 observations · 19 units · 19 clusters · 13 treated / 6 control units.
Estimate comparison
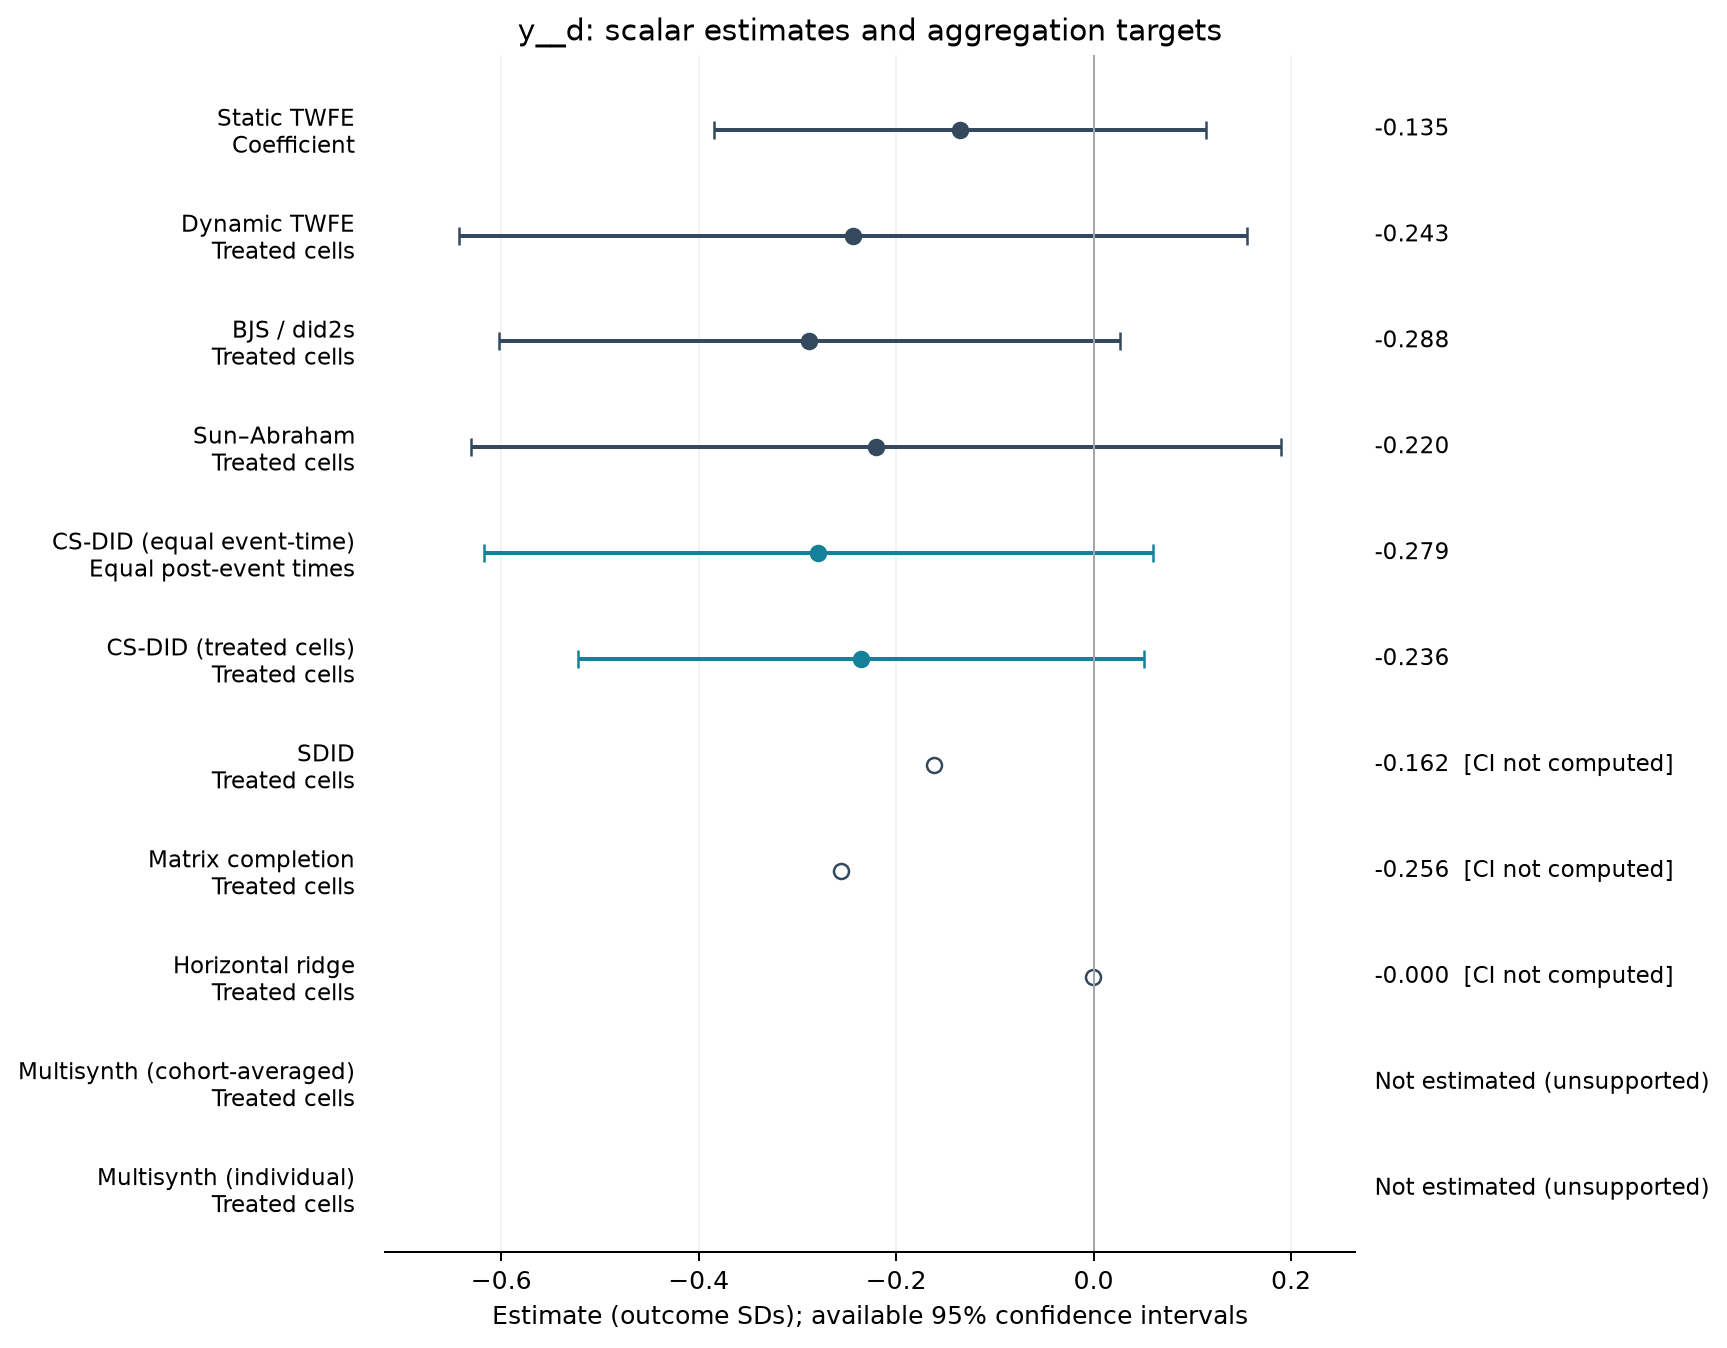
| Estimator | Estimate (SDs) | SE | 95% CI | Averaging |
|---|---|---|---|---|
| Static TWFE | -0.135 | 0.119 | [-0.385, 0.114] | Coefficient |
| Dynamic TWFE | -0.243 | 0.190 | [-0.643, 0.156] | Treated cells |
| BJS / did2s | -0.288 | 0.150 | [-0.602, 0.027] | Treated cells |
| Sun–Abraham | -0.220 | 0.195 | [-0.630, 0.190] | Treated cells |
| CS-DID (equal event-time) | -0.279 | 0.173 | [-0.618, 0.060] | Equal post-event times |
| CS-DID (treated cells) | -0.236 | 0.146 | [-0.523, 0.051] | Treated cells |
| SDID | -0.162 | — | — | Treated cells |
| Matrix completion | -0.256 | — | — | Treated cells |
| Horizontal ridge | -0.000 | — | — | Treated cells |
Event studies
Periods −10 to +10; pointwise 95% intervals where available.
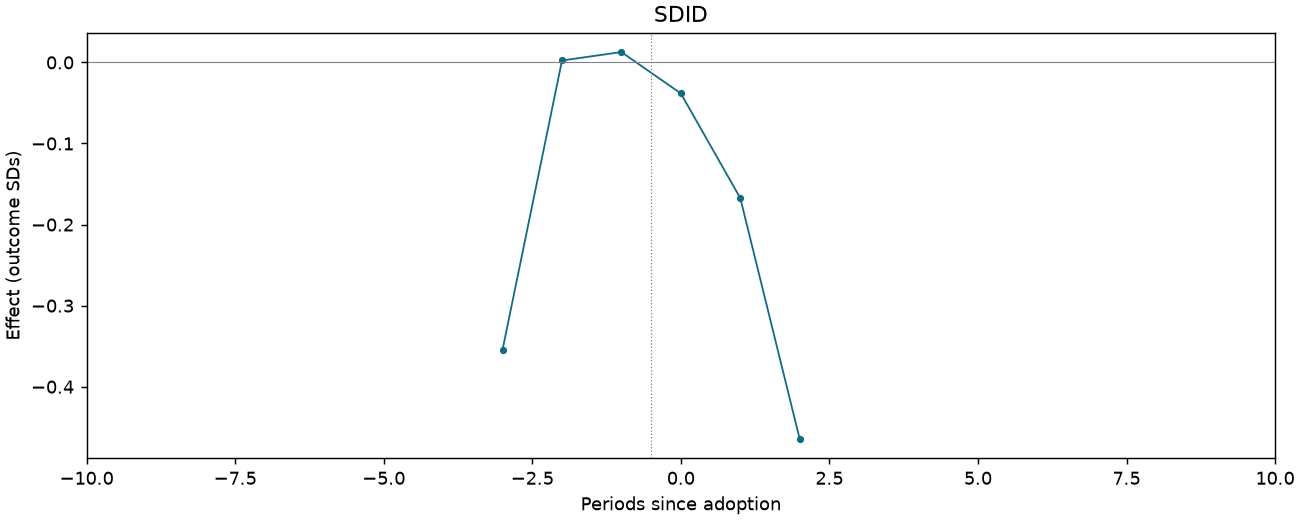
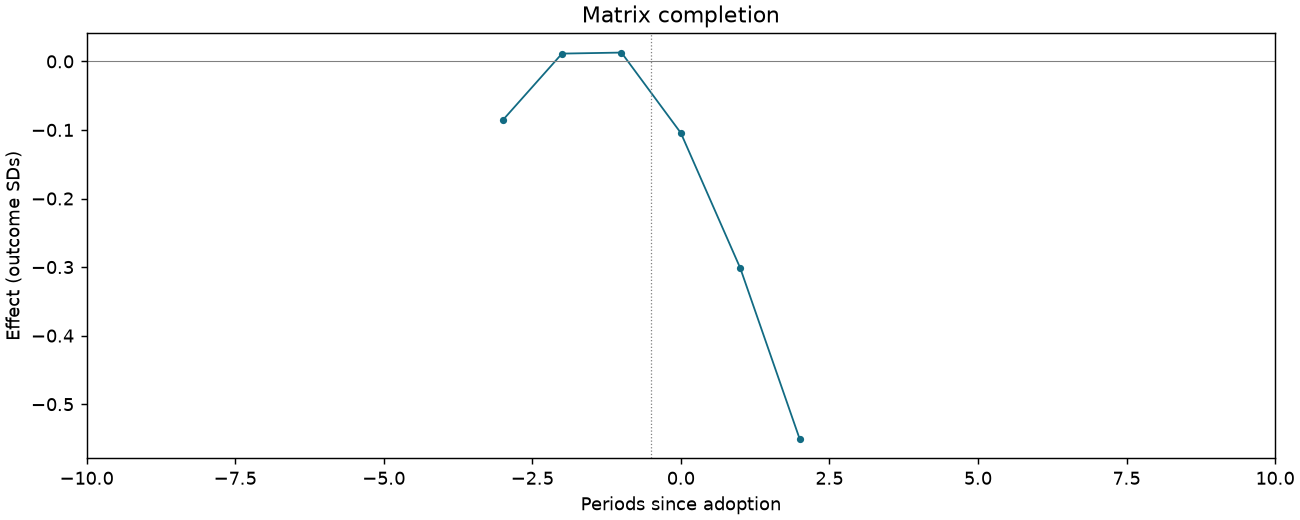
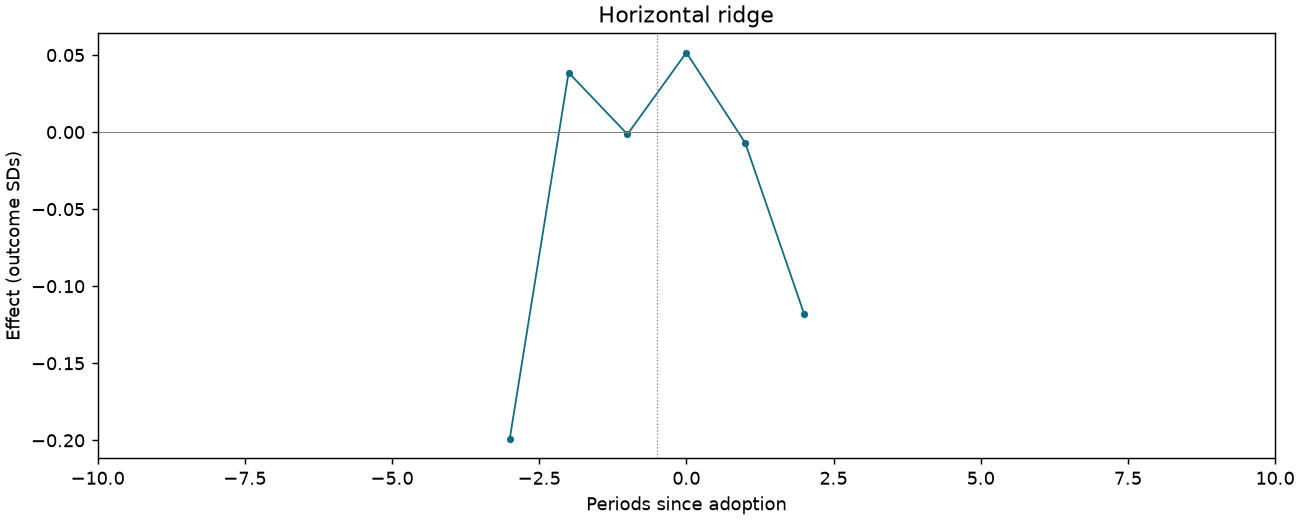
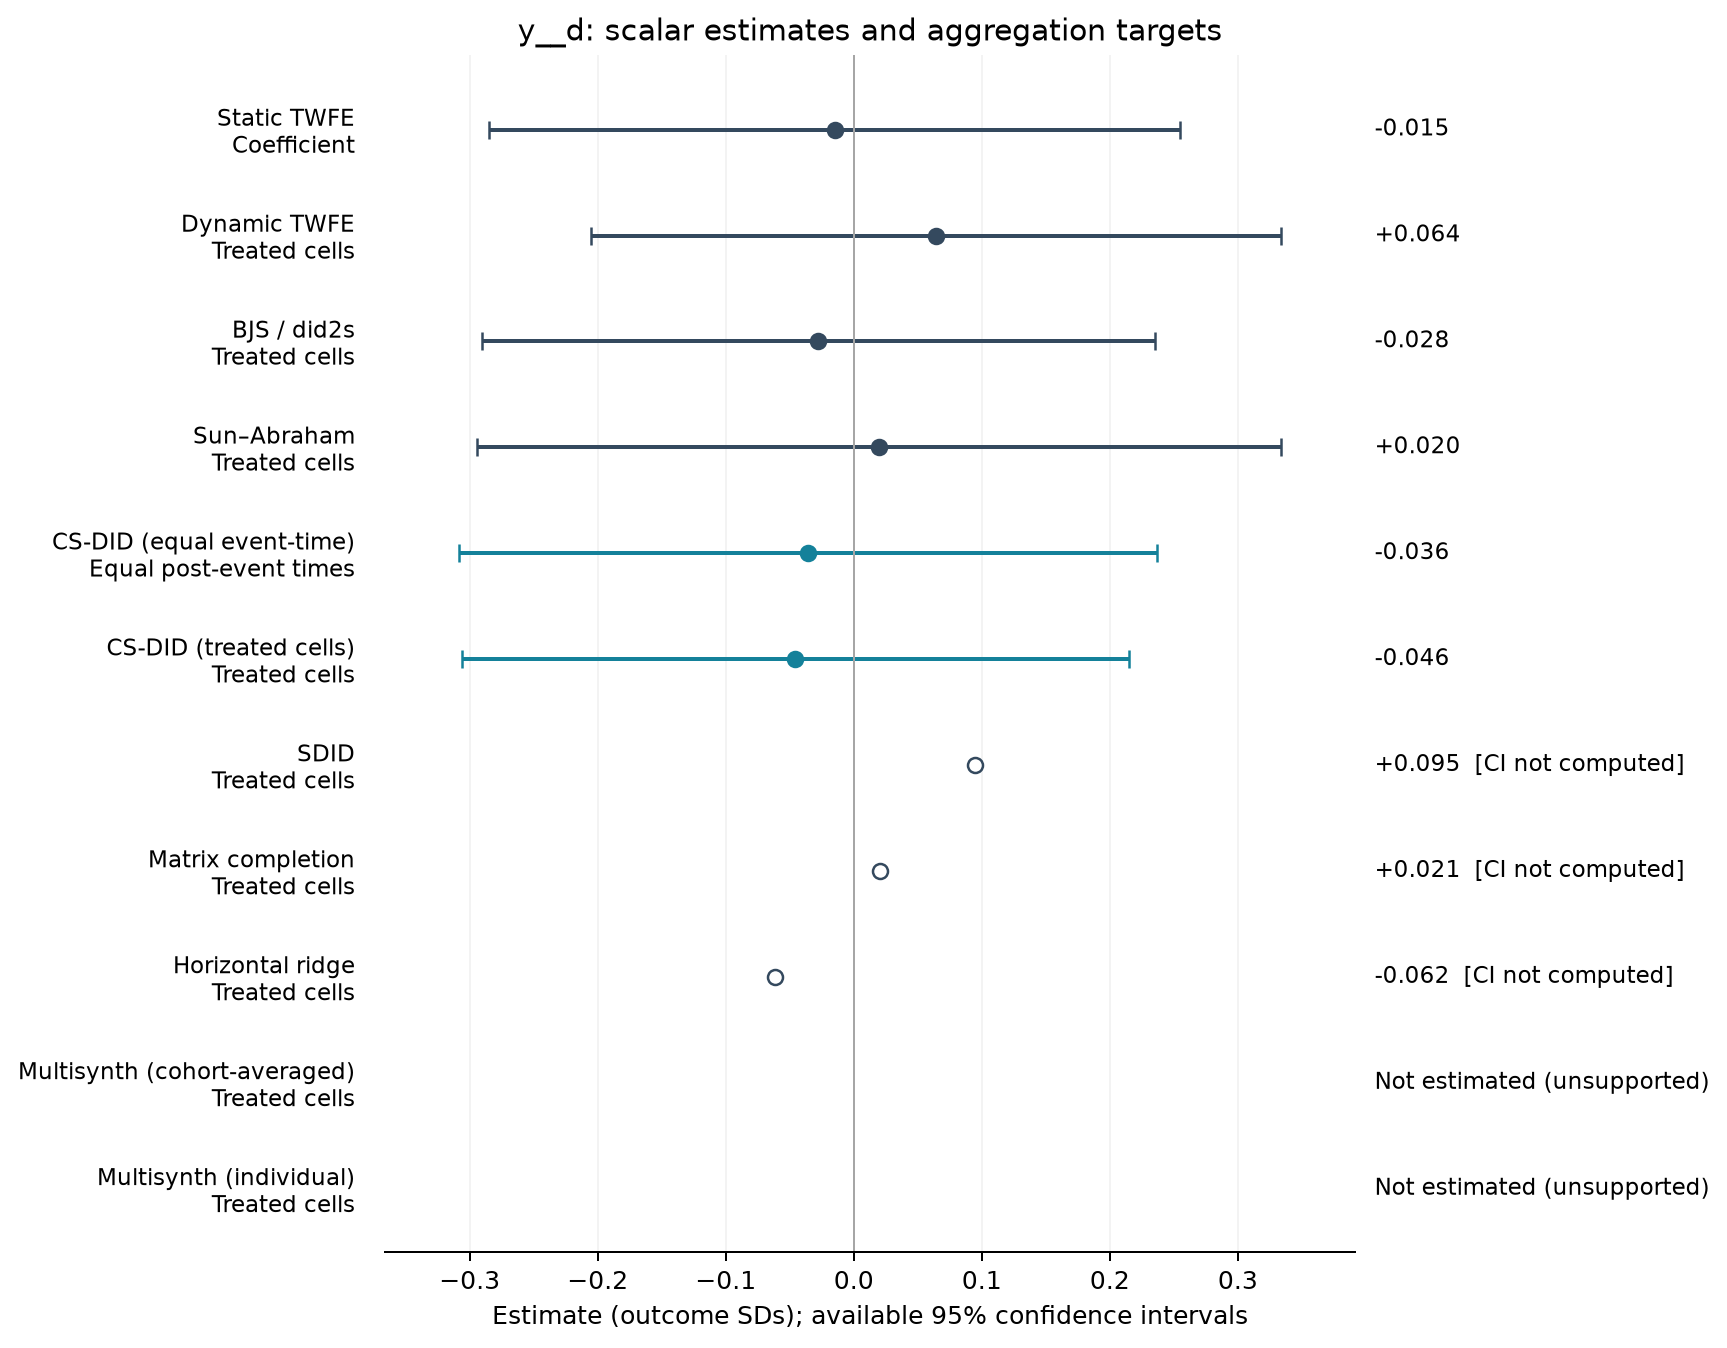
Environment as policy priority [Table 3 original scale]
1,070 observations · 19 units · 19 clusters · 13 treated / 6 control units.
Estimate comparison
| Estimator | Estimate (SDs) | SE | 95% CI | Averaging |
|---|---|---|---|---|
| Static TWFE | -0.015 | 0.128 | [-0.285, 0.255] | Coefficient |
| Dynamic TWFE | 0.064 | 0.128 | [-0.206, 0.334] | Treated cells |
| BJS / did2s | -0.028 | 0.125 | [-0.291, 0.235] | Treated cells |
| Sun–Abraham | 0.020 | 0.149 | [-0.294, 0.333] | Treated cells |
| CS-DID (equal event-time) | -0.036 | 0.139 | [-0.308, 0.237] | Equal post-event times |
| CS-DID (treated cells) | -0.046 | 0.133 | [-0.306, 0.215] | Treated cells |
| SDID | 0.095 | — | — | Treated cells |
| Matrix completion | 0.021 | — | — | Treated cells |
| Horizontal ridge | -0.062 | — | — | Treated cells |
Event studies
Periods −10 to +10; pointwise 95% intervals where available.
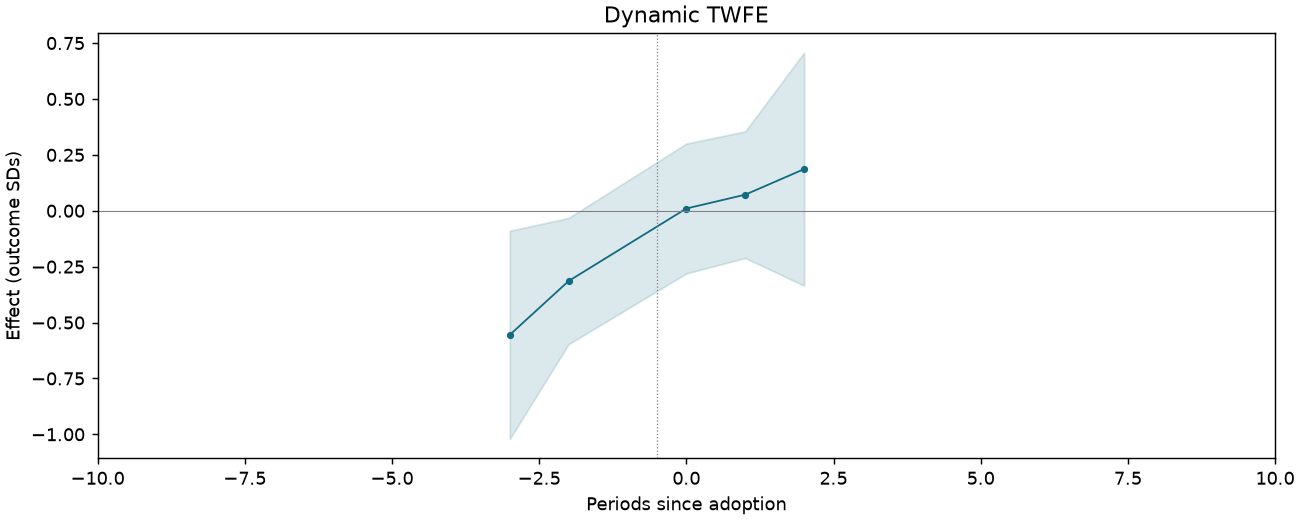
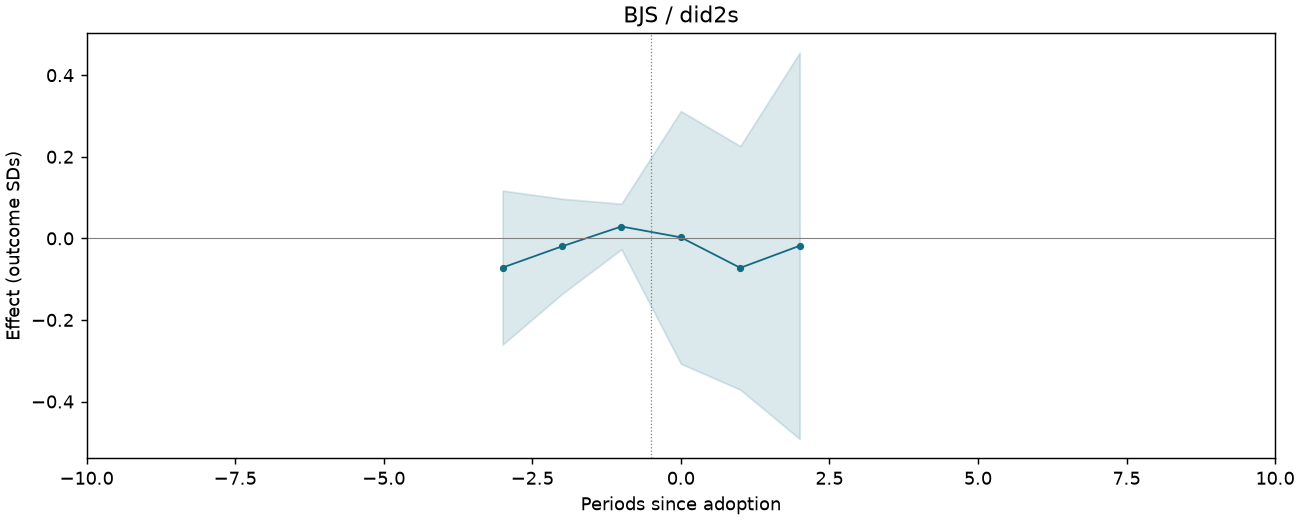
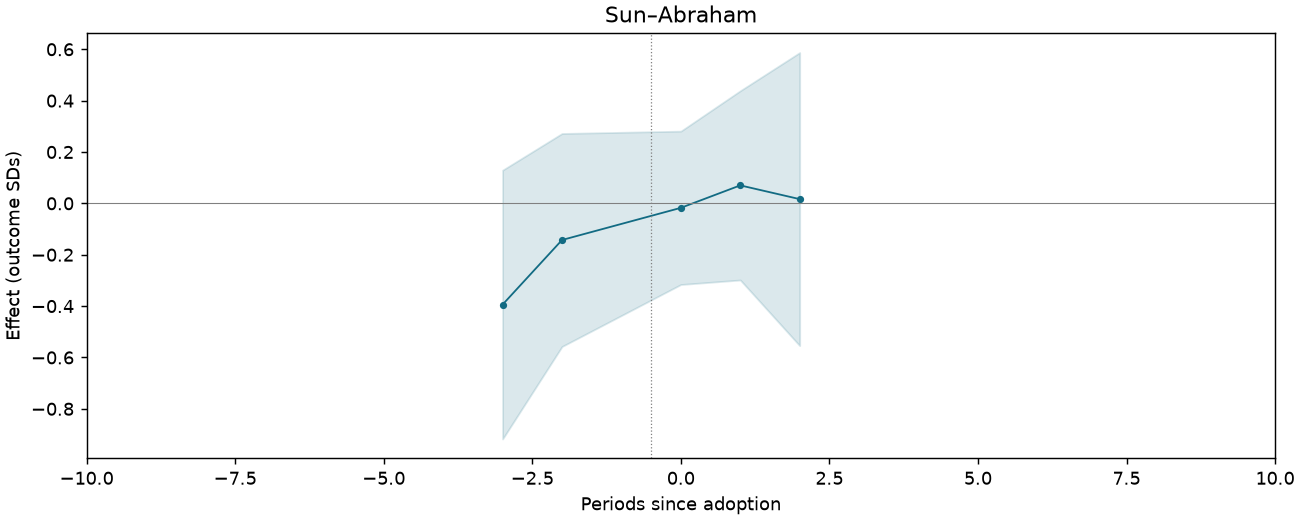
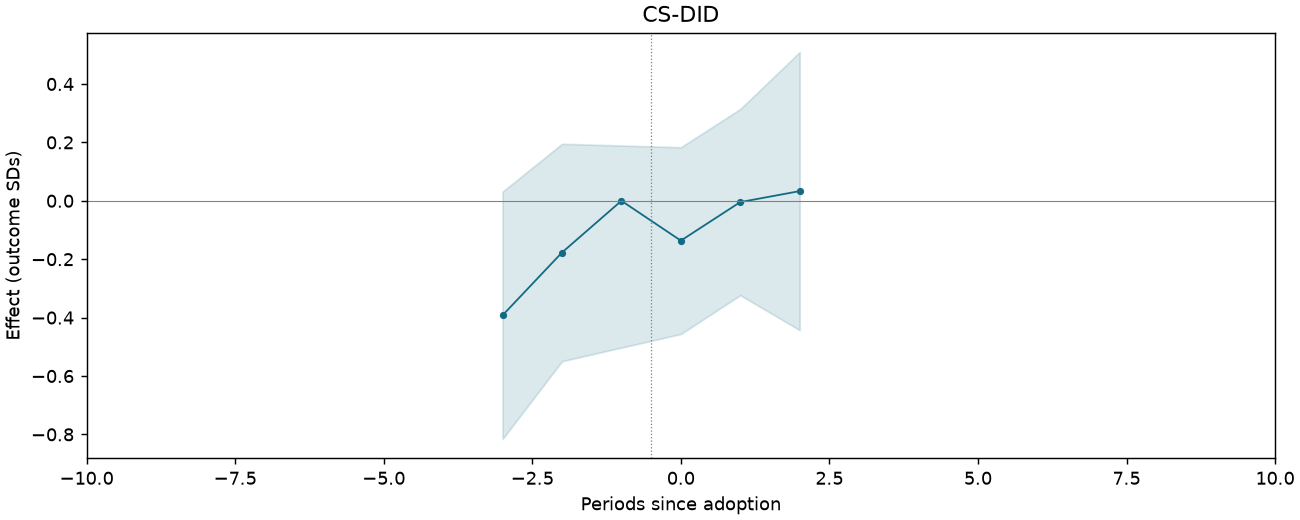
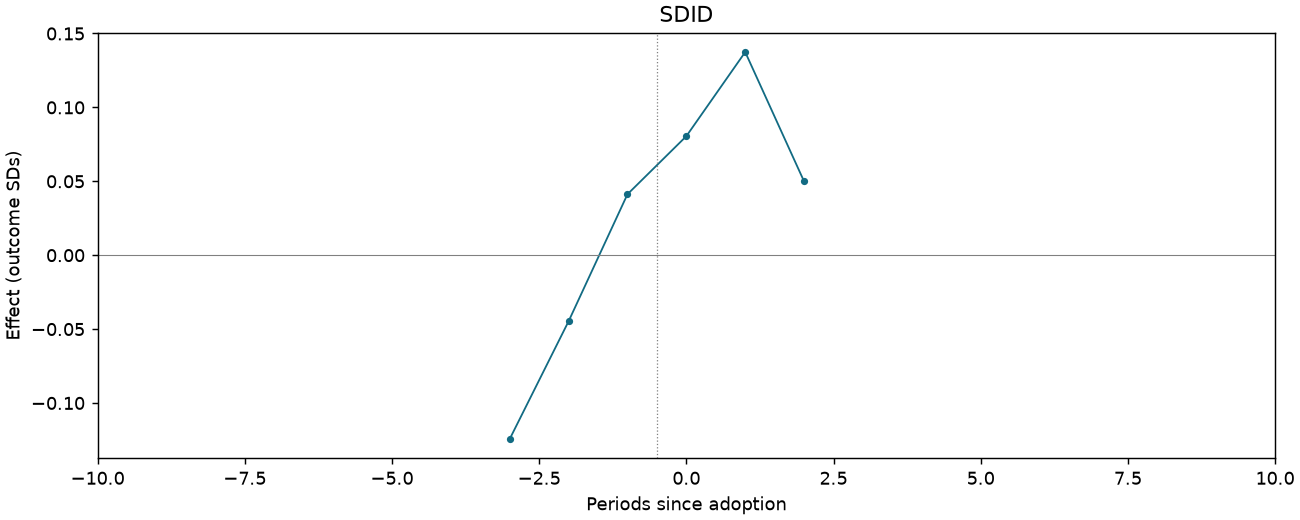
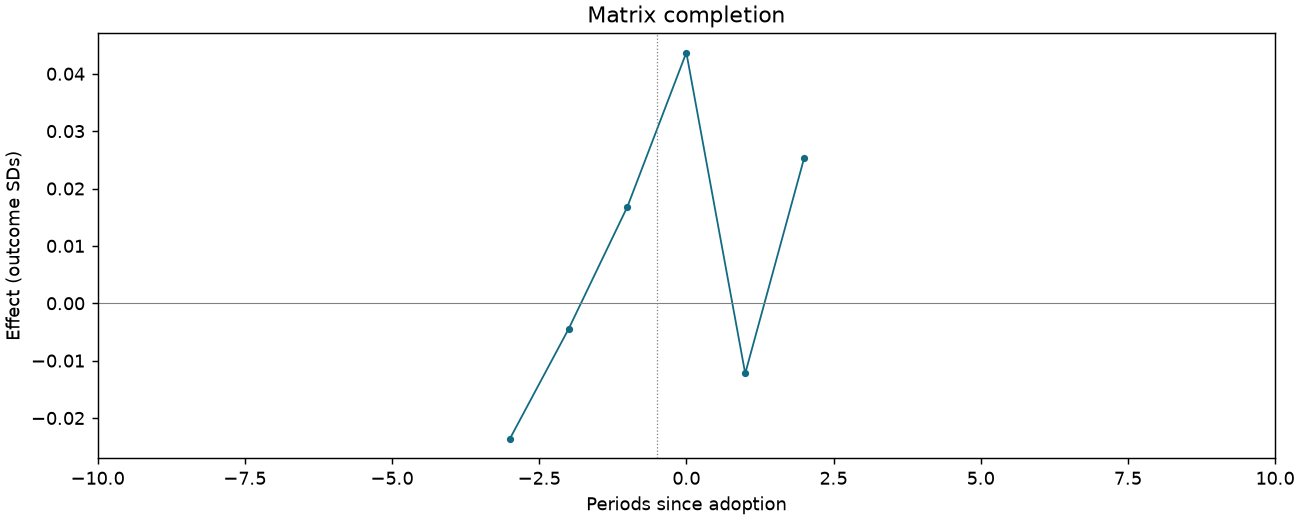
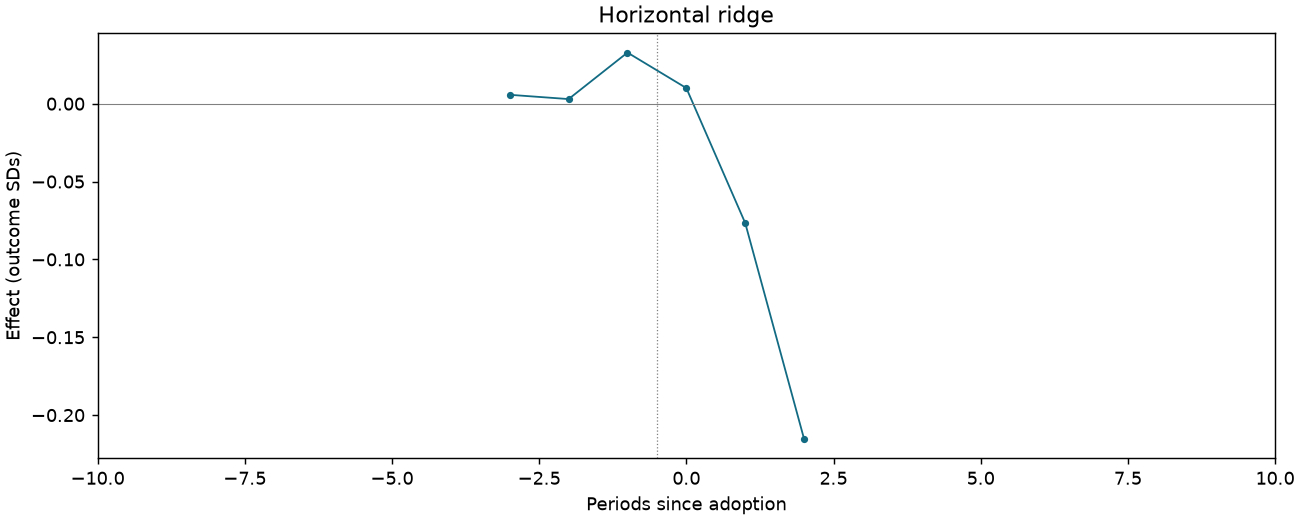
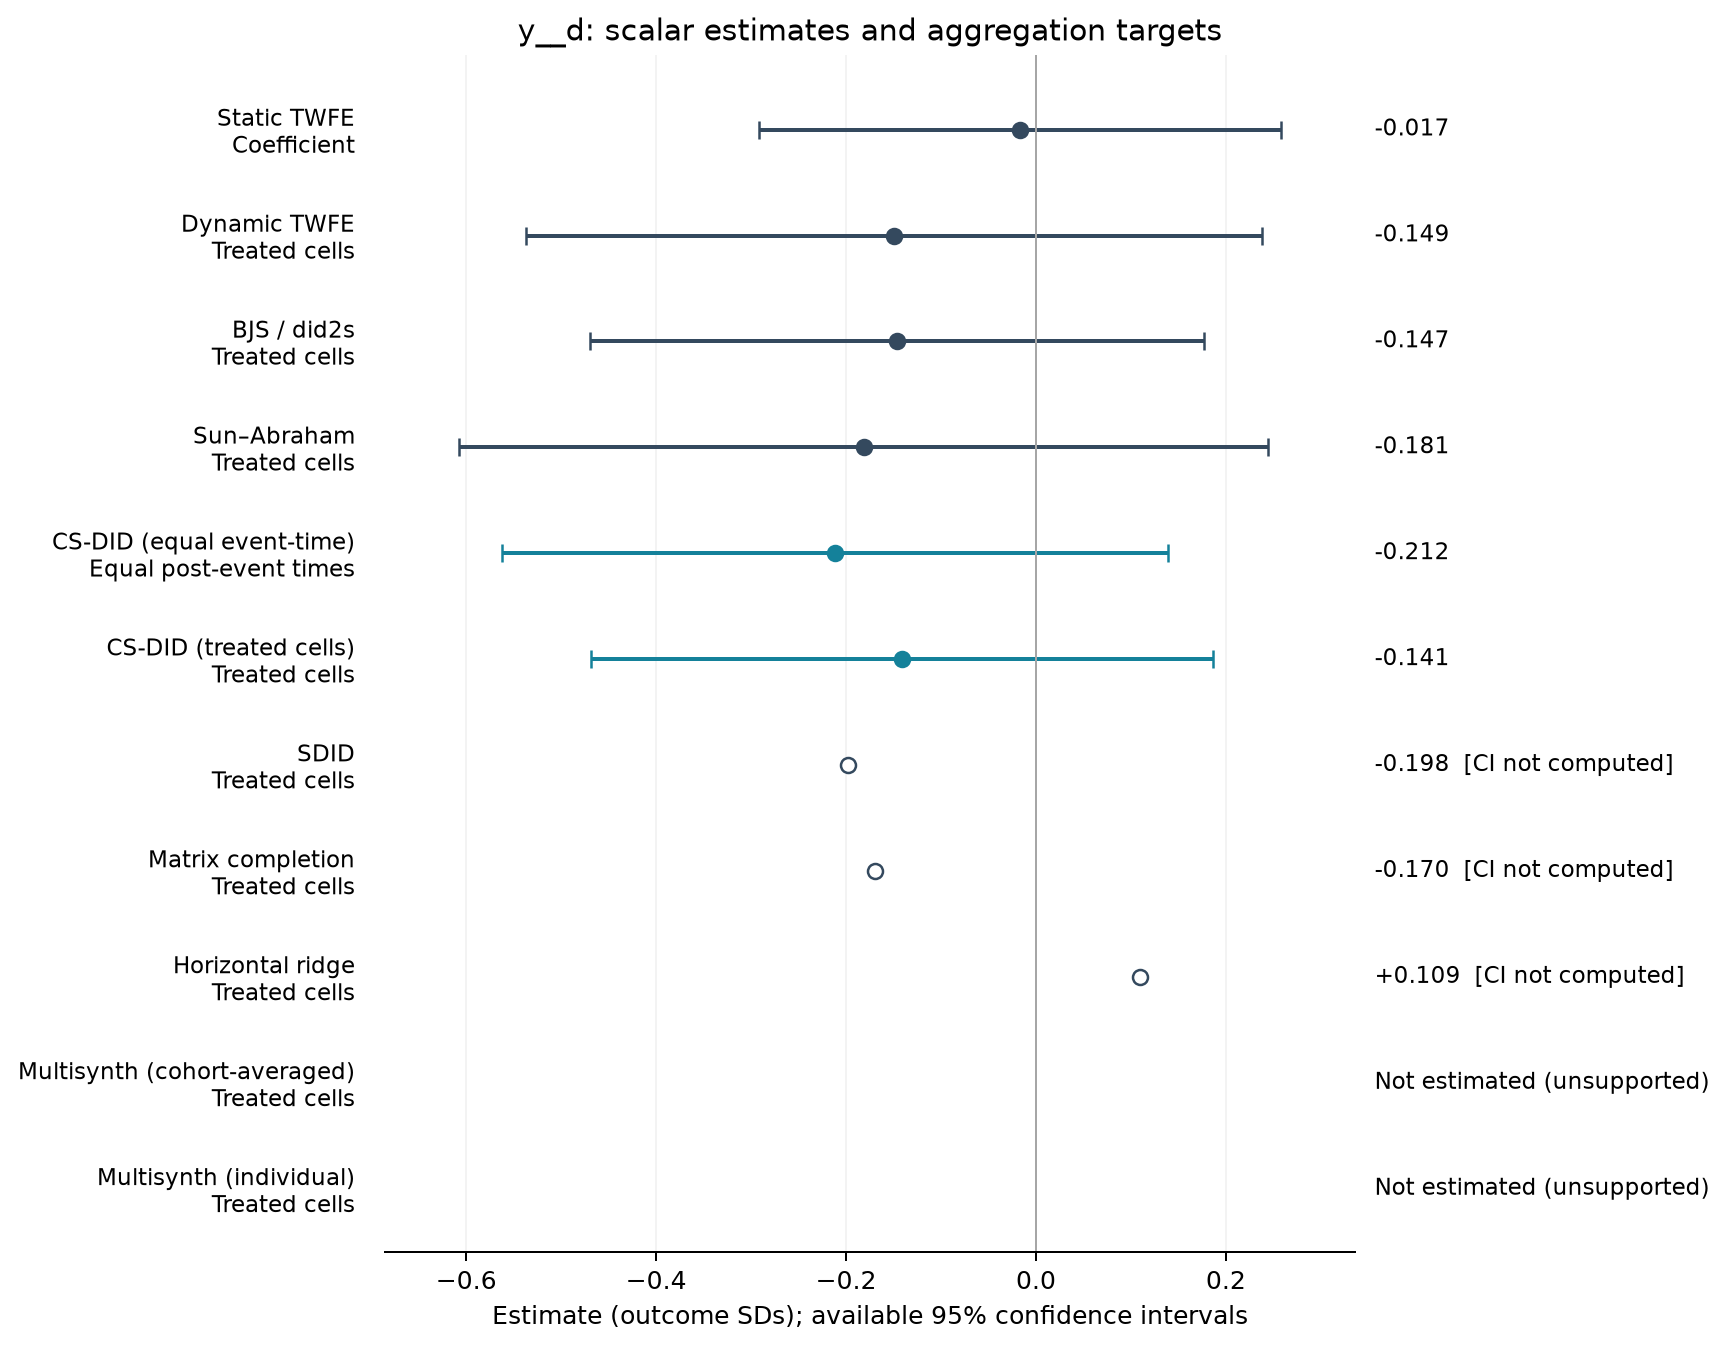
Environment versus growth [Table 3 original scale]
1,070 observations · 19 units · 19 clusters · 13 treated / 6 control units.
Estimate comparison
| Estimator | Estimate (SDs) | SE | 95% CI | Averaging |
|---|---|---|---|---|
| Static TWFE | -0.017 | 0.131 | [-0.291, 0.258] | Coefficient |
| Dynamic TWFE | -0.149 | 0.184 | [-0.537, 0.238] | Treated cells |
| BJS / did2s | -0.147 | 0.154 | [-0.470, 0.177] | Treated cells |
| Sun–Abraham | -0.181 | 0.203 | [-0.608, 0.245] | Treated cells |
| CS-DID (equal event-time) | -0.212 | 0.179 | [-0.562, 0.139] | Equal post-event times |
| CS-DID (treated cells) | -0.141 | 0.167 | [-0.469, 0.187] | Treated cells |
| SDID | -0.198 | — | — | Treated cells |
| Matrix completion | -0.170 | — | — | Treated cells |
| Horizontal ridge | 0.109 | — | — | Treated cells |
Event studies
Periods −10 to +10; pointwise 95% intervals where available.
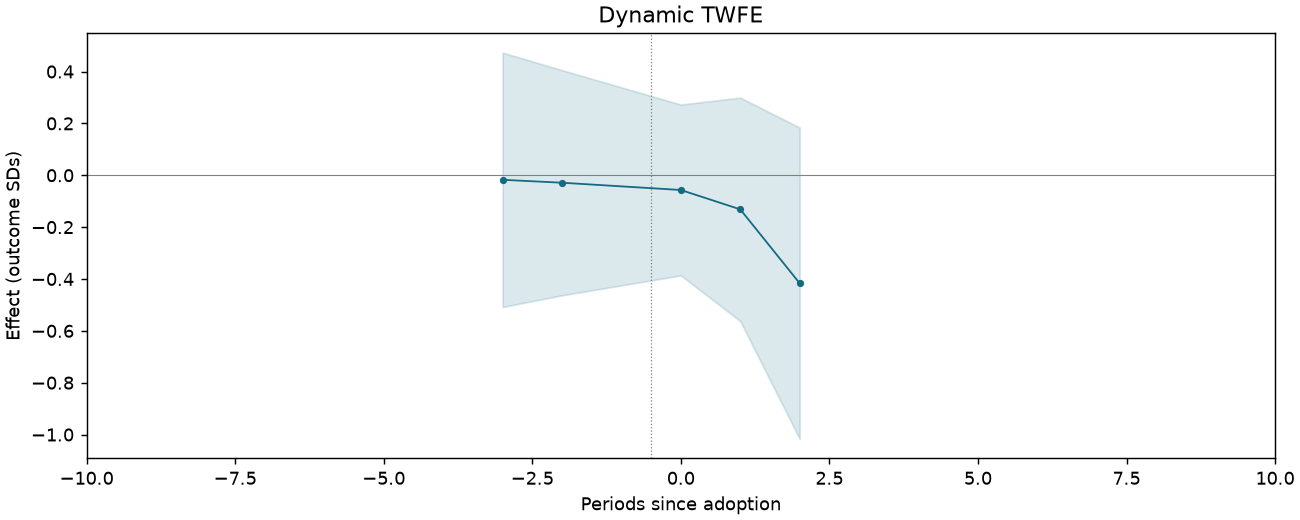
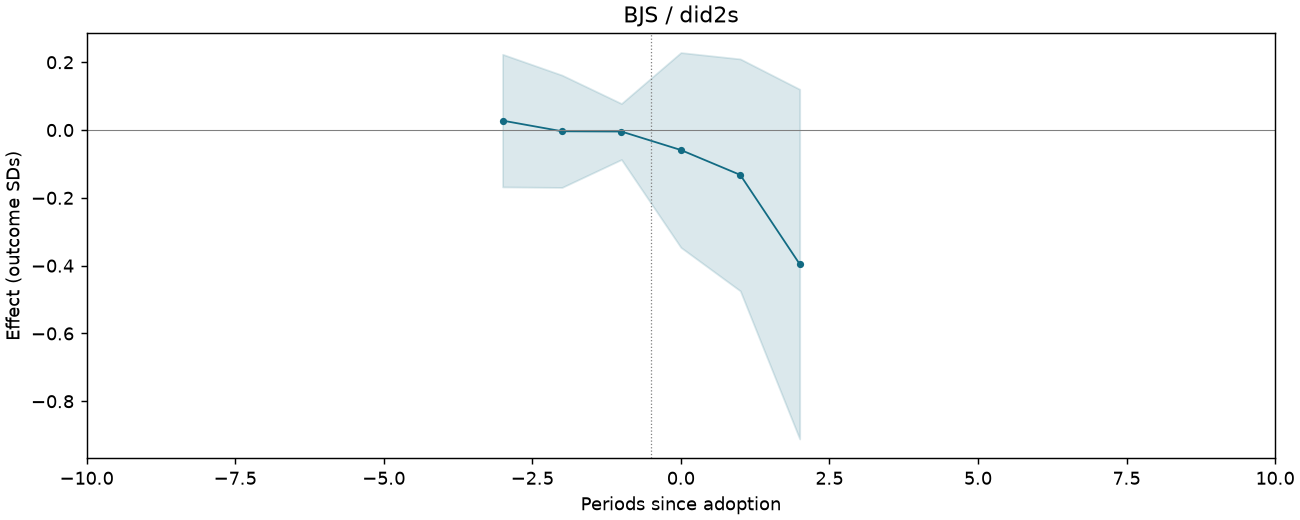
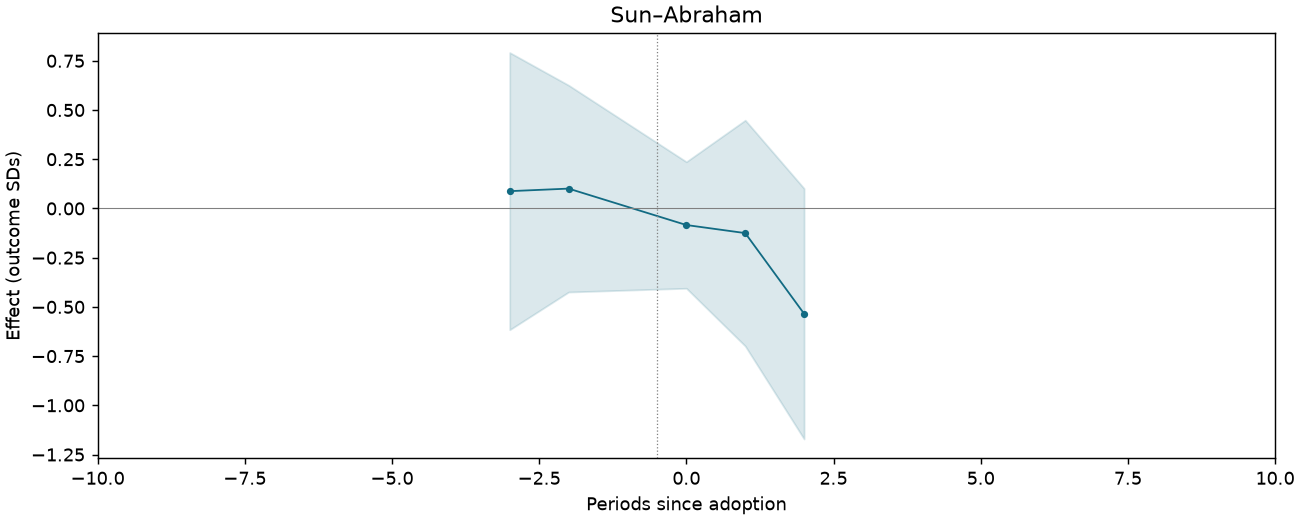
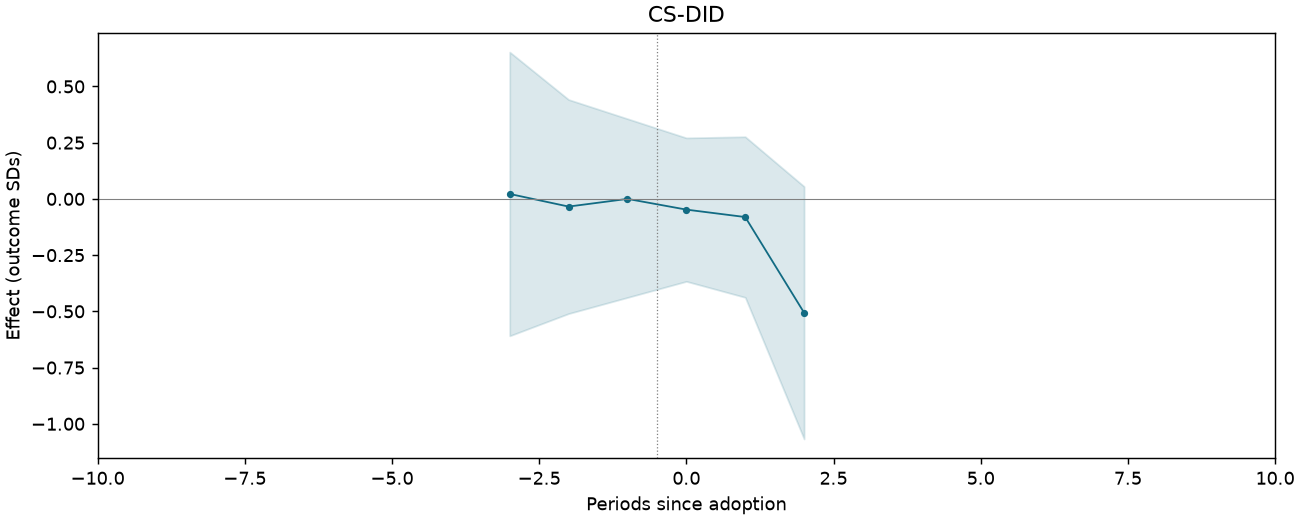
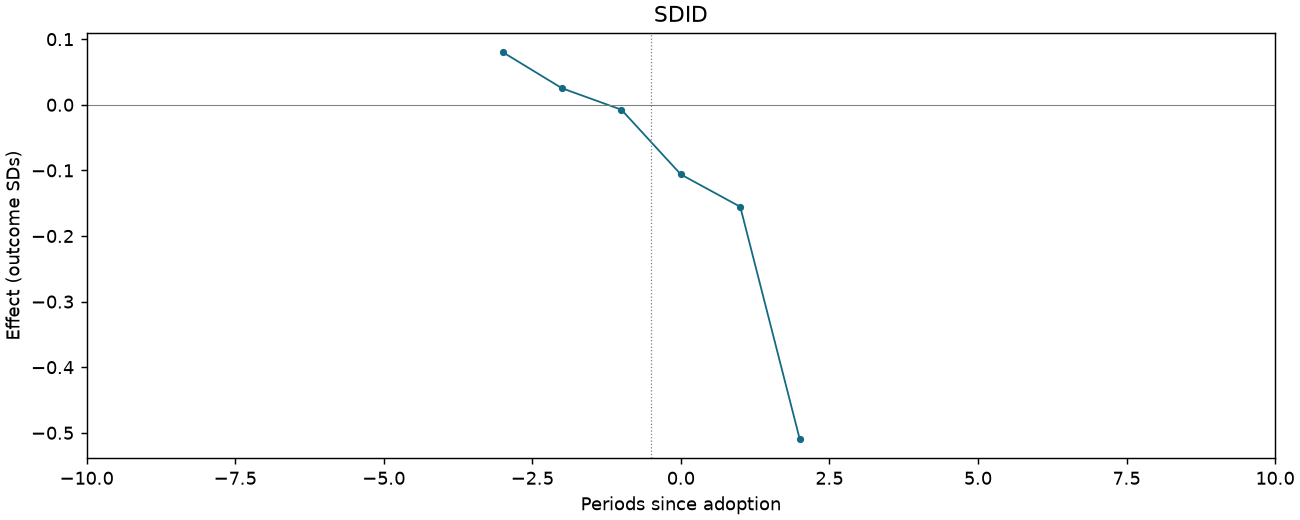
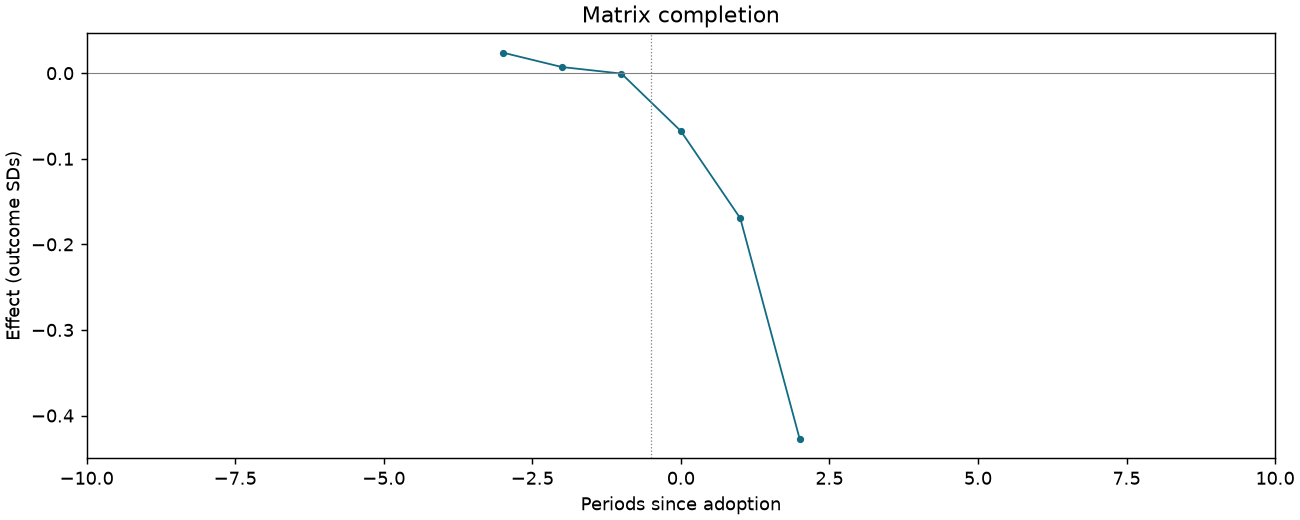
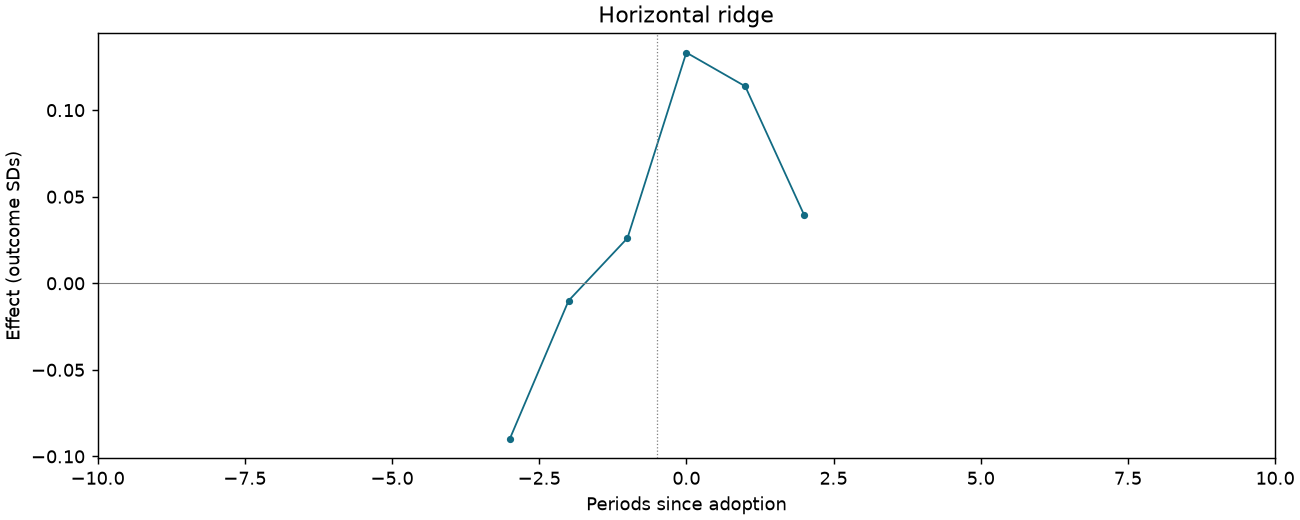
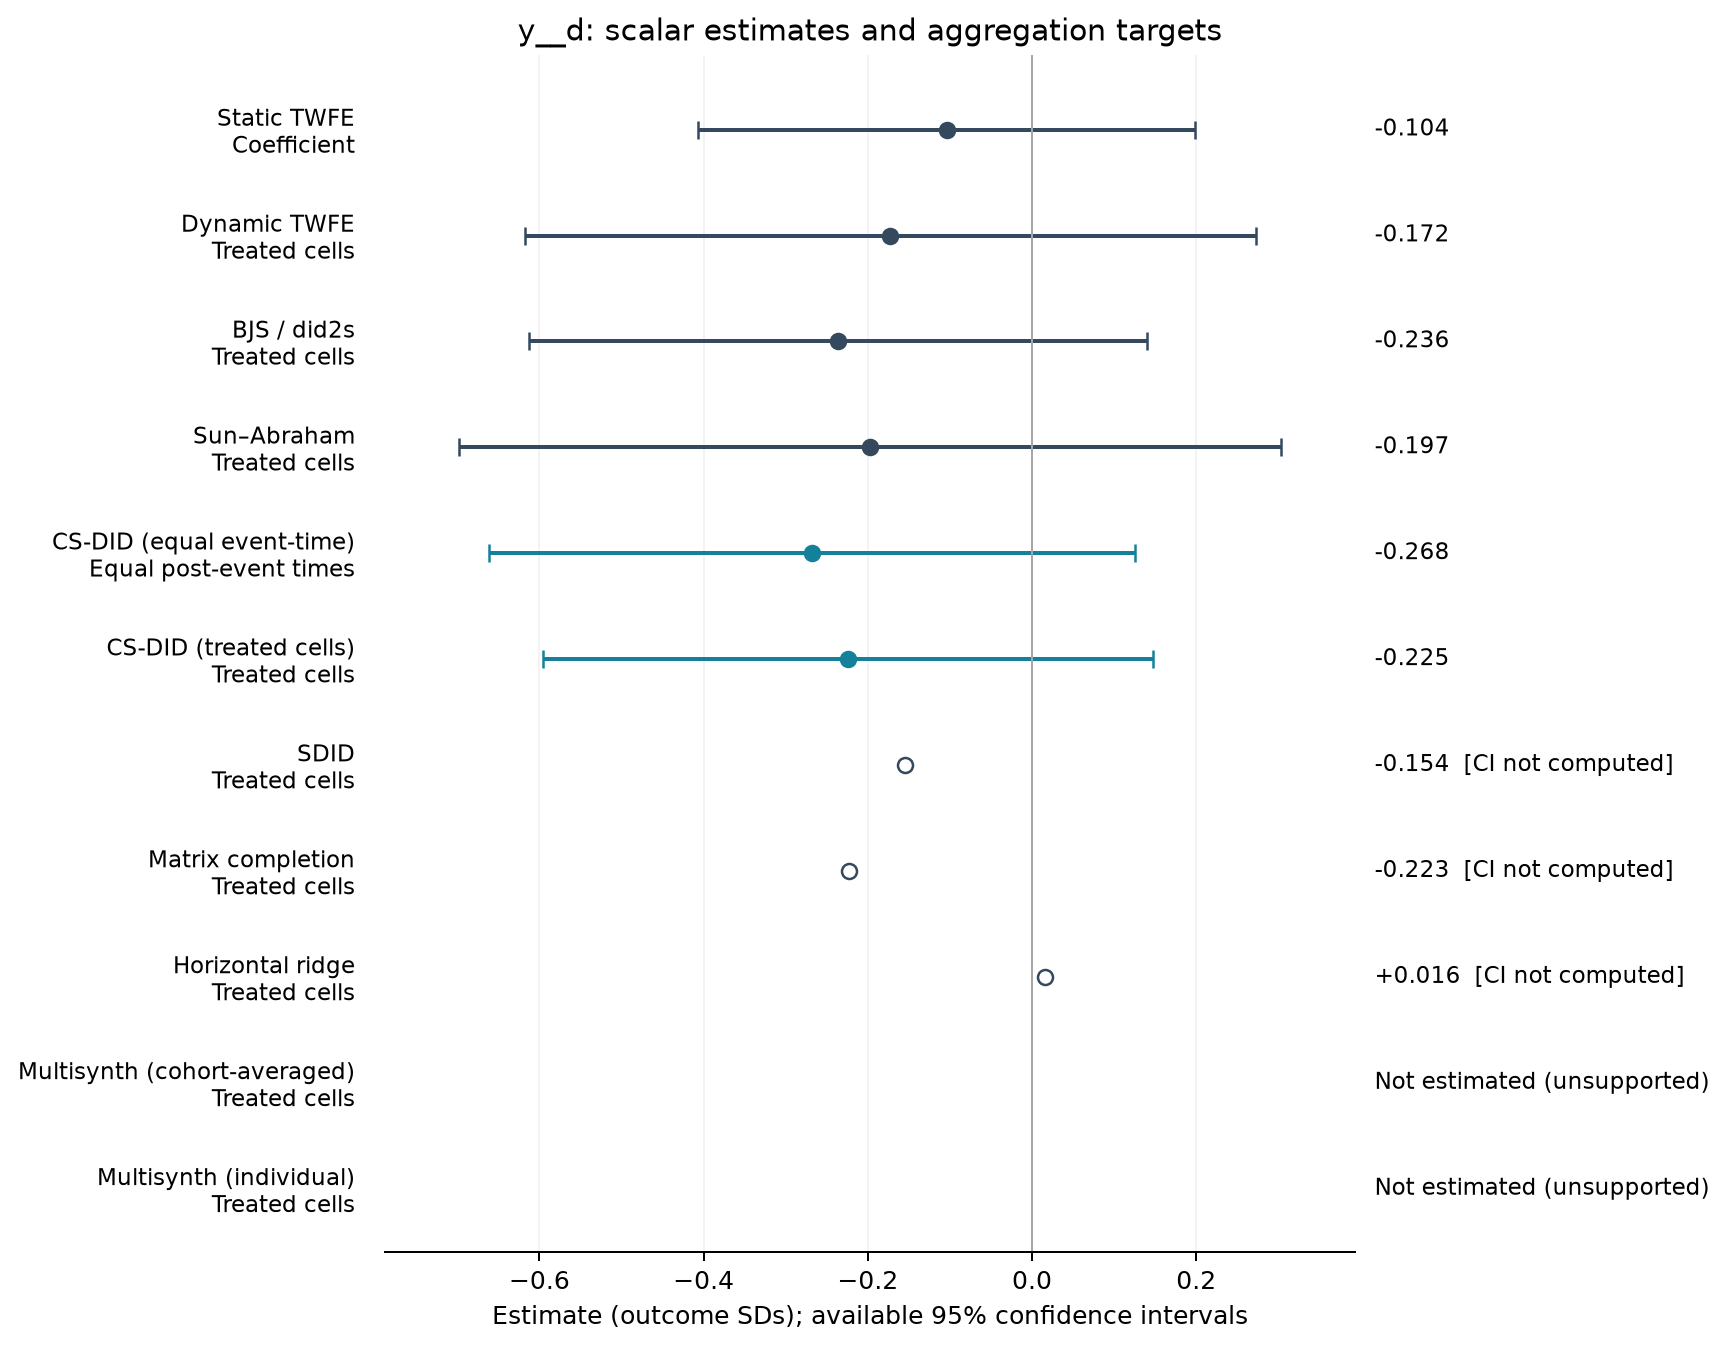
Attitudes about environment z-score index [Table 3 original scale]
1,070 observations · 19 units · 19 clusters · 13 treated / 6 control units.
Estimate comparison
| Estimator | Estimate (SDs) | SE | 95% CI | Averaging |
|---|---|---|---|---|
| Static TWFE | -0.104 | 0.144 | [-0.406, 0.199] | Coefficient |
| Dynamic TWFE | -0.172 | 0.212 | [-0.618, 0.273] | Treated cells |
| BJS / did2s | -0.236 | 0.179 | [-0.612, 0.140] | Treated cells |
| Sun–Abraham | -0.197 | 0.238 | [-0.698, 0.303] | Treated cells |
| CS-DID (equal event-time) | -0.268 | 0.201 | [-0.662, 0.125] | Equal post-event times |
| CS-DID (treated cells) | -0.225 | 0.190 | [-0.596, 0.147] | Treated cells |
| SDID | -0.154 | — | — | Treated cells |
| Matrix completion | -0.223 | — | — | Treated cells |
| Horizontal ridge | 0.016 | — | — | Treated cells |
Event studies
Periods −10 to +10; pointwise 95% intervals where available.
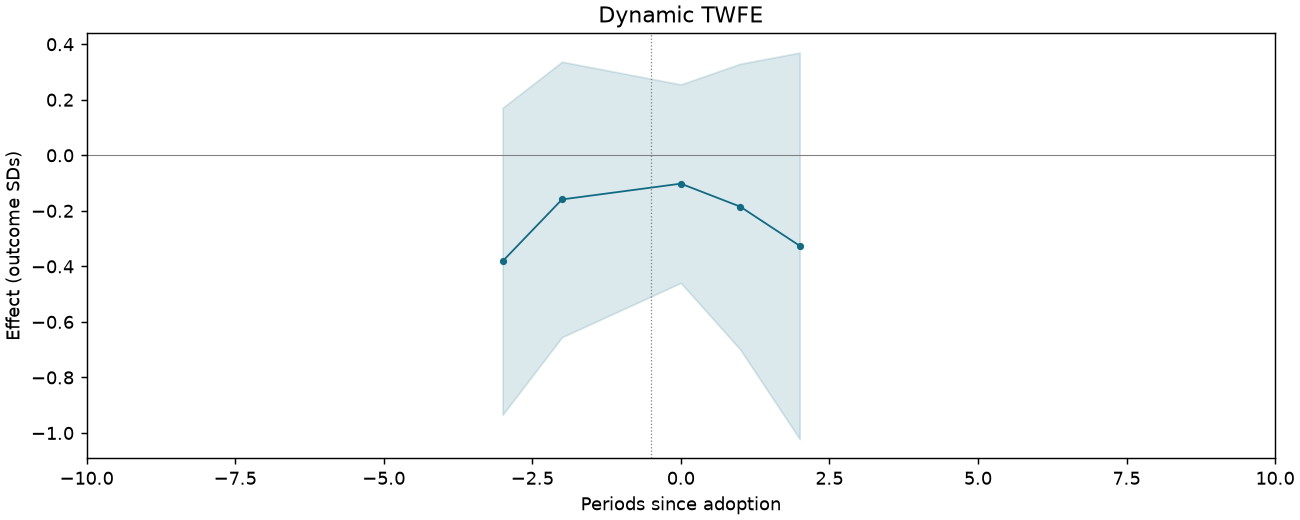
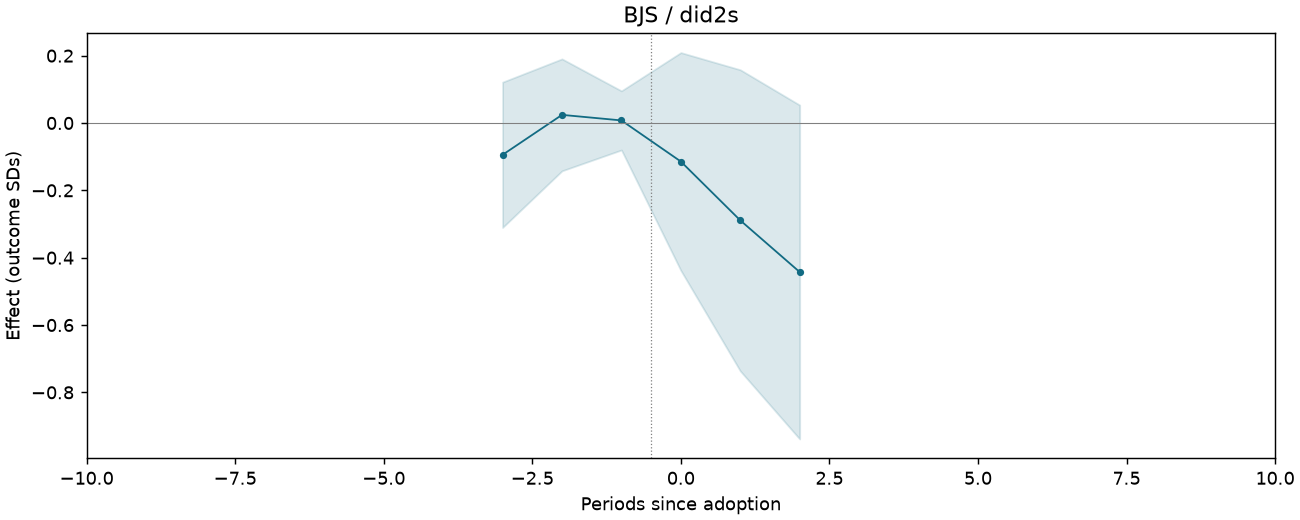
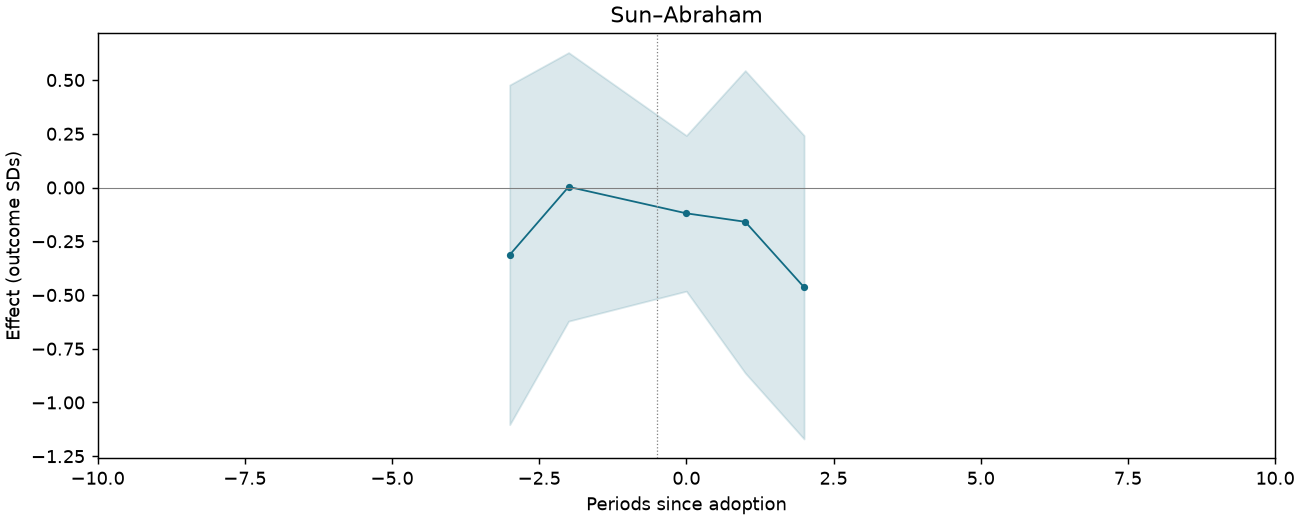
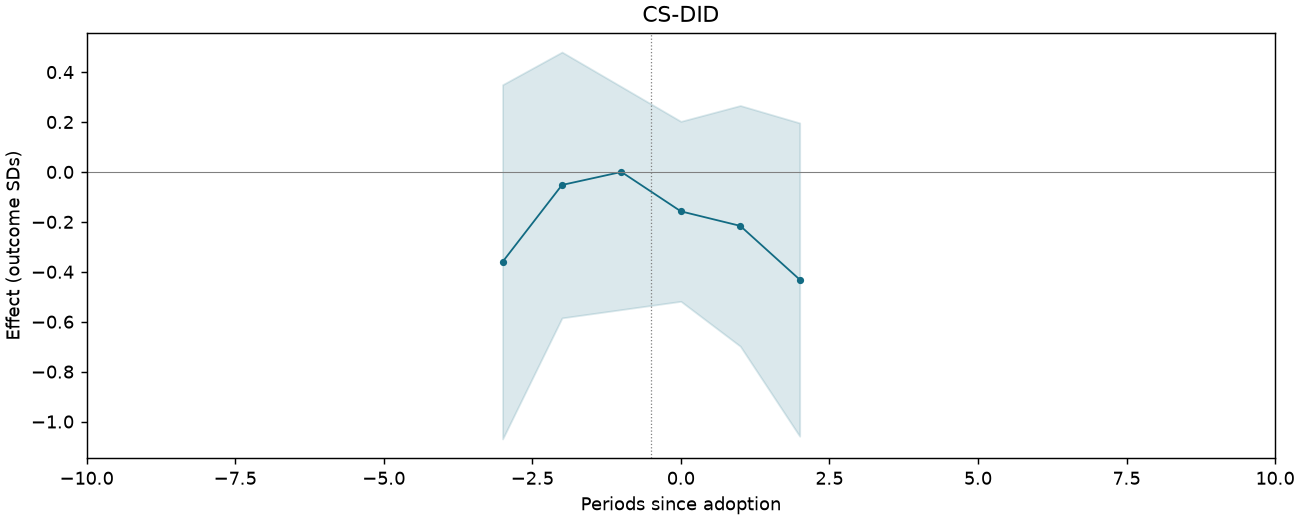
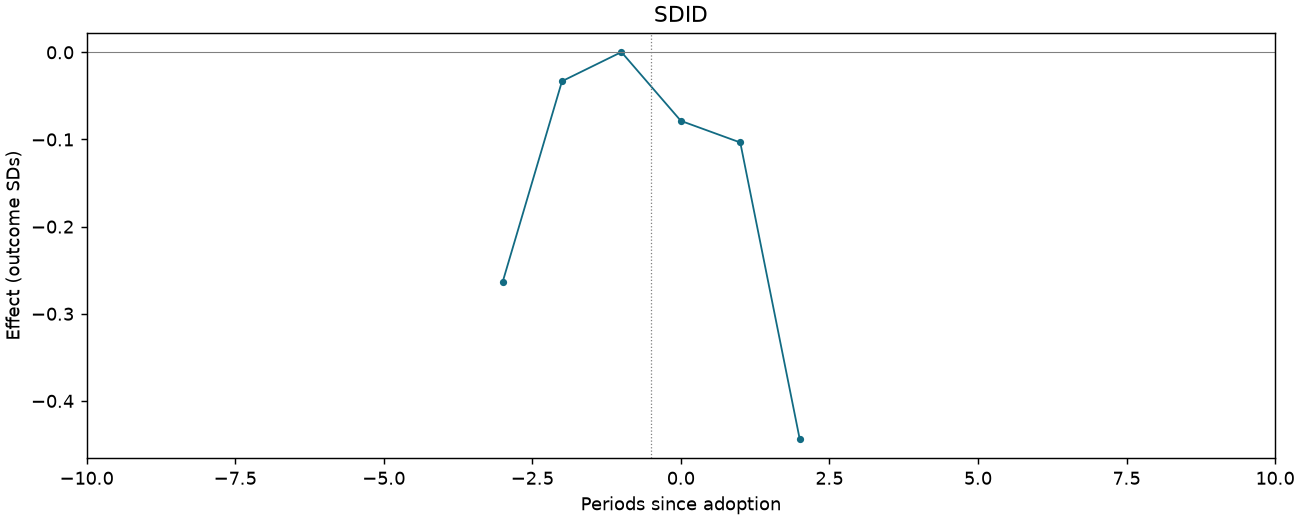
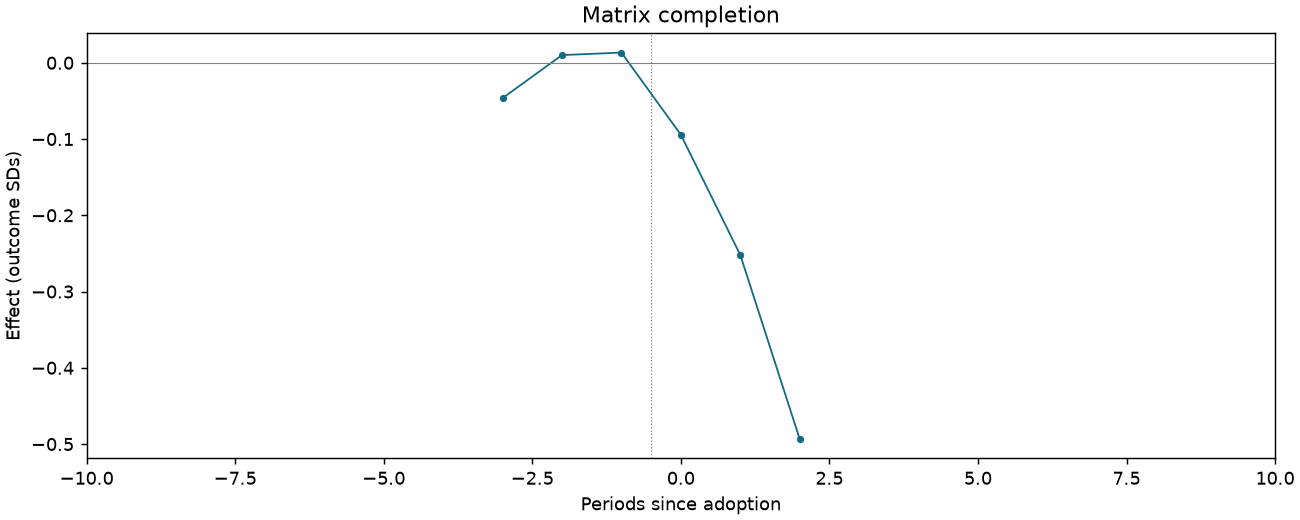
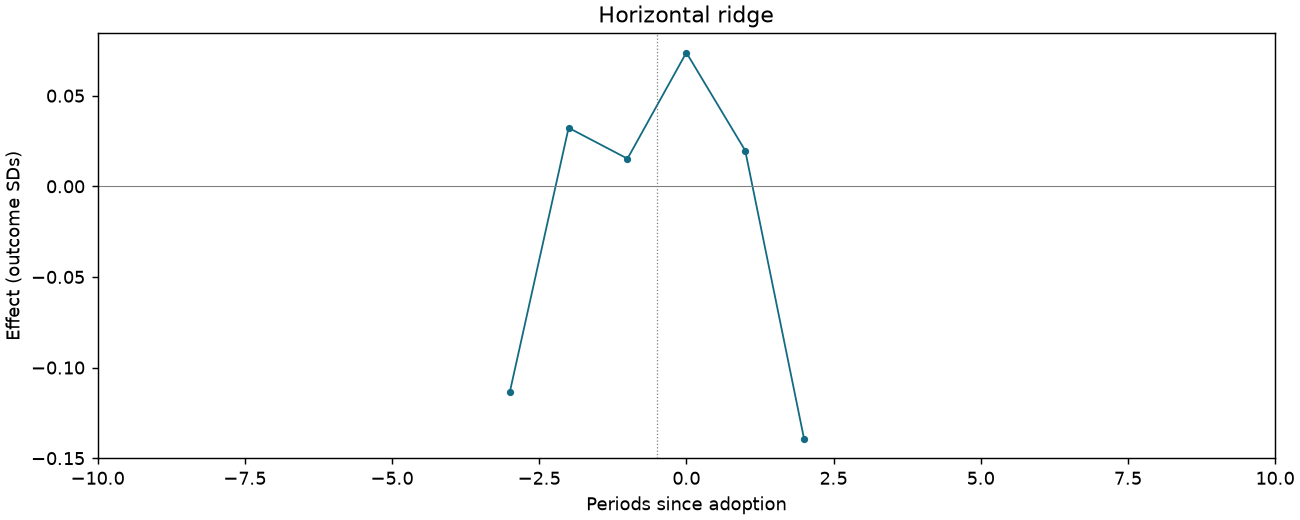
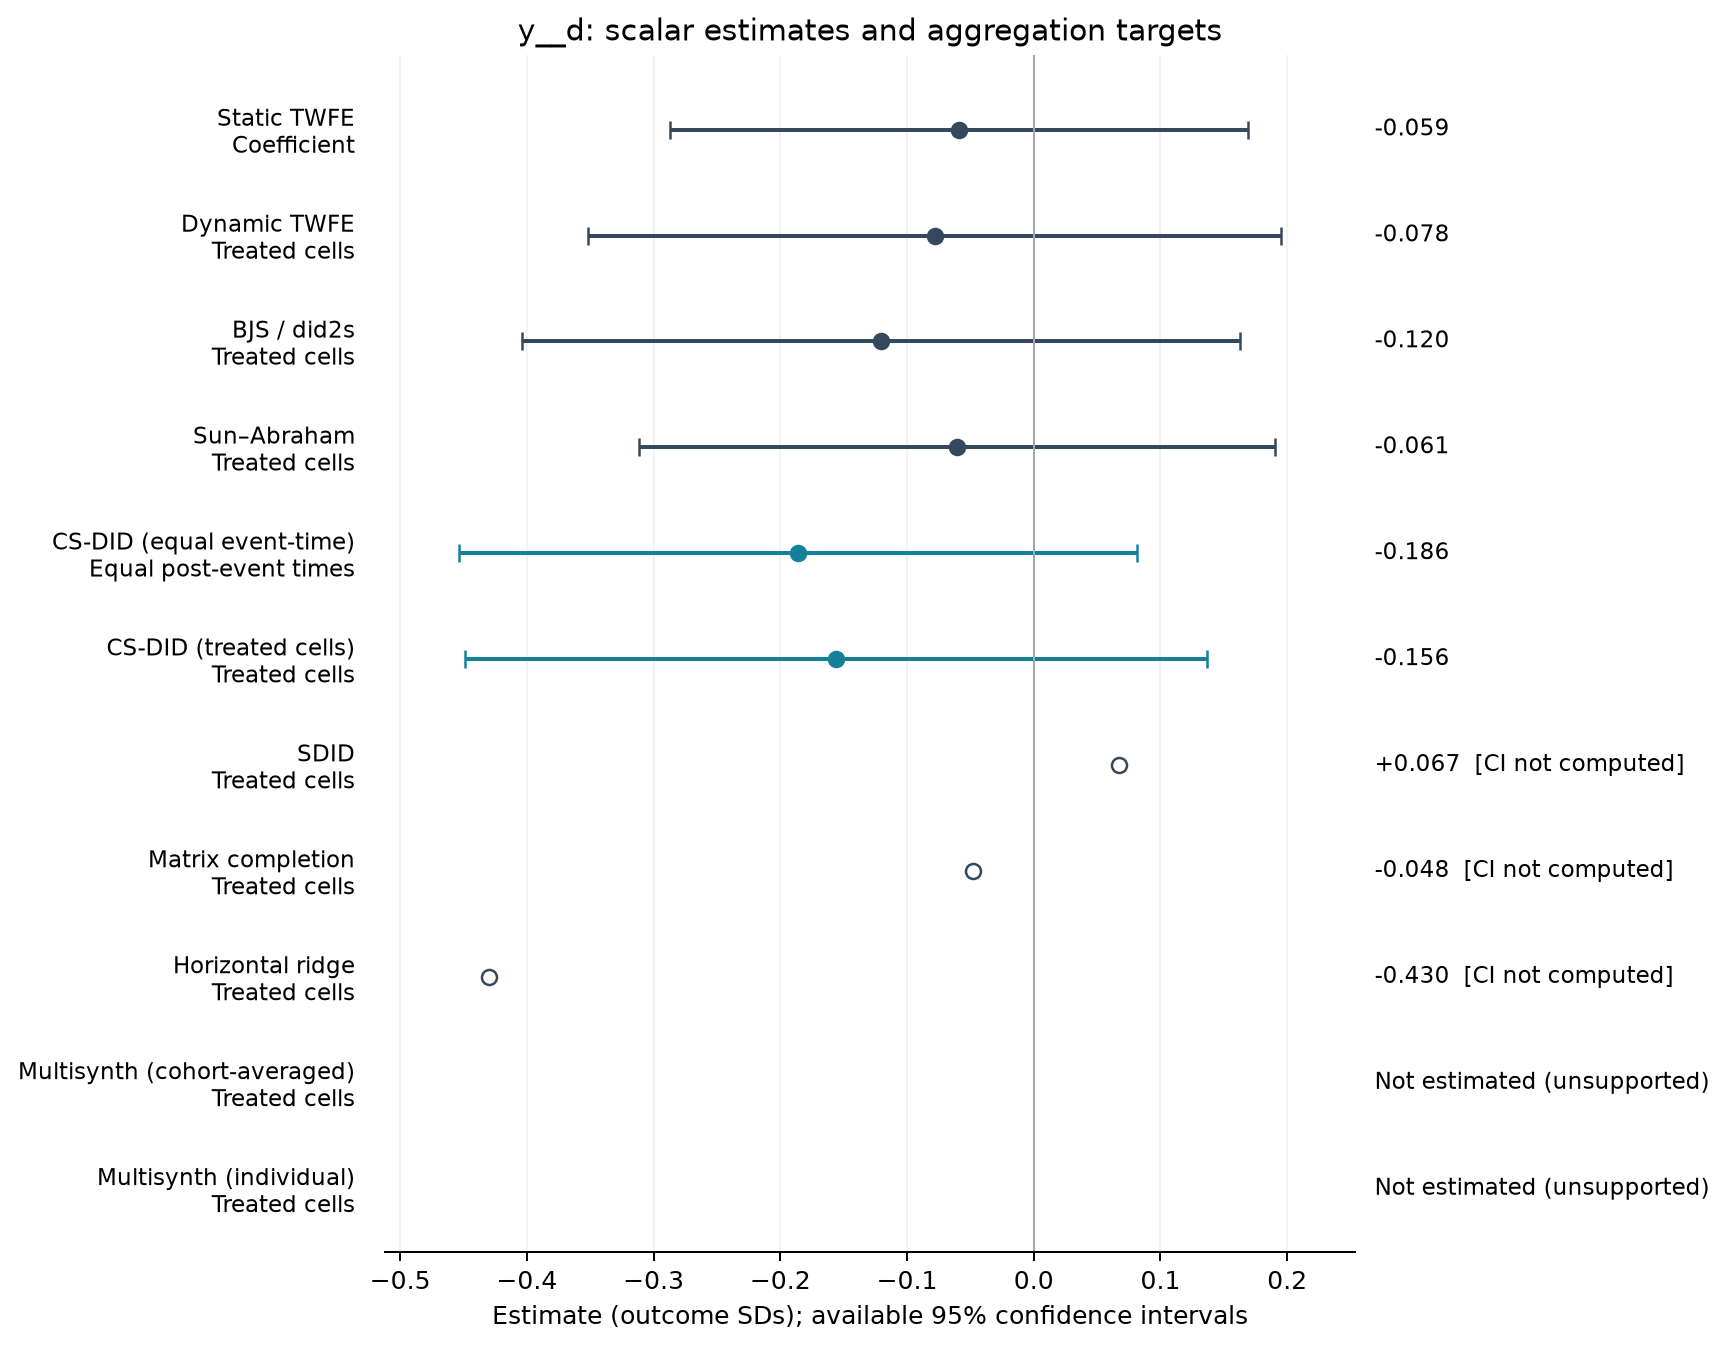
Voted for local People's Congress representative in the past [Table 3 original scale]
1,102 observations · 19 units · 19 clusters · 13 treated / 6 control units.
Estimate comparison
| Estimator | Estimate (SDs) | SE | 95% CI | Averaging |
|---|---|---|---|---|
| Static TWFE | -0.059 | 0.109 | [-0.287, 0.169] | Coefficient |
| Dynamic TWFE | -0.078 | 0.130 | [-0.351, 0.195] | Treated cells |
| BJS / did2s | -0.120 | 0.135 | [-0.404, 0.163] | Treated cells |
| Sun–Abraham | -0.061 | 0.119 | [-0.312, 0.190] | Treated cells |
| CS-DID (equal event-time) | -0.186 | 0.137 | [-0.454, 0.082] | Equal post-event times |
| CS-DID (treated cells) | -0.156 | 0.149 | [-0.448, 0.137] | Treated cells |
| SDID | 0.067 | — | — | Treated cells |
| Matrix completion | -0.048 | — | — | Treated cells |
| Horizontal ridge | -0.430 | — | — | Treated cells |
Event studies
Periods −10 to +10; pointwise 95% intervals where available.
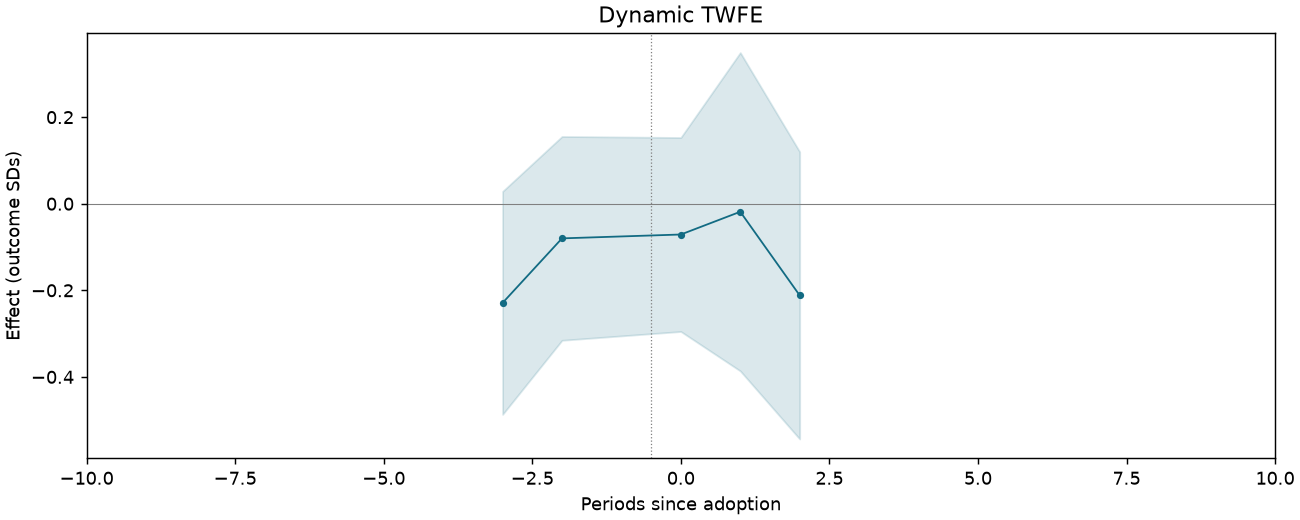
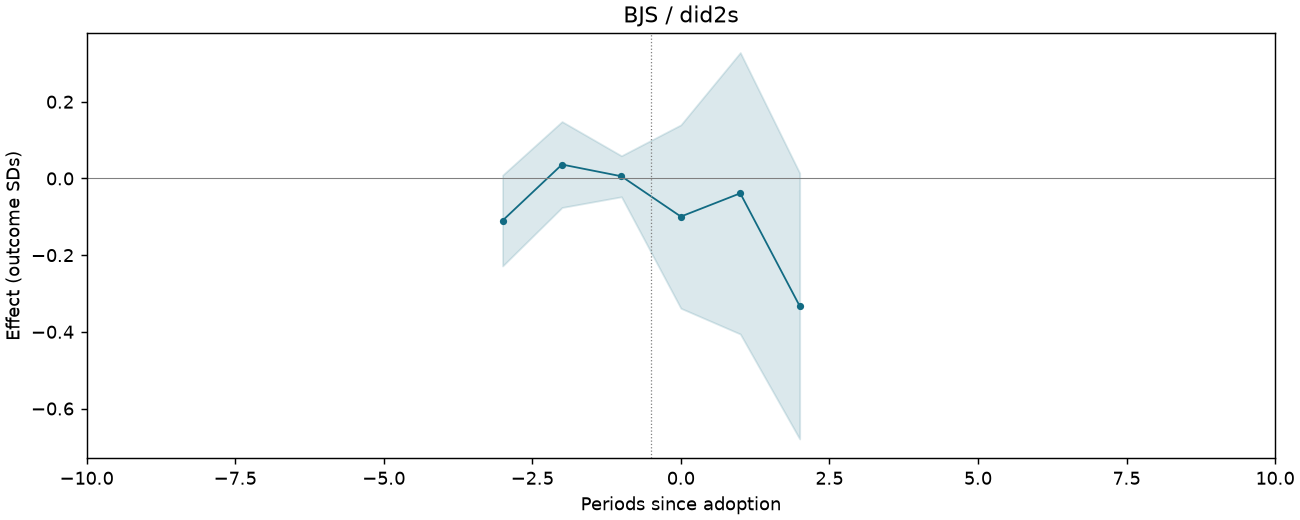
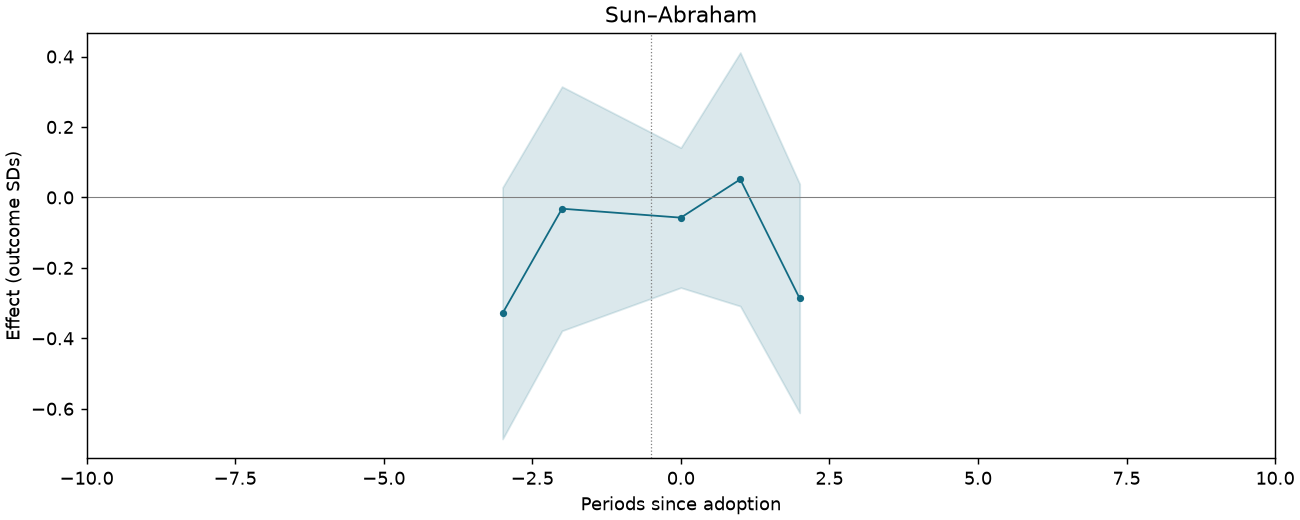
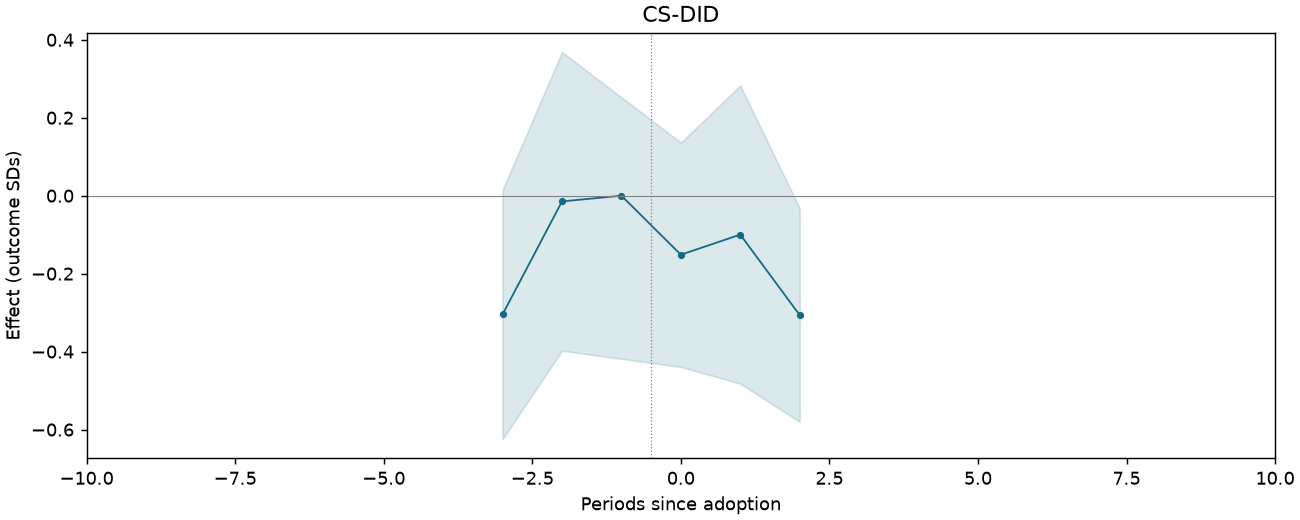
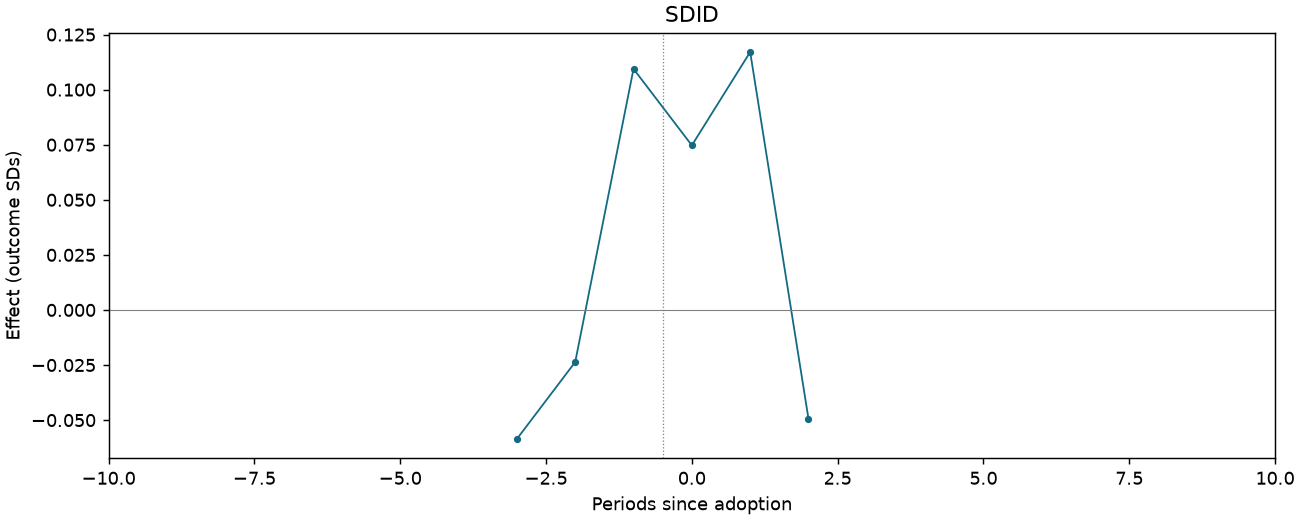
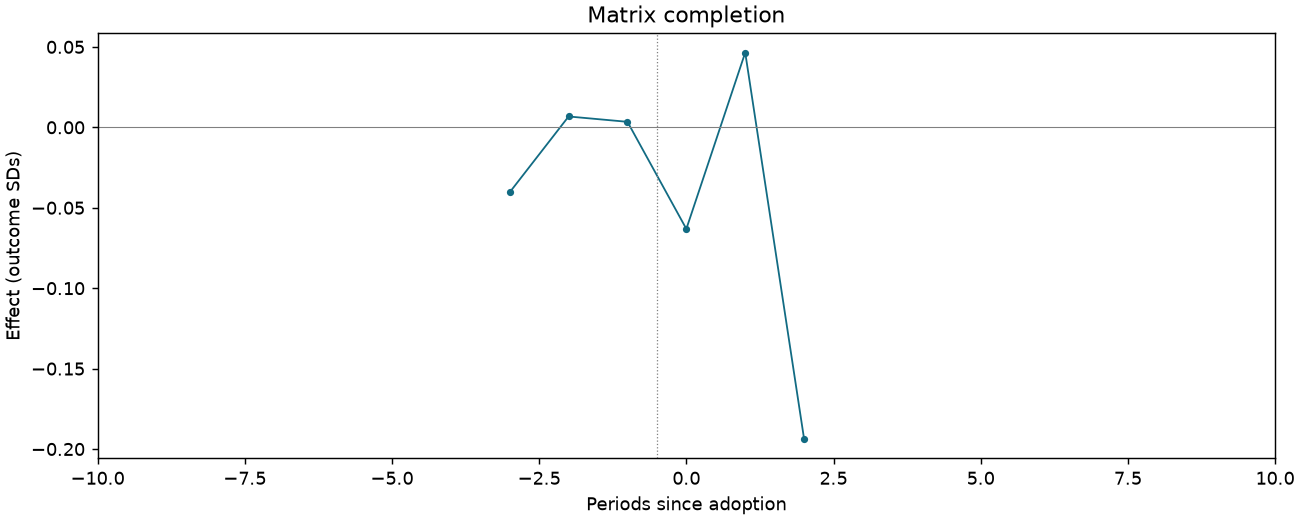
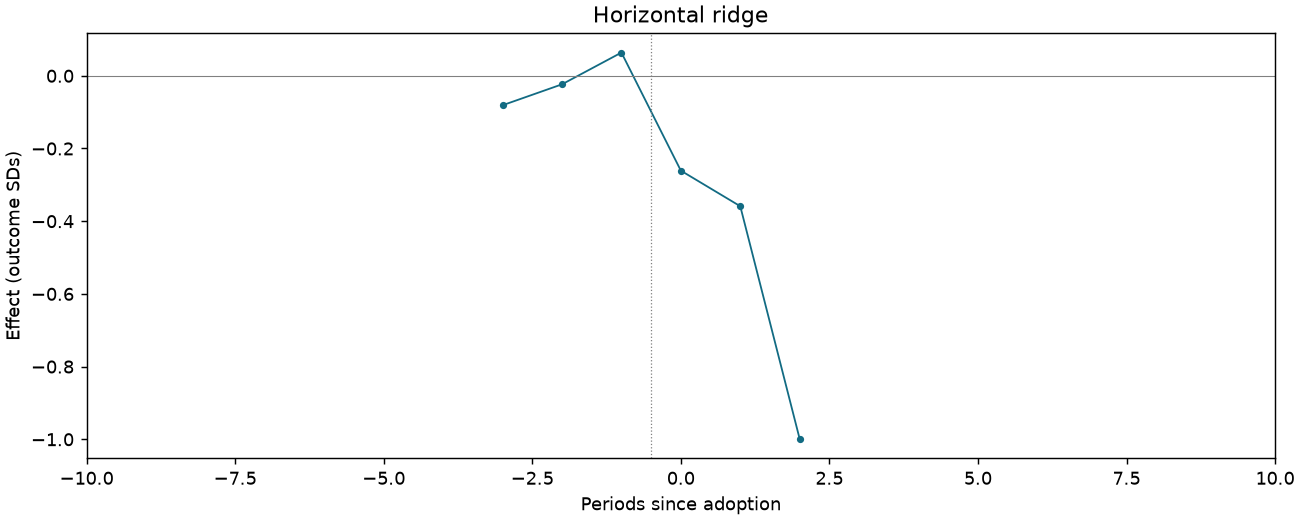
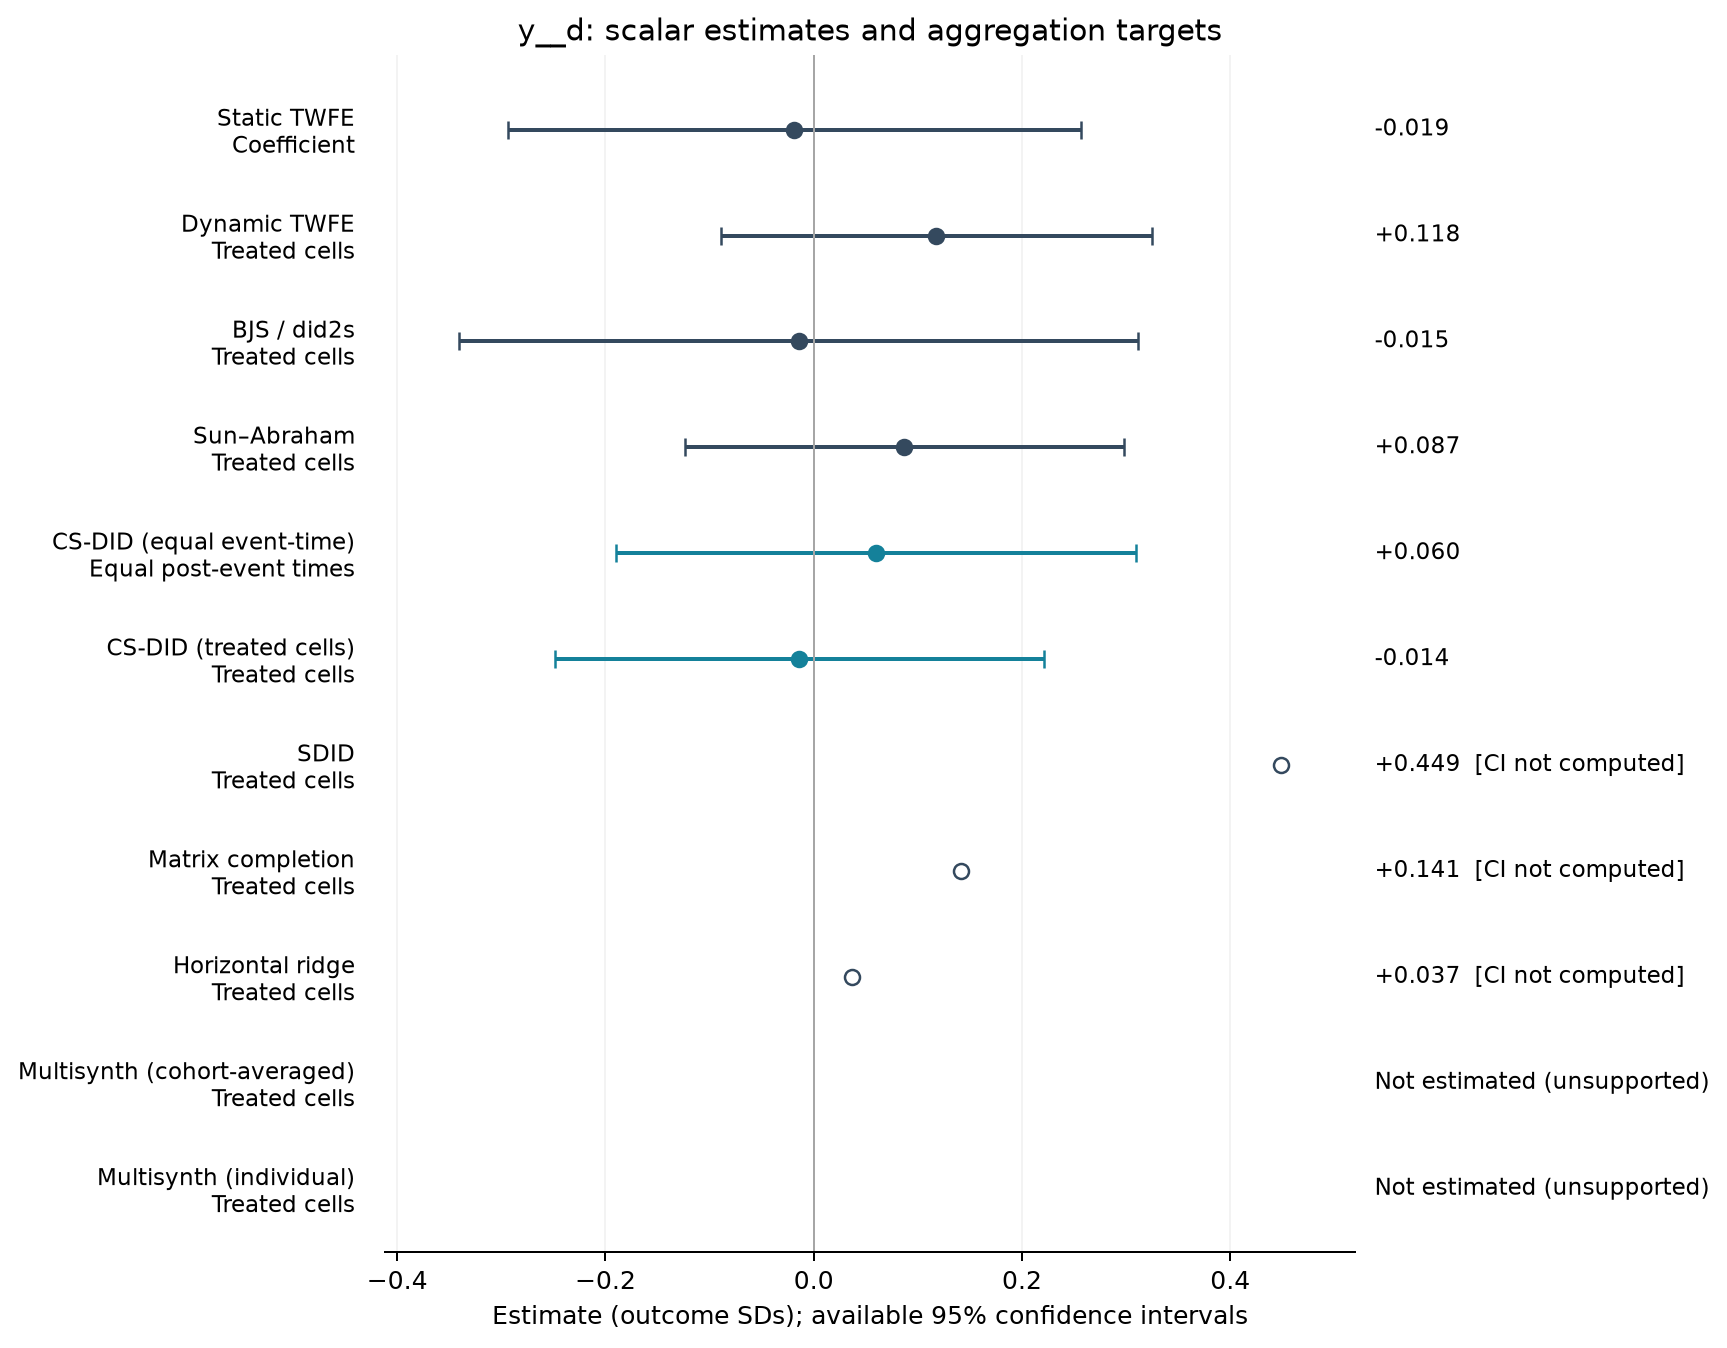
Plan to vote for local People's Congress representative [Table 3 original scale]
1,102 observations · 19 units · 19 clusters · 13 treated / 6 control units.
Estimate comparison
| Estimator | Estimate (SDs) | SE | 95% CI | Averaging |
|---|---|---|---|---|
| Static TWFE | -0.019 | 0.131 | [-0.294, 0.256] | Coefficient |
| Dynamic TWFE | 0.118 | 0.099 | [-0.089, 0.325] | Treated cells |
| BJS / did2s | -0.015 | 0.155 | [-0.341, 0.312] | Treated cells |
| Sun–Abraham | 0.087 | 0.100 | [-0.124, 0.298] | Treated cells |
| CS-DID (equal event-time) | 0.060 | 0.127 | [-0.190, 0.310] | Equal post-event times |
| CS-DID (treated cells) | -0.014 | 0.120 | [-0.249, 0.221] | Treated cells |
| SDID | 0.449 | — | — | Treated cells |
| Matrix completion | 0.141 | — | — | Treated cells |
| Horizontal ridge | 0.037 | — | — | Treated cells |
Event studies
Periods −10 to +10; pointwise 95% intervals where available.
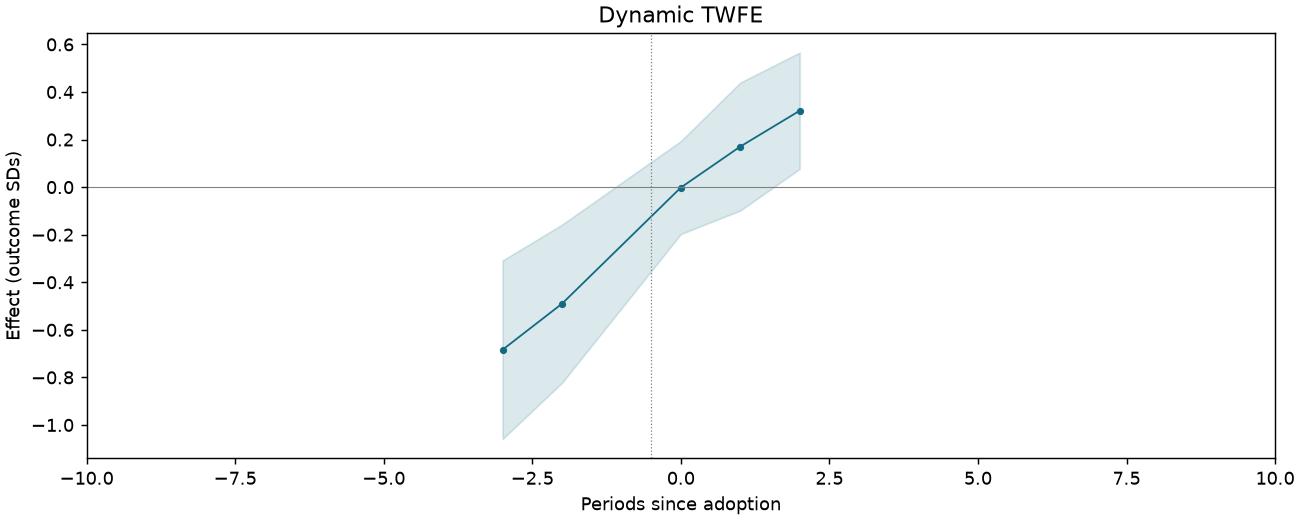
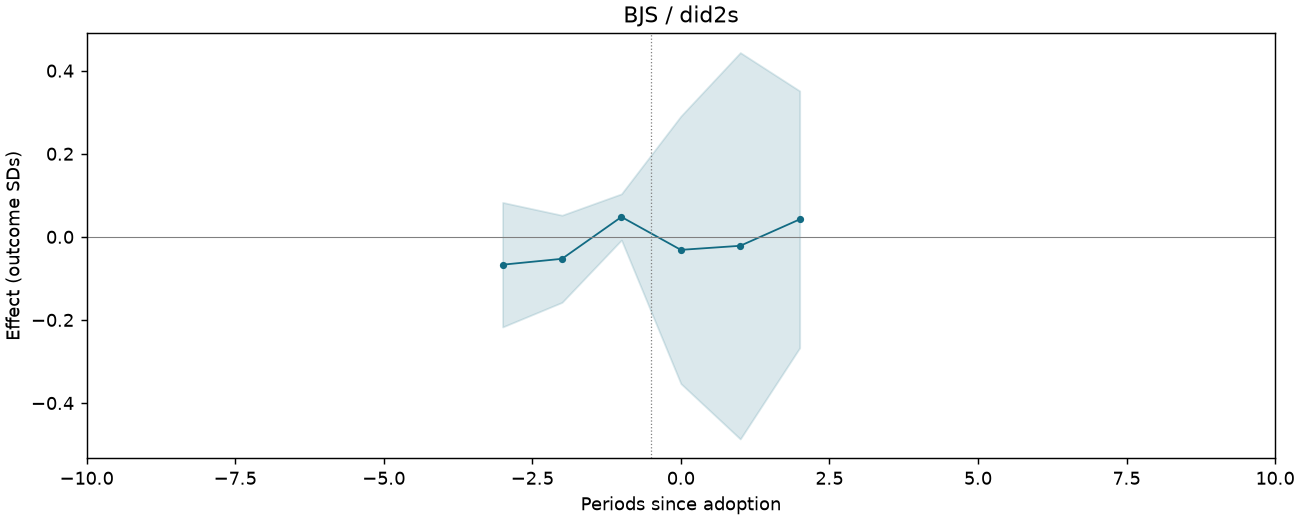
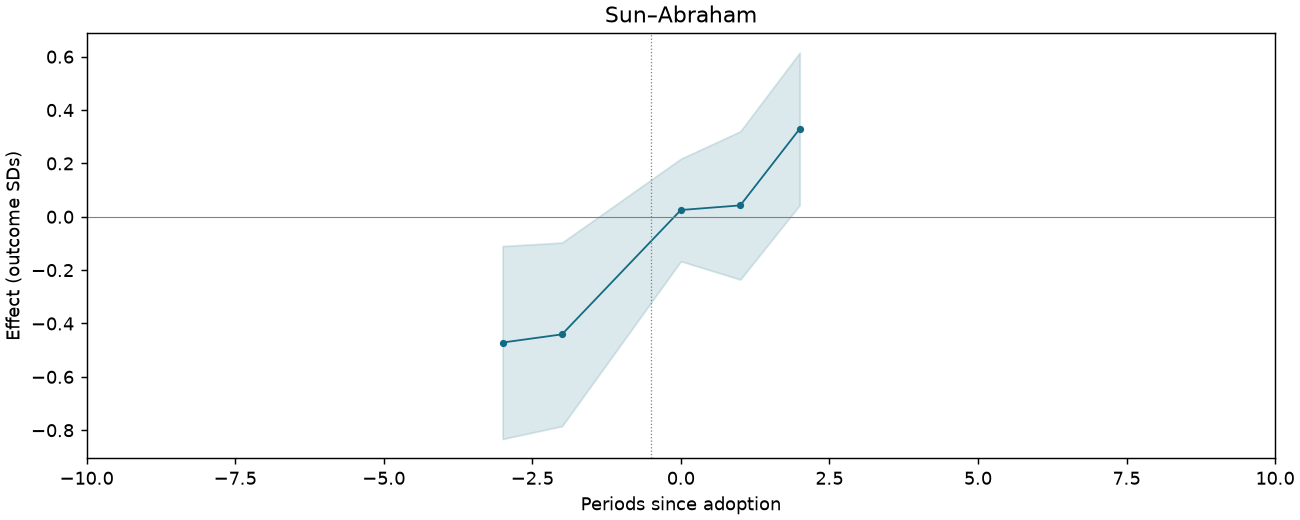
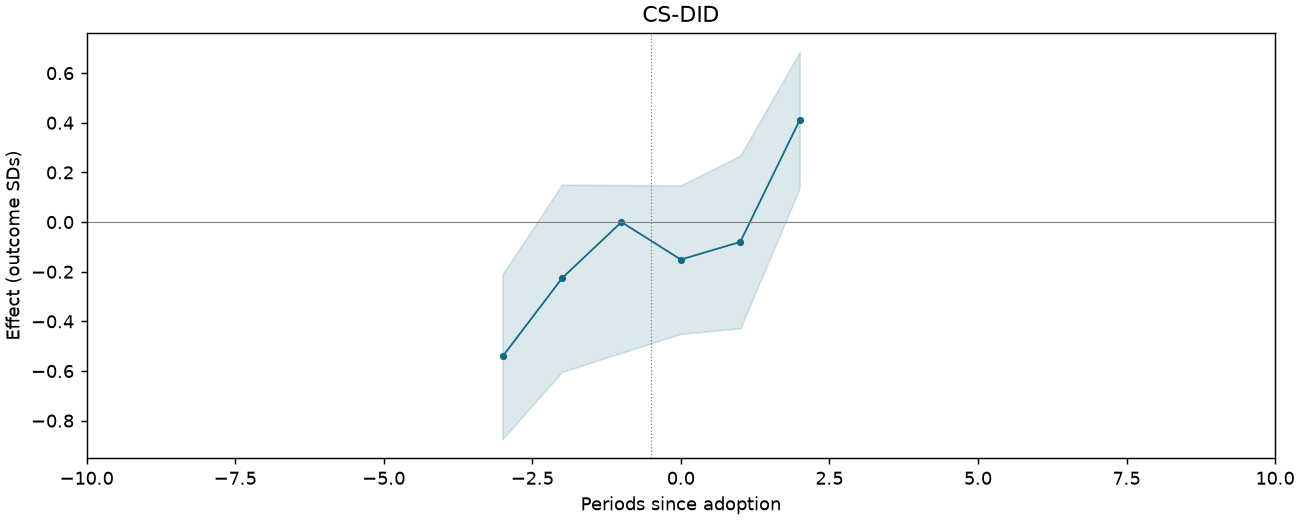
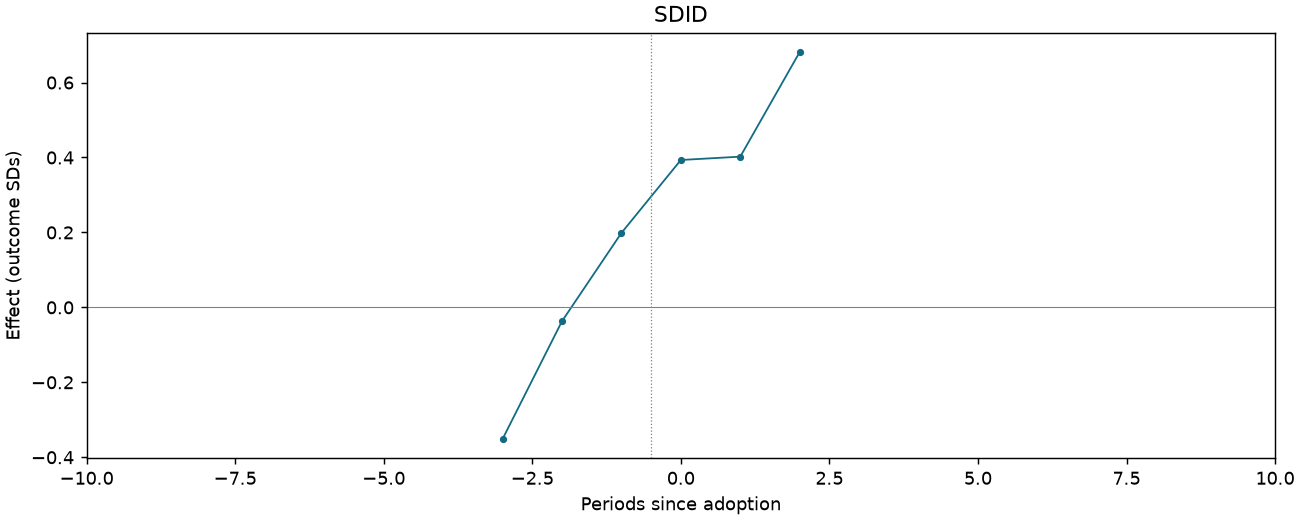
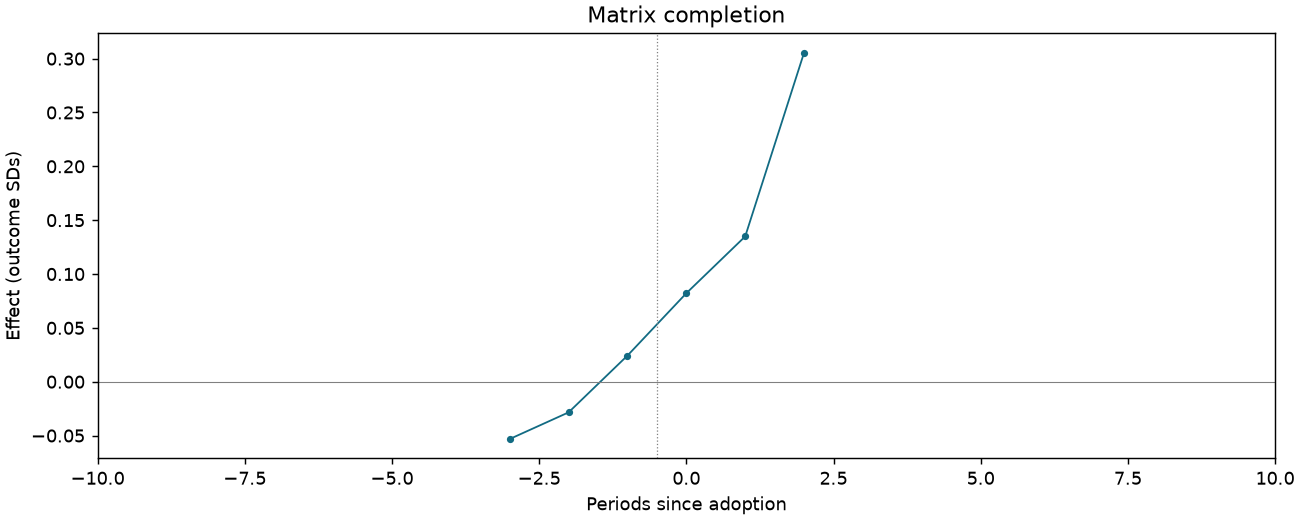
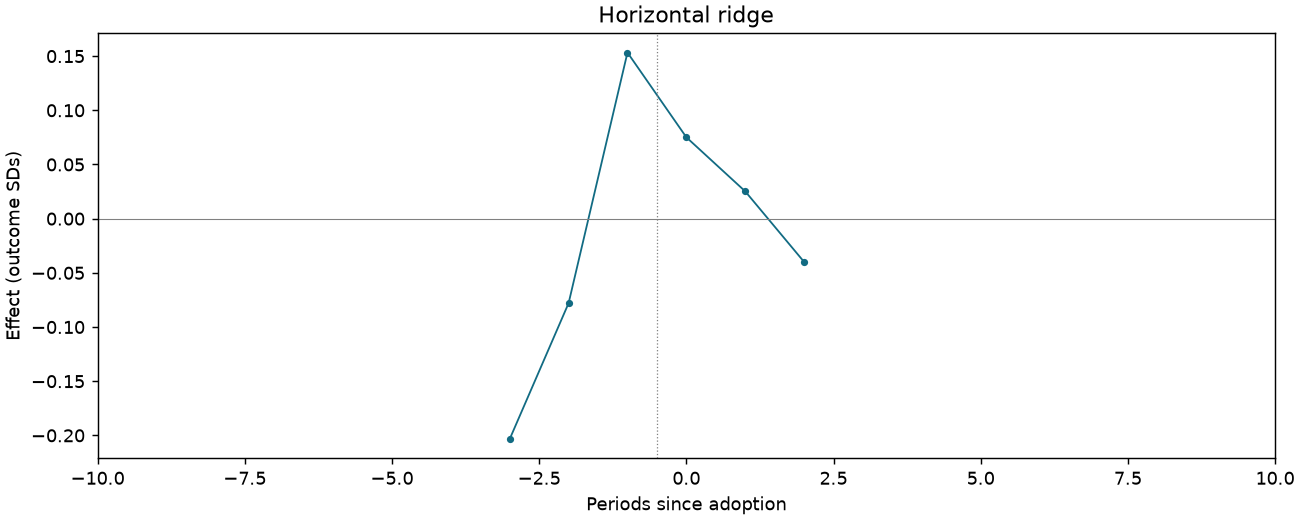
Member of Chinese Communist Party [Table 3 original scale]
1,146 observations · 19 units · 19 clusters · 13 treated / 6 control units.
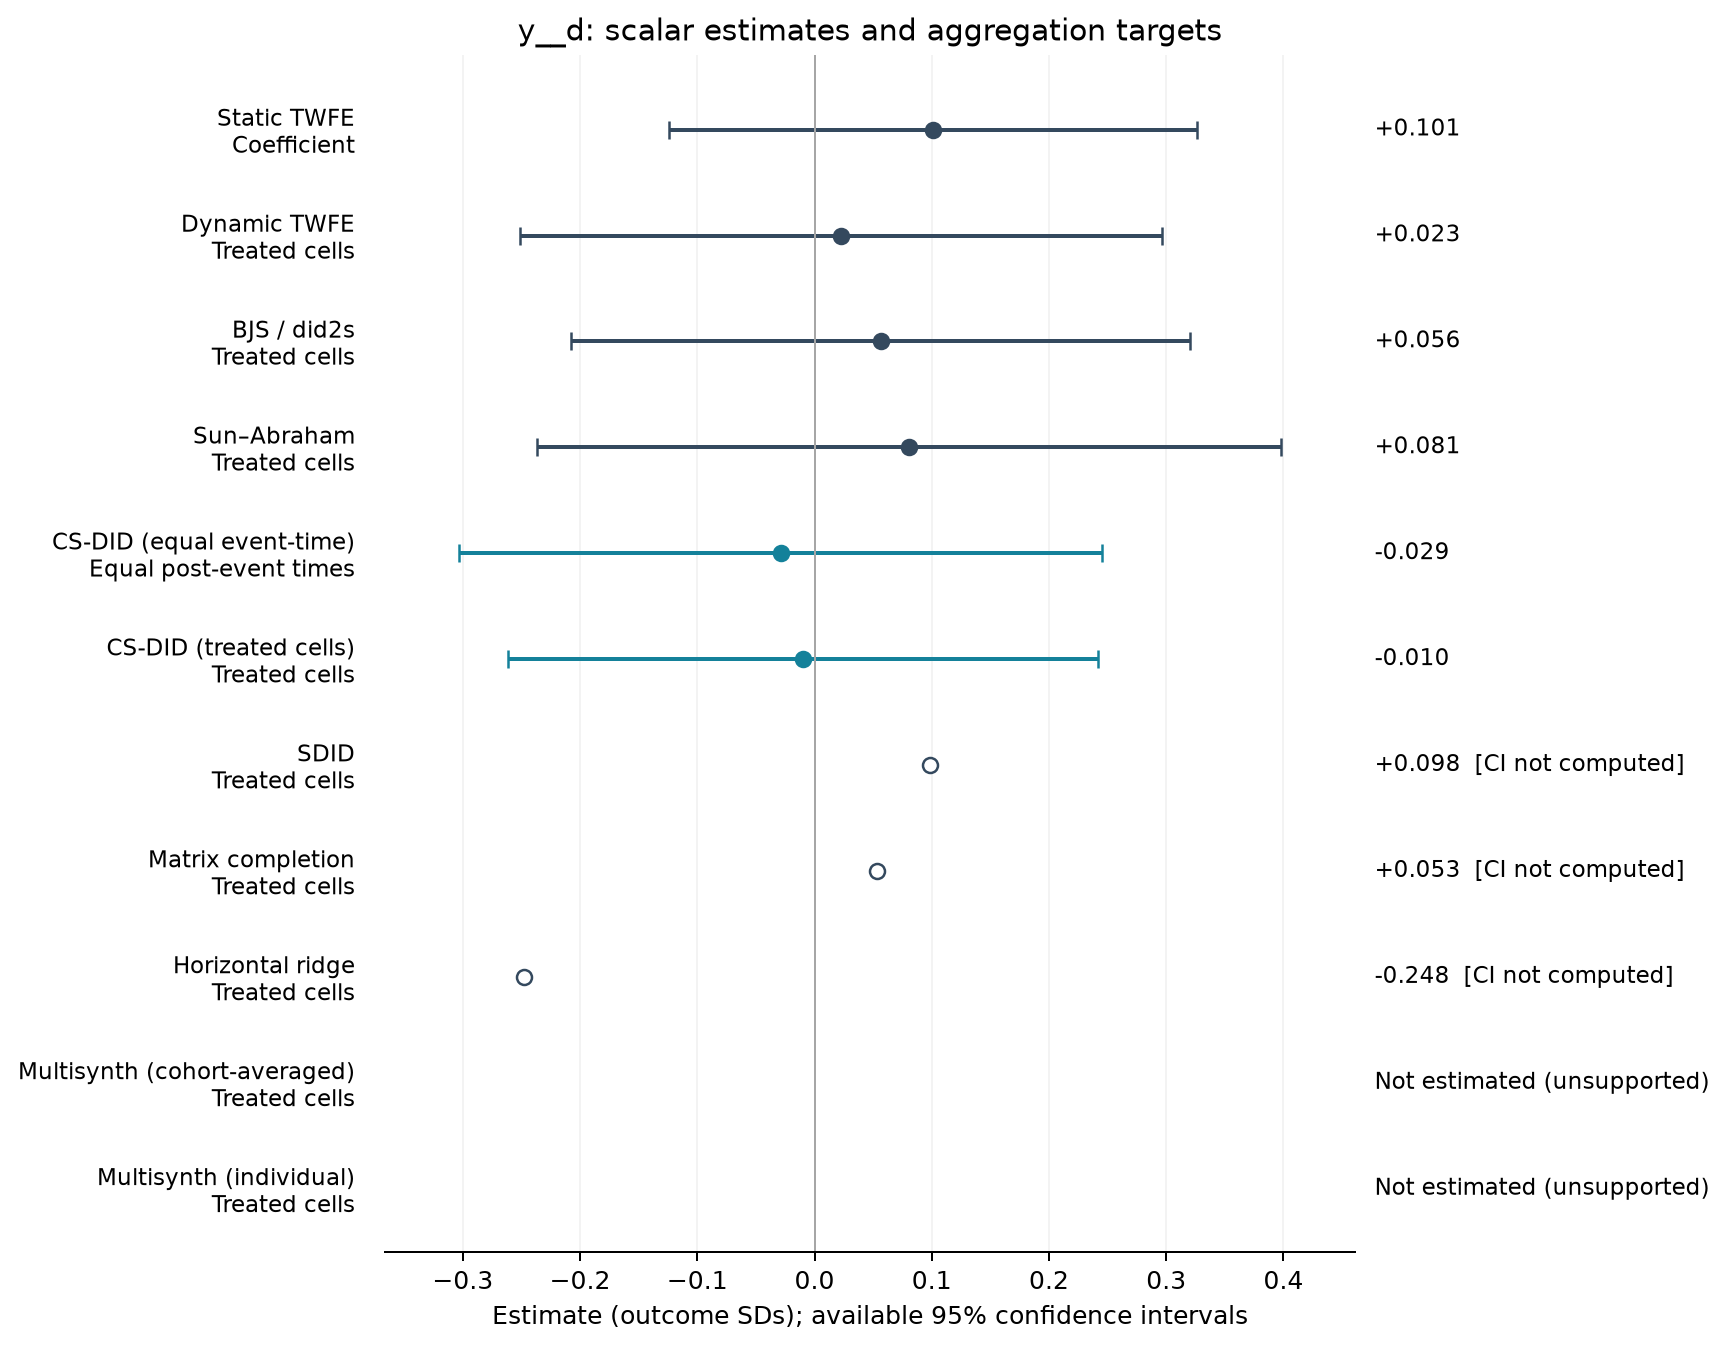
Estimate comparison
| Estimator | Estimate (SDs) | SE | 95% CI | Averaging |
|---|---|---|---|---|
| Static TWFE | 0.101 | 0.107 | [-0.124, 0.326] | Coefficient |
| Dynamic TWFE | 0.023 | 0.130 | [-0.251, 0.297] | Treated cells |
| BJS / did2s | 0.056 | 0.126 | [-0.207, 0.320] | Treated cells |
| Sun–Abraham | 0.081 | 0.151 | [-0.236, 0.398] | Treated cells |
| CS-DID (equal event-time) | -0.029 | 0.140 | [-0.303, 0.245] | Equal post-event times |
| CS-DID (treated cells) | -0.010 | 0.129 | [-0.262, 0.242] | Treated cells |
| SDID | 0.098 | — | — | Treated cells |
| Matrix completion | 0.053 | — | — | Treated cells |
| Horizontal ridge | -0.248 | — | — | Treated cells |
Event studies
Periods −10 to +10; pointwise 95% intervals where available.
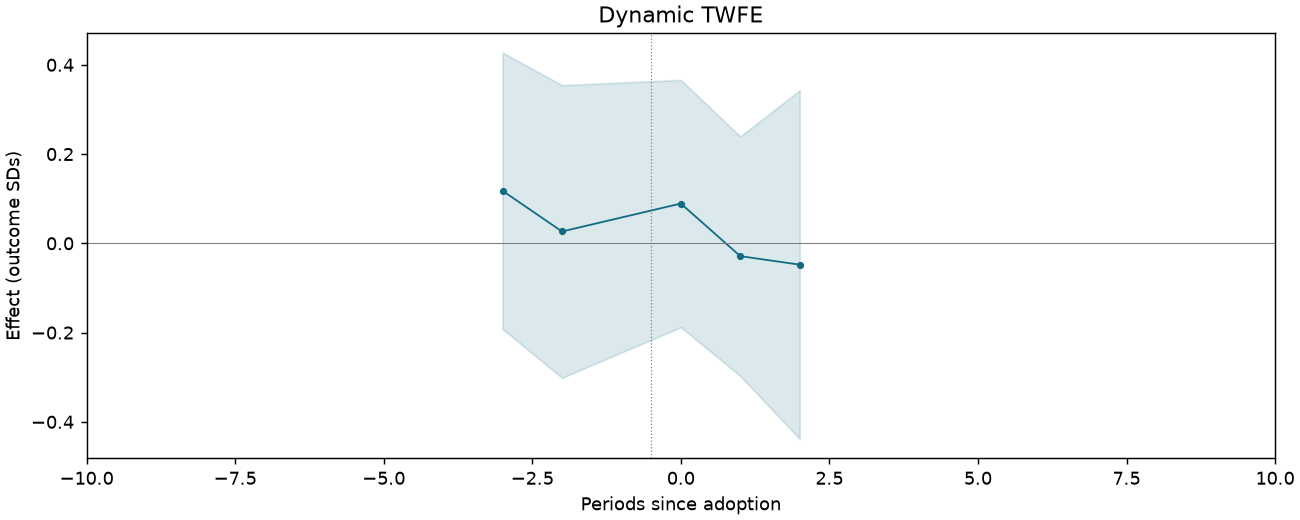
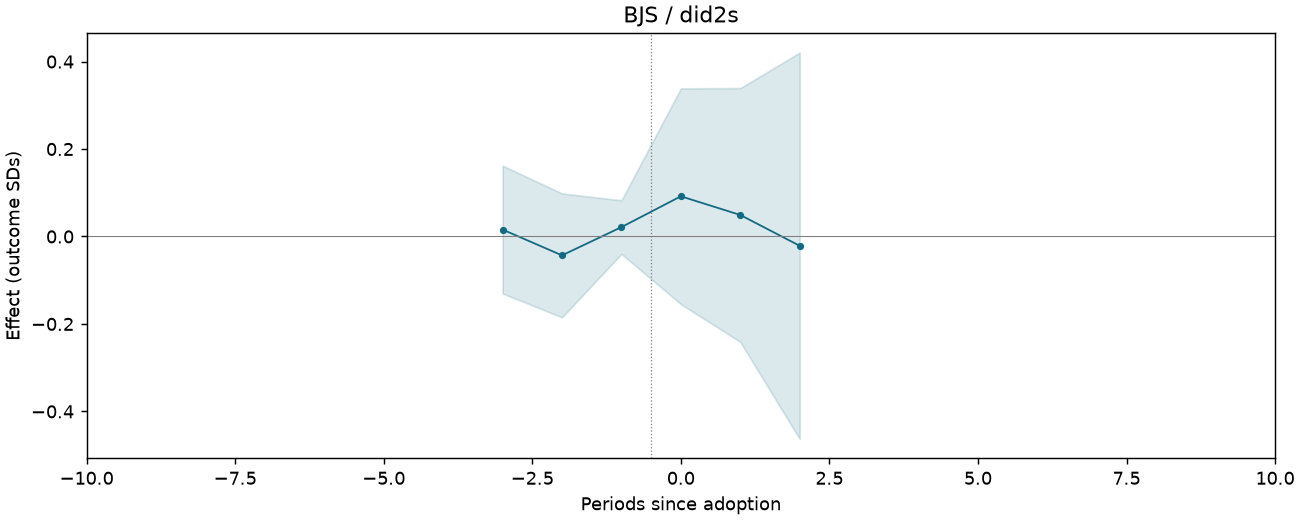
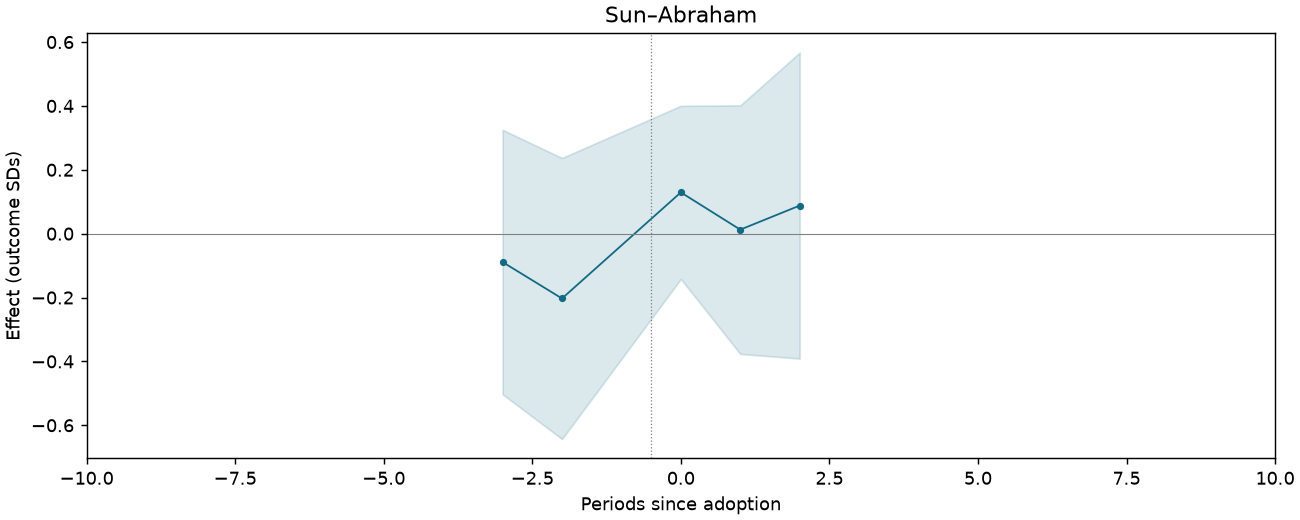
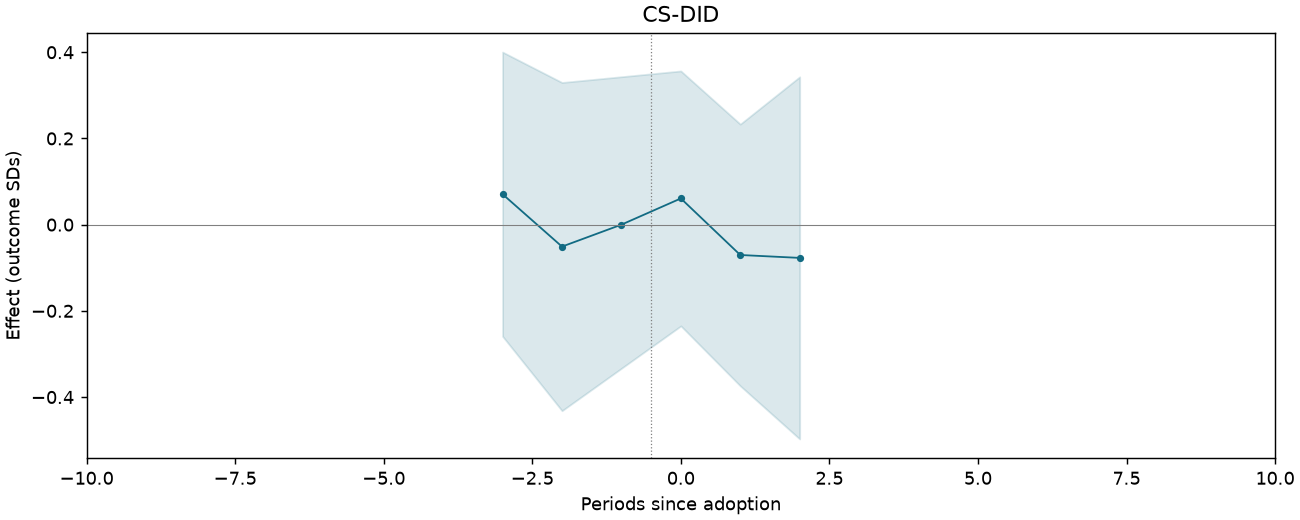
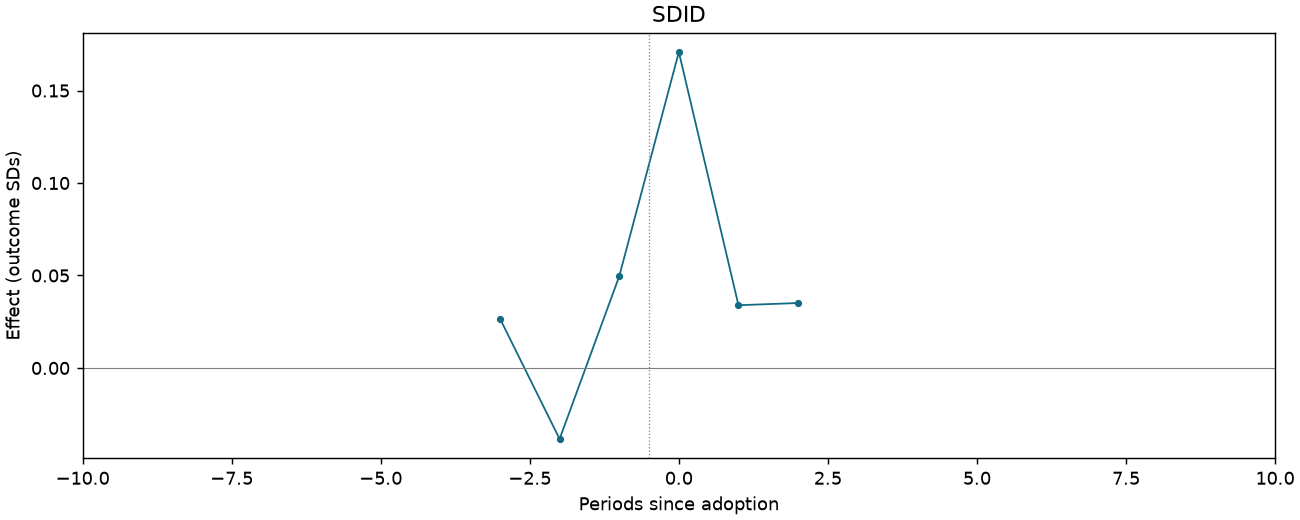
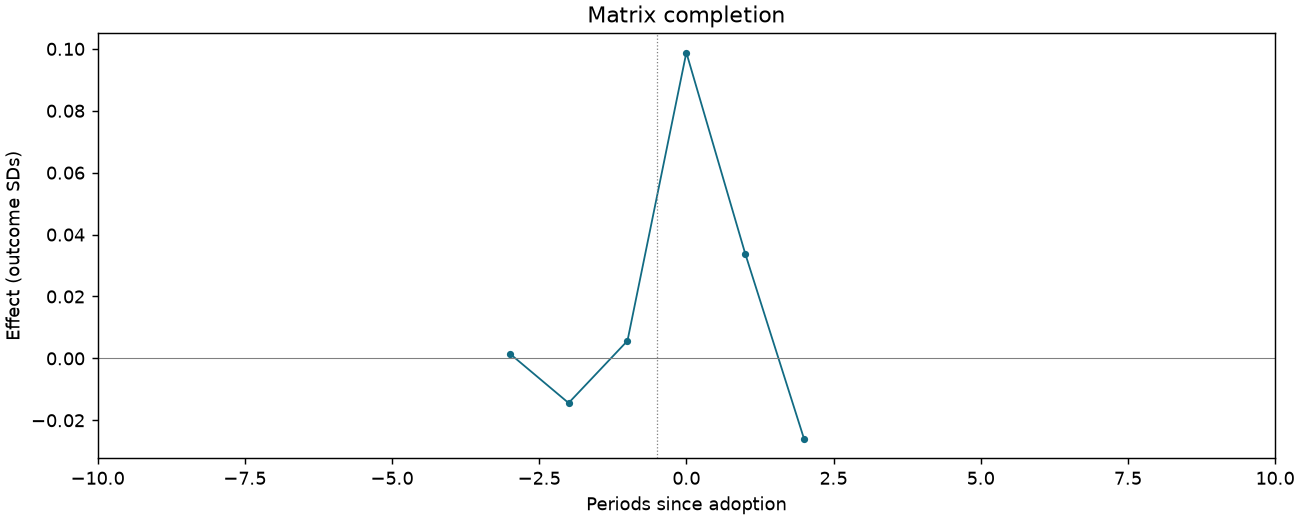
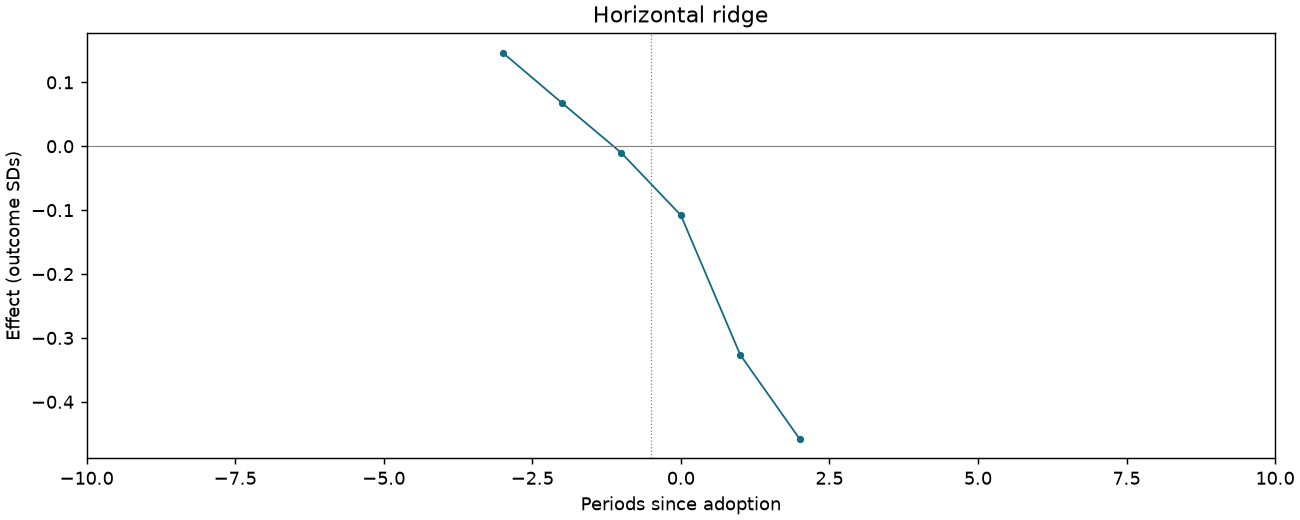
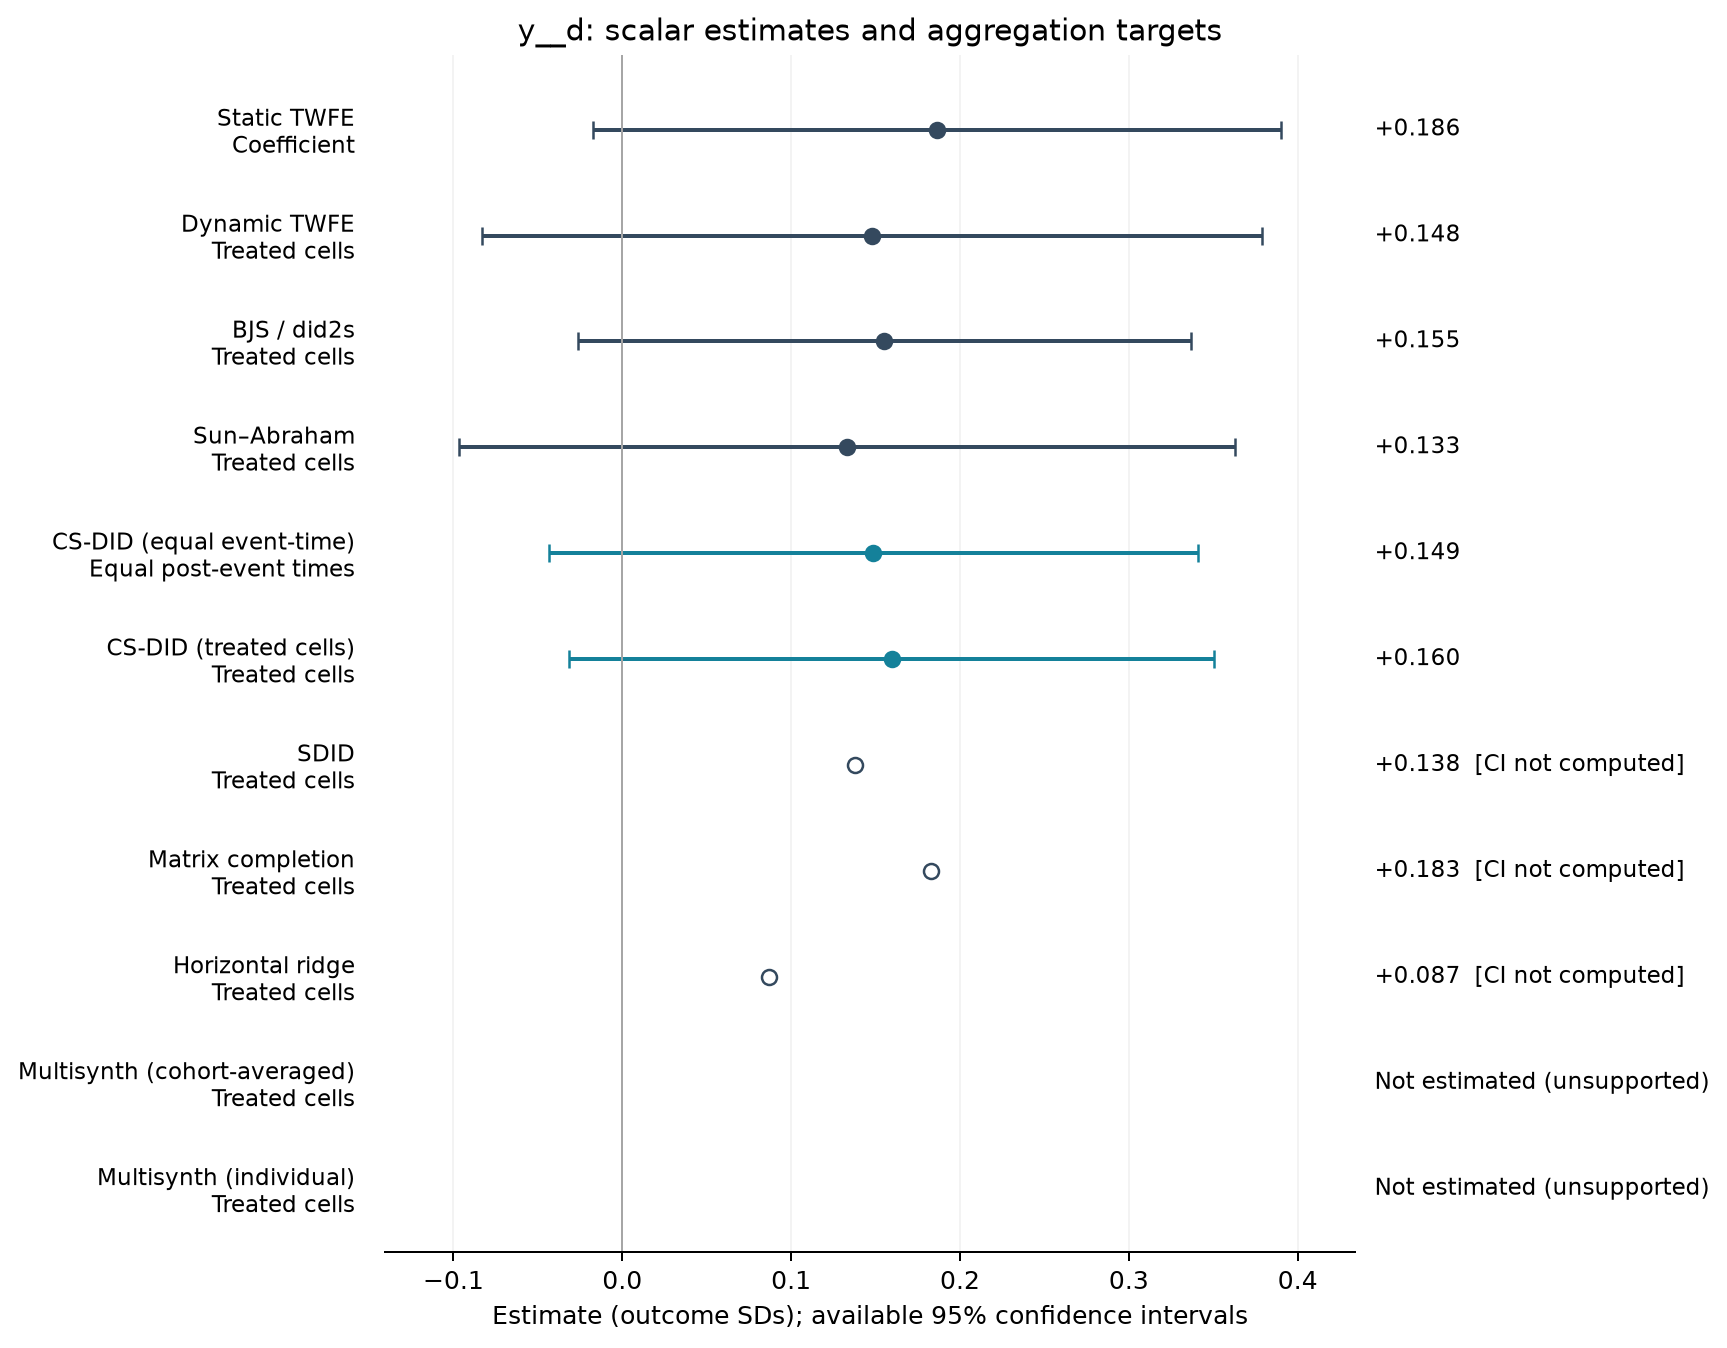
Participation in political groups [Table 3 original scale]
1,065 observations · 19 units · 19 clusters · 13 treated / 6 control units.
Estimate comparison
| Estimator | Estimate (SDs) | SE | 95% CI | Averaging |
|---|---|---|---|---|
| Static TWFE | 0.186 | 0.097 | [-0.017, 0.390] | Coefficient |
| Dynamic TWFE | 0.148 | 0.110 | [-0.083, 0.379] | Treated cells |
| BJS / did2s | 0.155 | 0.086 | [-0.026, 0.337] | Treated cells |
| Sun–Abraham | 0.133 | 0.109 | [-0.097, 0.363] | Treated cells |
| CS-DID (equal event-time) | 0.149 | 0.098 | [-0.043, 0.341] | Equal post-event times |
| CS-DID (treated cells) | 0.160 | 0.098 | [-0.032, 0.351] | Treated cells |
| SDID | 0.138 | — | — | Treated cells |
| Matrix completion | 0.183 | — | — | Treated cells |
| Horizontal ridge | 0.087 | — | — | Treated cells |
Event studies
Periods −10 to +10; pointwise 95% intervals where available.
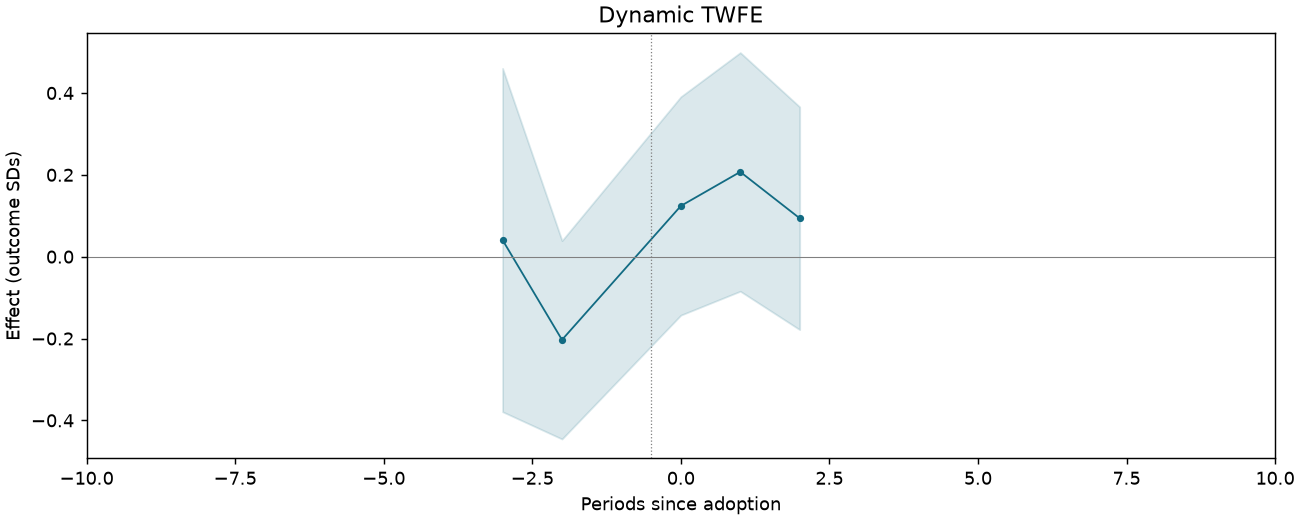
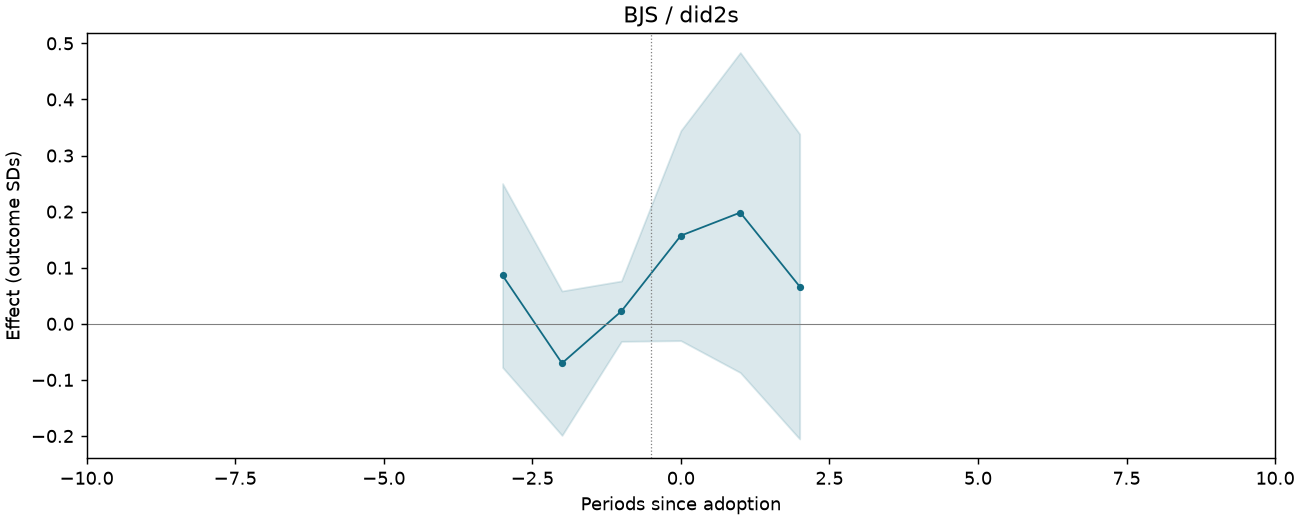
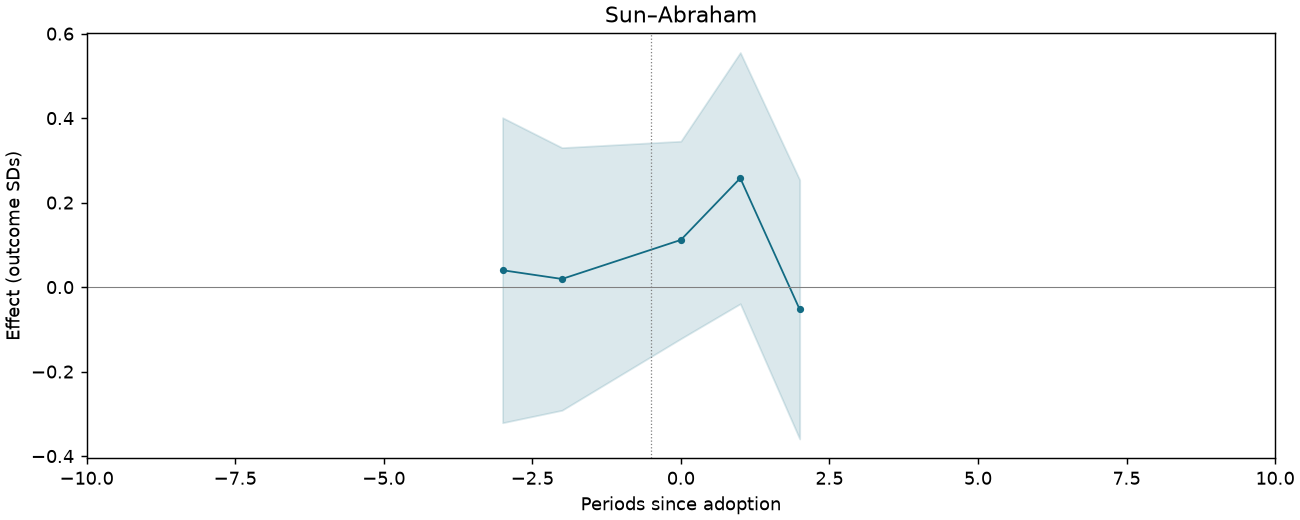
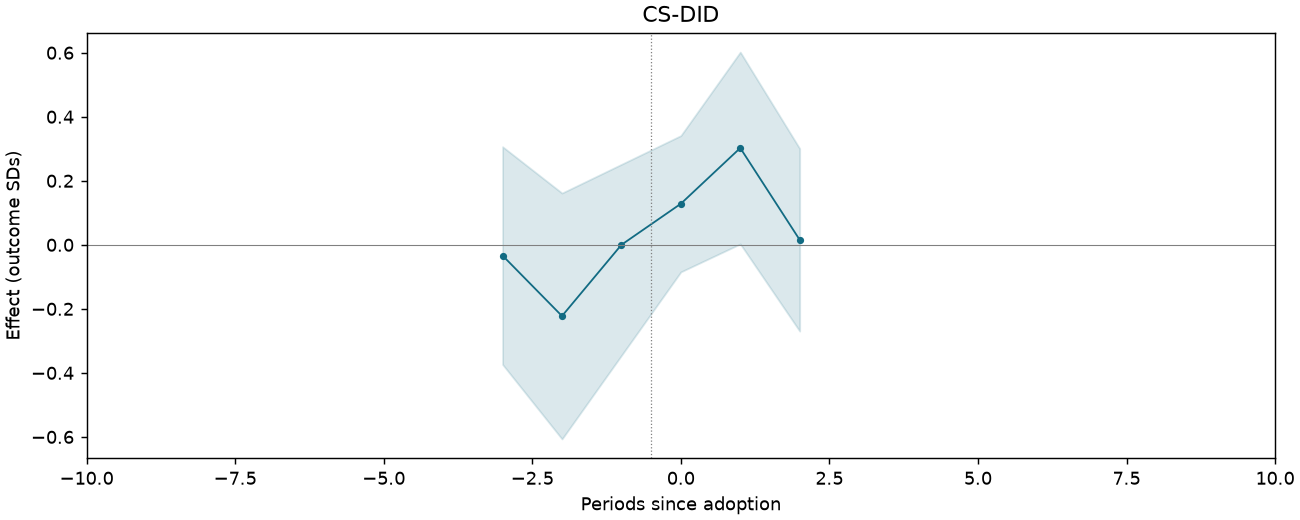
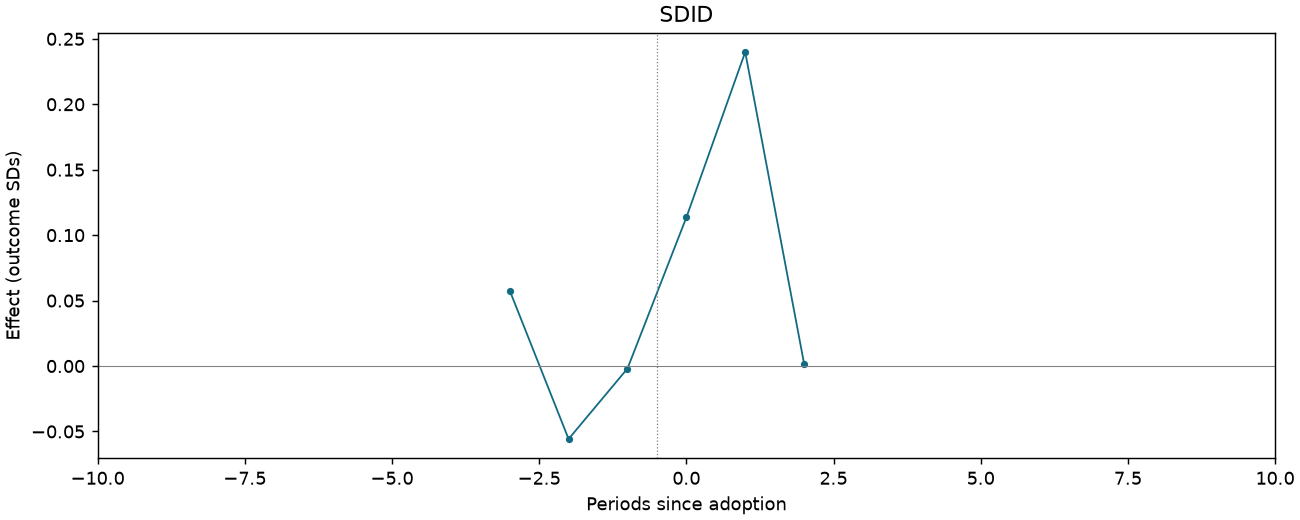
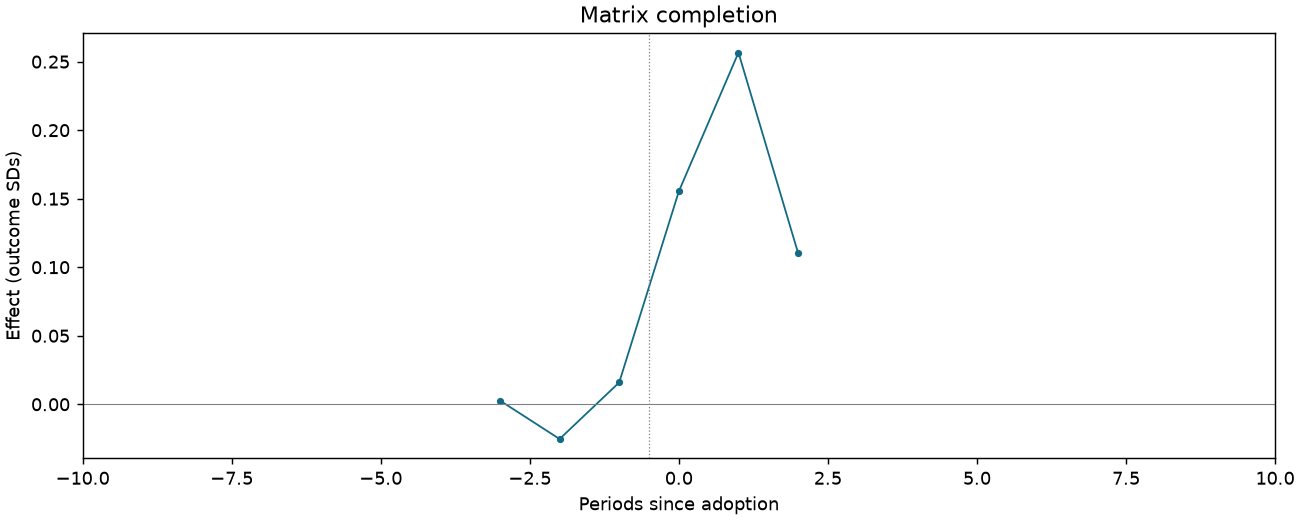
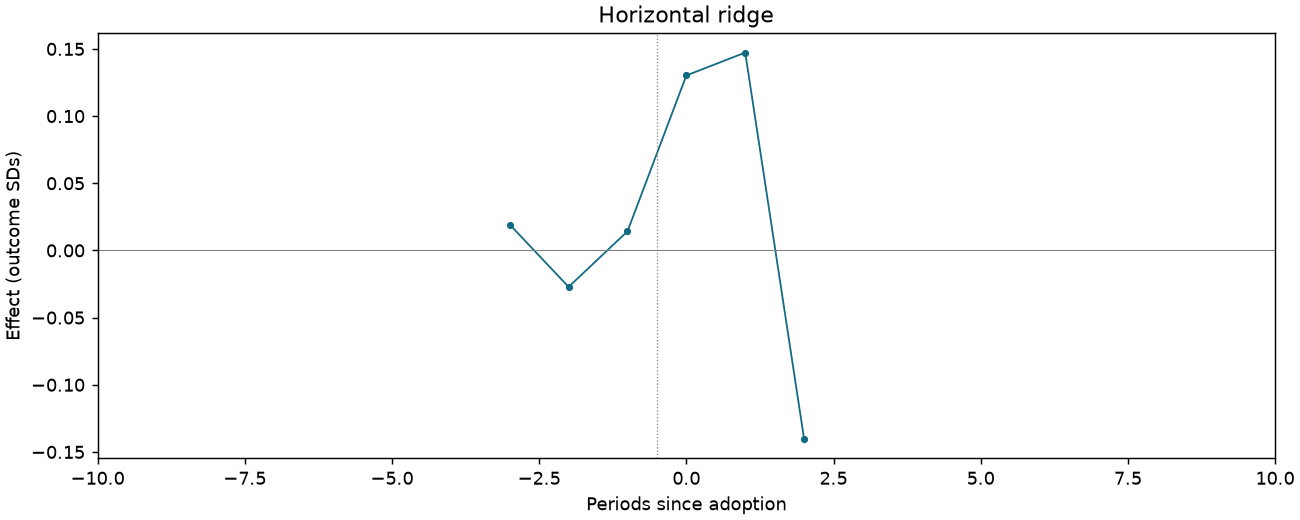
Political behavior z-score index [Table 3 original scale]
1,065 observations · 19 units · 19 clusters · 13 treated / 6 control units.
Estimate comparison
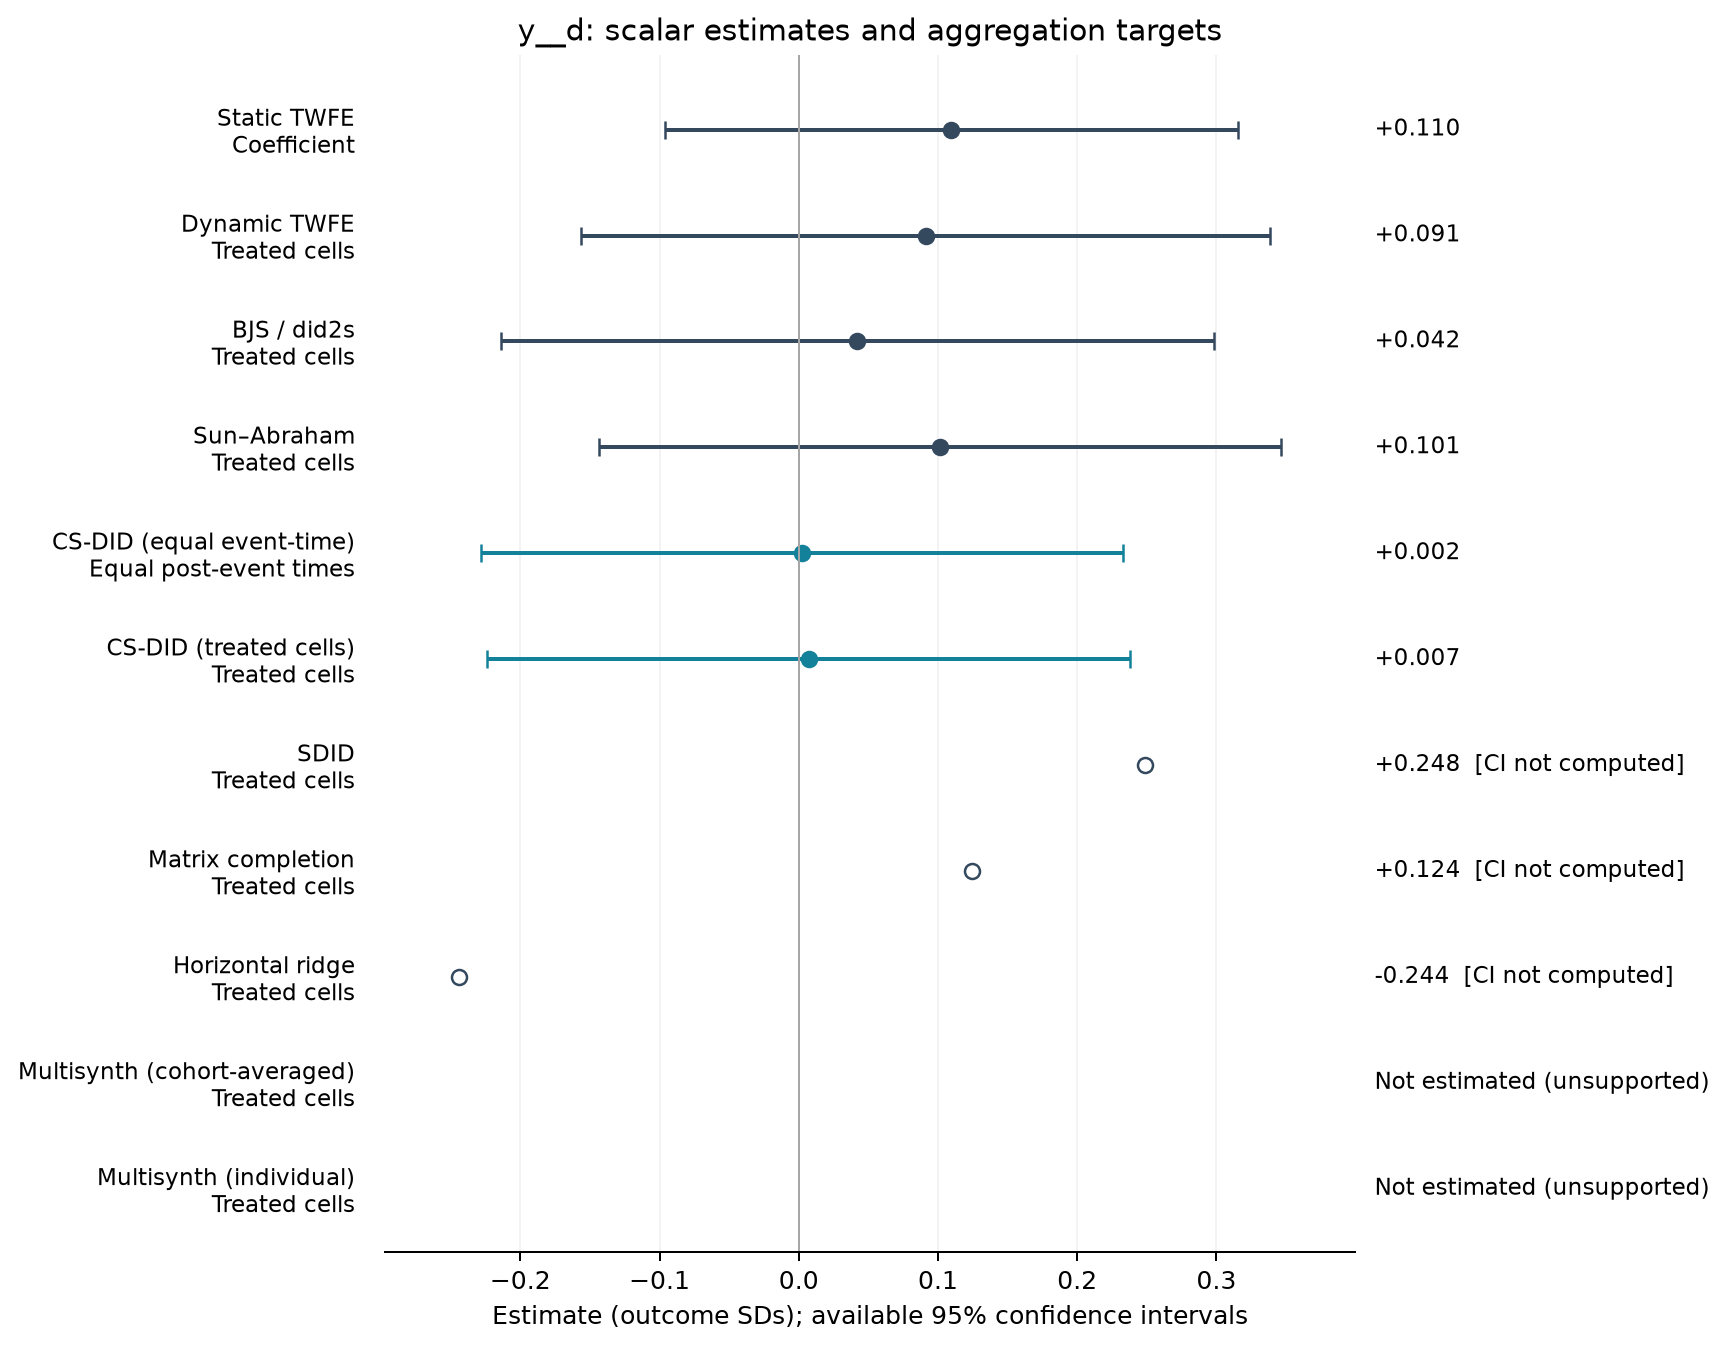
| Estimator | Estimate (SDs) | SE | 95% CI | Averaging |
|---|---|---|---|---|
| Static TWFE | 0.110 | 0.098 | [-0.096, 0.315] | Coefficient |
| Dynamic TWFE | 0.091 | 0.118 | [-0.156, 0.338] | Treated cells |
| BJS / did2s | 0.042 | 0.122 | [-0.214, 0.298] | Treated cells |
| Sun–Abraham | 0.101 | 0.117 | [-0.144, 0.347] | Treated cells |
| CS-DID (equal event-time) | 0.002 | 0.118 | [-0.228, 0.233] | Equal post-event times |
| CS-DID (treated cells) | 0.007 | 0.118 | [-0.224, 0.238] | Treated cells |
| SDID | 0.248 | — | — | Treated cells |
| Matrix completion | 0.124 | — | — | Treated cells |
| Horizontal ridge | -0.244 | — | — | Treated cells |
Event studies
Periods −10 to +10; pointwise 95% intervals where available.
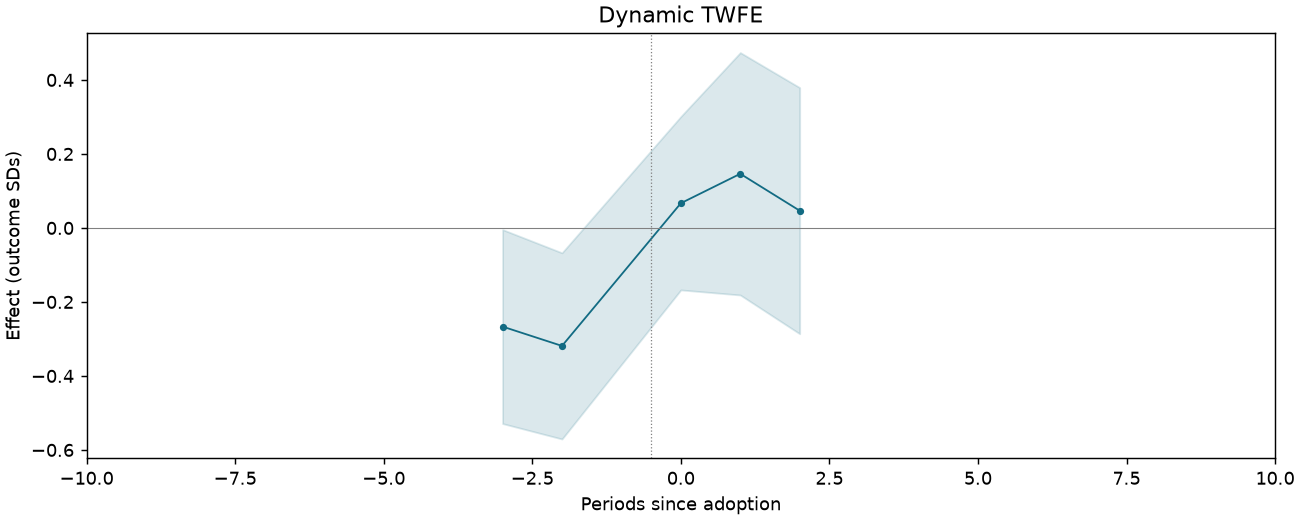
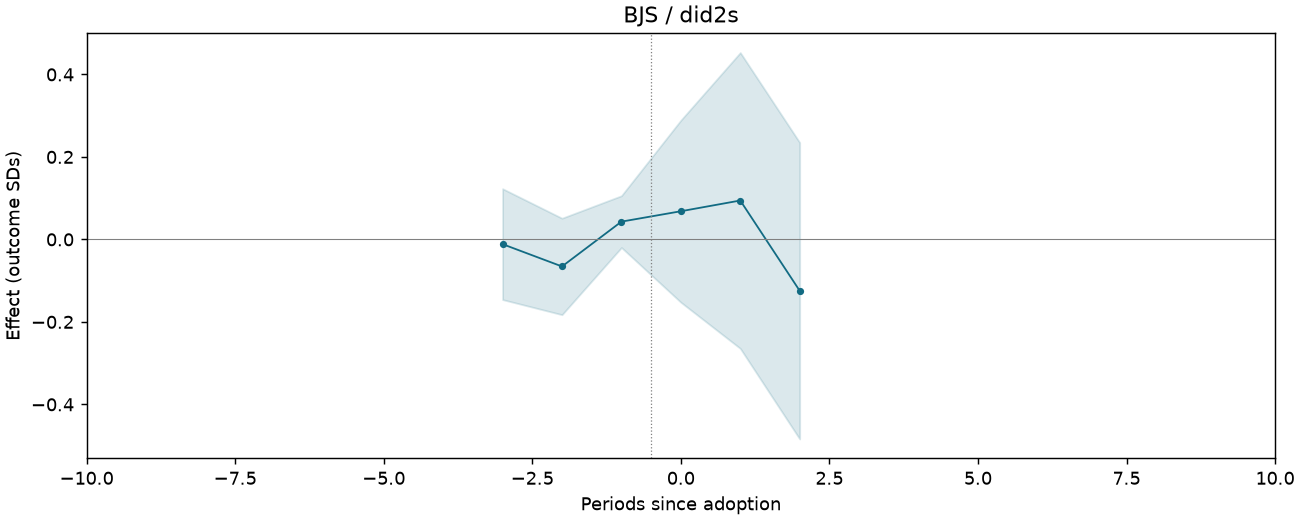
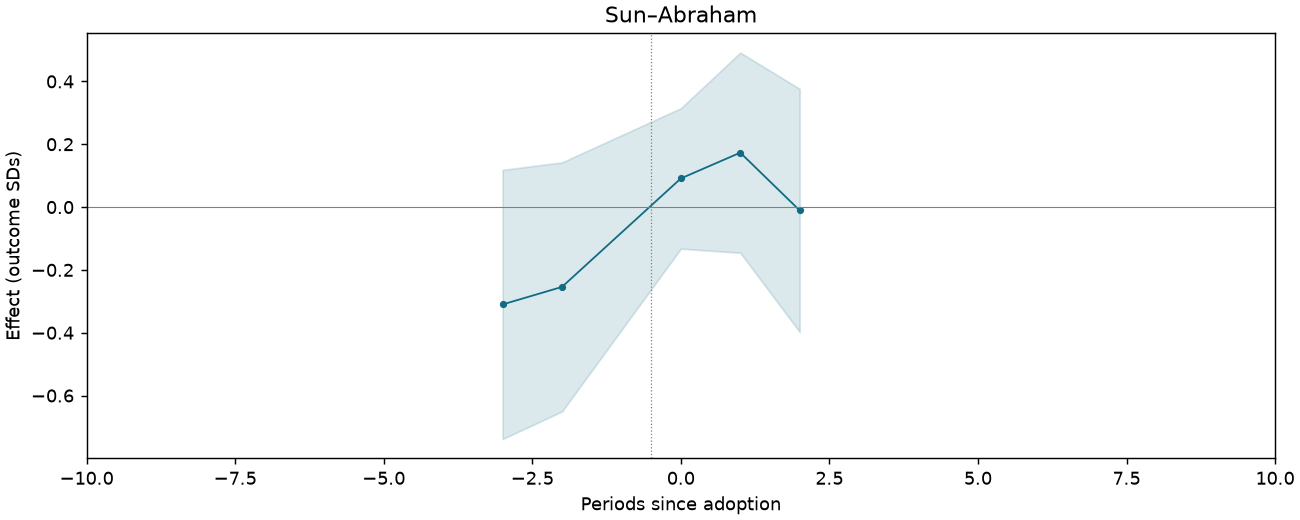
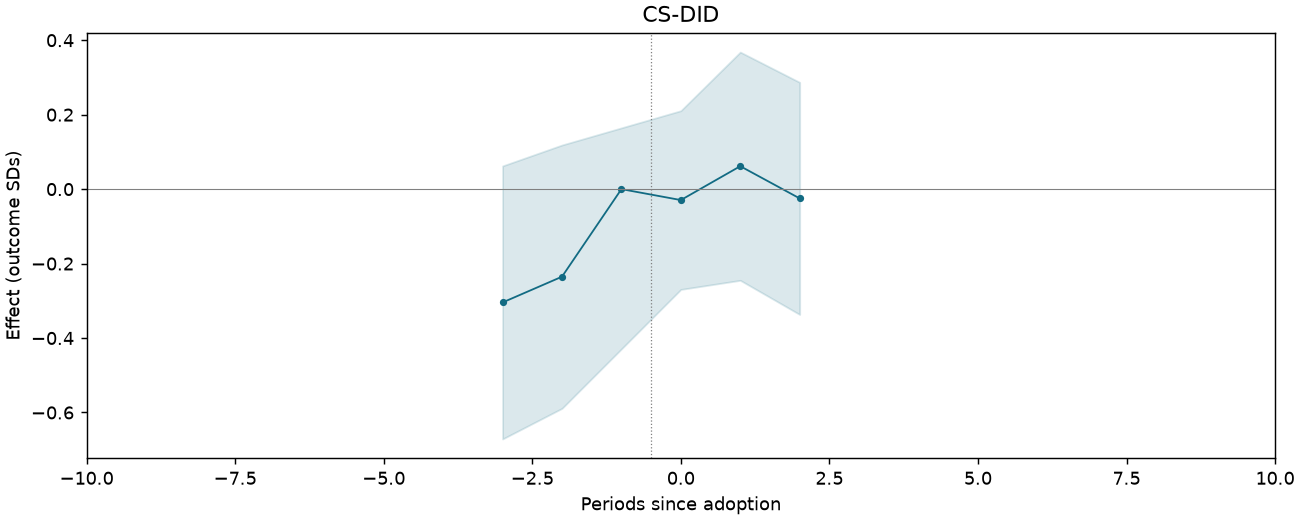
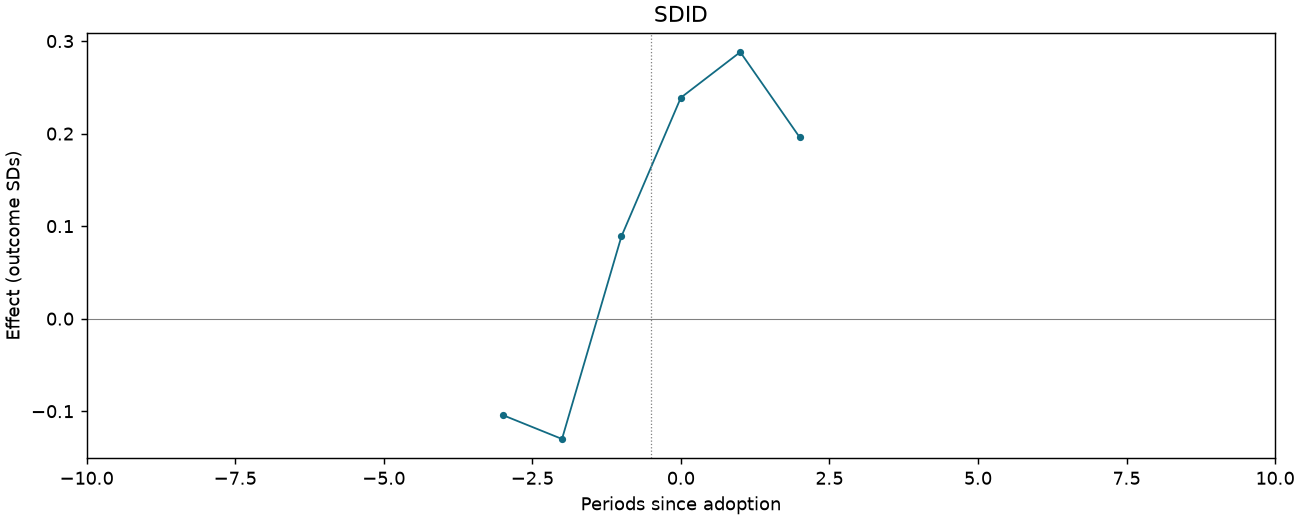
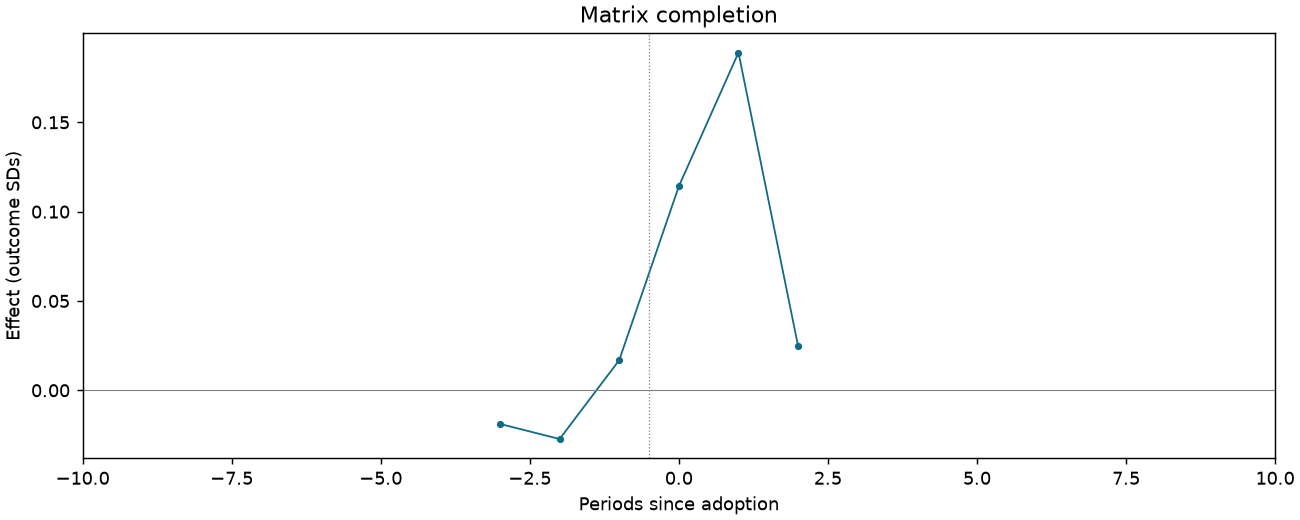
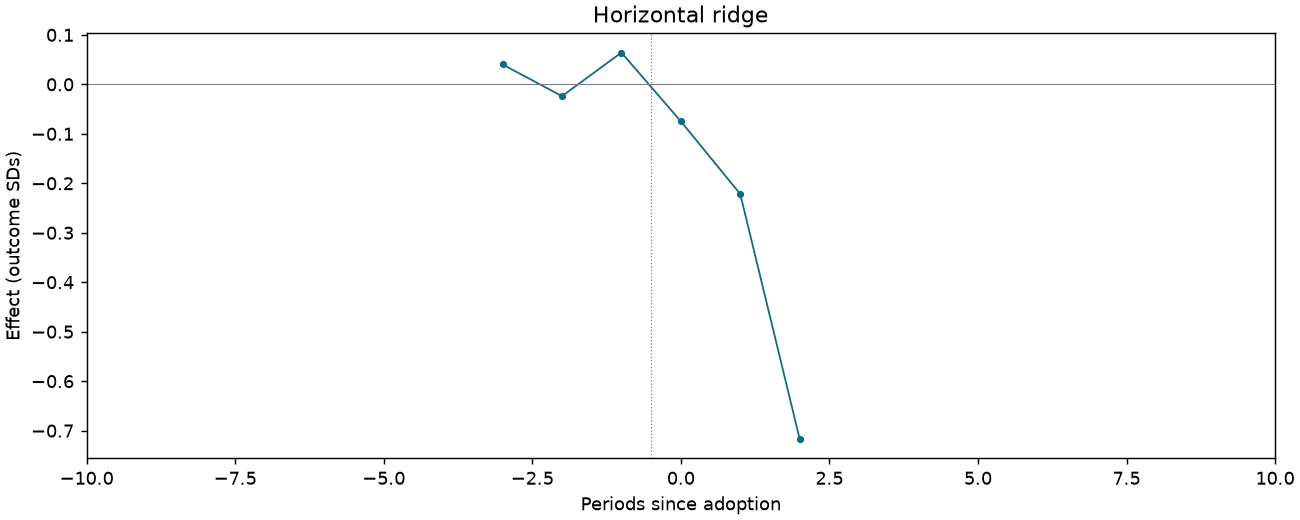
Not invested in stocks [Table 3 original scale]
1,065 observations · 19 units · 19 clusters · 13 treated / 6 control units.
Estimate comparison
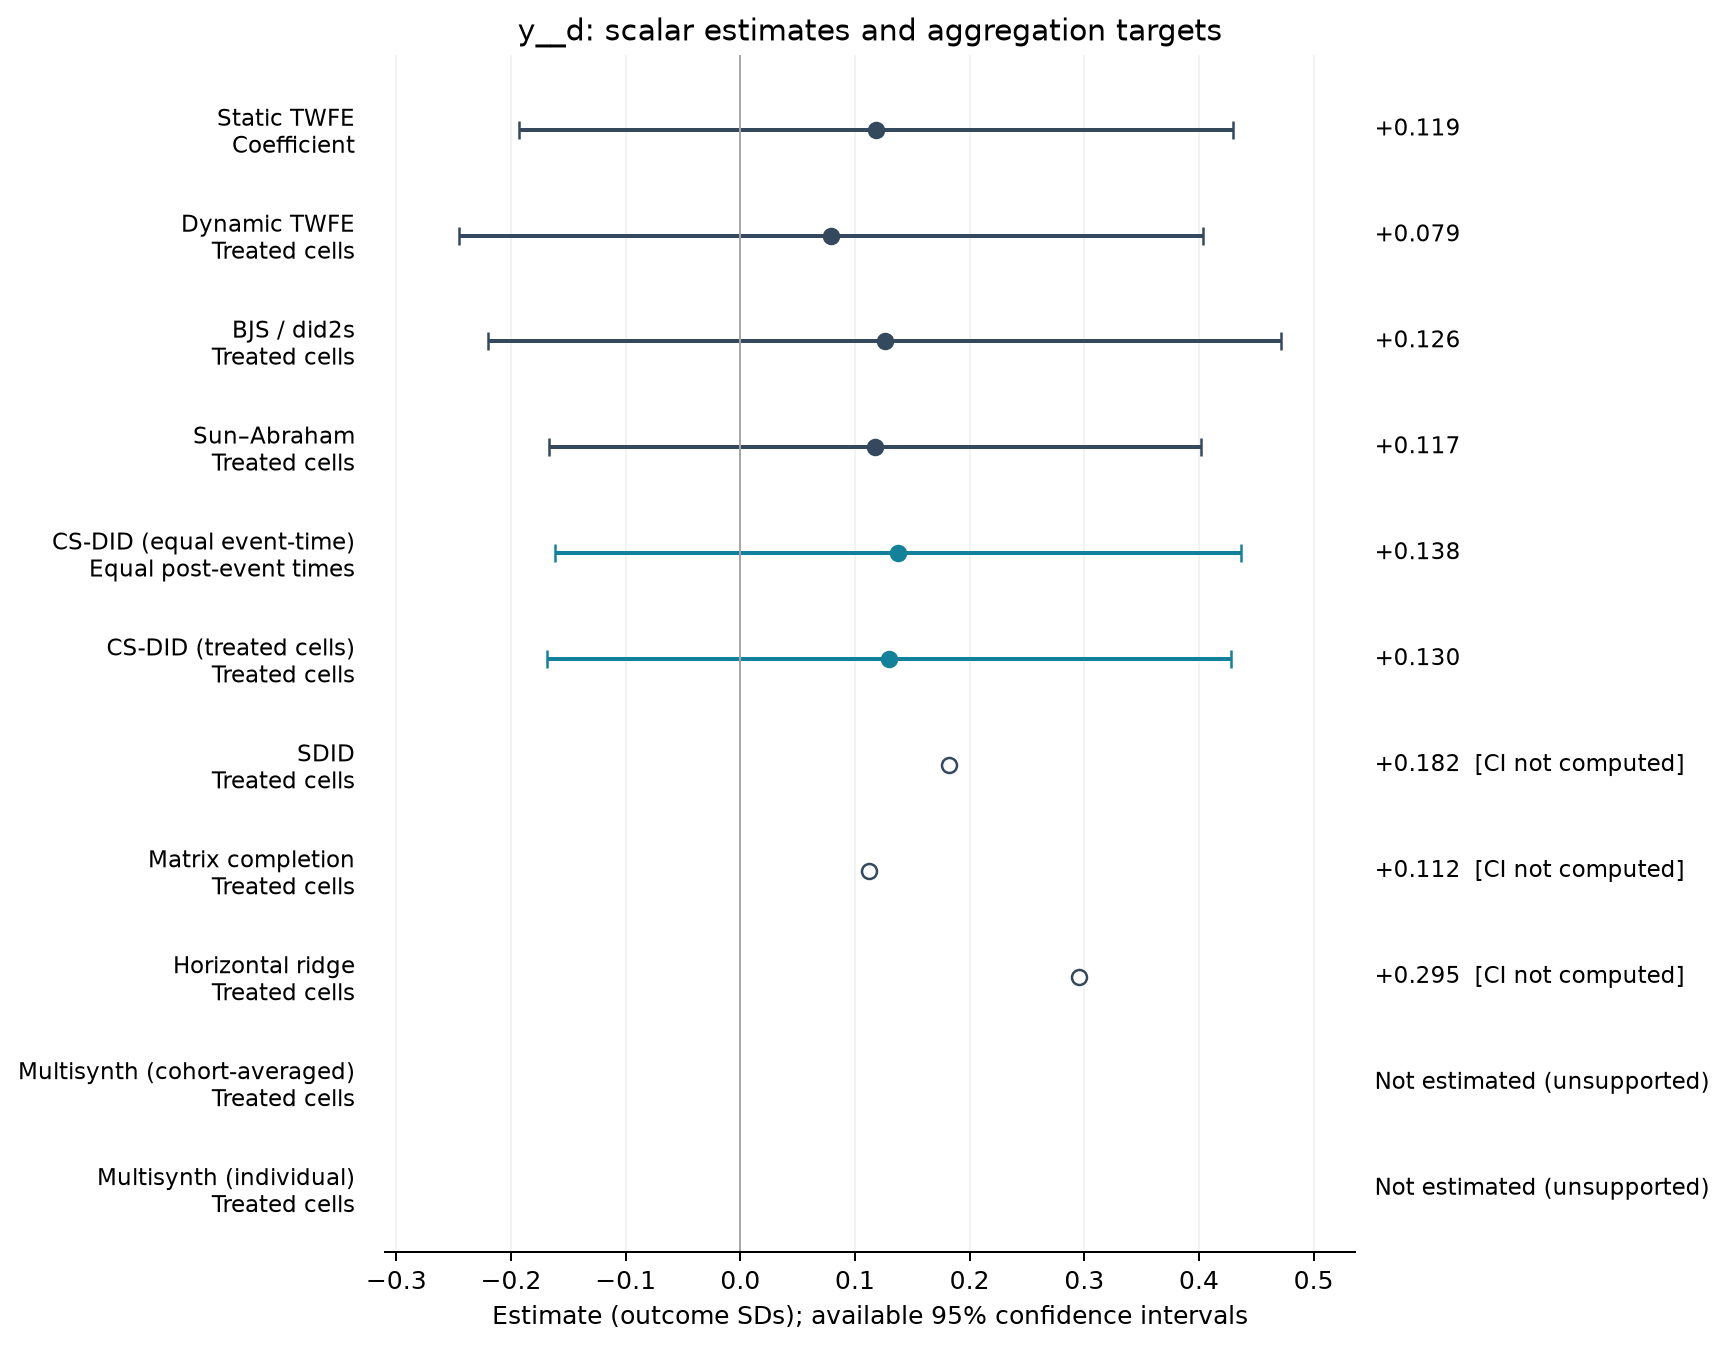
| Estimator | Estimate (SDs) | SE | 95% CI | Averaging |
|---|---|---|---|---|
| Static TWFE | 0.119 | 0.148 | [-0.193, 0.430] | Coefficient |
| Dynamic TWFE | 0.079 | 0.154 | [-0.245, 0.404] | Treated cells |
| BJS / did2s | 0.126 | 0.165 | [-0.220, 0.472] | Treated cells |
| Sun–Abraham | 0.117 | 0.135 | [-0.167, 0.402] | Treated cells |
| CS-DID (equal event-time) | 0.138 | 0.153 | [-0.162, 0.437] | Equal post-event times |
| CS-DID (treated cells) | 0.130 | 0.152 | [-0.169, 0.428] | Treated cells |
| SDID | 0.182 | — | — | Treated cells |
| Matrix completion | 0.112 | — | — | Treated cells |
| Horizontal ridge | 0.295 | — | — | Treated cells |
Event studies
Periods −10 to +10; pointwise 95% intervals where available.
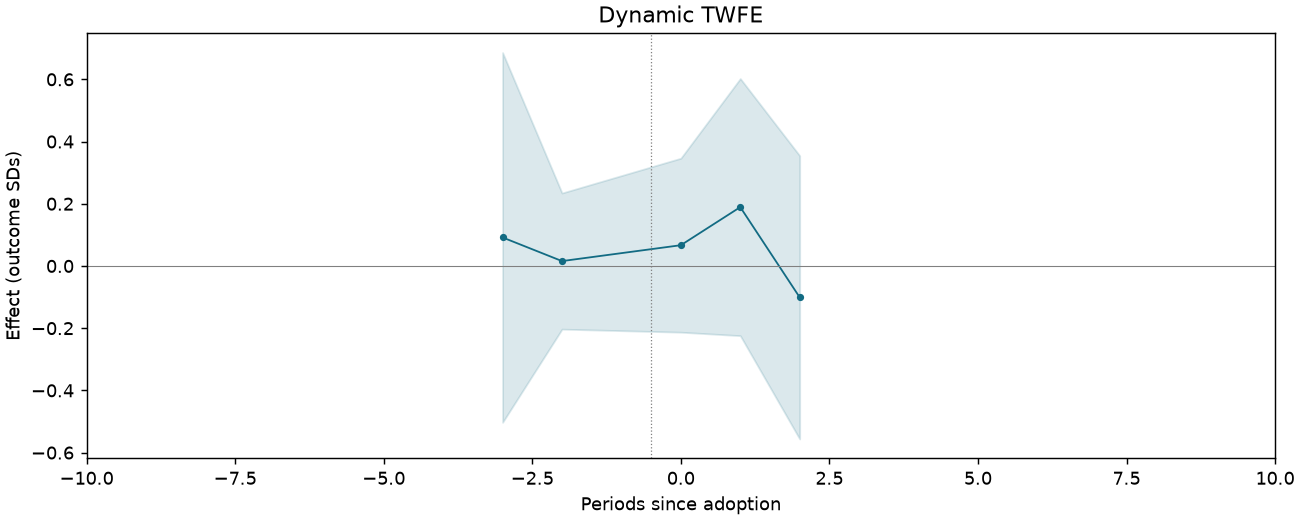
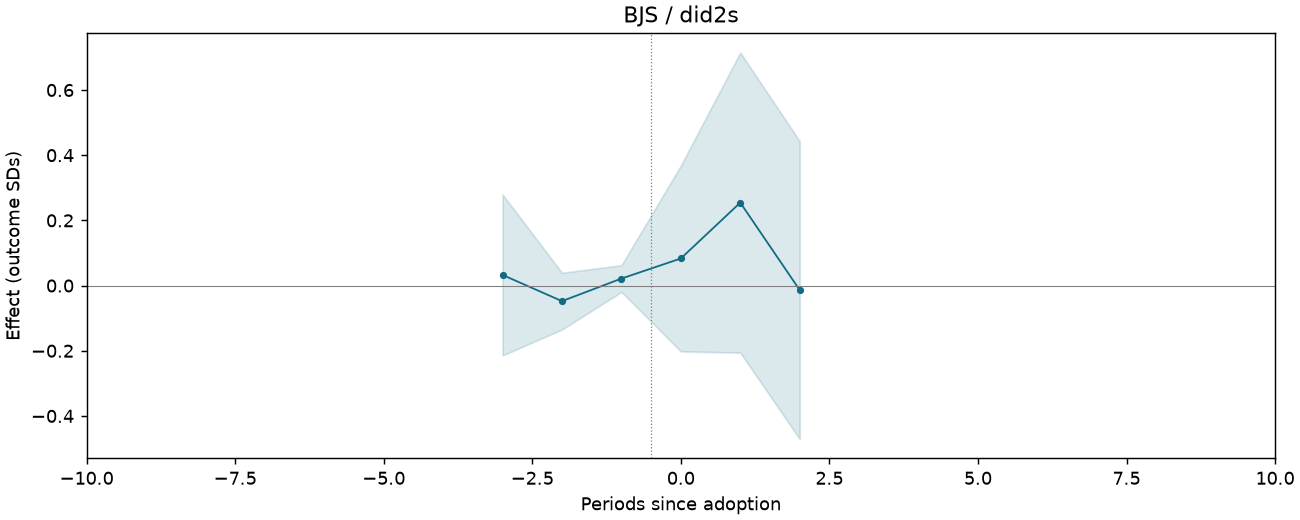
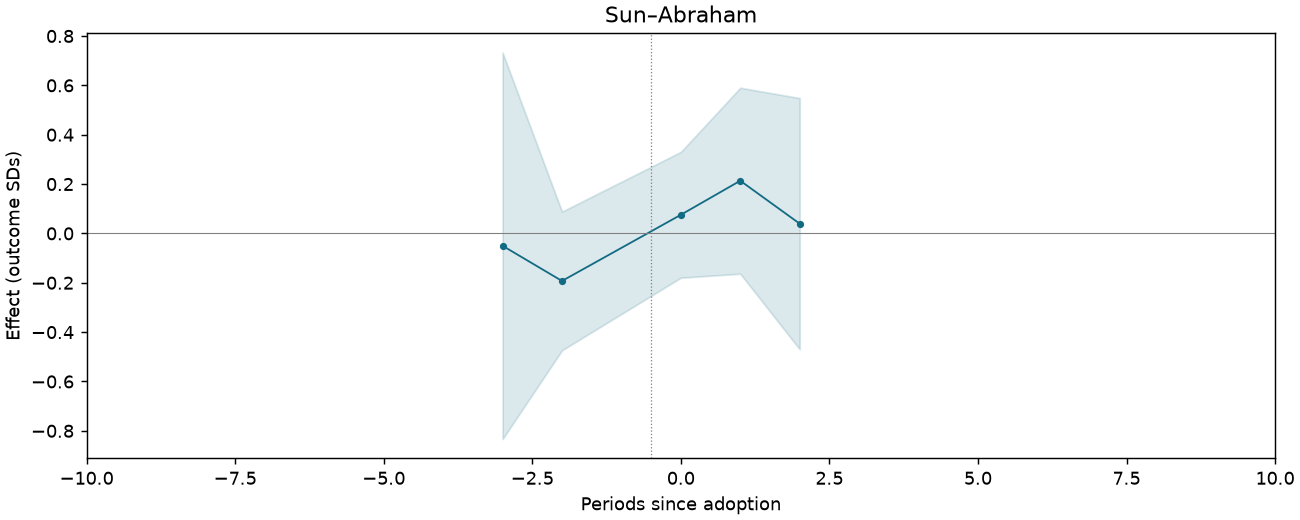
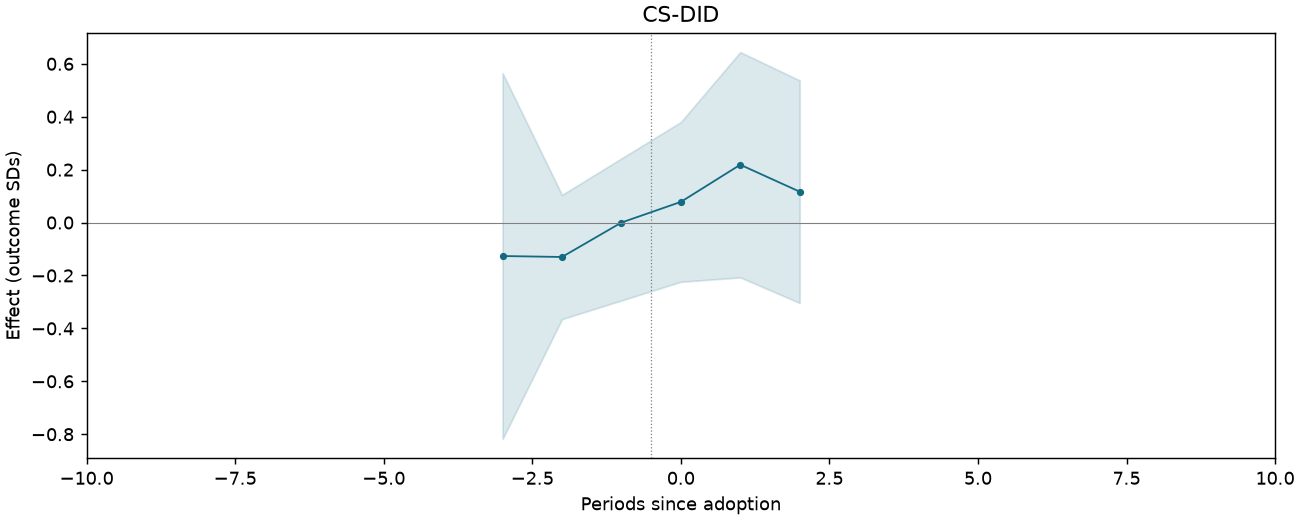
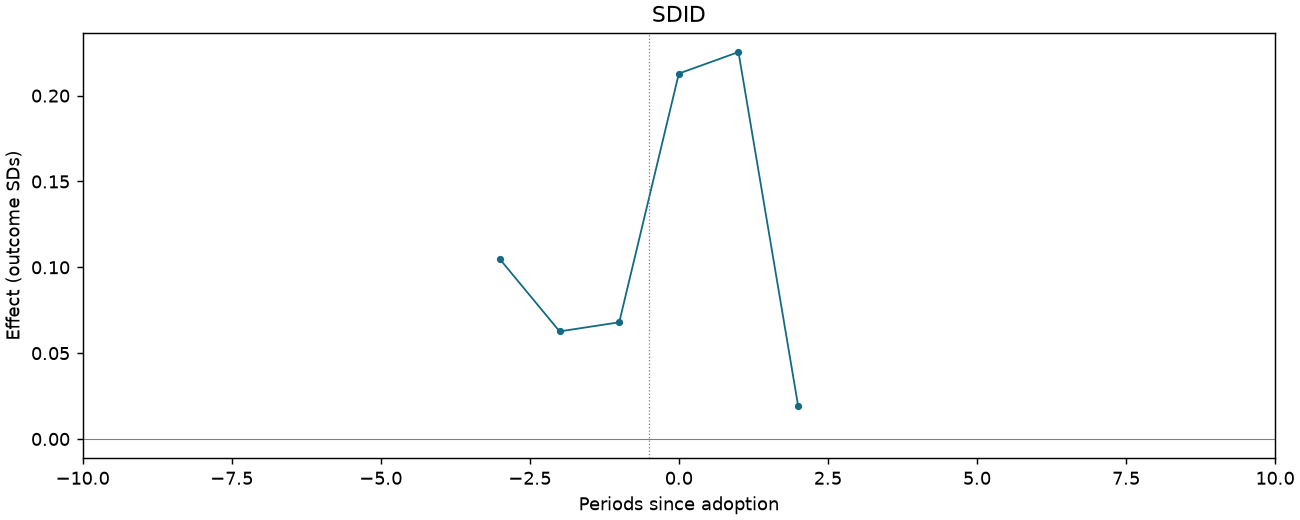
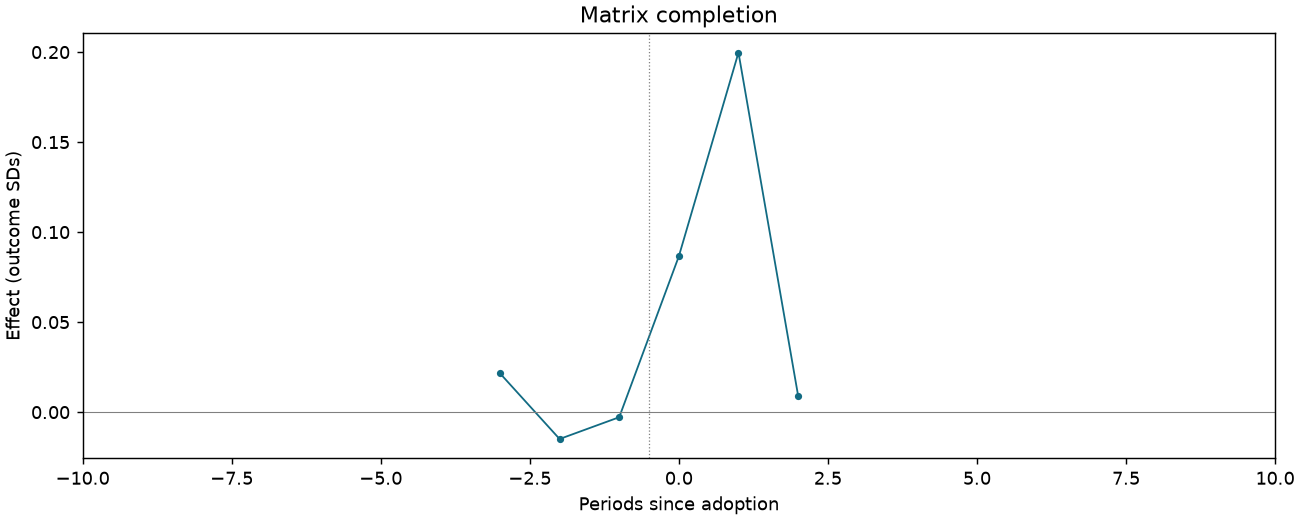
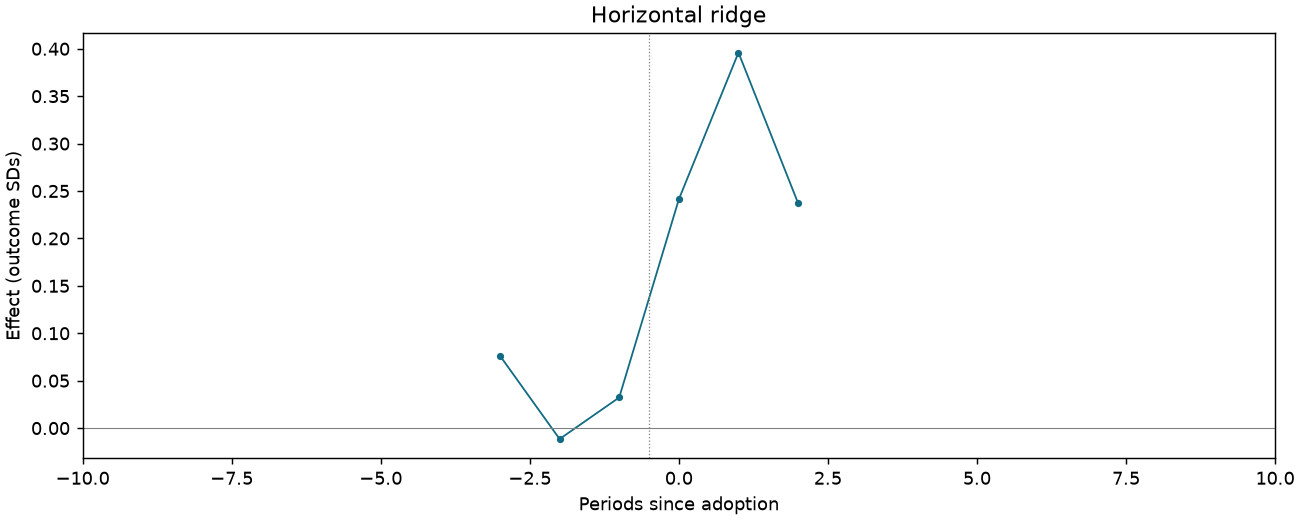
Not invested in bonds [Table 3 original scale]
1,065 observations · 19 units · 19 clusters · 13 treated / 6 control units.
Estimate comparison
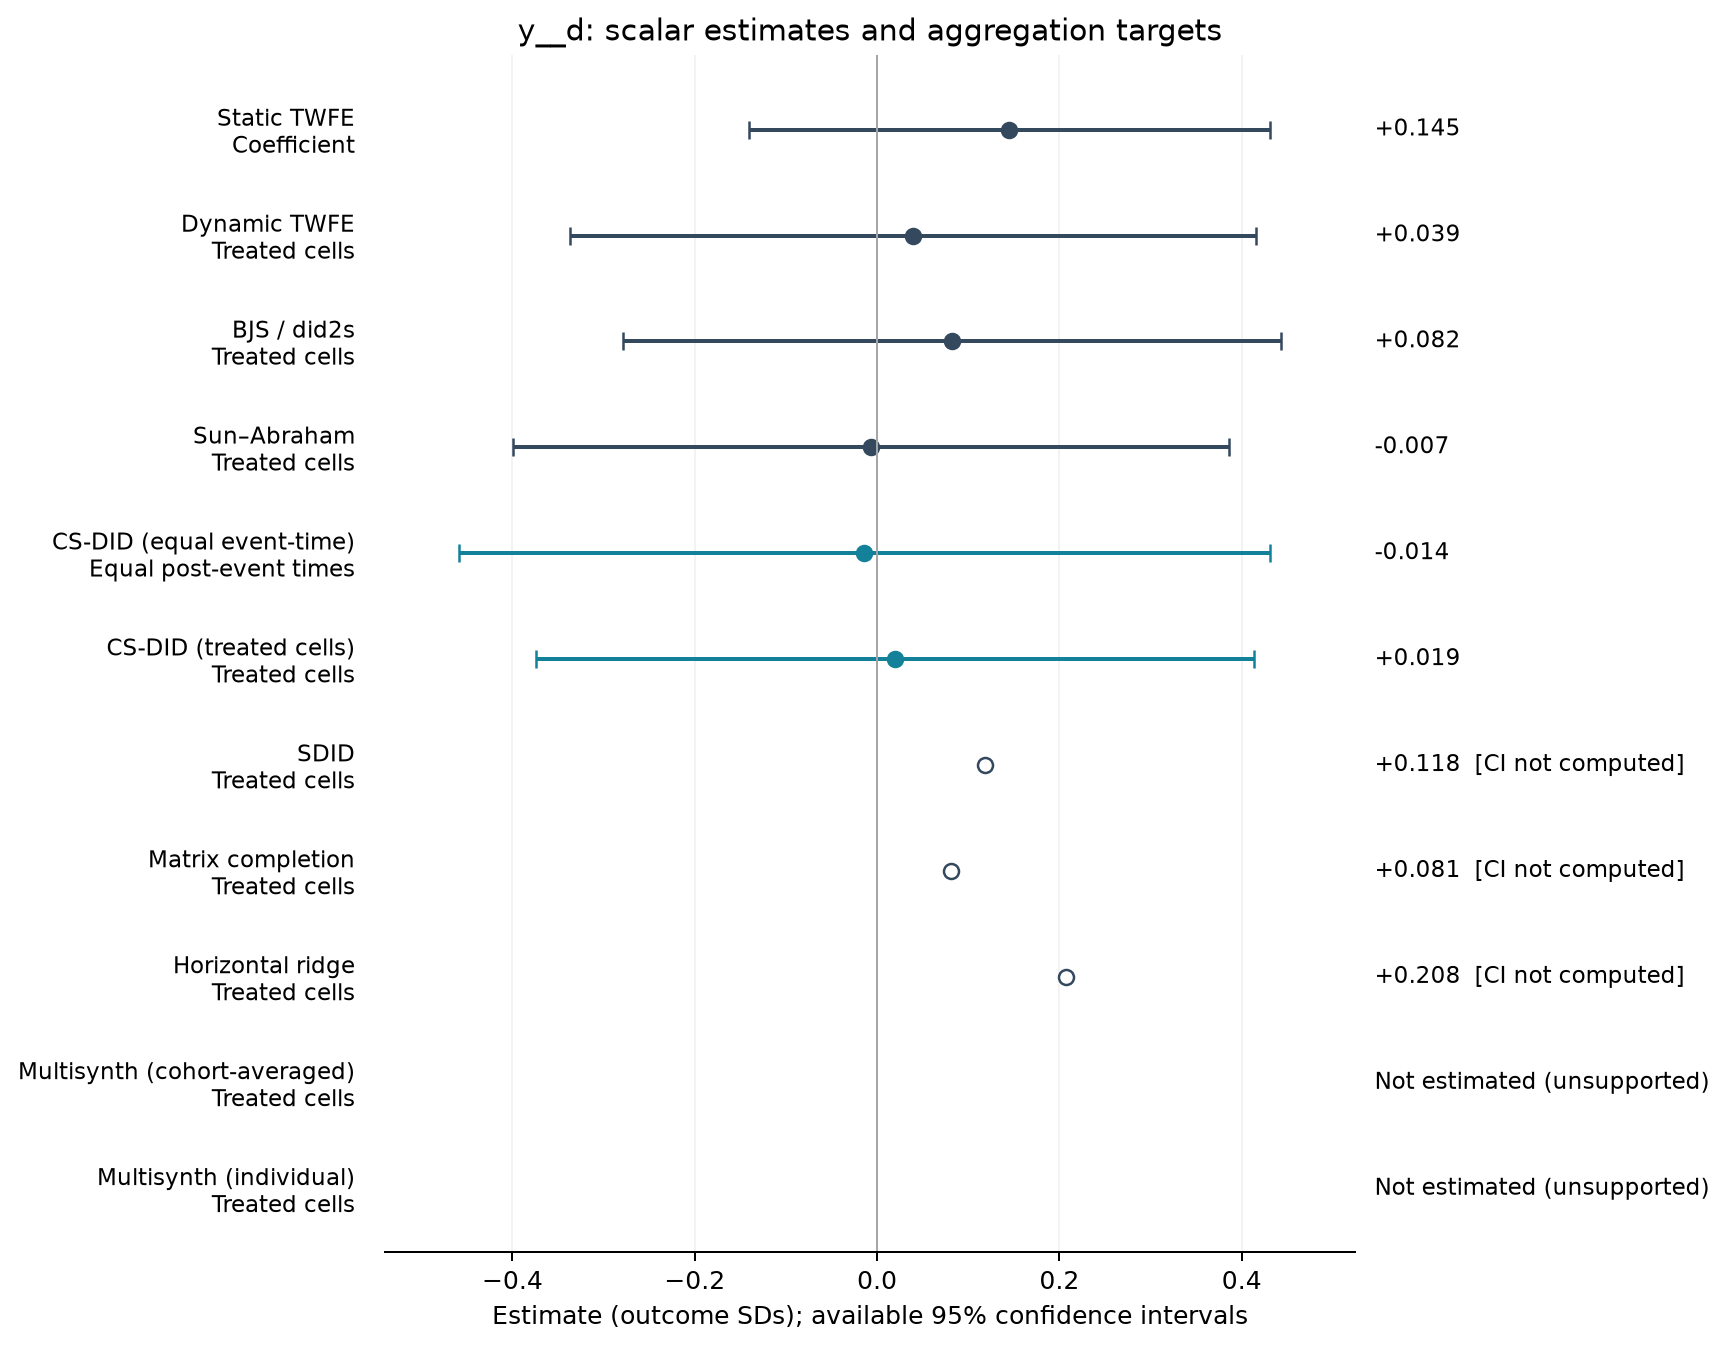
| Estimator | Estimate (SDs) | SE | 95% CI | Averaging |
|---|---|---|---|---|
| Static TWFE | 0.145 | 0.136 | [-0.141, 0.431] | Coefficient |
| Dynamic TWFE | 0.039 | 0.179 | [-0.337, 0.415] | Treated cells |
| BJS / did2s | 0.082 | 0.172 | [-0.278, 0.443] | Treated cells |
| Sun–Abraham | -0.007 | 0.187 | [-0.399, 0.386] | Treated cells |
| CS-DID (equal event-time) | -0.014 | 0.227 | [-0.459, 0.431] | Equal post-event times |
| CS-DID (treated cells) | 0.019 | 0.201 | [-0.374, 0.413] | Treated cells |
| SDID | 0.118 | — | — | Treated cells |
| Matrix completion | 0.081 | — | — | Treated cells |
| Horizontal ridge | 0.208 | — | — | Treated cells |
Event studies
Periods −10 to +10; pointwise 95% intervals where available.
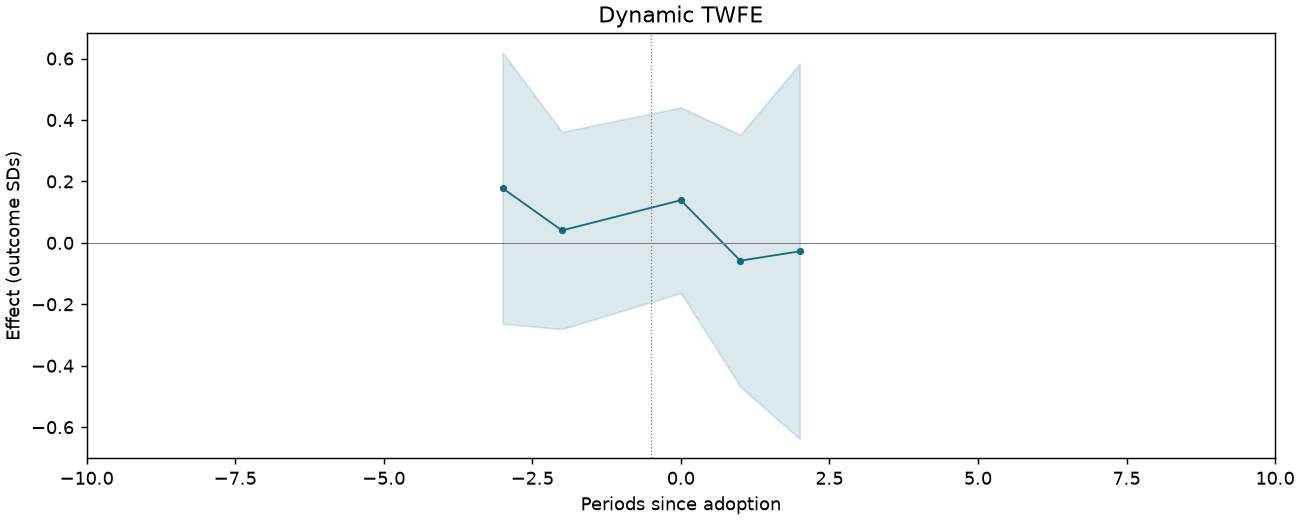
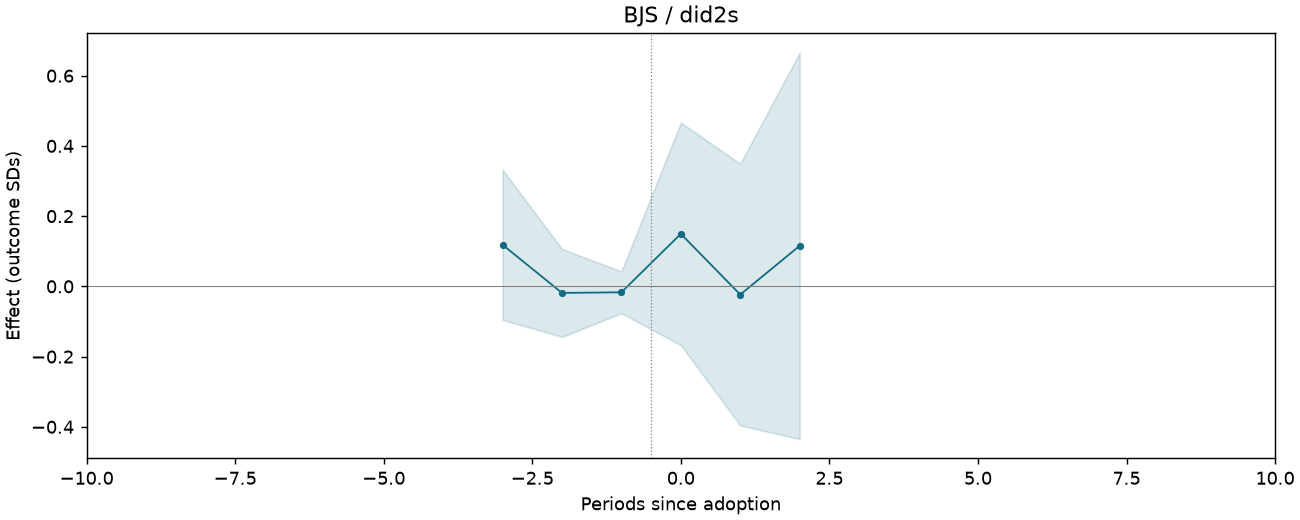
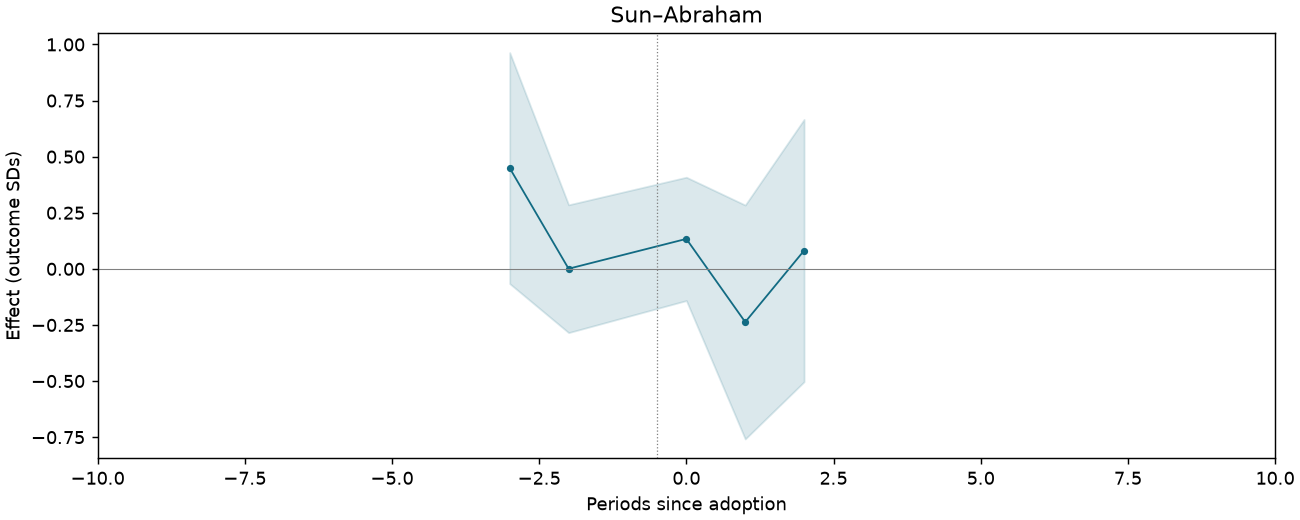
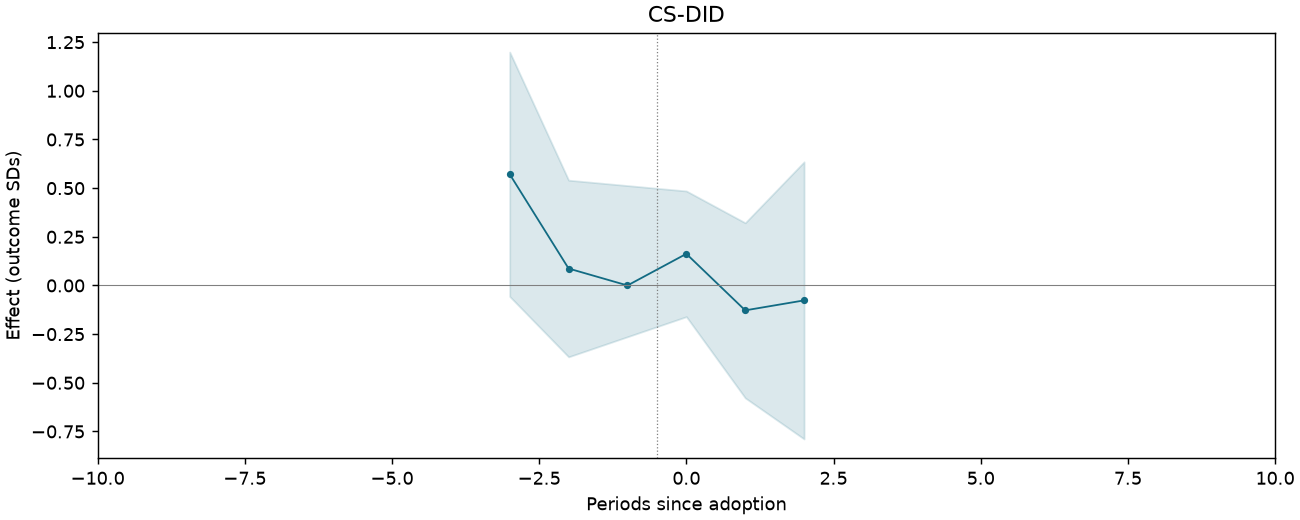
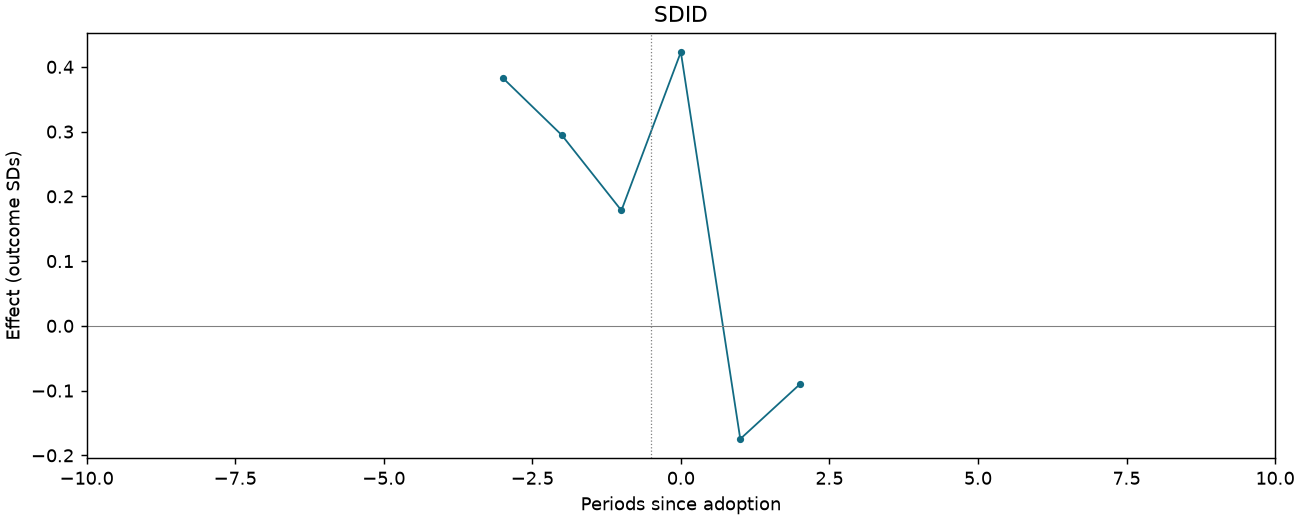
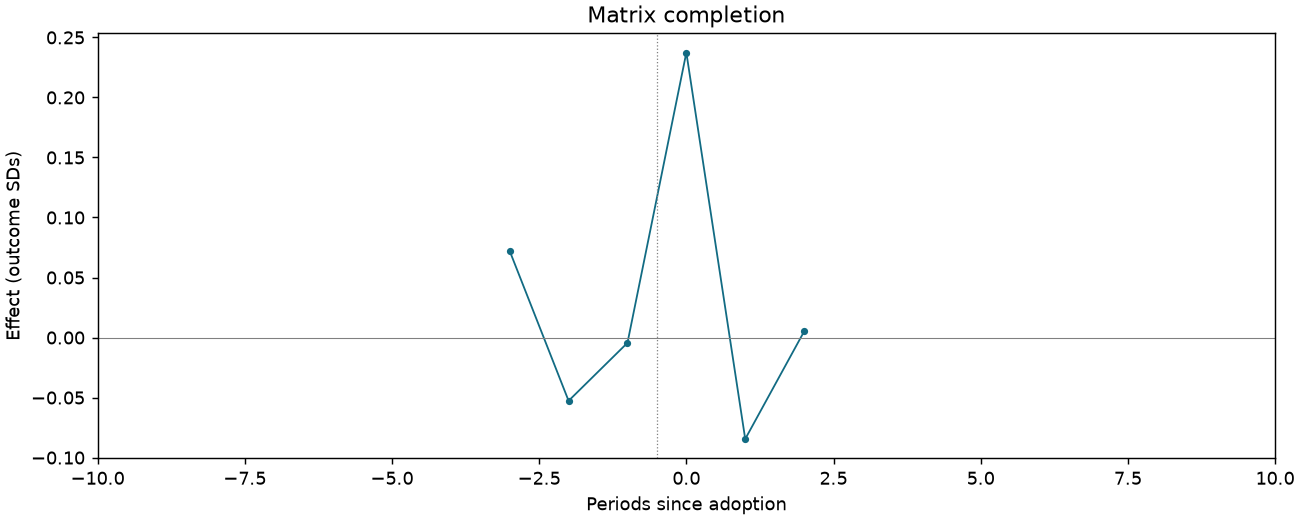
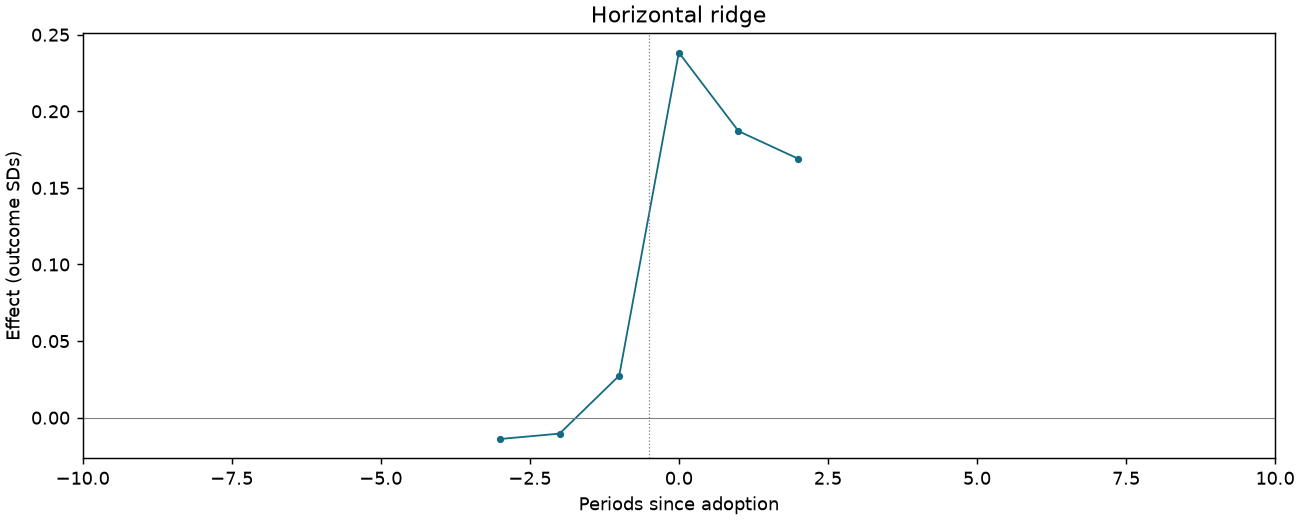
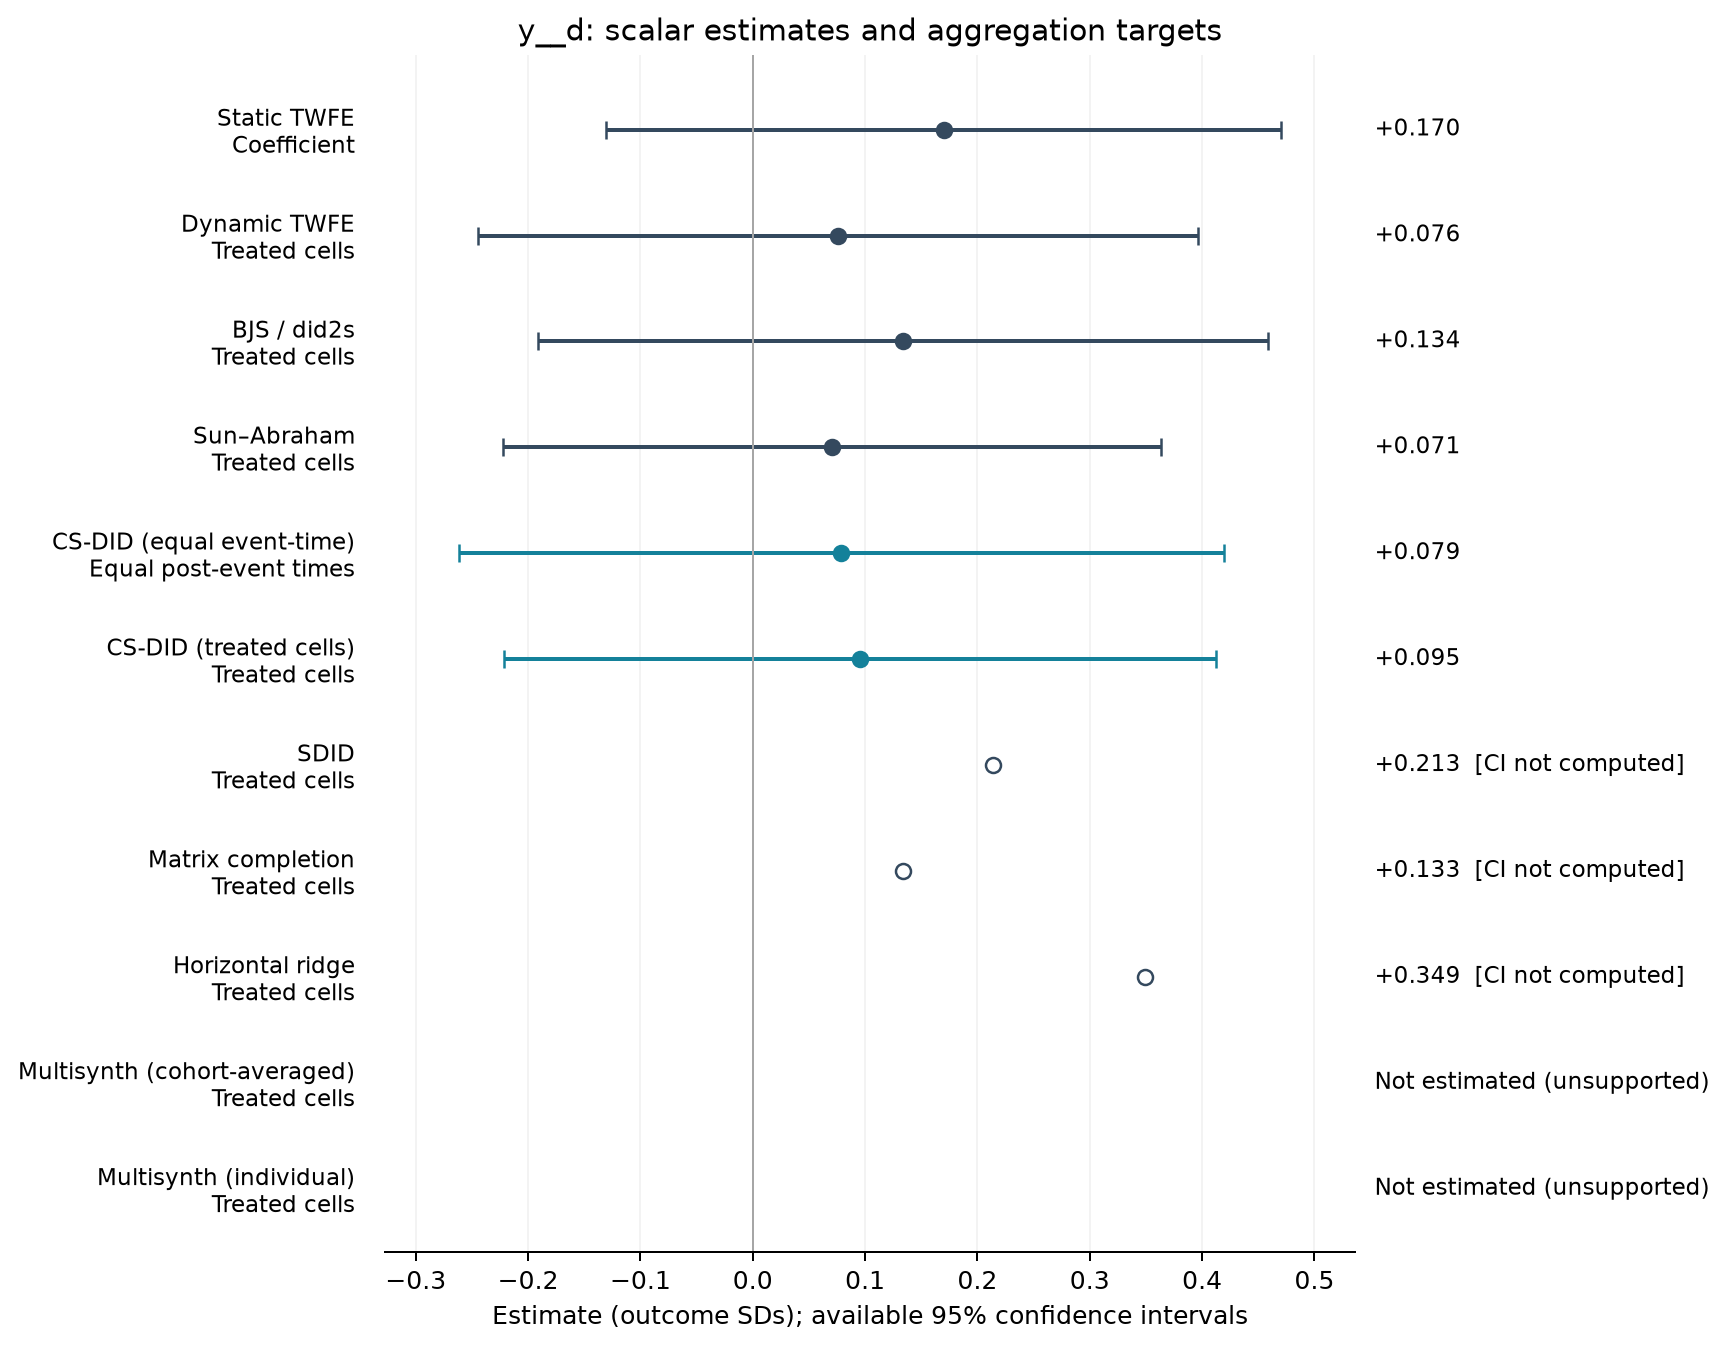
Avoiding risky investment z-score index [Table 3 original scale]
1,065 observations · 19 units · 19 clusters · 13 treated / 6 control units.
Estimate comparison
| Estimator | Estimate (SDs) | SE | 95% CI | Averaging |
|---|---|---|---|---|
| Static TWFE | 0.170 | 0.143 | [-0.131, 0.470] | Coefficient |
| Dynamic TWFE | 0.076 | 0.153 | [-0.245, 0.396] | Treated cells |
| BJS / did2s | 0.134 | 0.155 | [-0.191, 0.459] | Treated cells |
| Sun–Abraham | 0.071 | 0.139 | [-0.222, 0.364] | Treated cells |
| CS-DID (equal event-time) | 0.079 | 0.174 | [-0.261, 0.419] | Equal post-event times |
| CS-DID (treated cells) | 0.095 | 0.162 | [-0.221, 0.412] | Treated cells |
| SDID | 0.213 | — | — | Treated cells |
| Matrix completion | 0.133 | — | — | Treated cells |
| Horizontal ridge | 0.349 | — | — | Treated cells |
Event studies
Periods −10 to +10; pointwise 95% intervals where available.
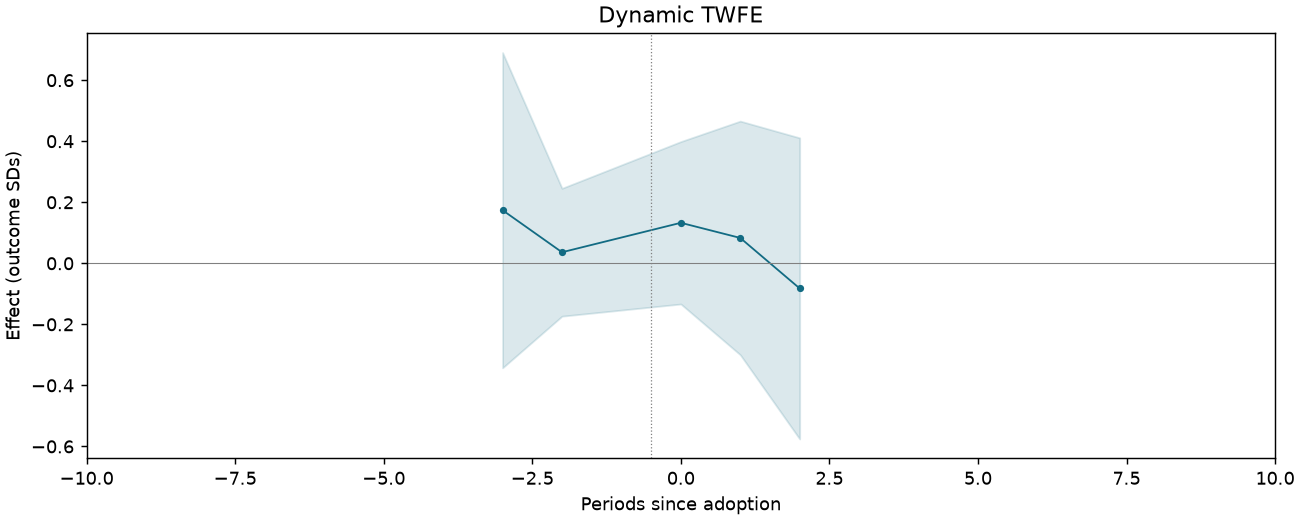
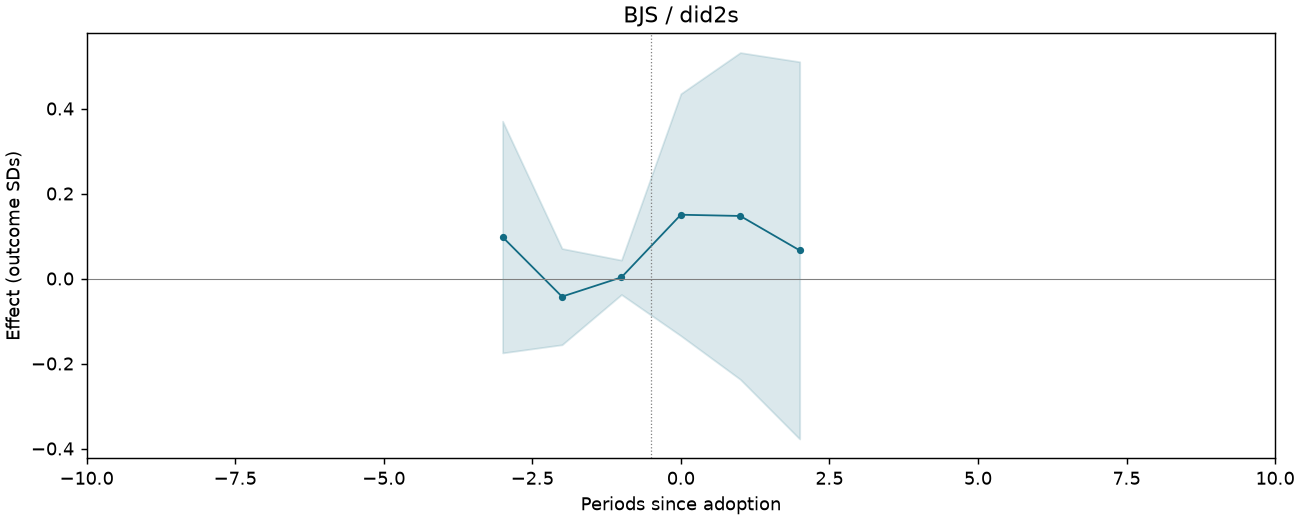
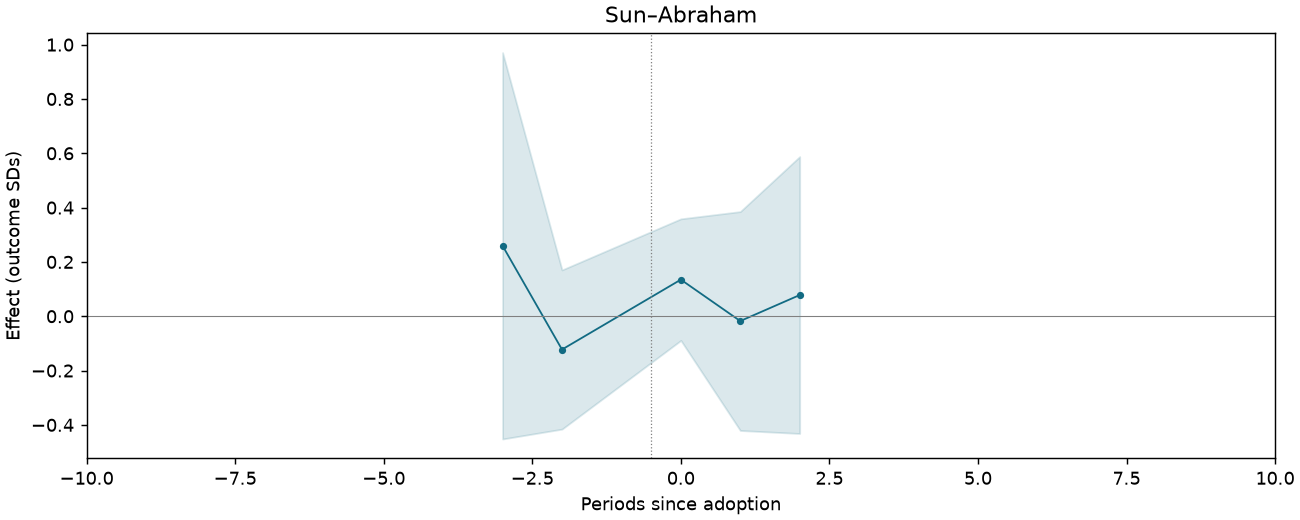
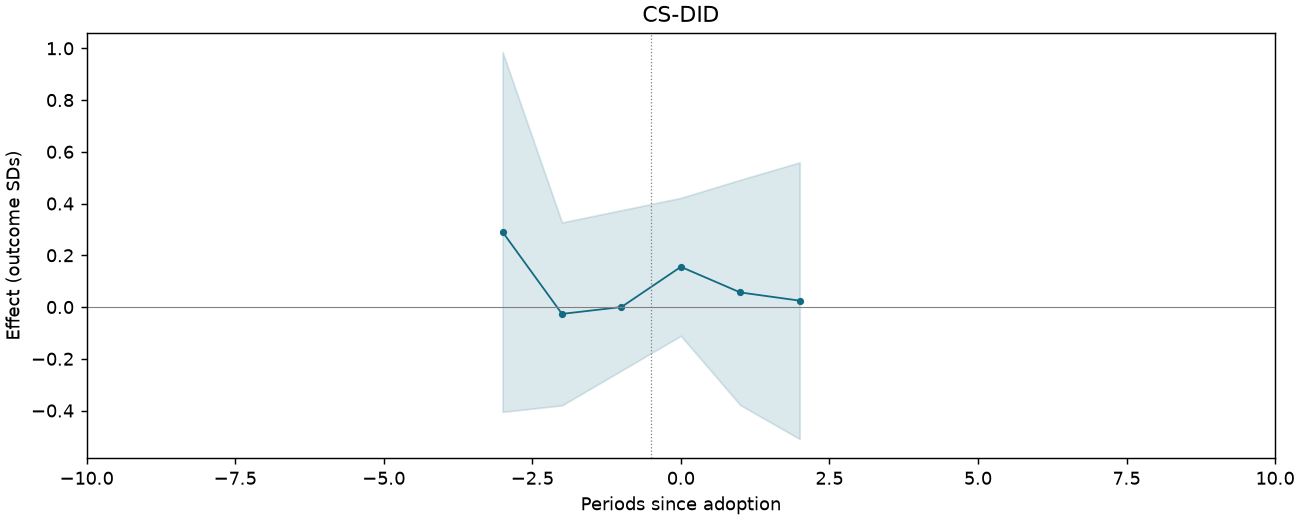
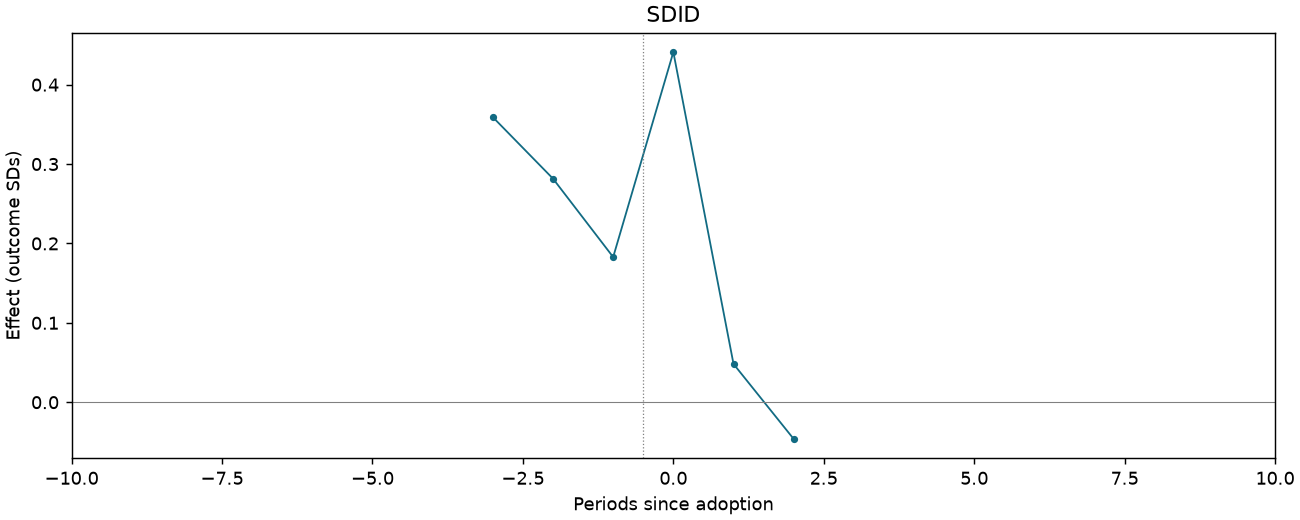
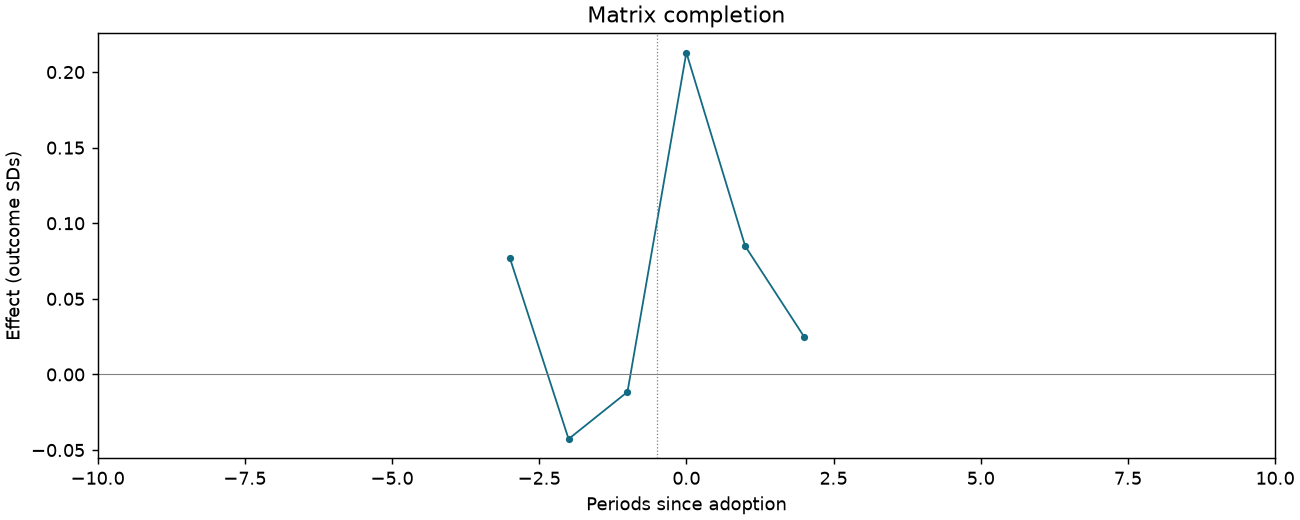
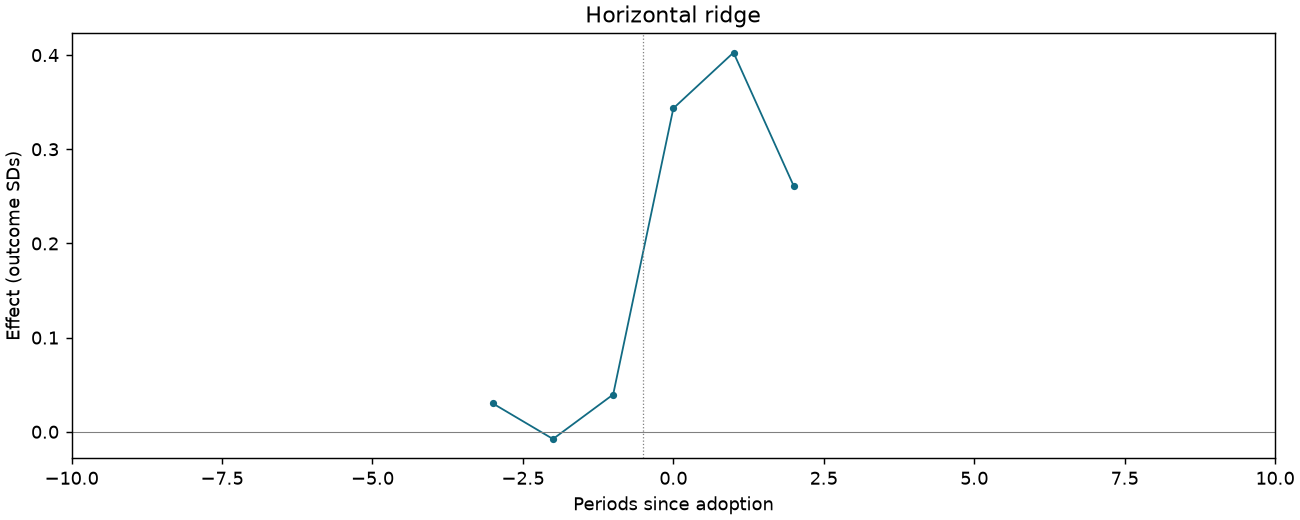
Cooperated with minority [Table 3 original scale]
1,065 observations · 19 units · 19 clusters · 13 treated / 6 control units.
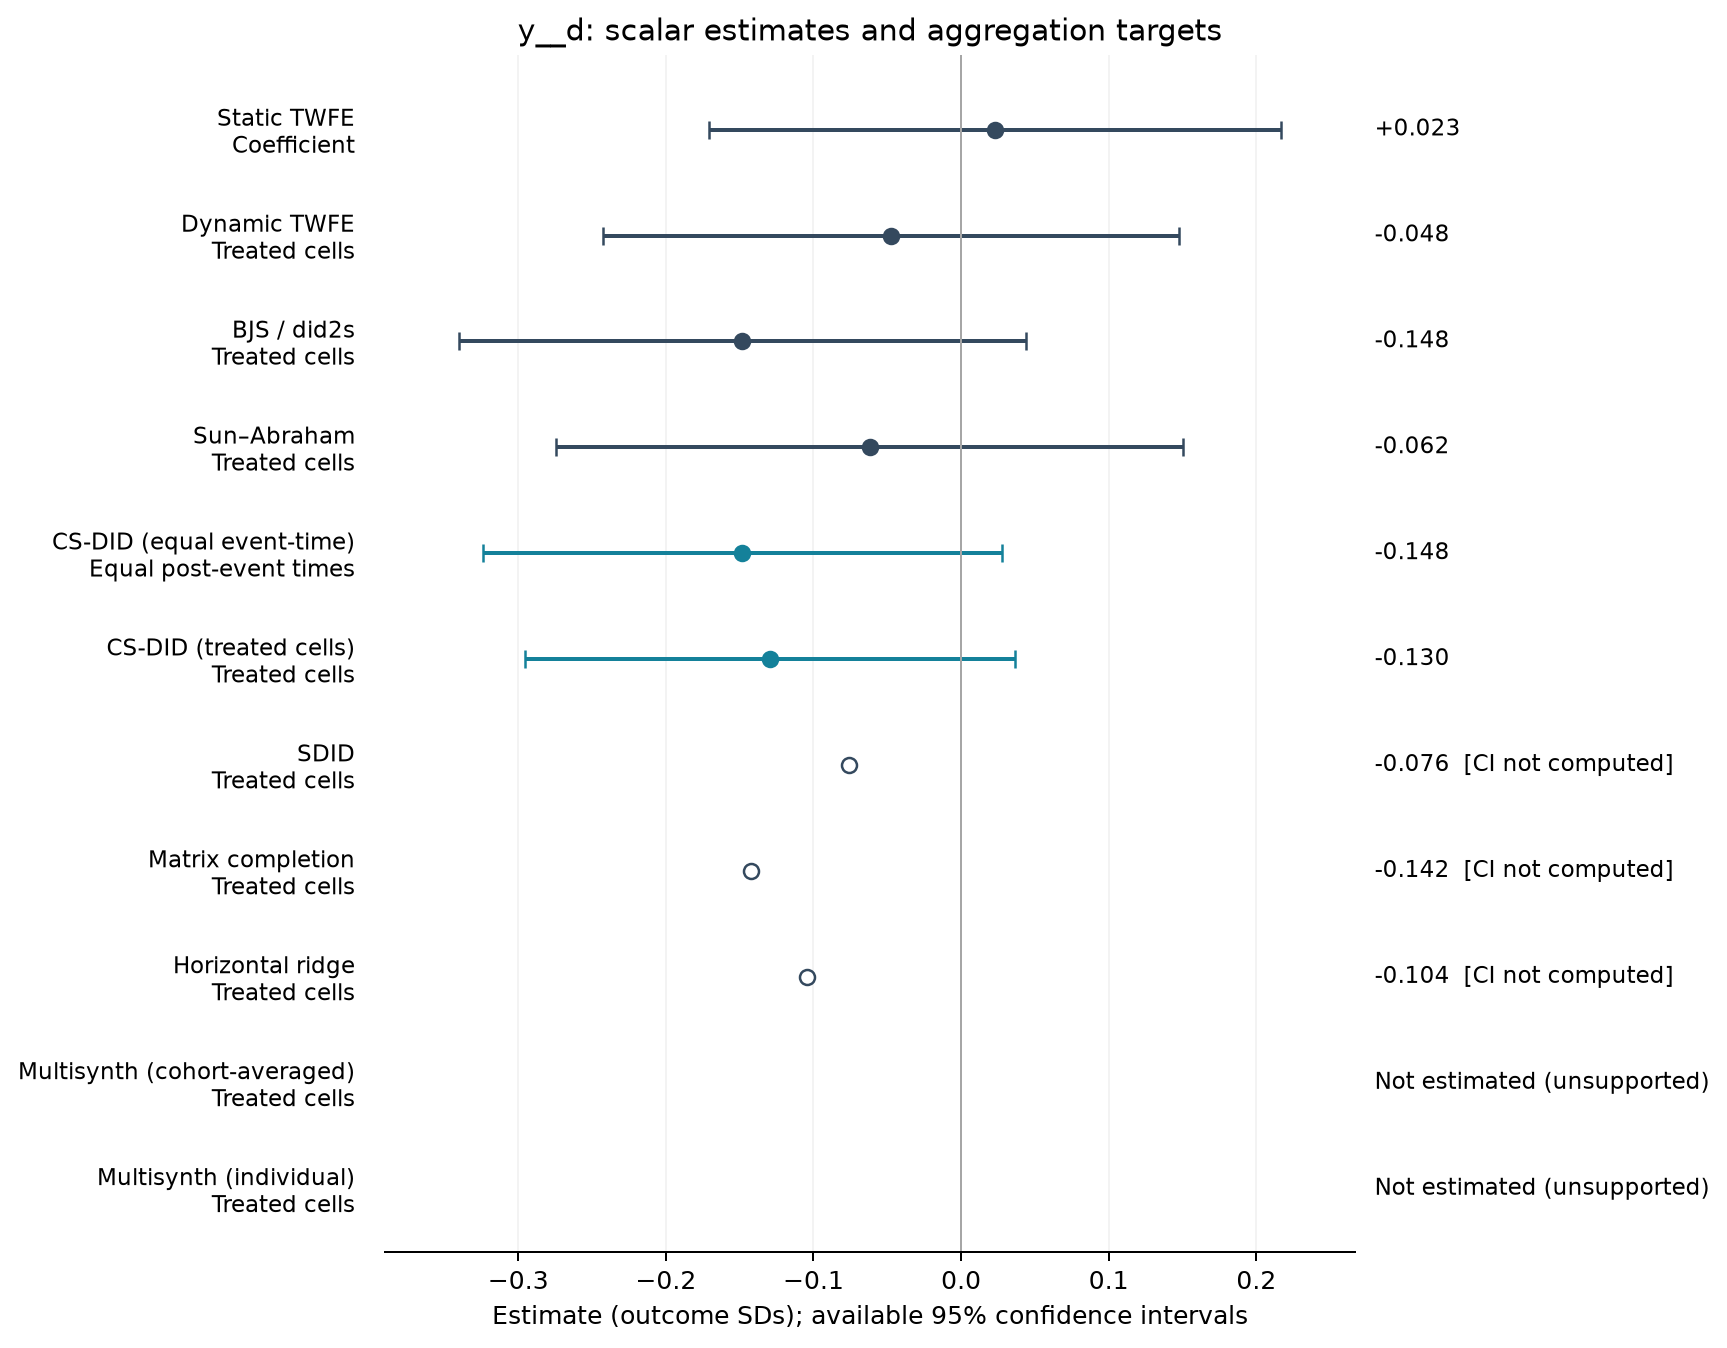
Estimate comparison
| Estimator | Estimate (SDs) | SE | 95% CI | Averaging |
|---|---|---|---|---|
| Static TWFE | 0.023 | 0.092 | [-0.171, 0.217] | Coefficient |
| Dynamic TWFE | -0.048 | 0.093 | [-0.243, 0.148] | Treated cells |
| BJS / did2s | -0.148 | 0.091 | [-0.340, 0.044] | Treated cells |
| Sun–Abraham | -0.062 | 0.101 | [-0.275, 0.151] | Treated cells |
| CS-DID (equal event-time) | -0.148 | 0.090 | [-0.324, 0.028] | Equal post-event times |
| CS-DID (treated cells) | -0.130 | 0.085 | [-0.295, 0.036] | Treated cells |
| SDID | -0.076 | — | — | Treated cells |
| Matrix completion | -0.142 | — | — | Treated cells |
| Horizontal ridge | -0.104 | — | — | Treated cells |
Event studies
Periods −10 to +10; pointwise 95% intervals where available.
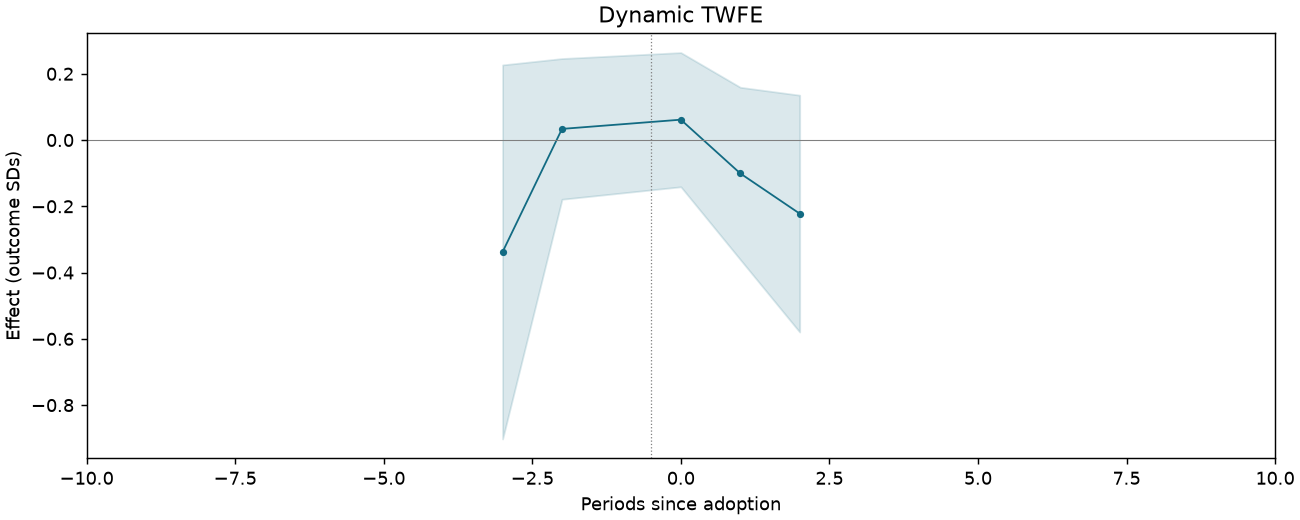
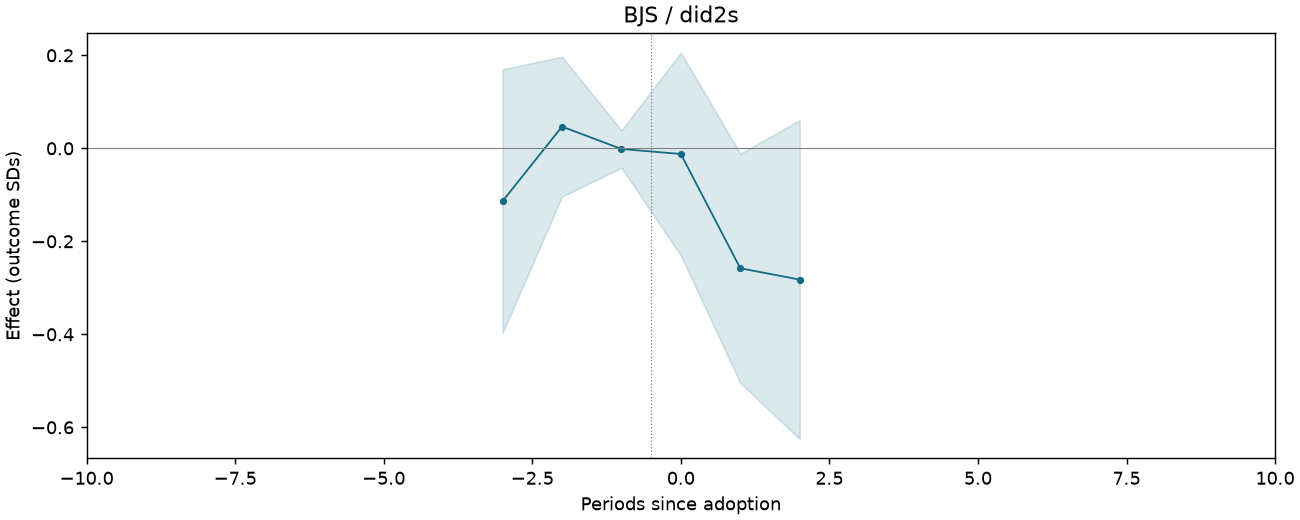
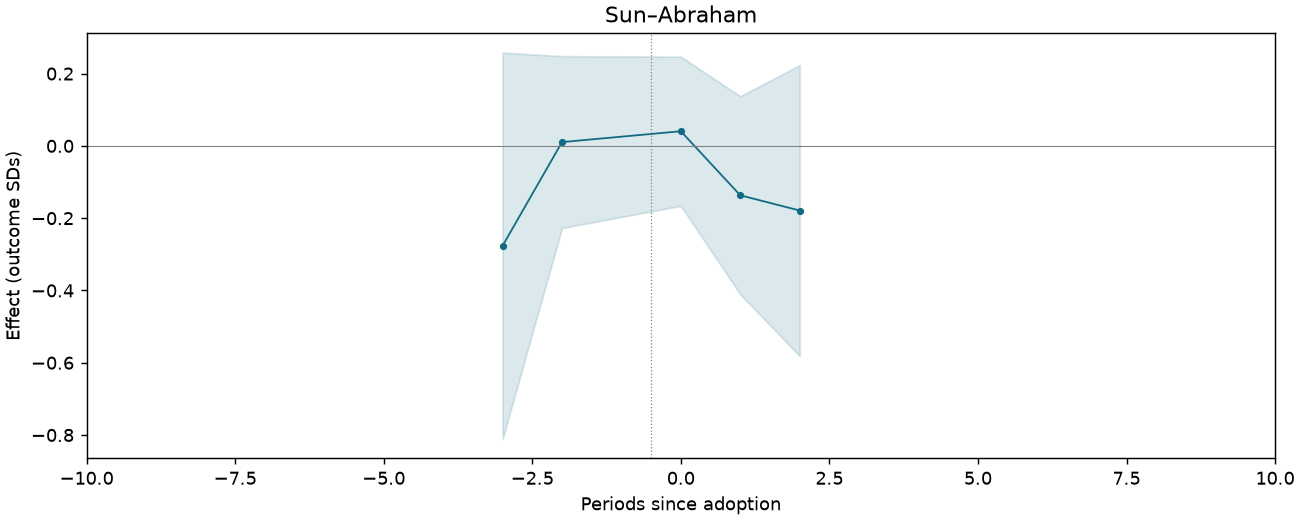
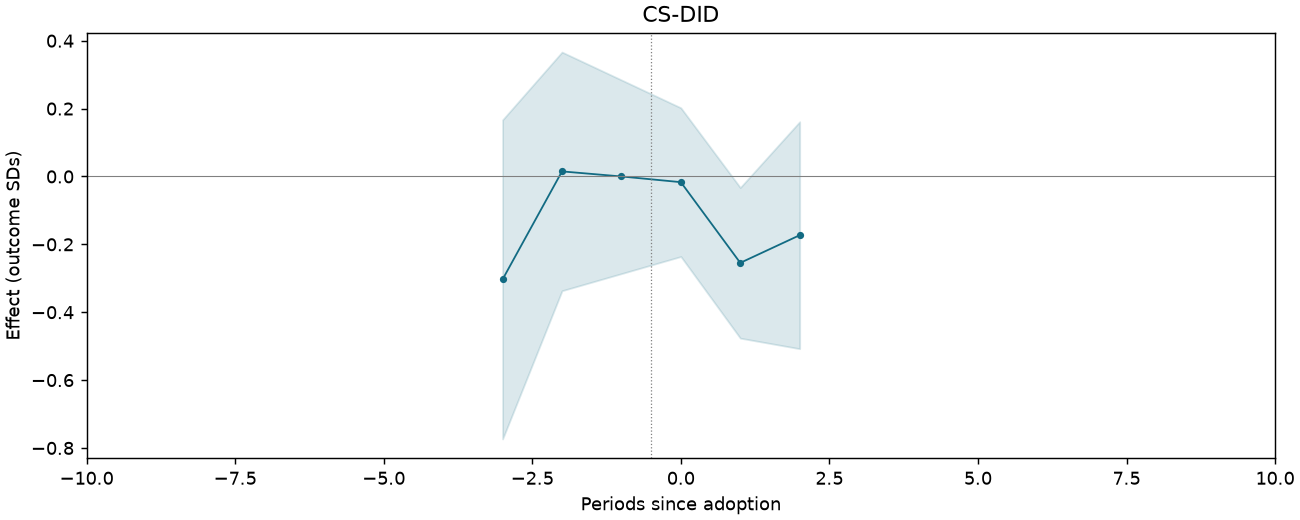
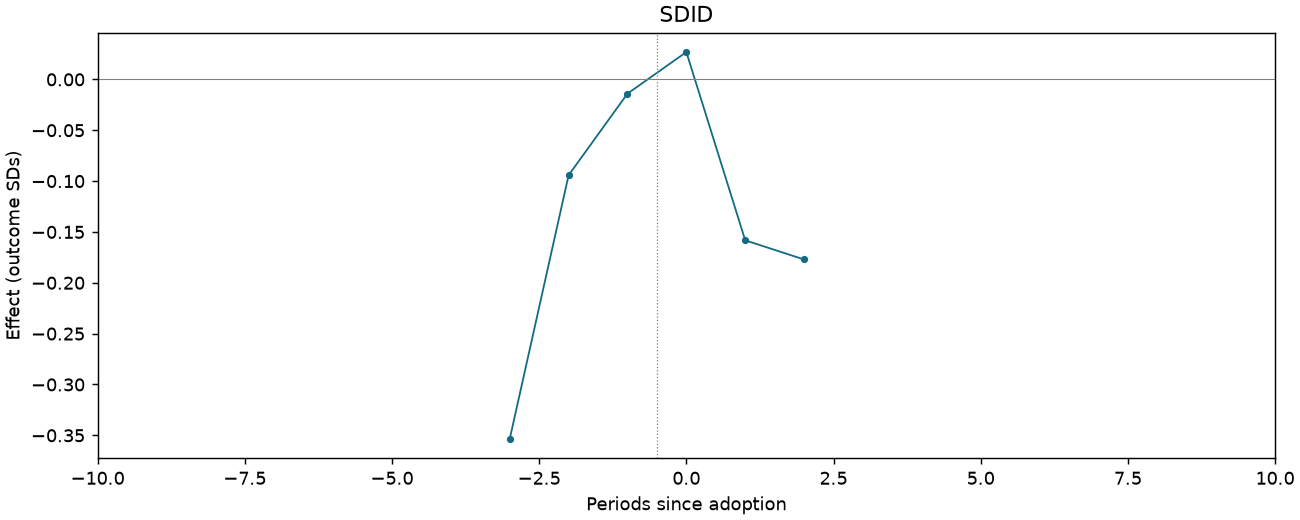
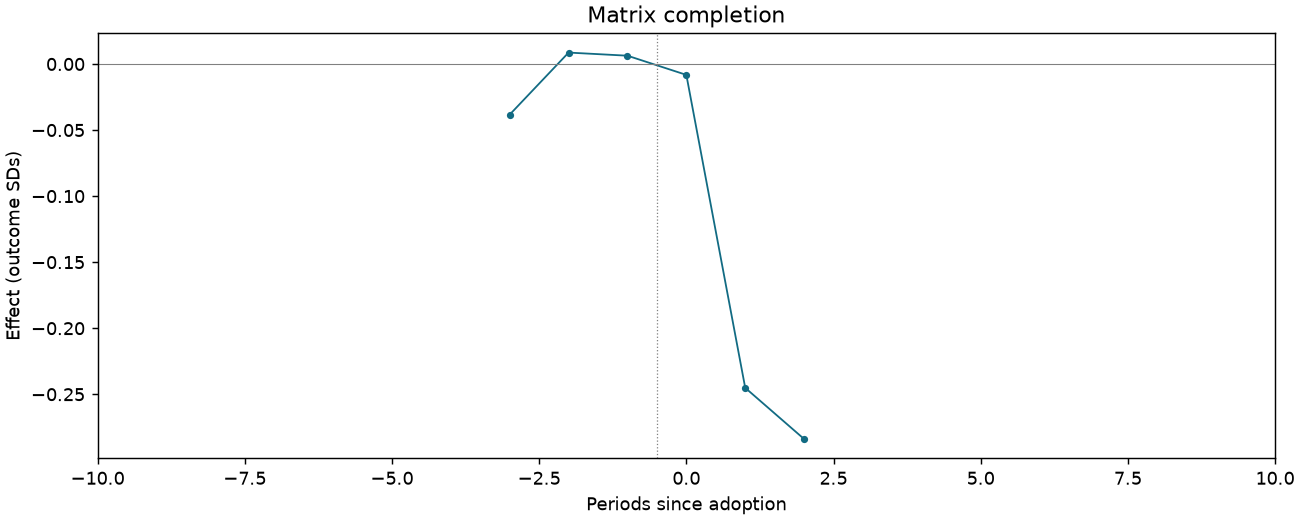
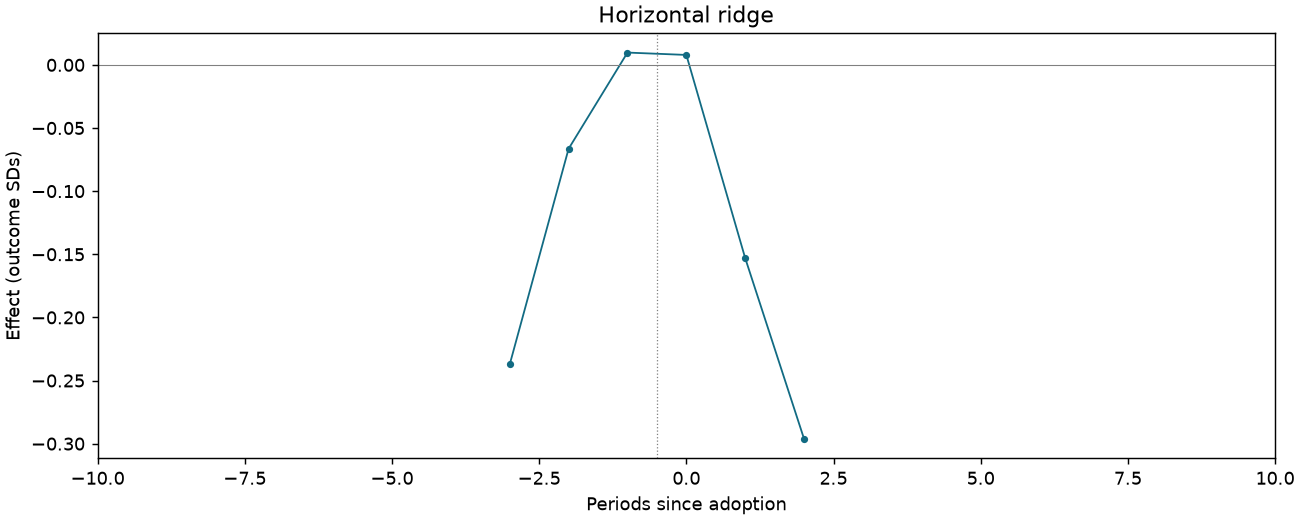
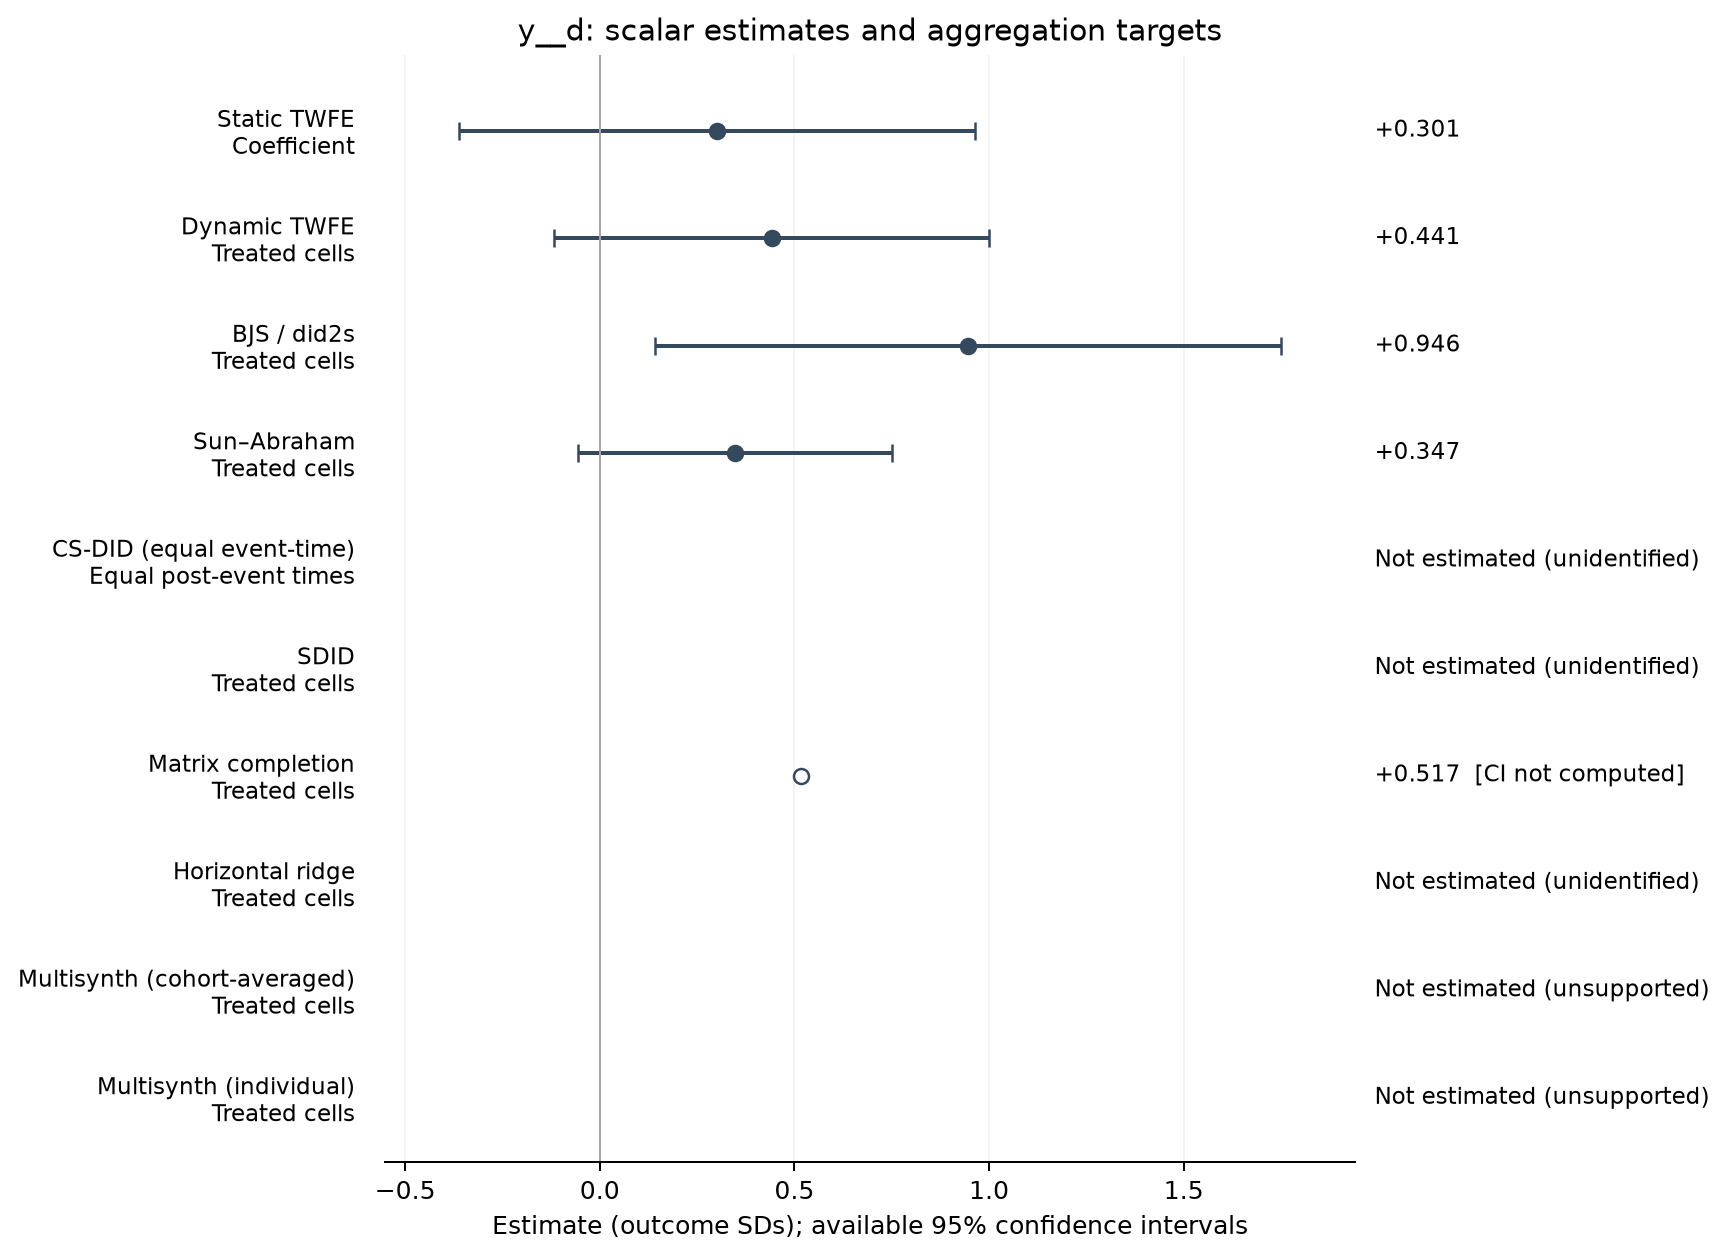
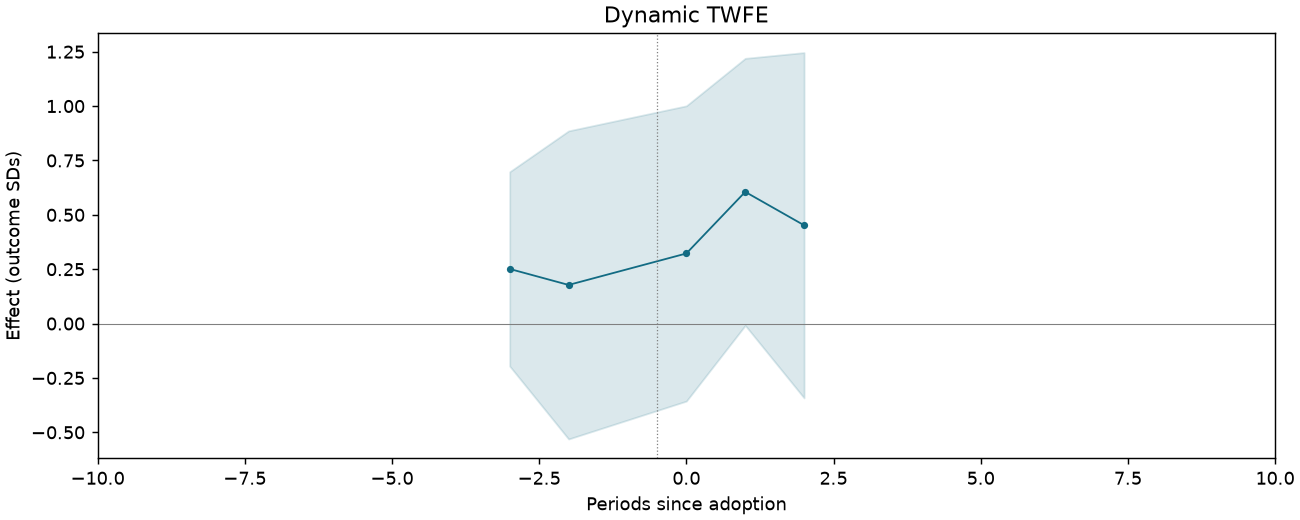
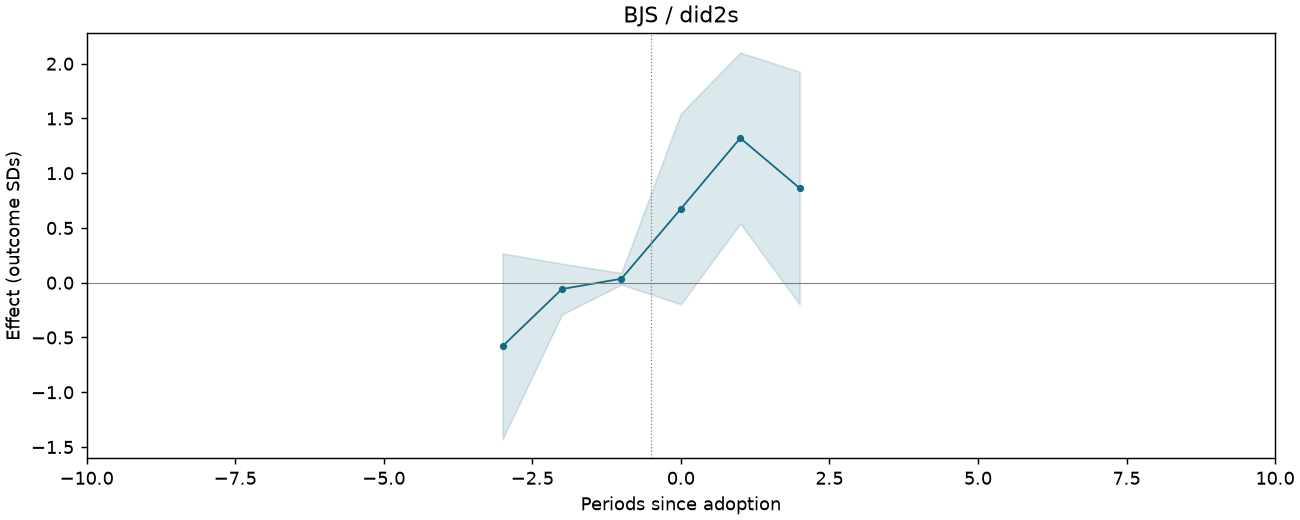
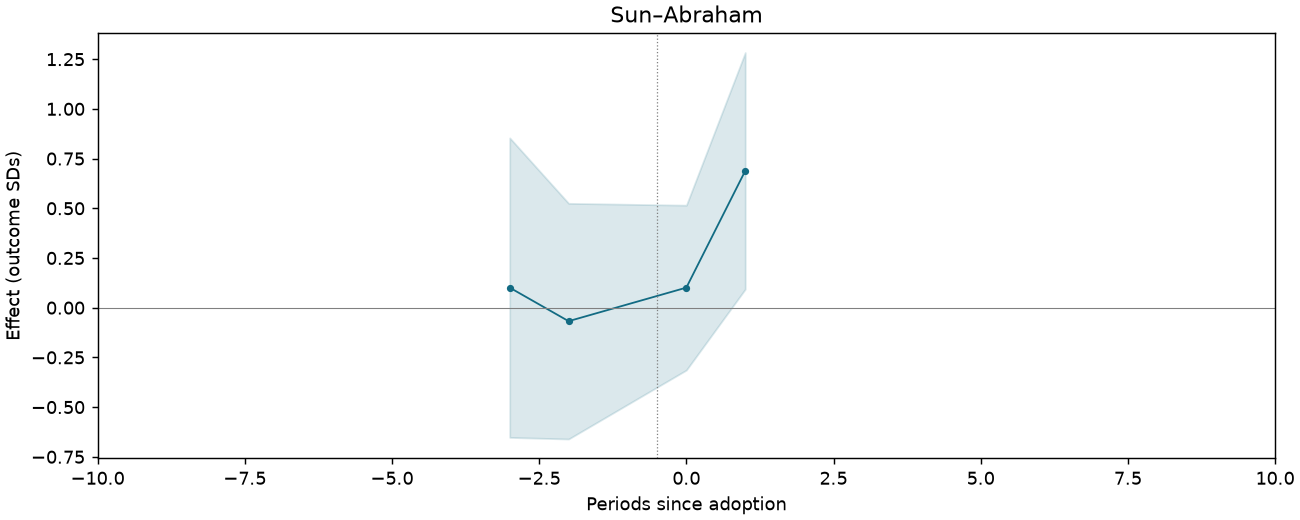
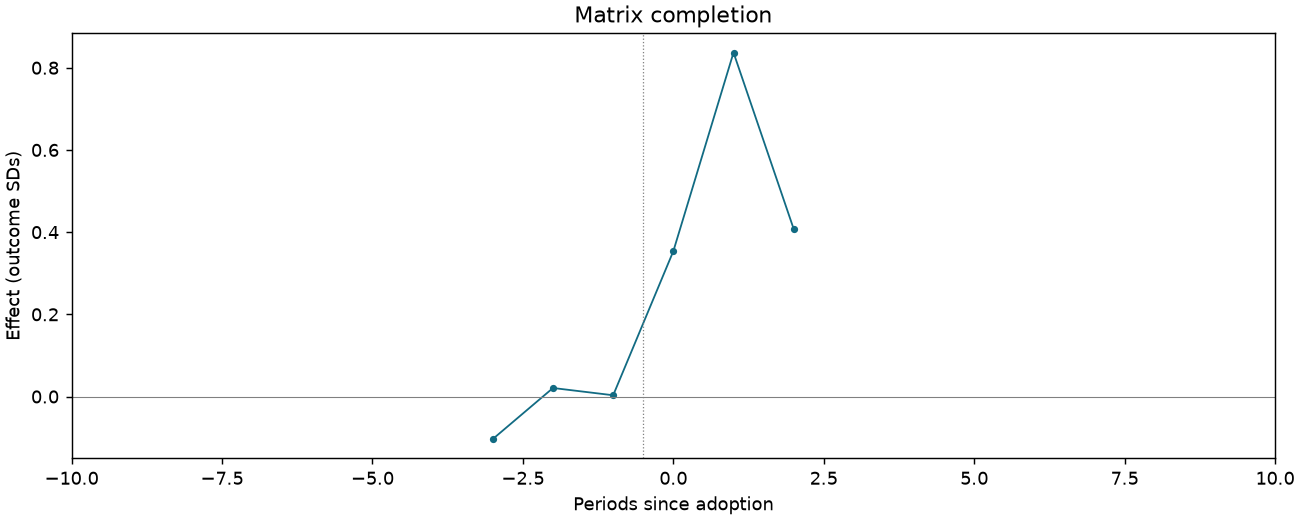
Trust in government officials z-score index [follow-up survey sample]
191 observations · 16 units · 16 clusters · 10 treated / 6 control units.
Estimate comparison
| Estimator | Estimate (SDs) | SE | 95% CI | Averaging |
|---|---|---|---|---|
| Static TWFE | 0.301 | 0.311 | [-0.362, 0.963] | Coefficient |
| Dynamic TWFE | 0.441 | 0.262 | [-0.118, 1.000] | Treated cells |
| BJS / did2s | 0.946 | 0.377 | [0.142, 1.750] | Treated cells |
| Sun–Abraham | 0.347 | 0.190 | [-0.057, 0.752] | Treated cells |
| Matrix completion | 0.517 | — | — | Treated cells |
Event studies
Periods −10 to +10; pointwise 95% intervals where available.
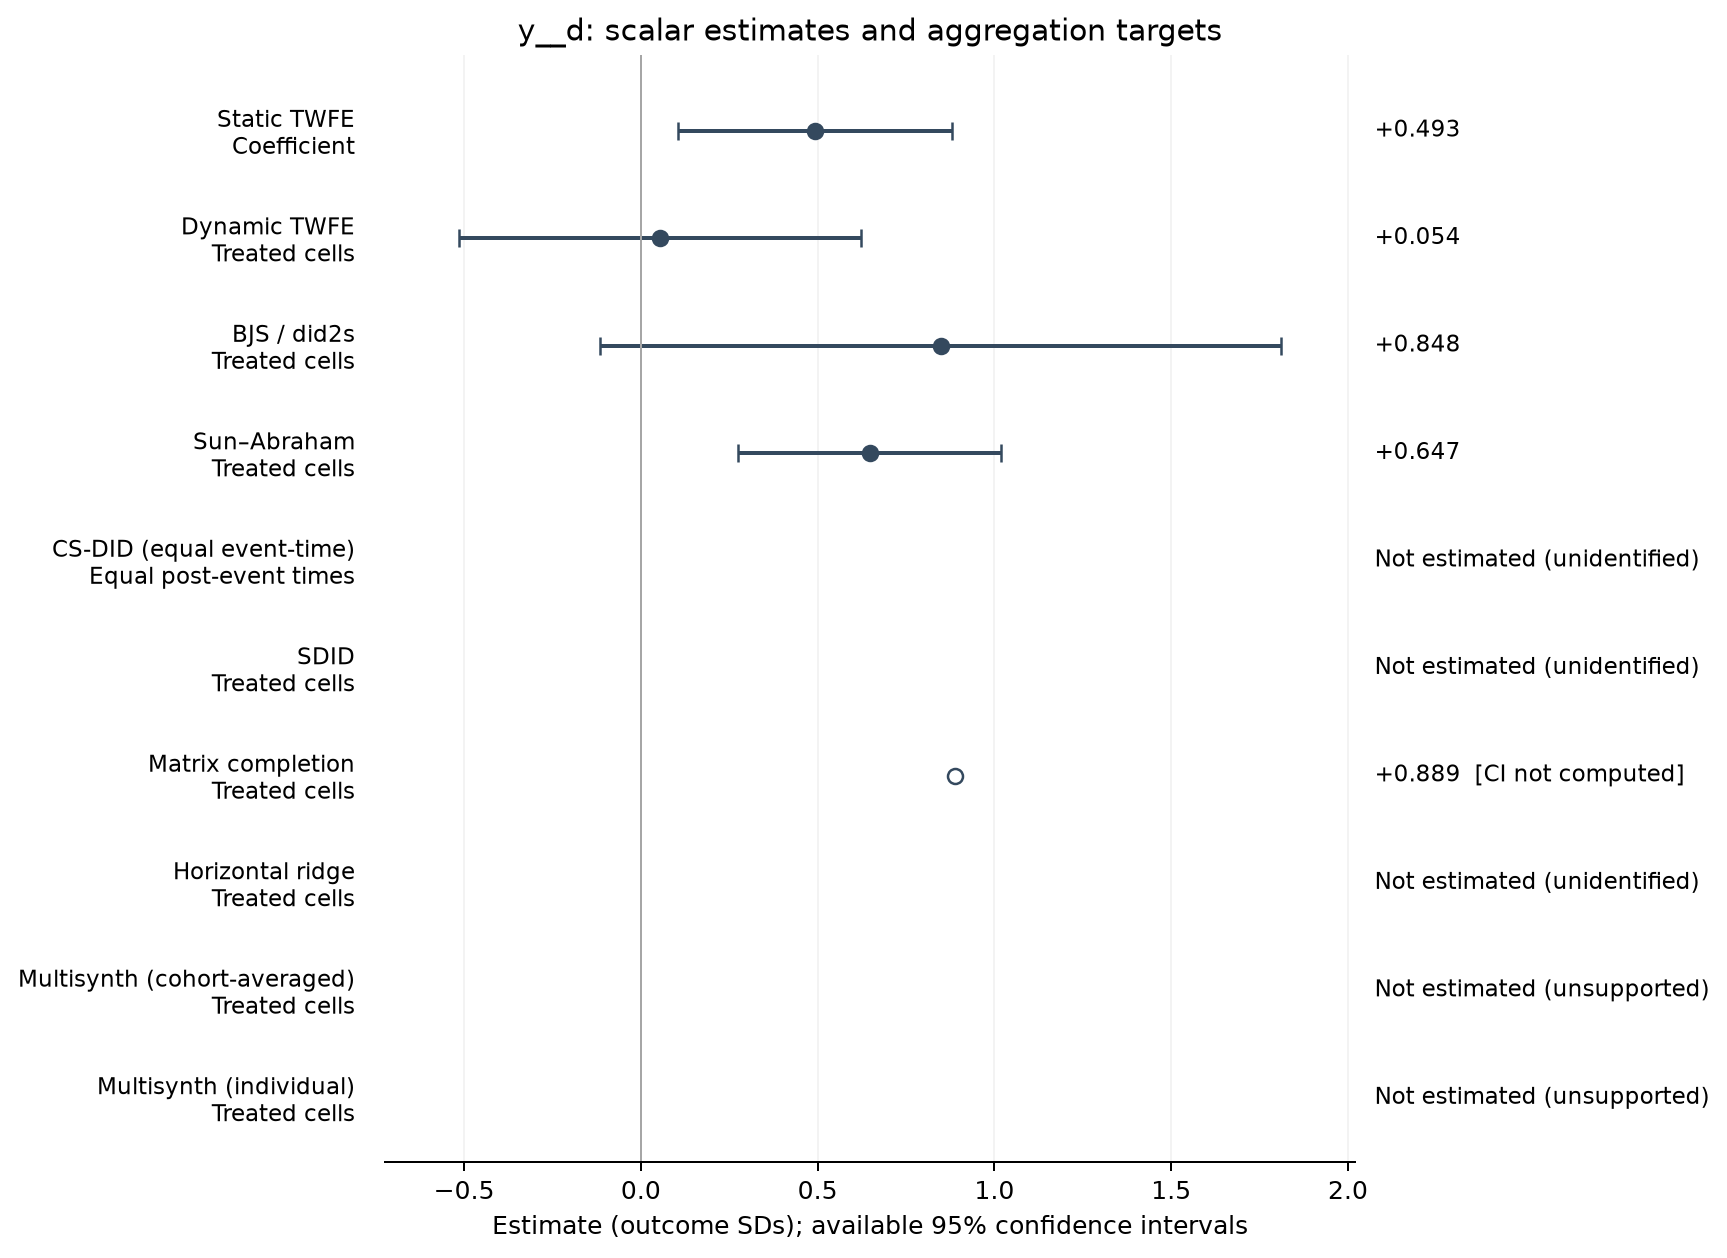
Bribery and civic-mindedness z-score index [follow-up survey sample]
188 observations · 16 units · 16 clusters · 10 treated / 6 control units.
Estimate comparison
| Estimator | Estimate (SDs) | SE | 95% CI | Averaging |
|---|---|---|---|---|
| Static TWFE | 0.493 | 0.182 | [0.106, 0.880] | Coefficient |
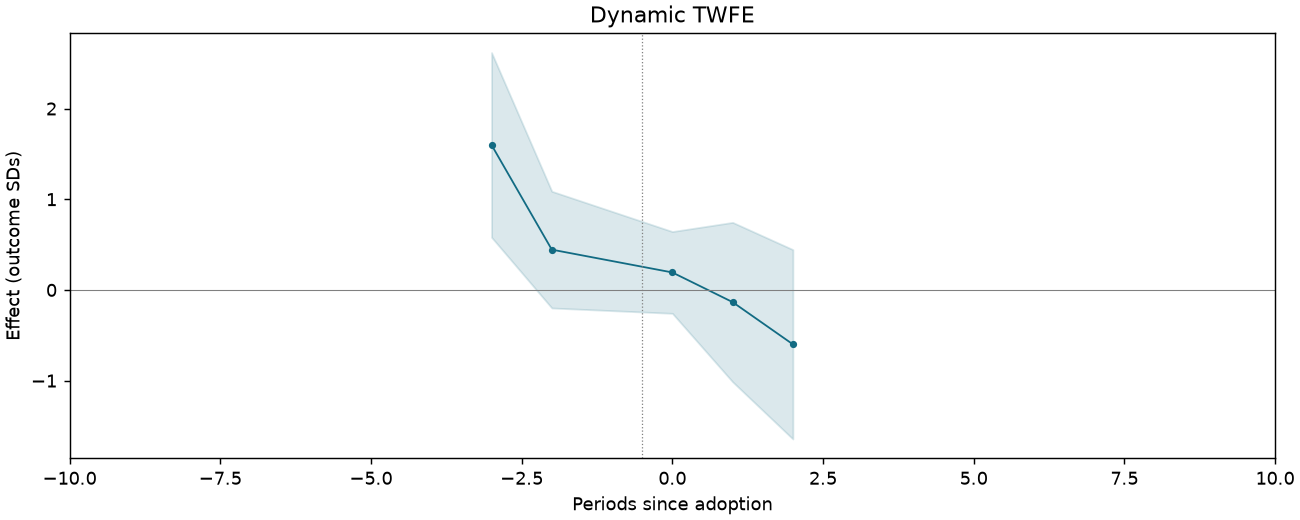
| Dynamic TWFE | 0.054 | 0.267 | [-0.514, 0.622] | Treated cells |
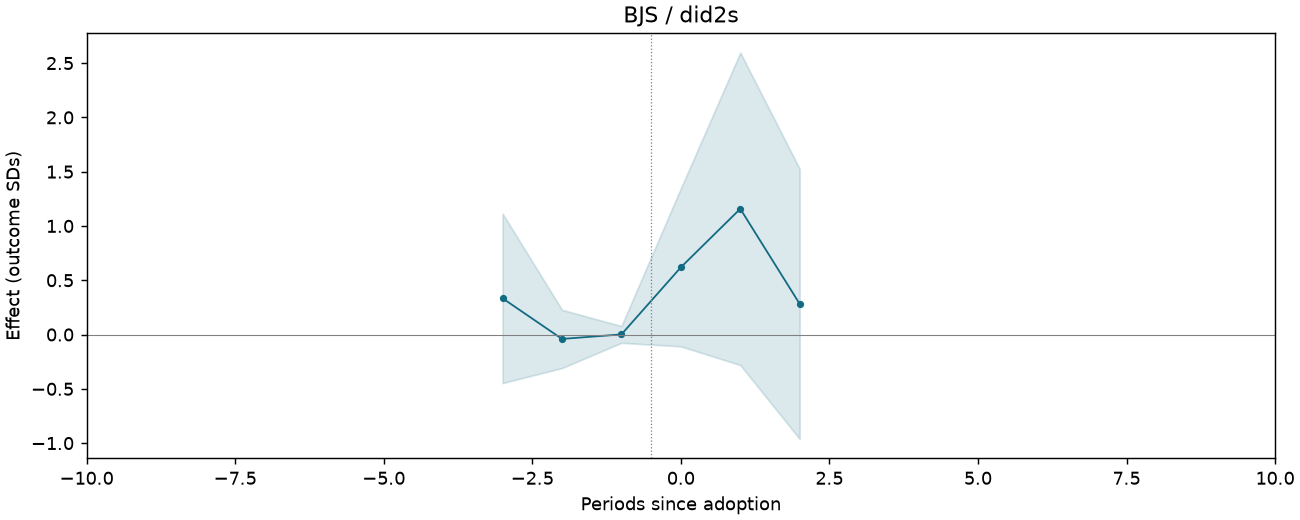
| BJS / did2s | 0.848 | 0.452 | [-0.115, 1.811] | Treated cells |
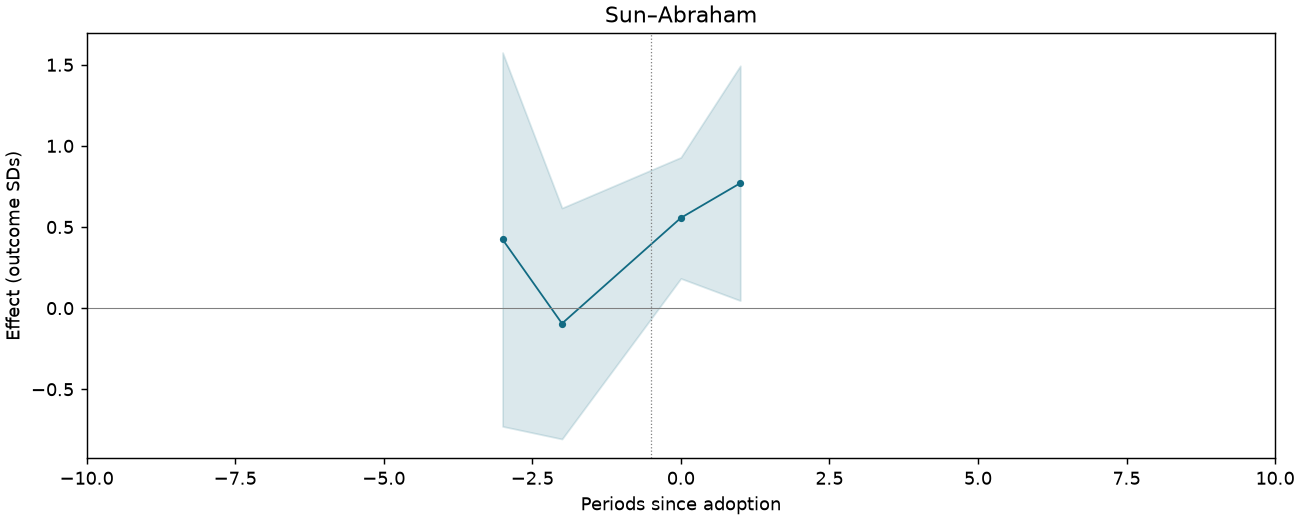
| Sun–Abraham | 0.647 | 0.175 | [0.275, 1.019] | Treated cells |
| Matrix completion | 0.889 | — | — | Treated cells |
Event studies
Periods −10 to +10; pointwise 95% intervals where available.
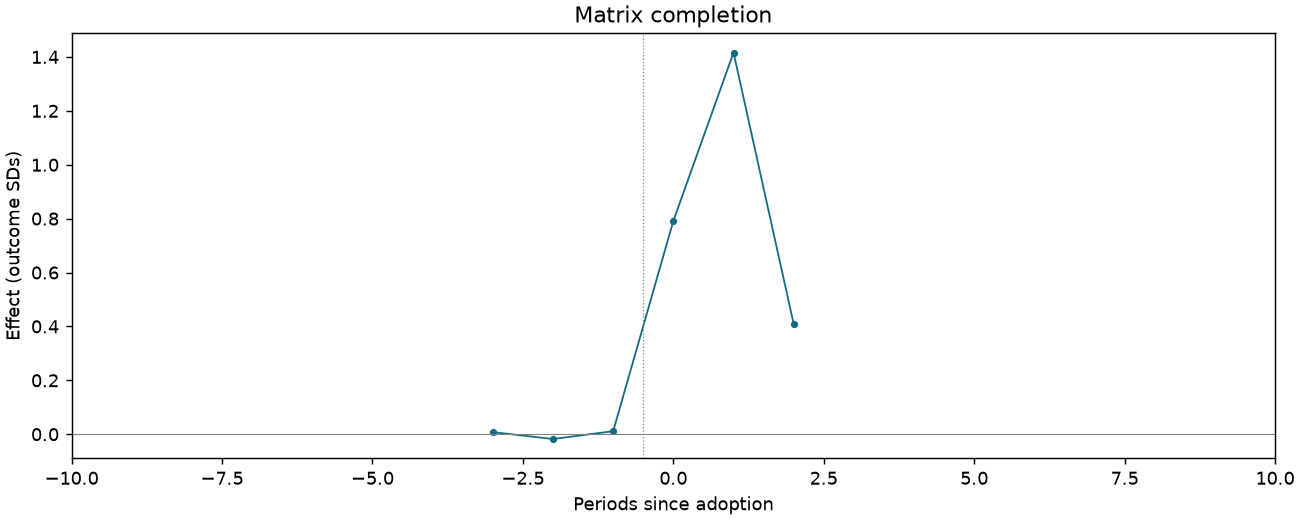
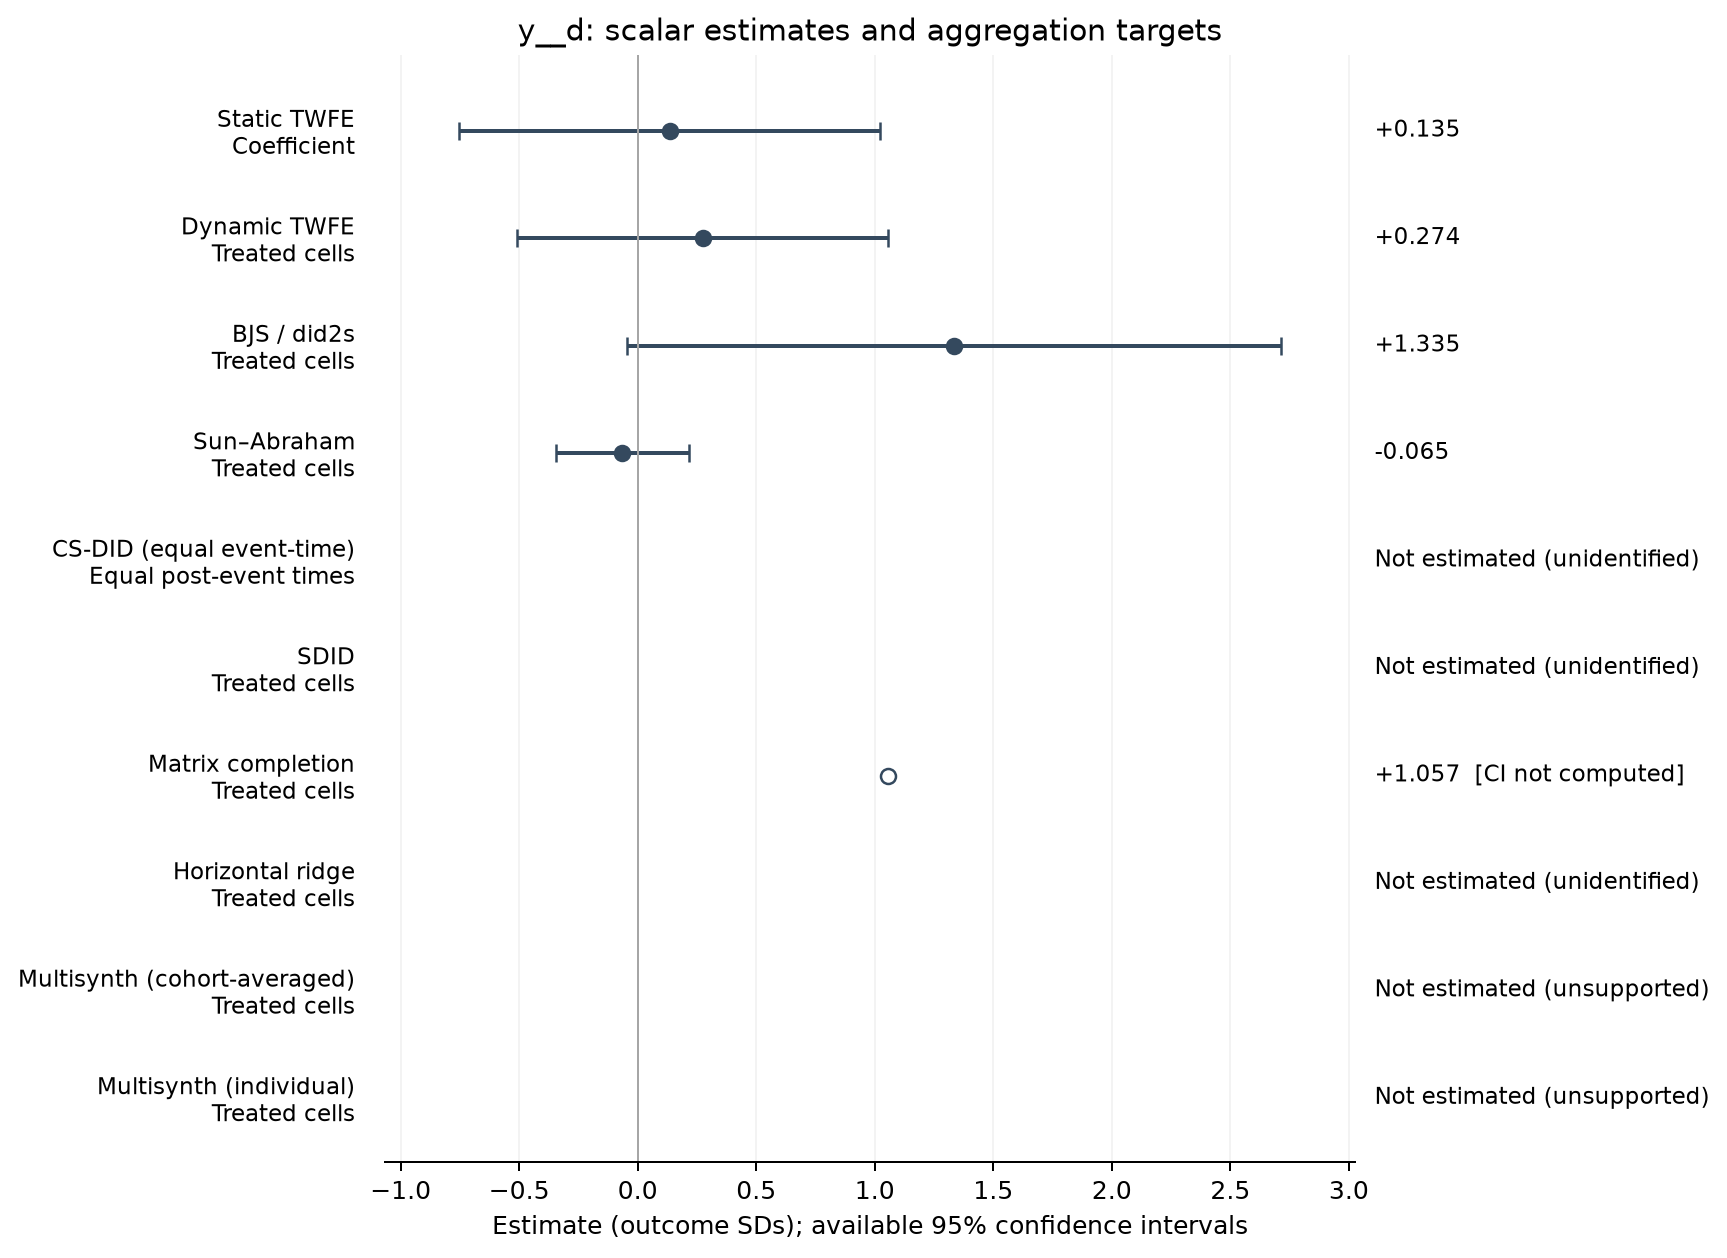
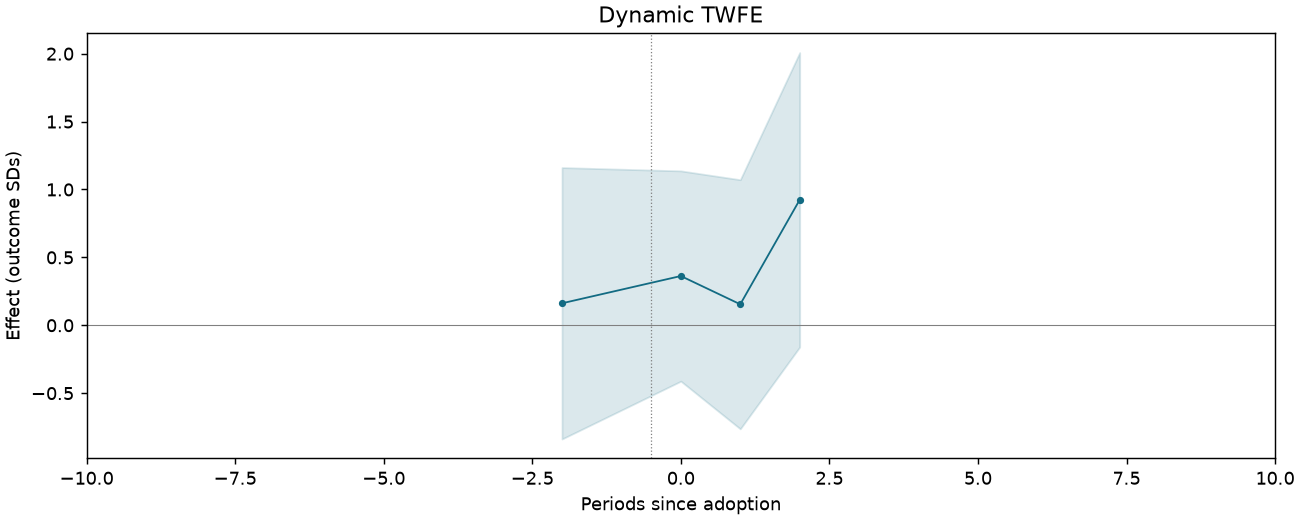
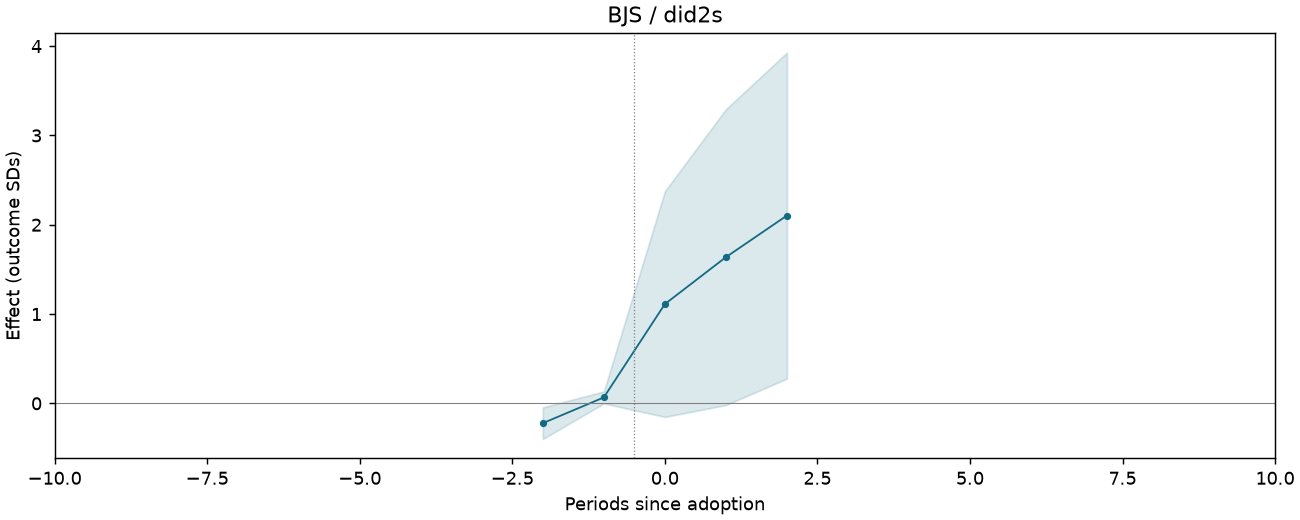
Perception of Chinese democracy z-score index [follow-up survey sample]
189 observations · 16 units · 16 clusters · 10 treated / 6 control units.
Estimate comparison
| Estimator | Estimate (SDs) | SE | 95% CI | Averaging |
|---|---|---|---|---|
| Static TWFE | 0.135 | 0.417 | [-0.754, 1.023] | Coefficient |
| Dynamic TWFE | 0.274 | 0.368 | [-0.510, 1.058] | Treated cells |
| BJS / did2s | 1.335 | 0.647 | [-0.045, 2.714] | Treated cells |
| Sun–Abraham | -0.065 | 0.131 | [-0.345, 0.215] | Treated cells |
| Matrix completion | 1.057 | — | — | Treated cells |
Event studies
Periods −10 to +10; pointwise 95% intervals where available.
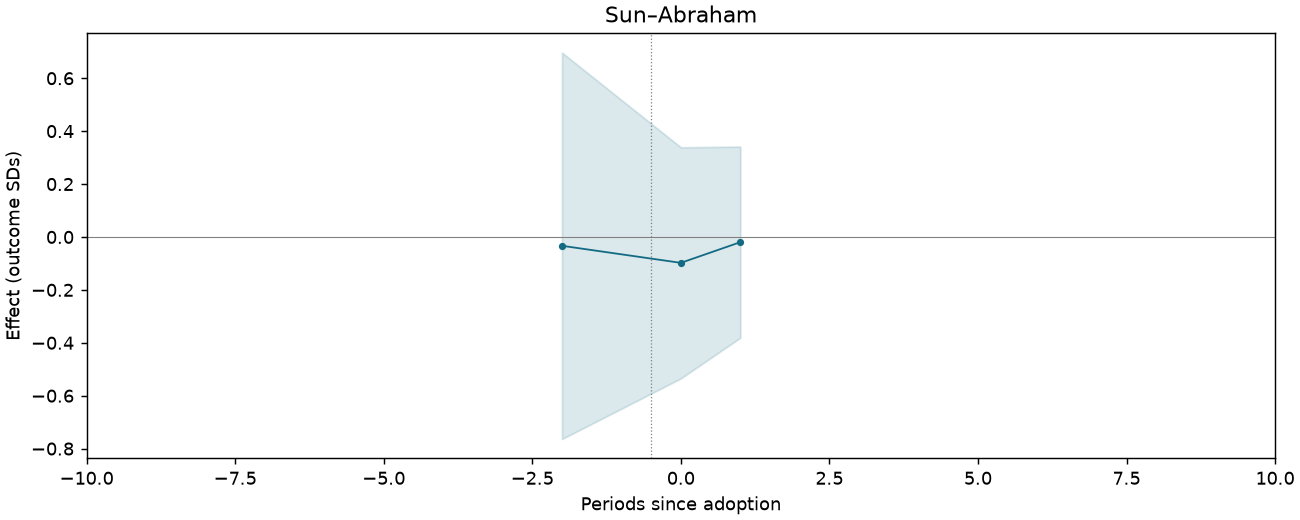
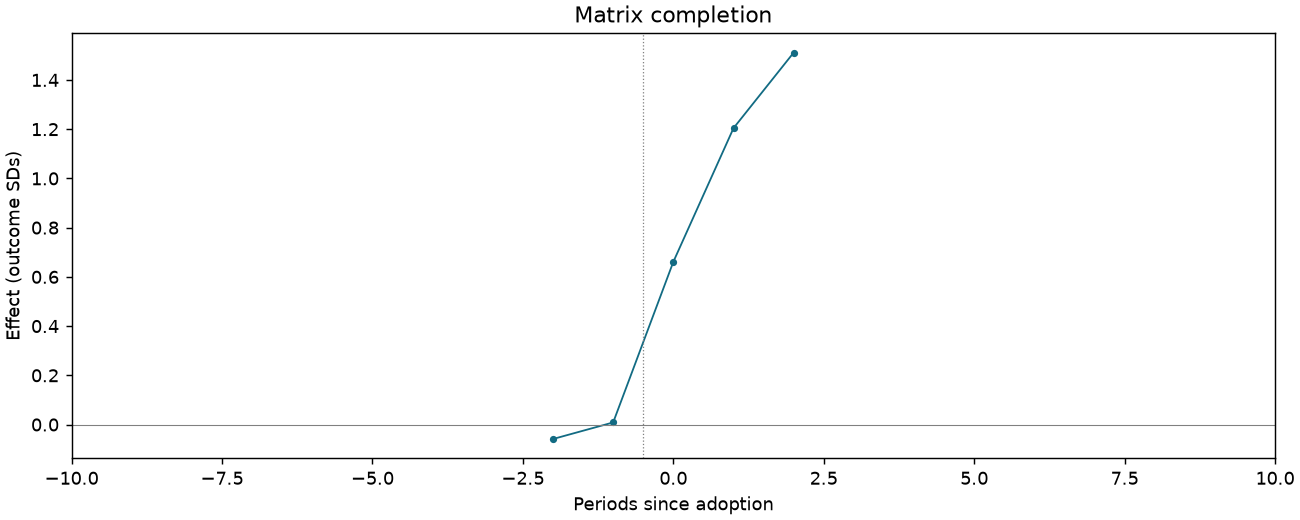
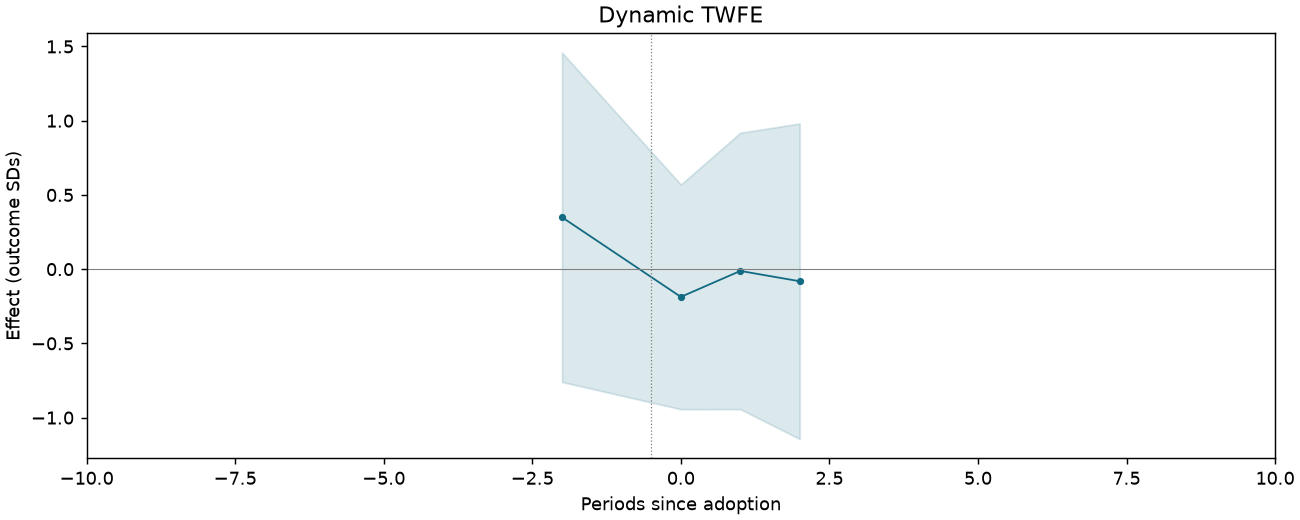
Wisdom of the masses z-score index [follow-up survey sample]
176 observations · 16 units · 16 clusters · 9 treated / 7 control units.
Estimate comparison
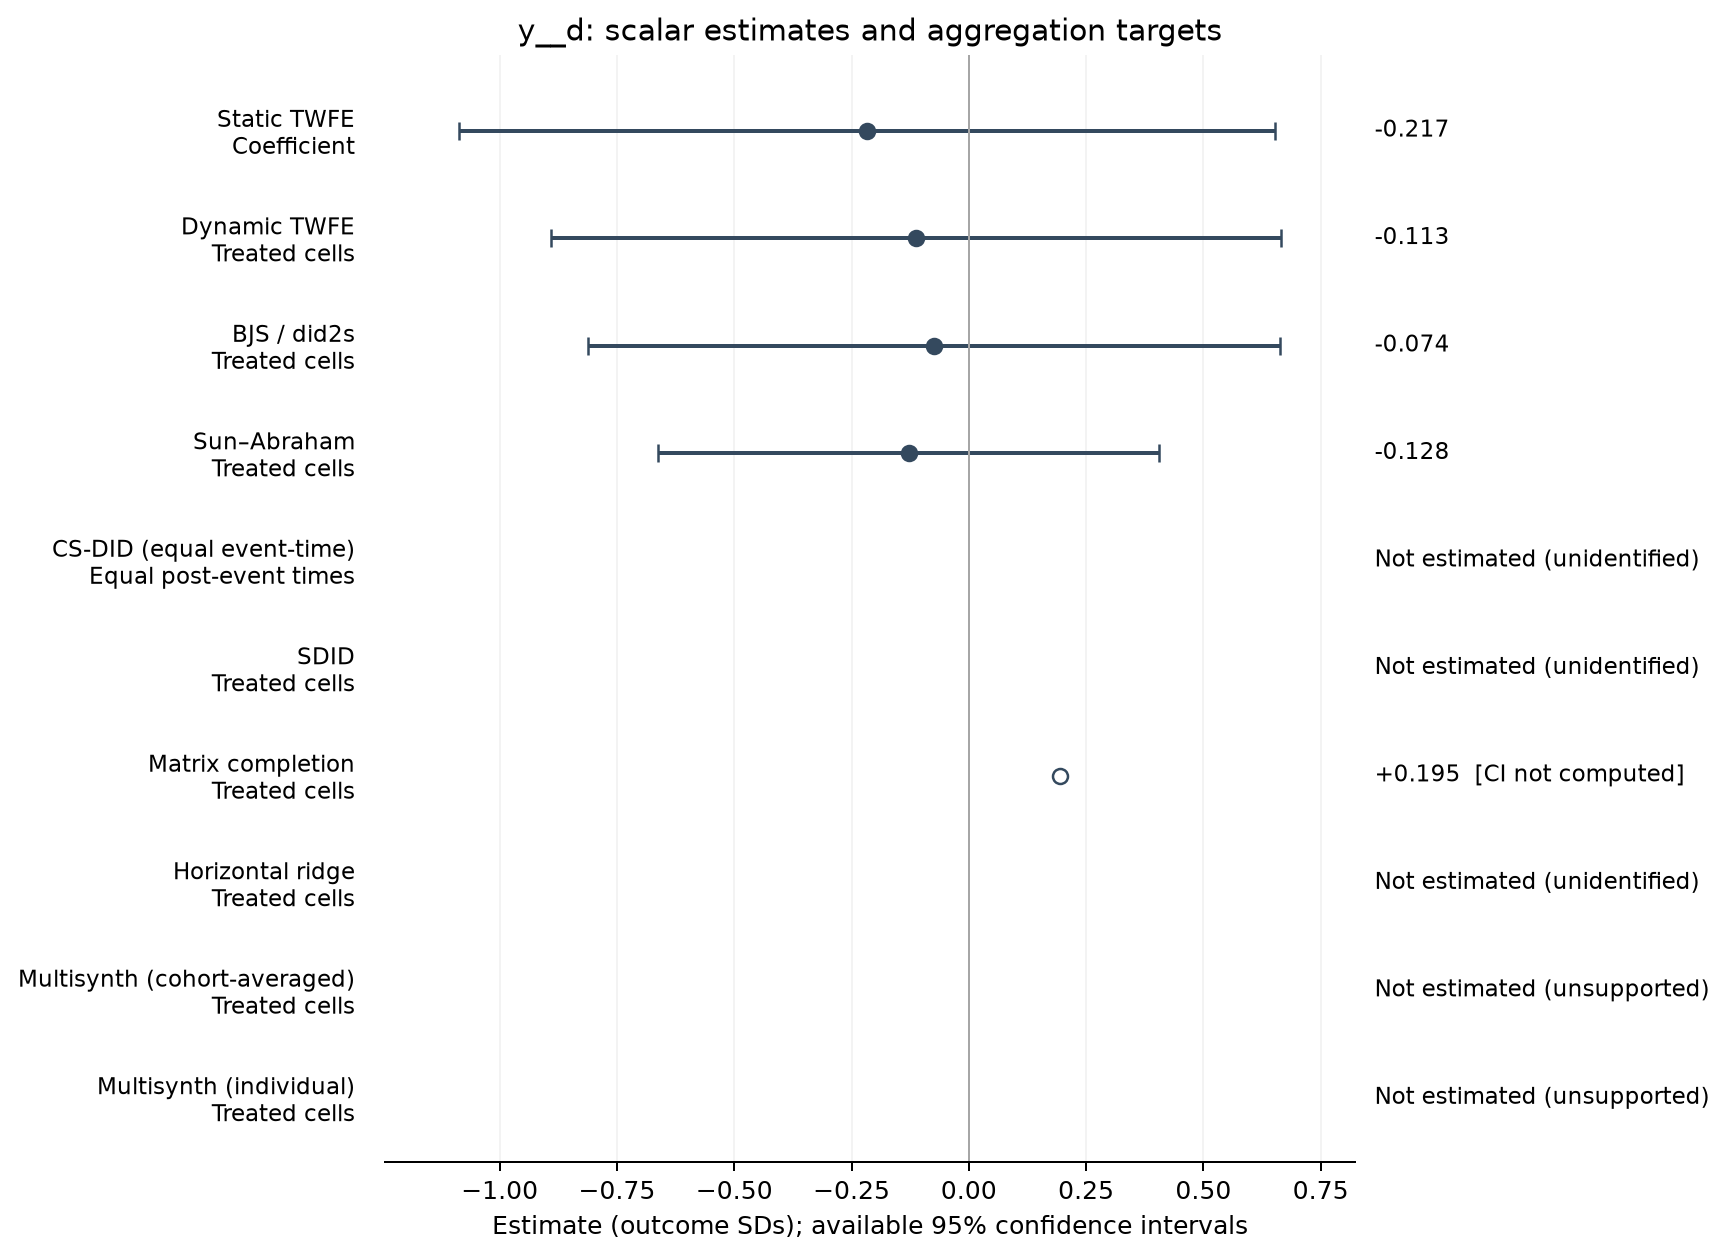
| Estimator | Estimate (SDs) | SE | 95% CI | Averaging |
|---|---|---|---|---|
| Static TWFE | -0.217 | 0.408 | [-1.087, 0.653] | Coefficient |
| Dynamic TWFE | -0.113 | 0.365 | [-0.891, 0.666] | Treated cells |
| BJS / did2s | -0.074 | 0.346 | [-0.811, 0.664] | Treated cells |
| Sun–Abraham | -0.128 | 0.250 | [-0.661, 0.405] | Treated cells |
| Matrix completion | 0.195 | — | — | Treated cells |
Event studies
Periods −10 to +10; pointwise 95% intervals where available.
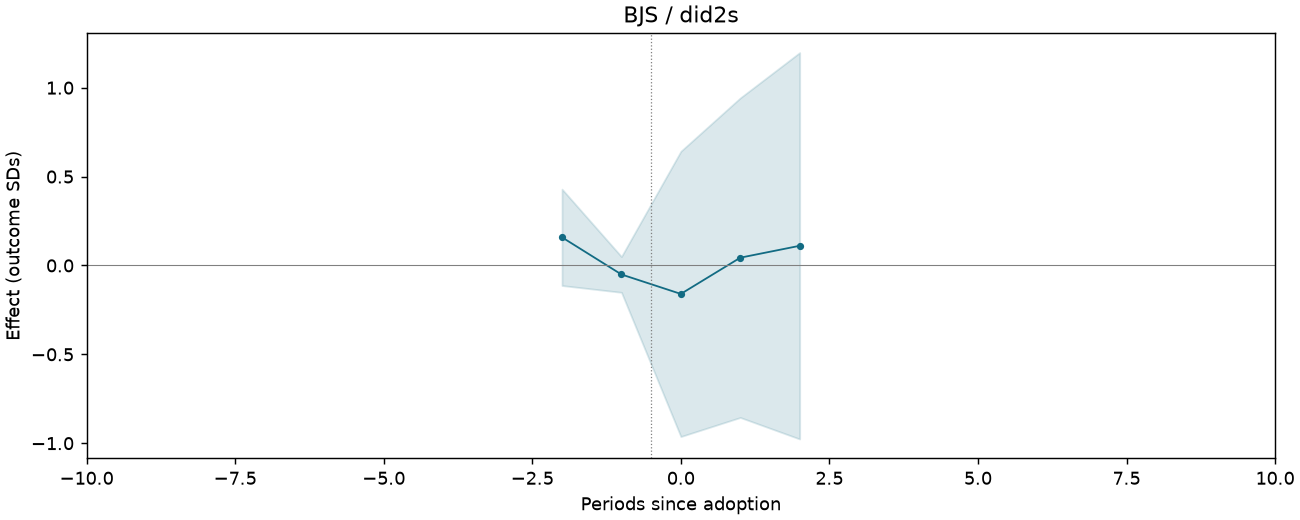
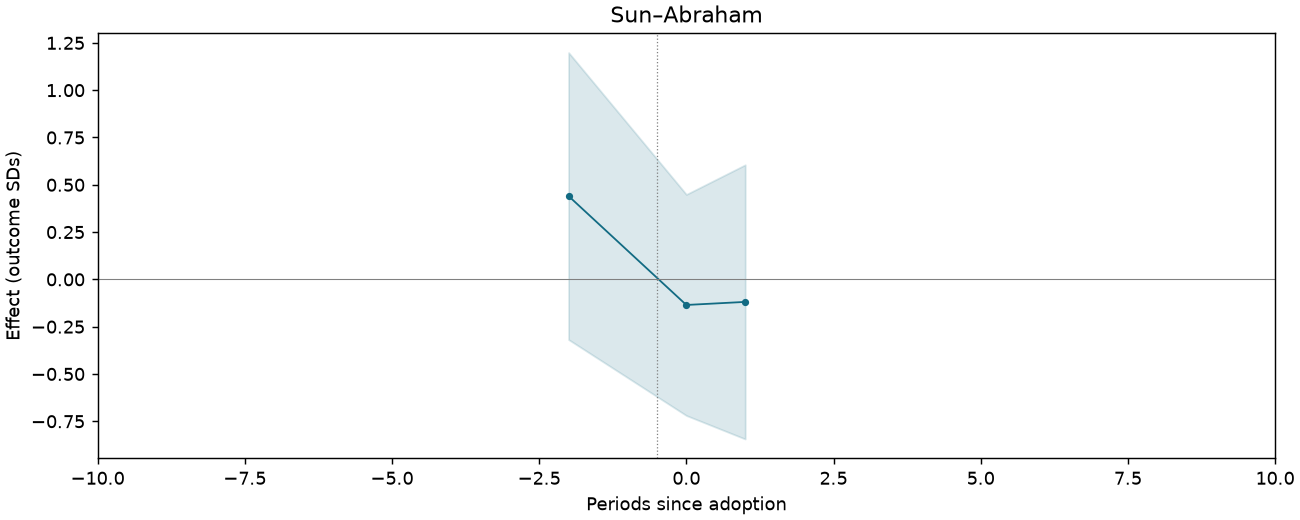
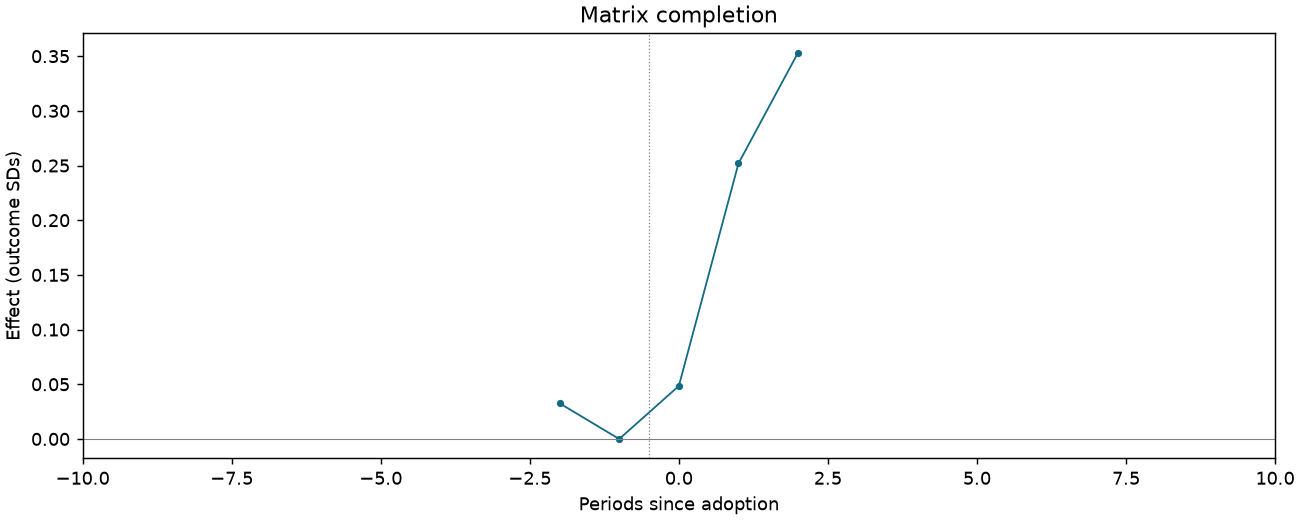
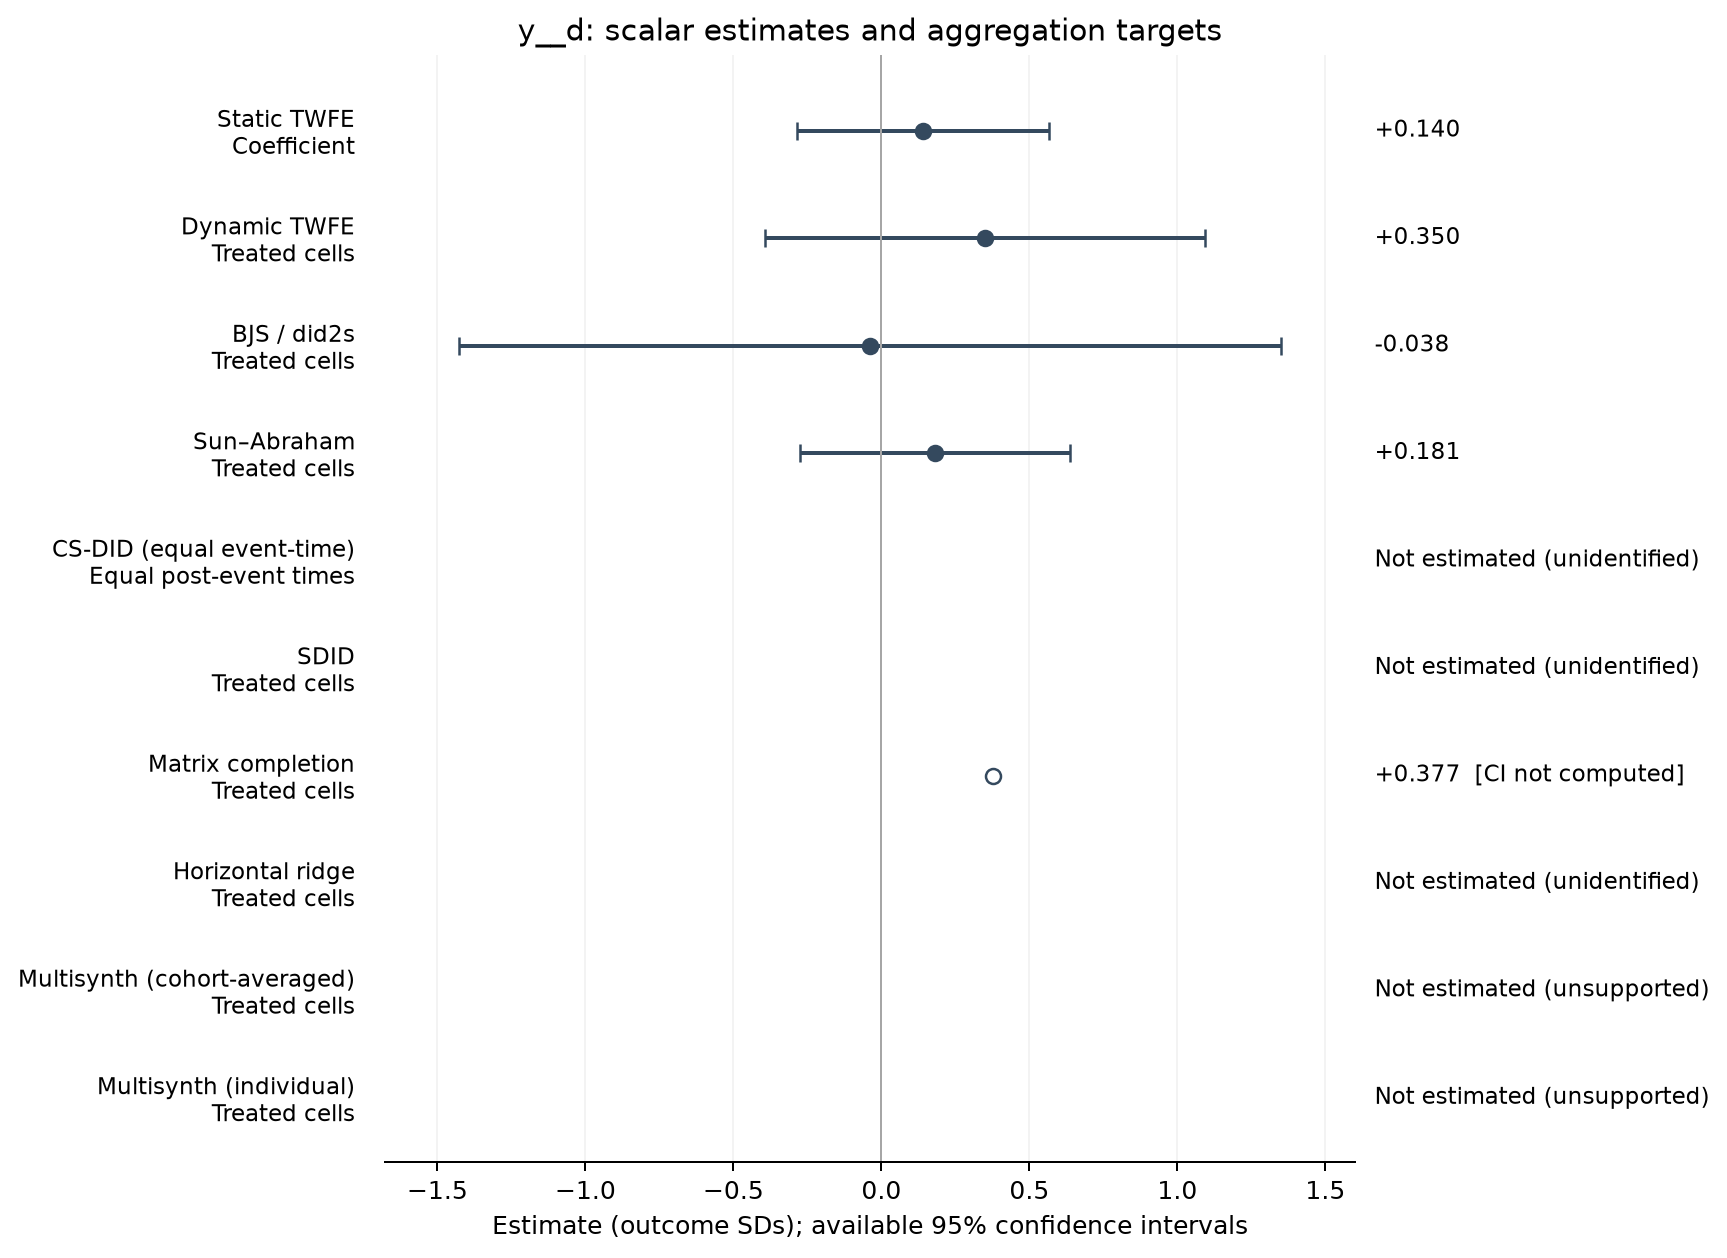
Participation is key for democracy [follow-up survey sample]
173 observations · 16 units · 16 clusters · 10 treated / 6 control units.
Estimate comparison
| Estimator | Estimate (SDs) | SE | 95% CI | Averaging |
|---|---|---|---|---|
| Static TWFE | 0.140 | 0.200 | [-0.287, 0.566] | Coefficient |
| Dynamic TWFE | 0.350 | 0.348 | [-0.392, 1.093] | Treated cells |
| BJS / did2s | -0.038 | 0.652 | [-1.427, 1.351] | Treated cells |
| Sun–Abraham | 0.181 | 0.214 | [-0.275, 0.636] | Treated cells |
| Matrix completion | 0.377 | — | — | Treated cells |
Event studies
Periods −10 to +10; pointwise 95% intervals where available.
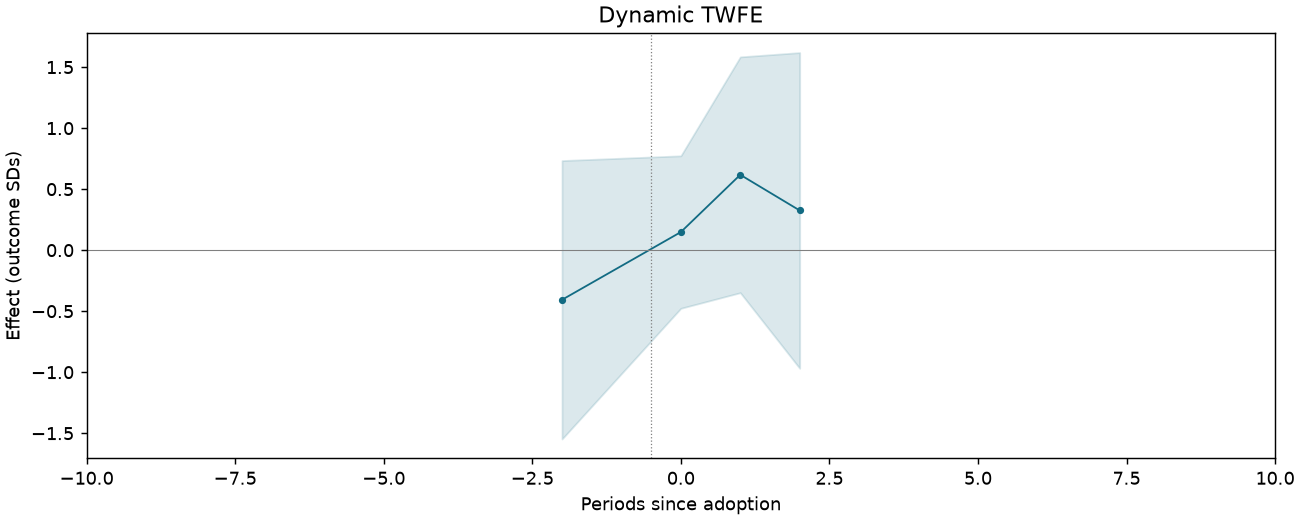
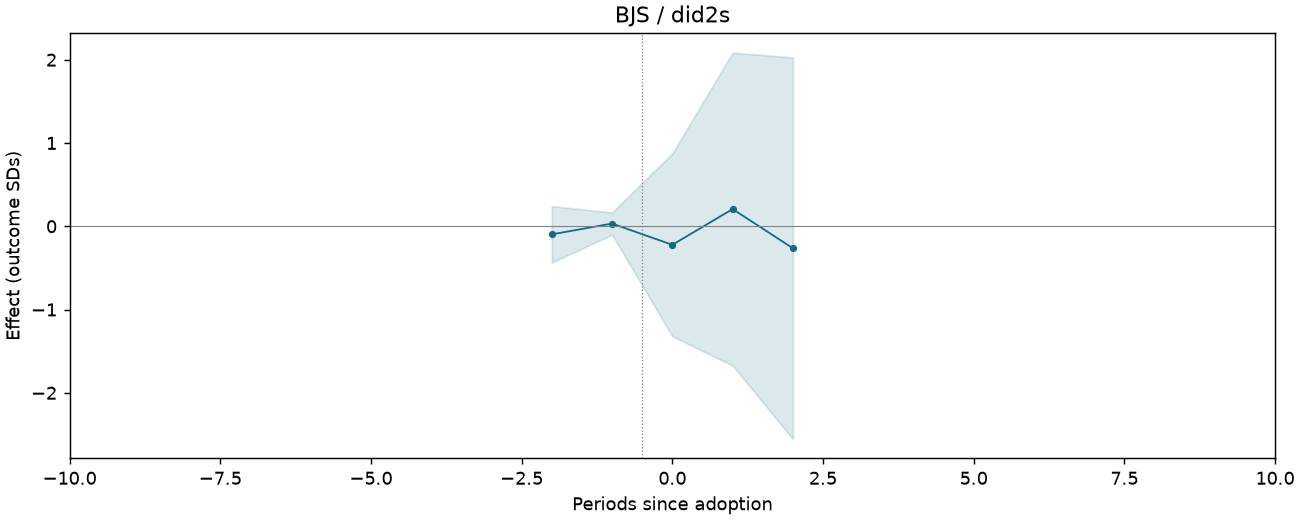
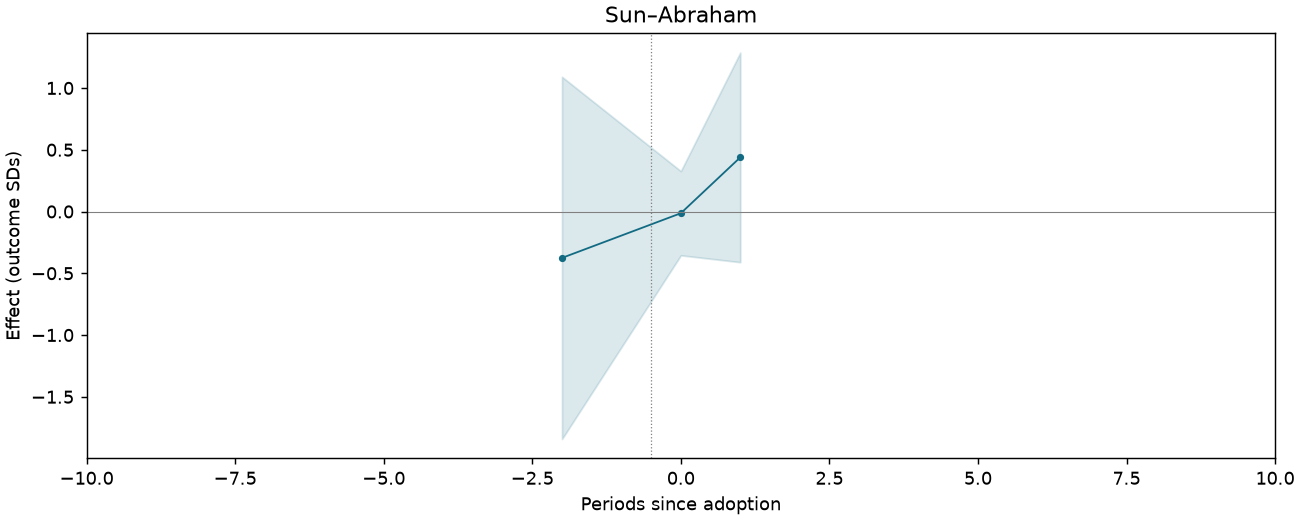
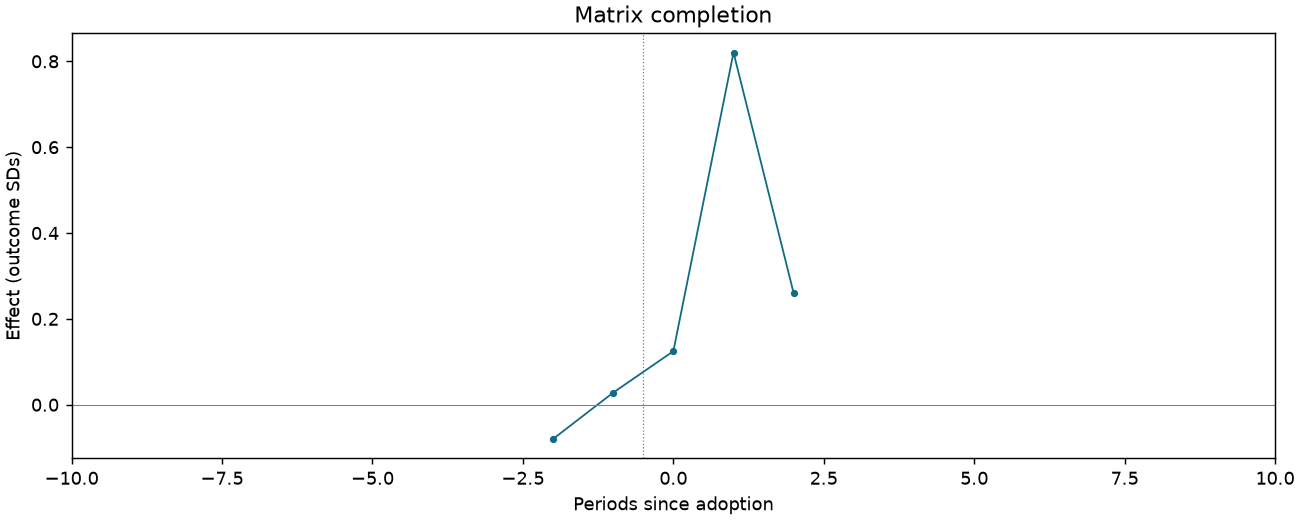
Skeptical of markets [follow-up survey sample]
173 observations · 16 units · 16 clusters · 9 treated / 7 control units.
Estimate comparison
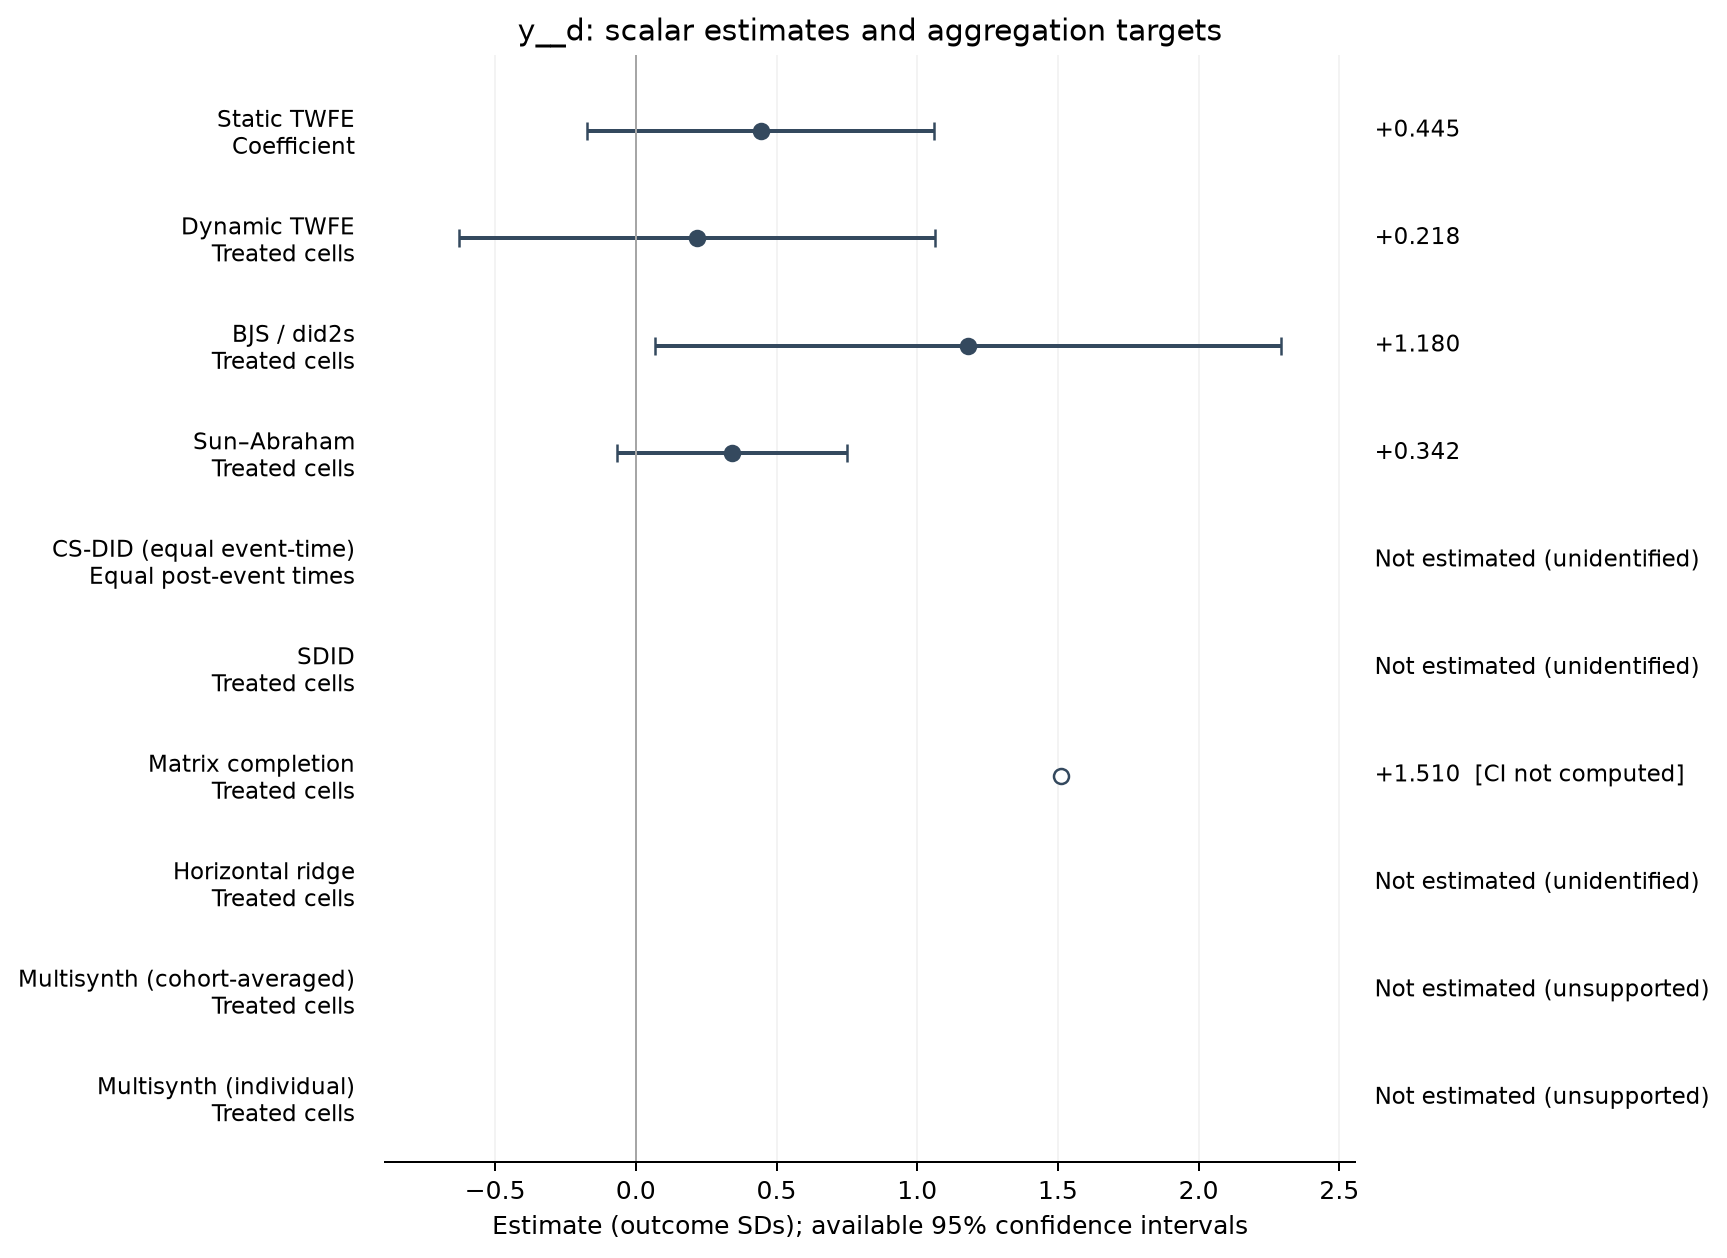
| Estimator | Estimate (SDs) | SE | 95% CI | Averaging |
|---|---|---|---|---|
| Static TWFE | 0.445 | 0.289 | [-0.172, 1.061] | Coefficient |
| Dynamic TWFE | 0.218 | 0.397 | [-0.628, 1.064] | Treated cells |
| BJS / did2s | 1.180 | 0.522 | [0.067, 2.293] | Treated cells |
| Sun–Abraham | 0.342 | 0.192 | [-0.068, 0.751] | Treated cells |
| Matrix completion | 1.510 | — | — | Treated cells |
Event studies
Periods −10 to +10; pointwise 95% intervals where available.
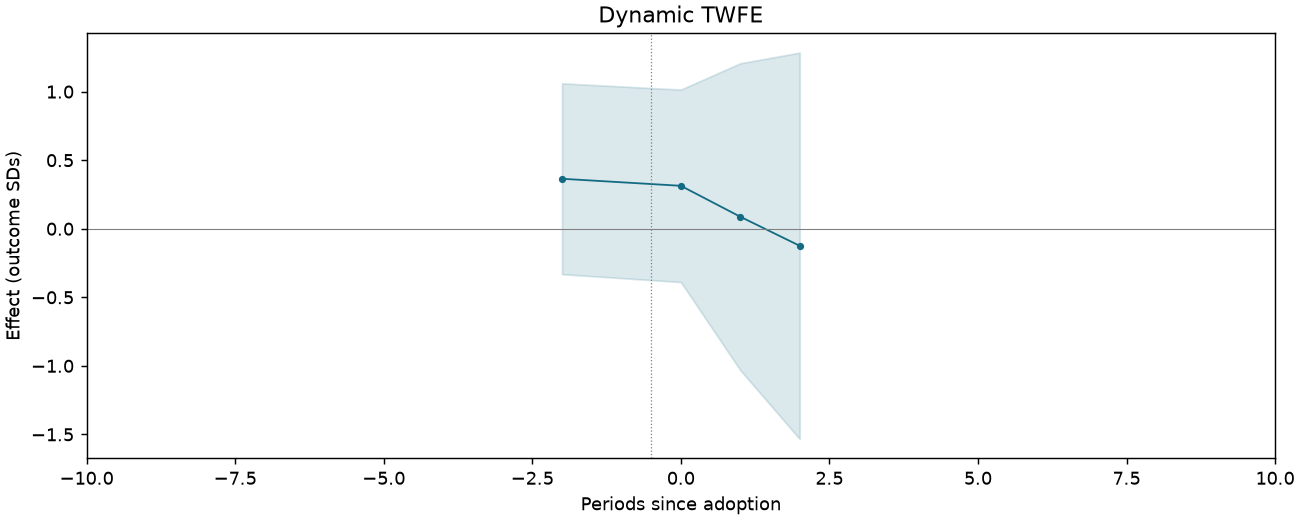
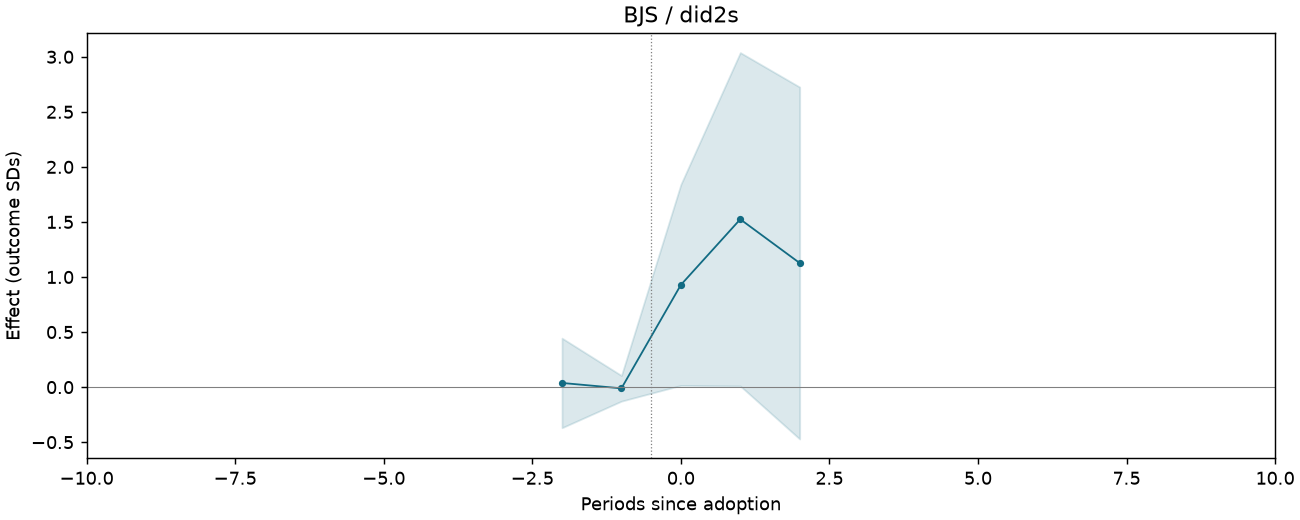
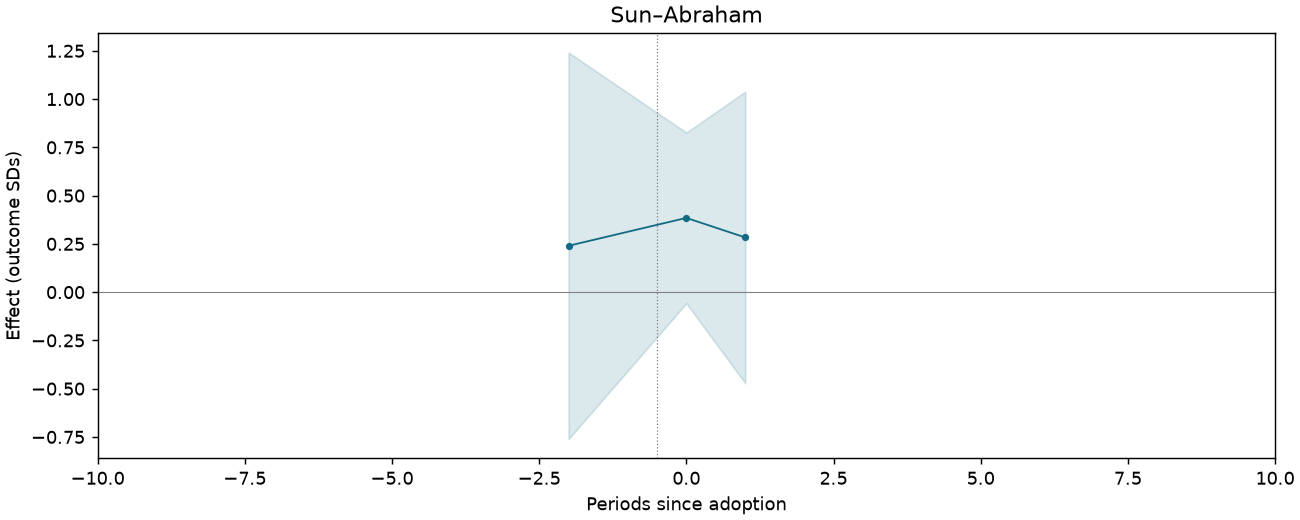
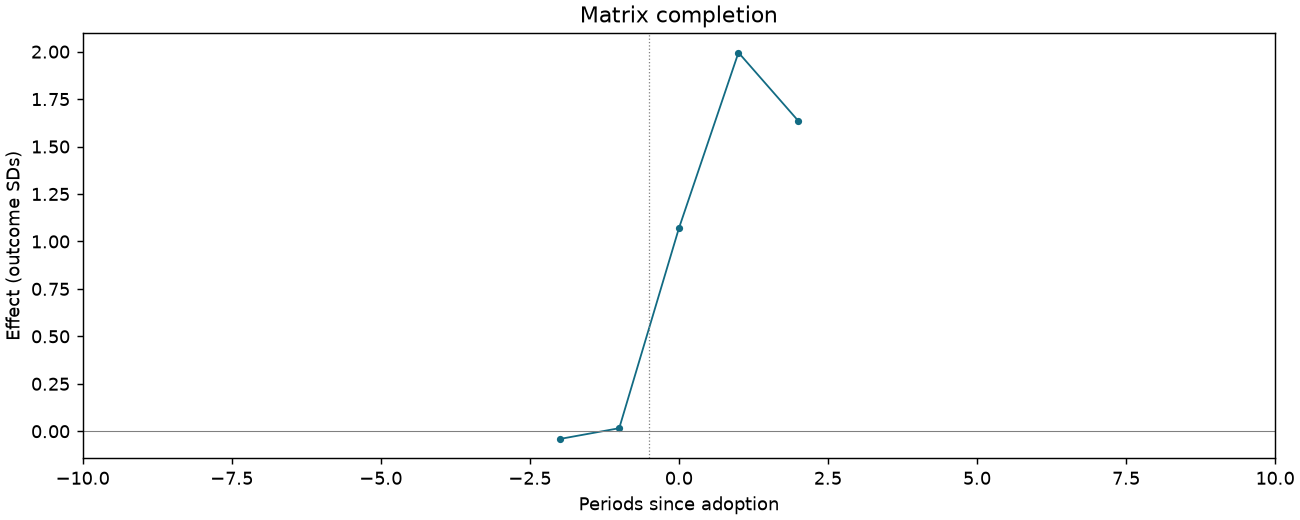
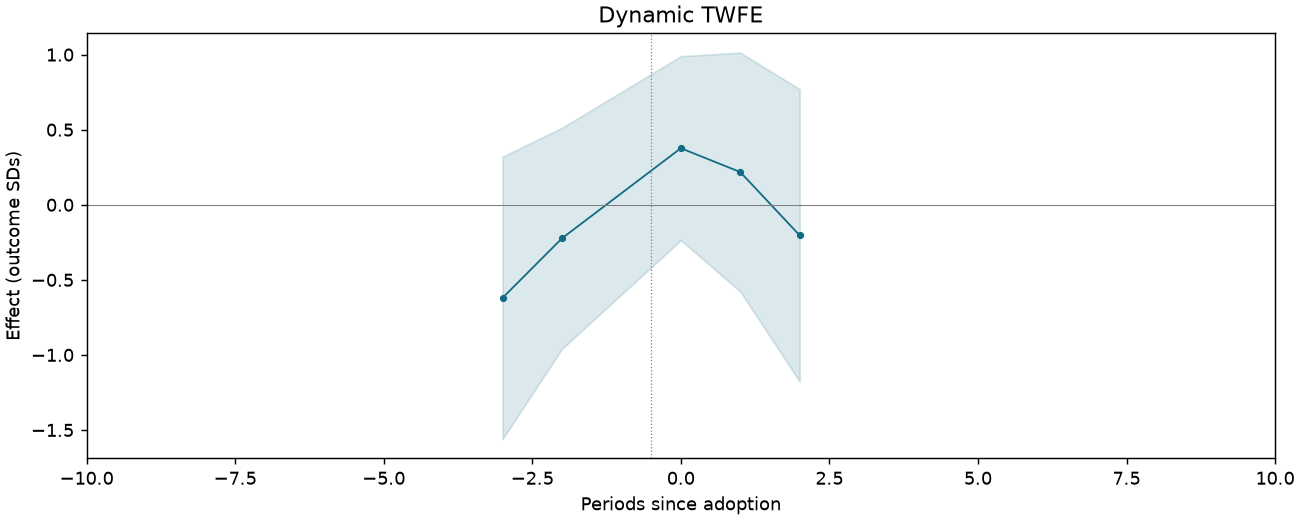
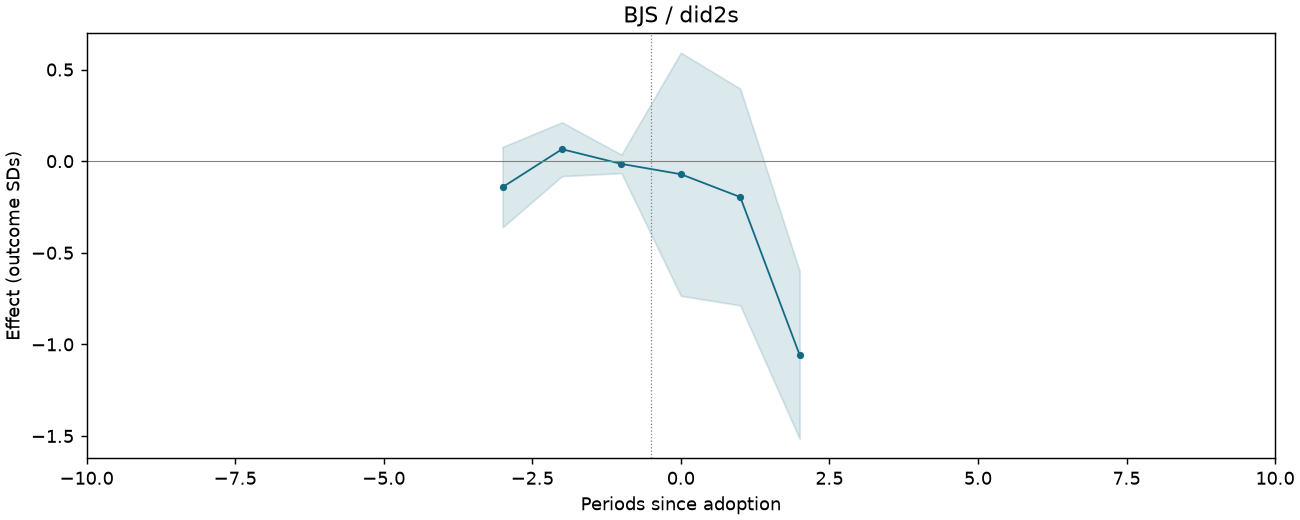
Ethnic identity z-score index [follow-up survey sample]
187 observations · 16 units · 16 clusters · 10 treated / 6 control units.
Estimate comparison
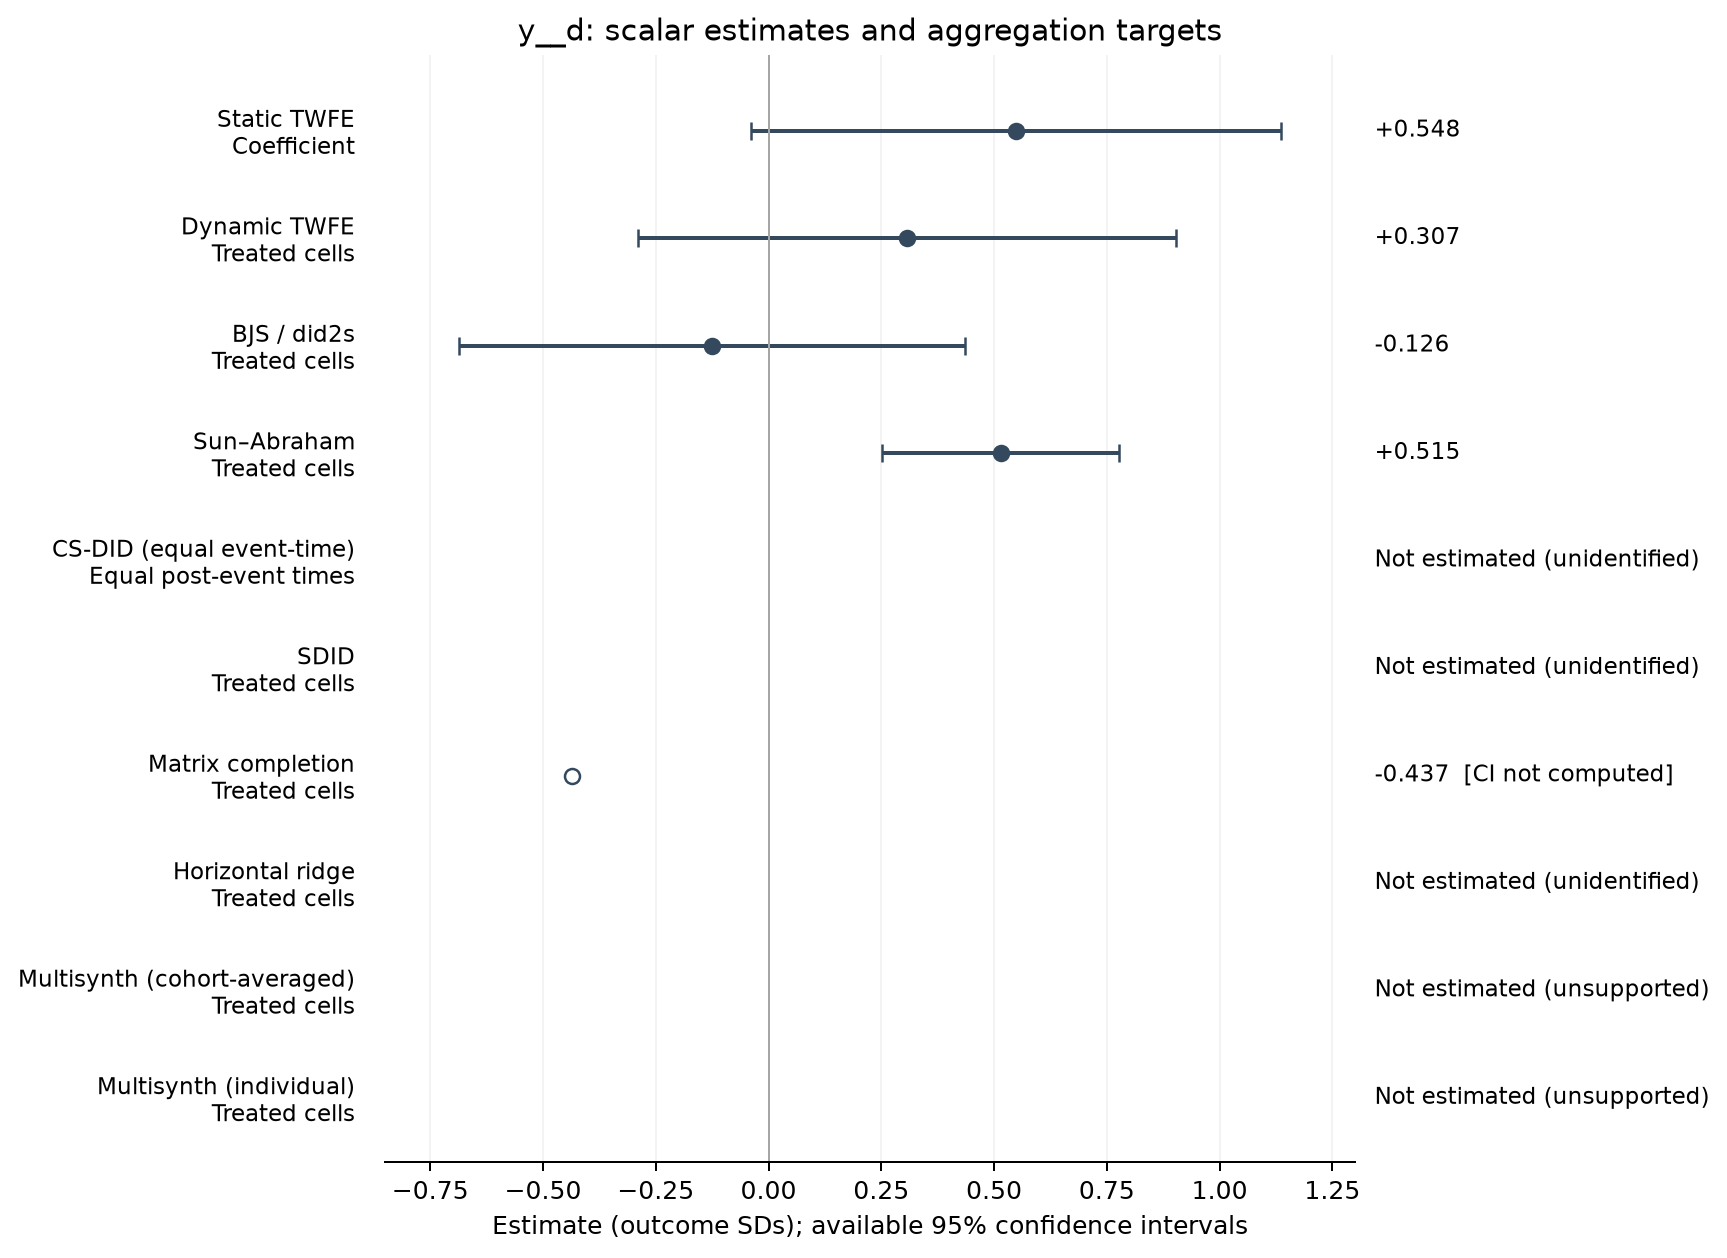
| Estimator | Estimate (SDs) | SE | 95% CI | Averaging |
|---|---|---|---|---|
| Static TWFE | 0.548 | 0.276 | [-0.040, 1.137] | Coefficient |
| Dynamic TWFE | 0.307 | 0.280 | [-0.289, 0.904] | Treated cells |
| BJS / did2s | -0.126 | 0.263 | [-0.686, 0.435] | Treated cells |
| Sun–Abraham | 0.515 | 0.123 | [0.252, 0.777] | Treated cells |
| Matrix completion | -0.437 | — | — | Treated cells |
Event studies
Periods −10 to +10; pointwise 95% intervals where available.
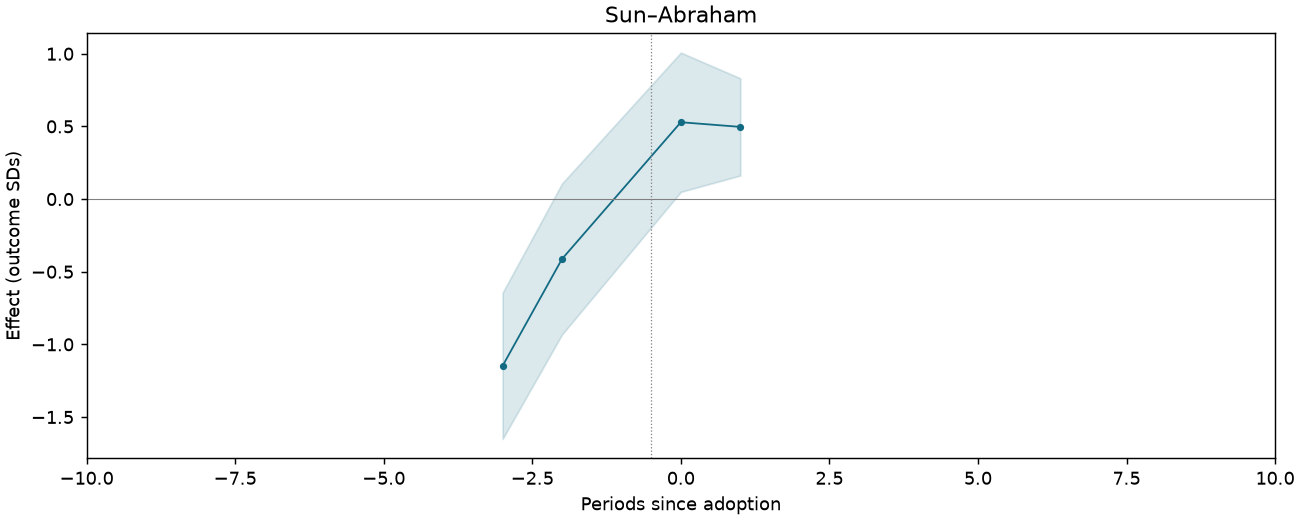
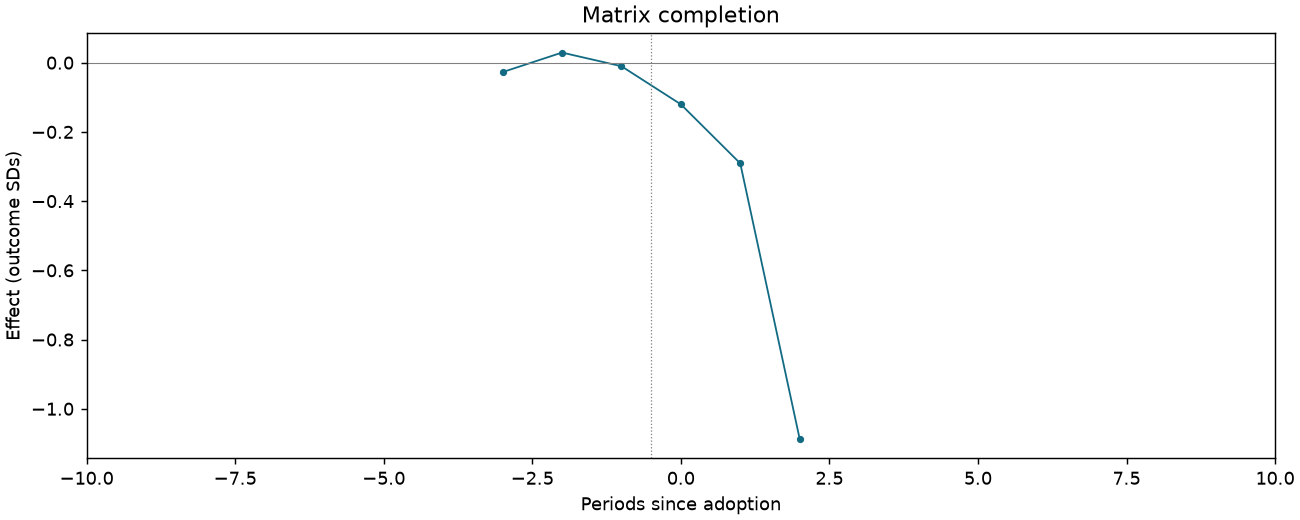
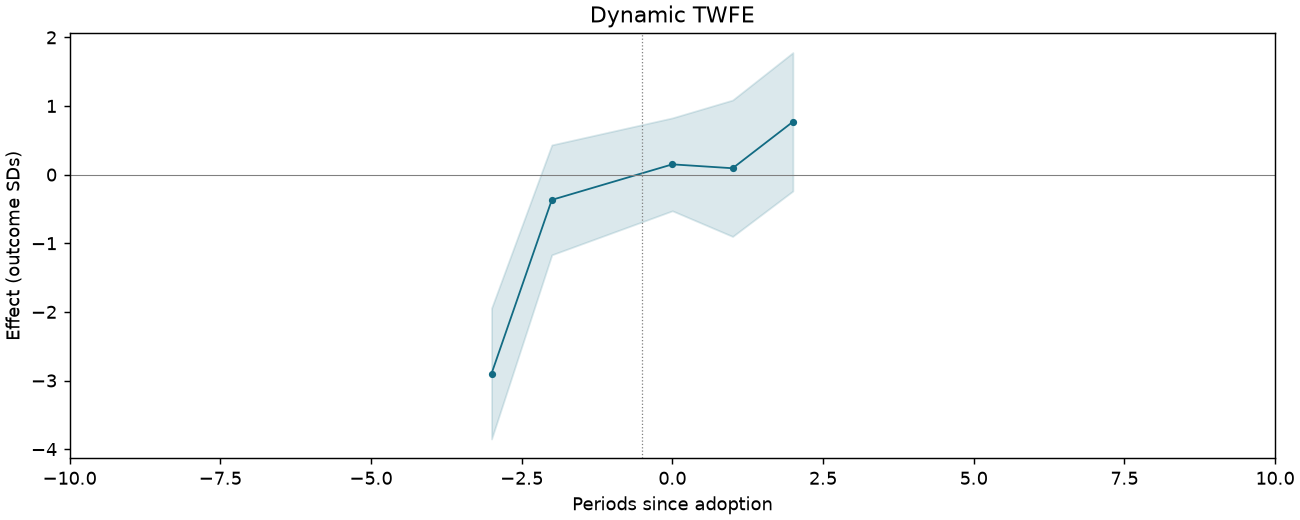
Identity: Chinese [follow-up survey sample]
191 observations · 16 units · 16 clusters · 10 treated / 6 control units.
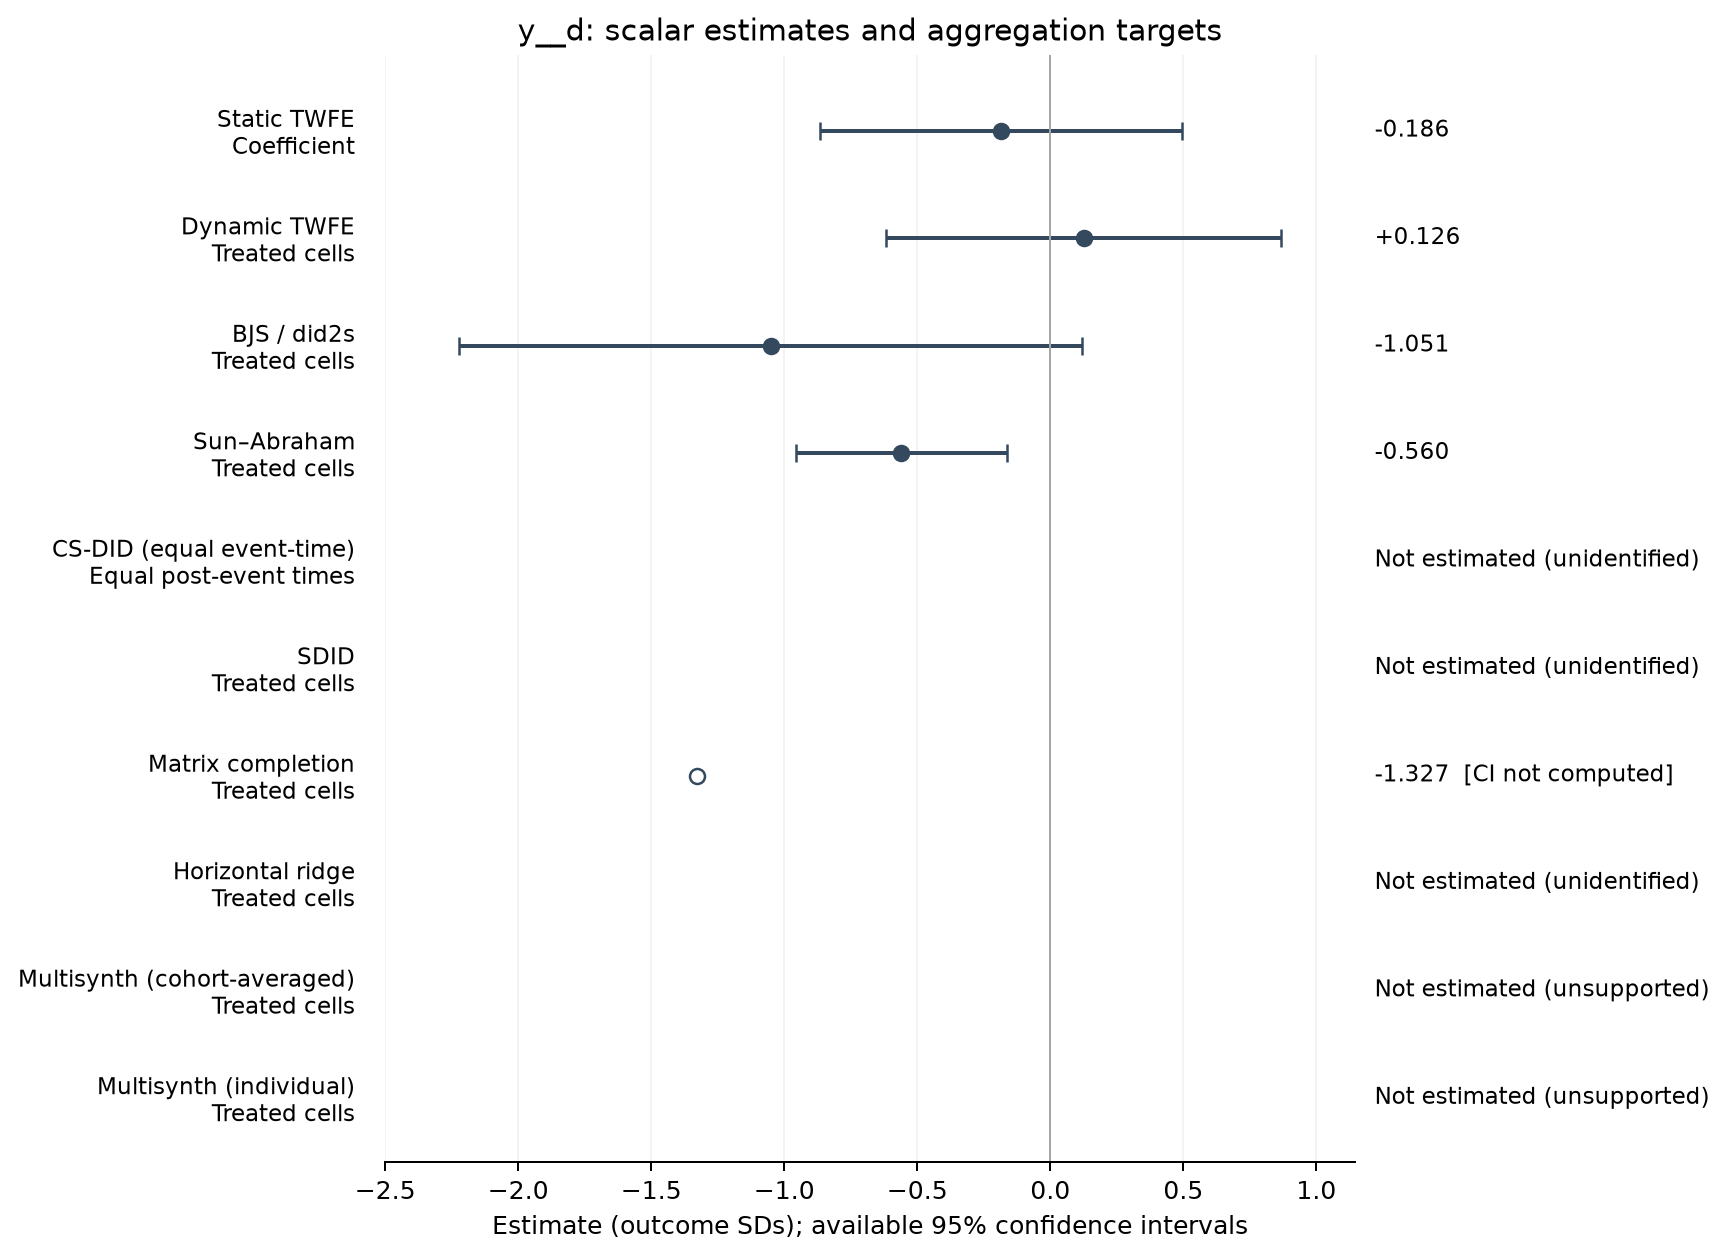
Estimate comparison
| Estimator | Estimate (SDs) | SE | 95% CI | Averaging |
|---|---|---|---|---|
| Static TWFE | -0.186 | 0.319 | [-0.867, 0.494] | Coefficient |
| Dynamic TWFE | 0.126 | 0.348 | [-0.616, 0.868] | Treated cells |
| BJS / did2s | -1.051 | 0.550 | [-2.223, 0.121] | Treated cells |
| Sun–Abraham | -0.560 | 0.186 | [-0.955, -0.164] | Treated cells |
| Matrix completion | -1.327 | — | — | Treated cells |
Event studies
Periods −10 to +10; pointwise 95% intervals where available.
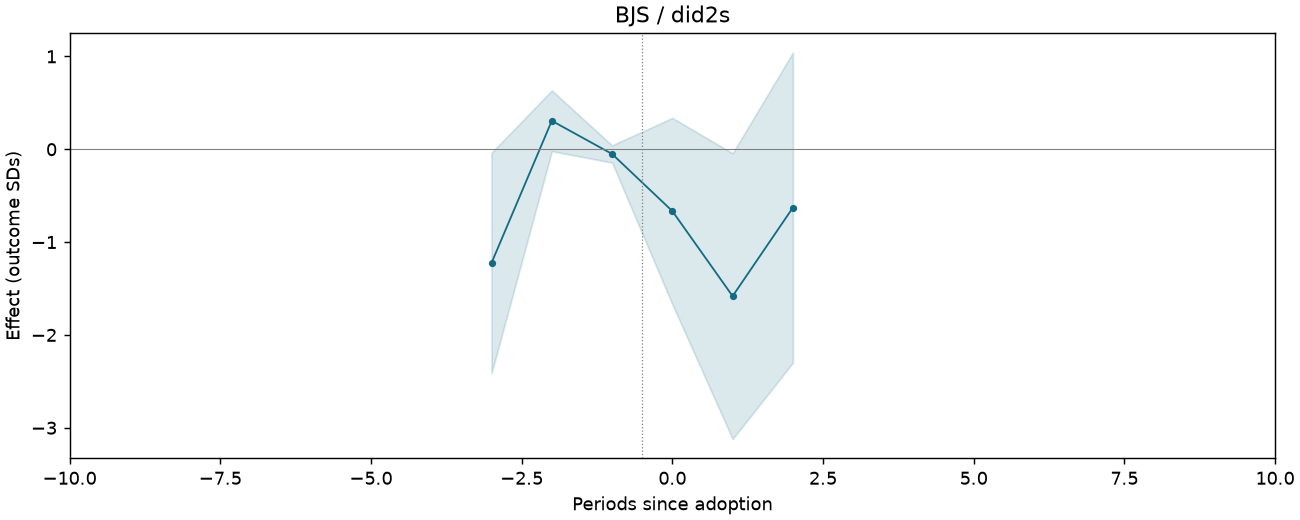
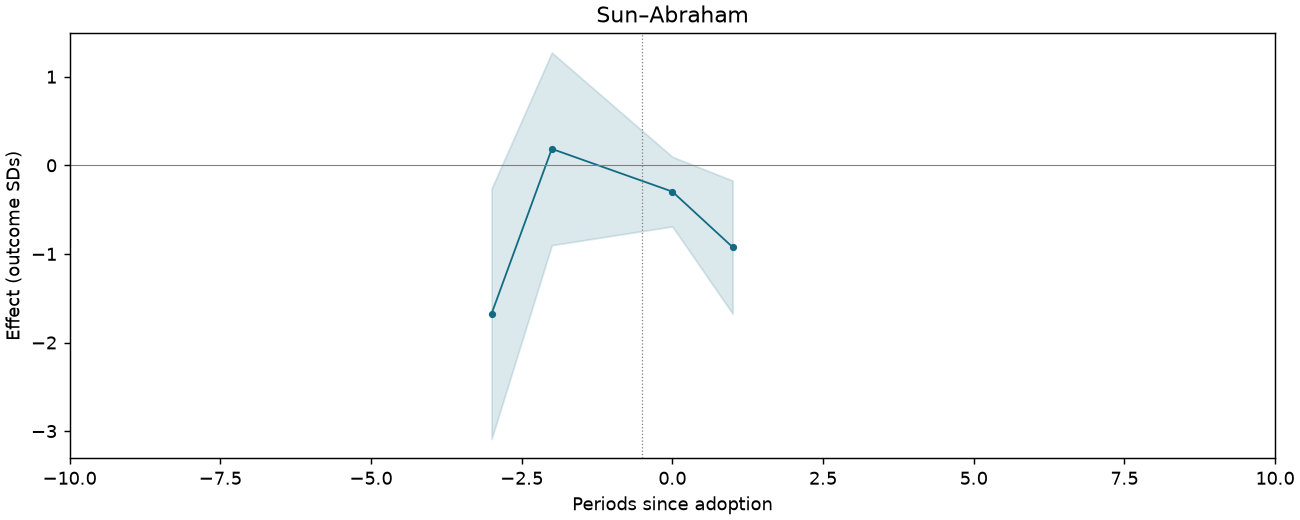
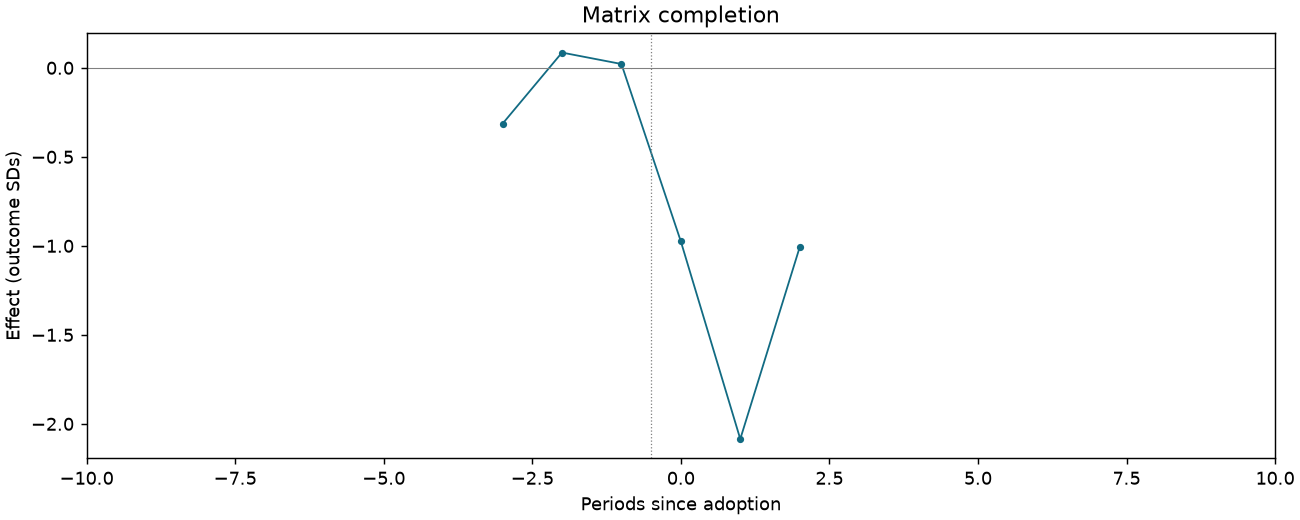
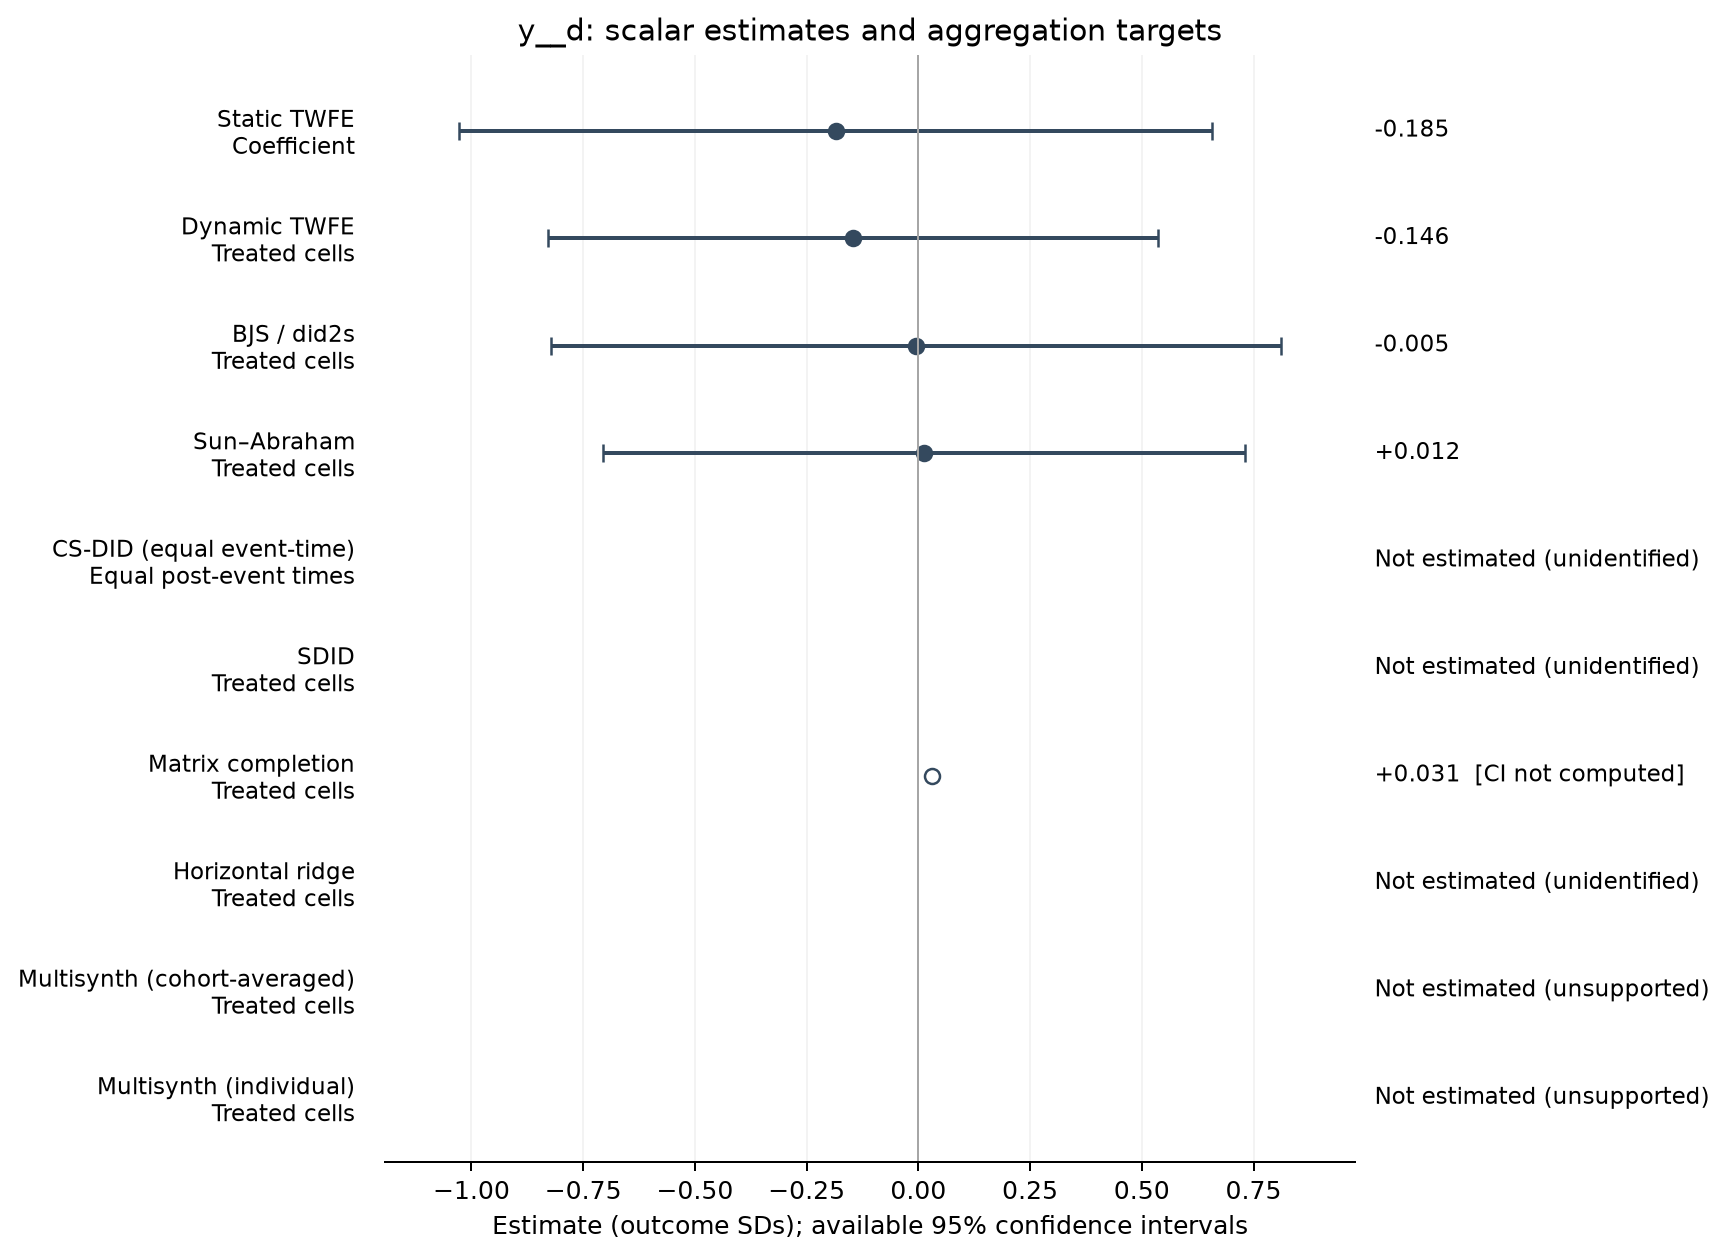
Attitudes about environment z-score index [follow-up survey sample]
191 observations · 16 units · 16 clusters · 10 treated / 6 control units.
Estimate comparison
| Estimator | Estimate (SDs) | SE | 95% CI | Averaging |
|---|---|---|---|---|
| Static TWFE | -0.185 | 0.395 | [-1.028, 0.657] | Coefficient |
| Dynamic TWFE | -0.146 | 0.321 | [-0.829, 0.537] | Treated cells |
| BJS / did2s | -0.005 | 0.383 | [-0.822, 0.812] | Treated cells |
| Sun–Abraham | 0.012 | 0.337 | [-0.707, 0.731] | Treated cells |
| Matrix completion | 0.031 | — | — | Treated cells |
Event studies
Periods −10 to +10; pointwise 95% intervals where available.
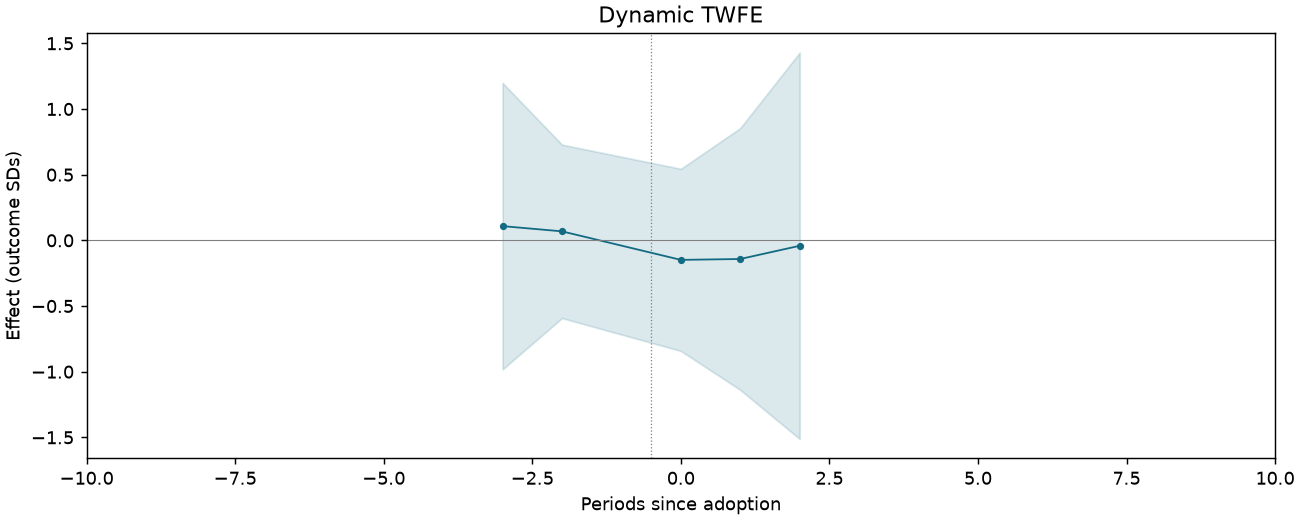
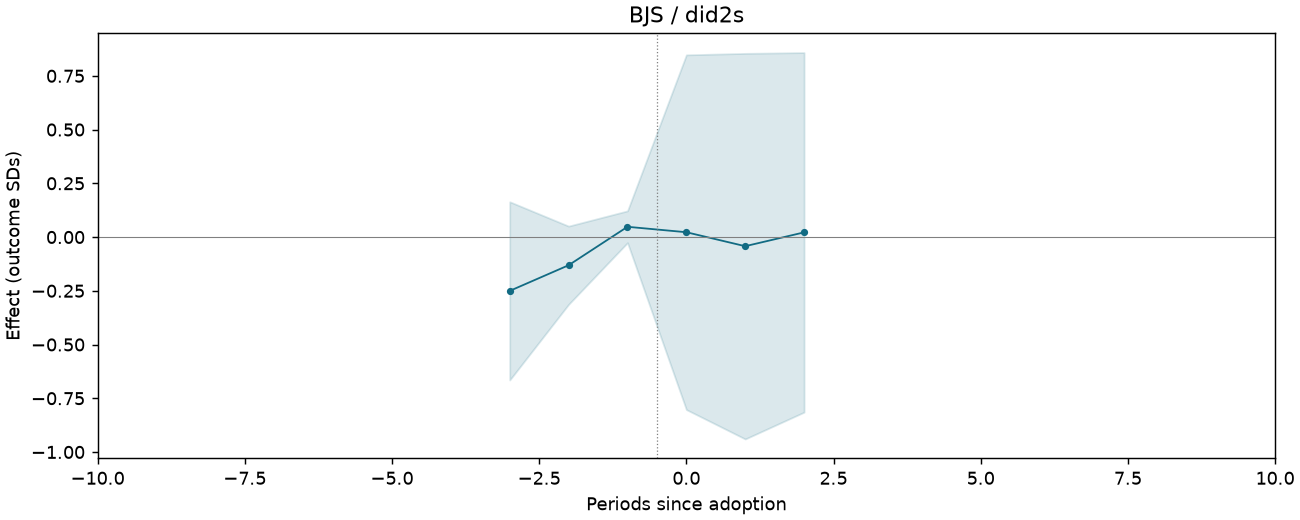
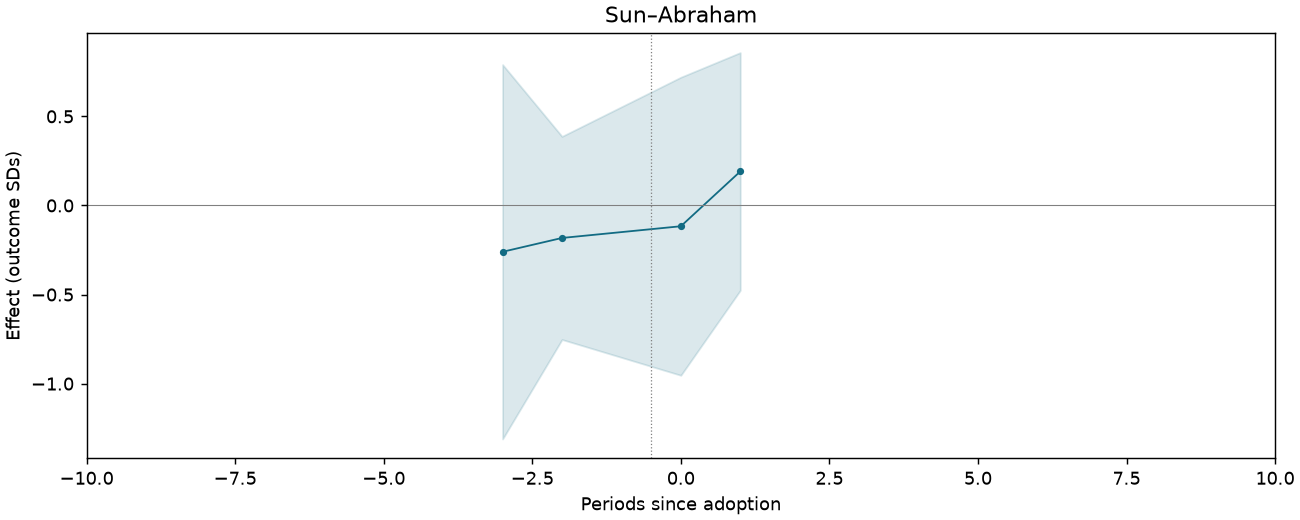
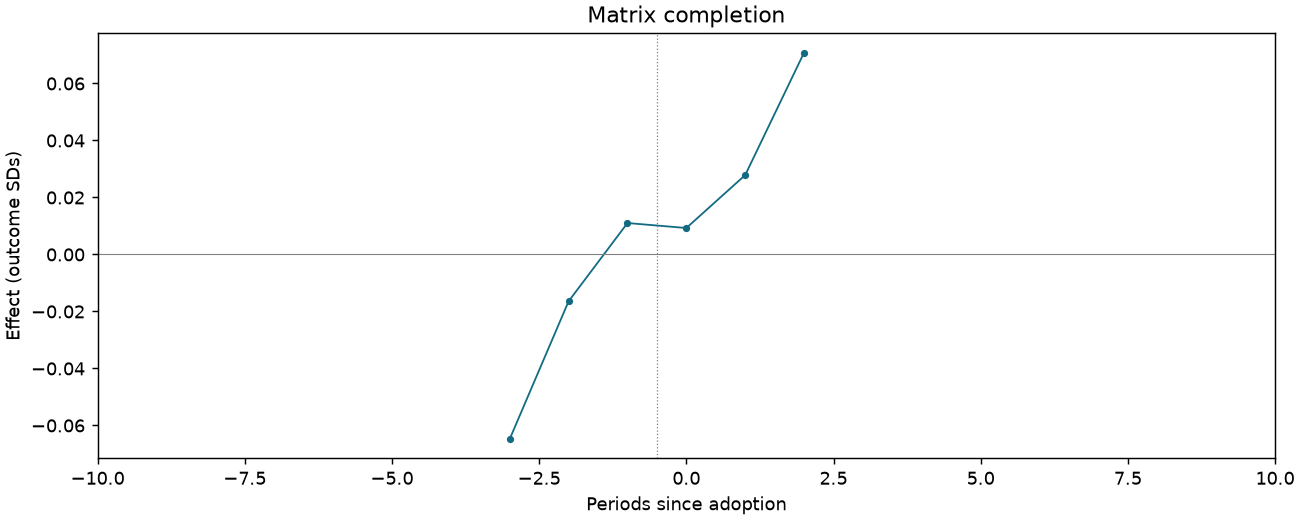
Political behavior z-score index [follow-up survey sample]
178 observations · 15 units · 15 clusters · 9 treated / 6 control units.
Estimate comparison
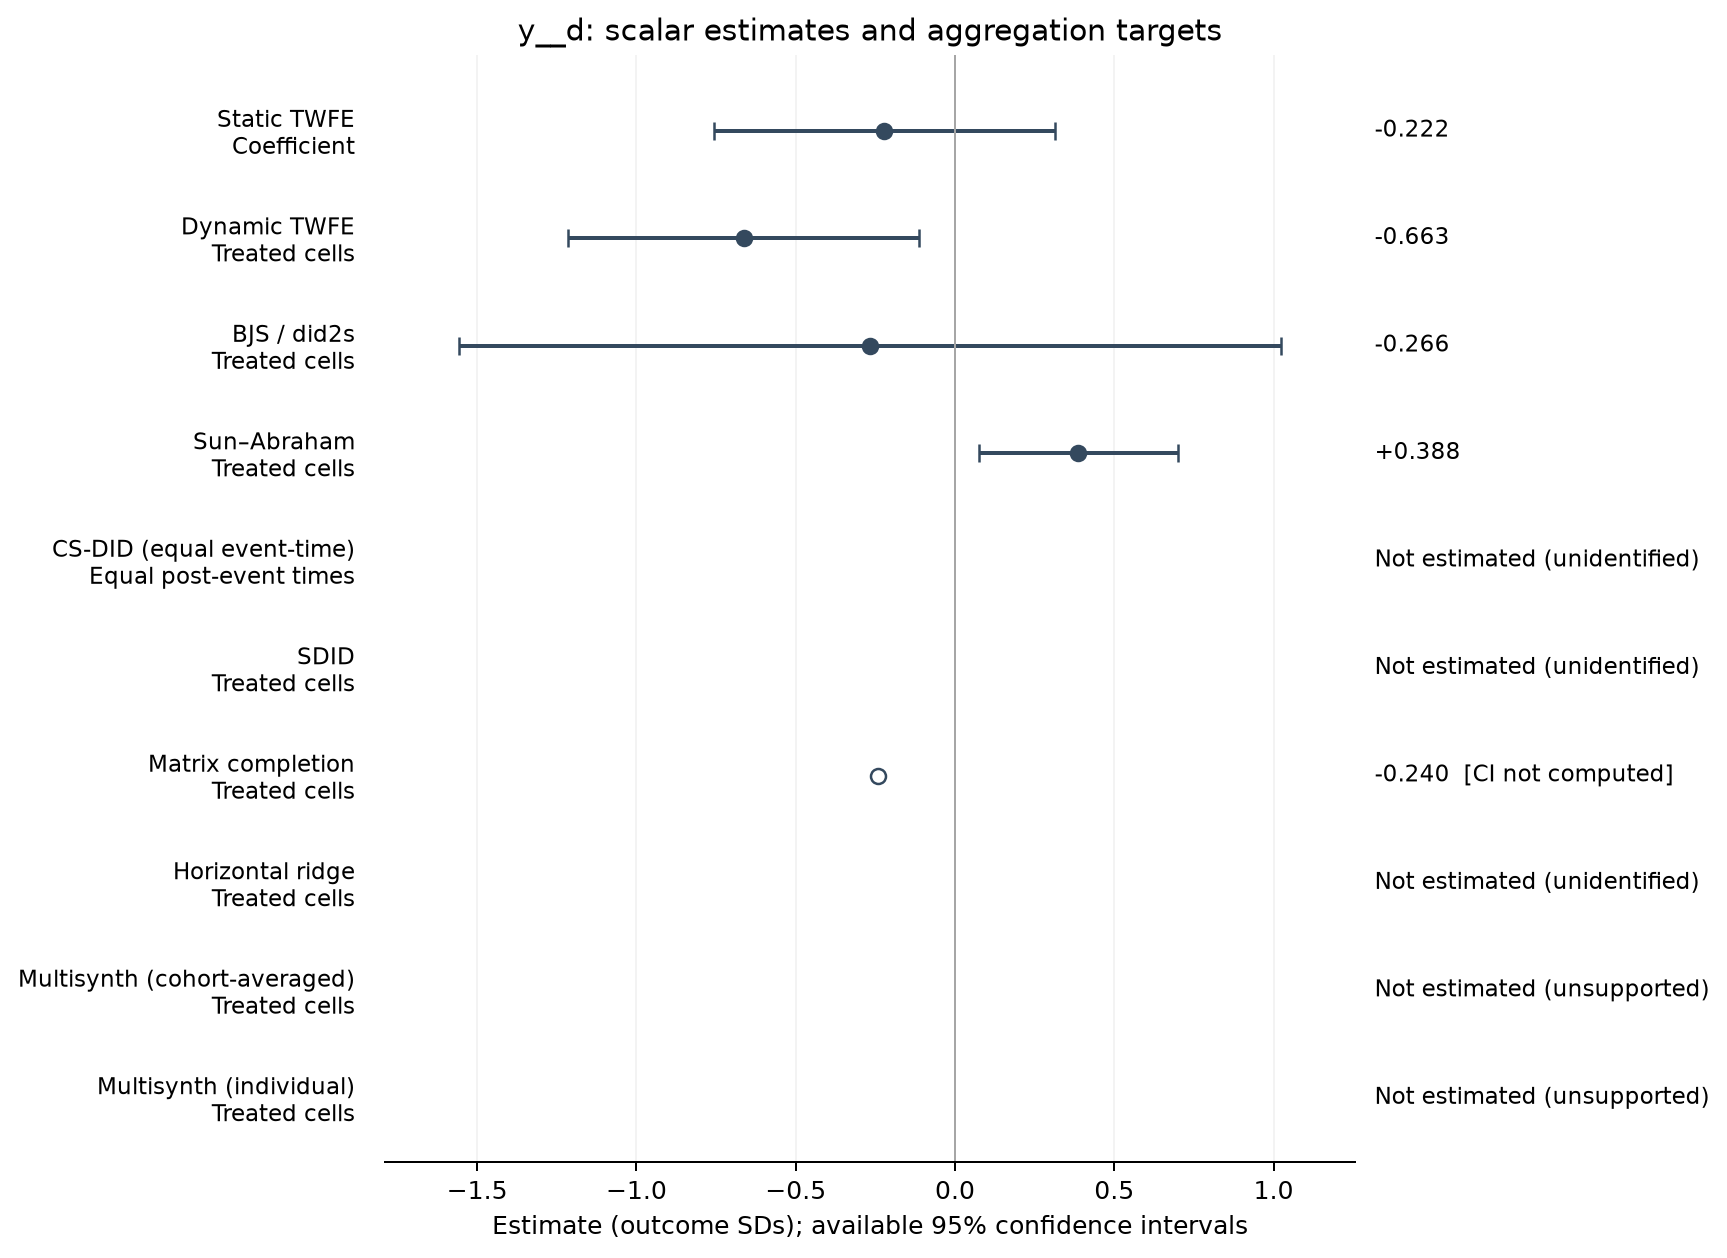
| Estimator | Estimate (SDs) | SE | 95% CI | Averaging |
|---|---|---|---|---|
| Static TWFE | -0.222 | 0.249 | [-0.757, 0.313] | Coefficient |
| Dynamic TWFE | -0.663 | 0.257 | [-1.214, -0.112] | Treated cells |
| BJS / did2s | -0.266 | 0.602 | [-1.557, 1.024] | Treated cells |
| Sun–Abraham | 0.388 | 0.146 | [0.075, 0.700] | Treated cells |
| Matrix completion | -0.240 | — | — | Treated cells |
Event studies
Periods −10 to +10; pointwise 95% intervals where available.
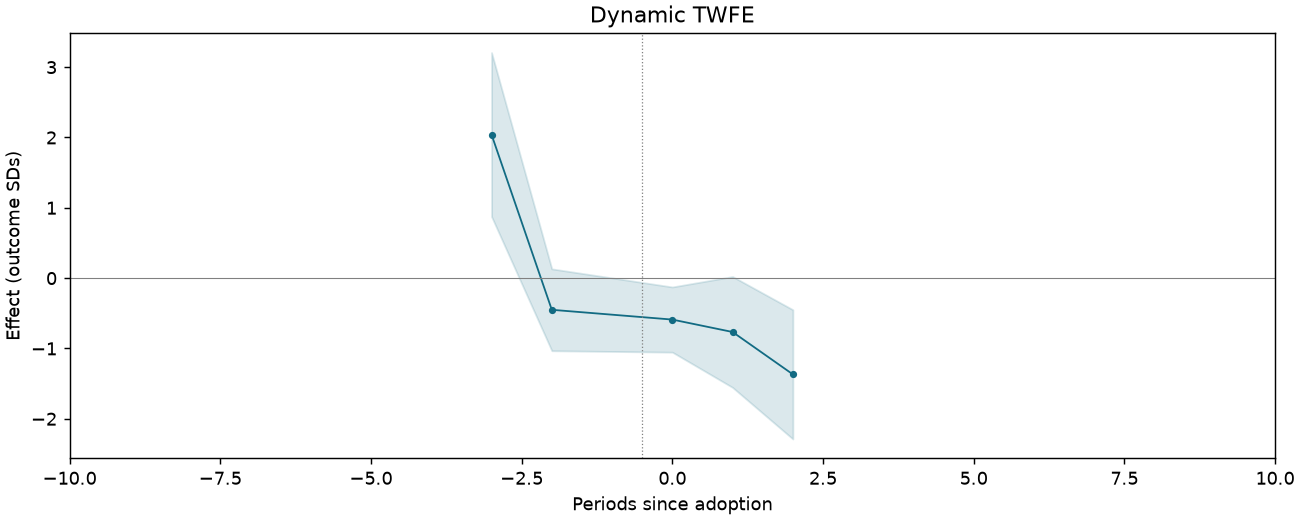
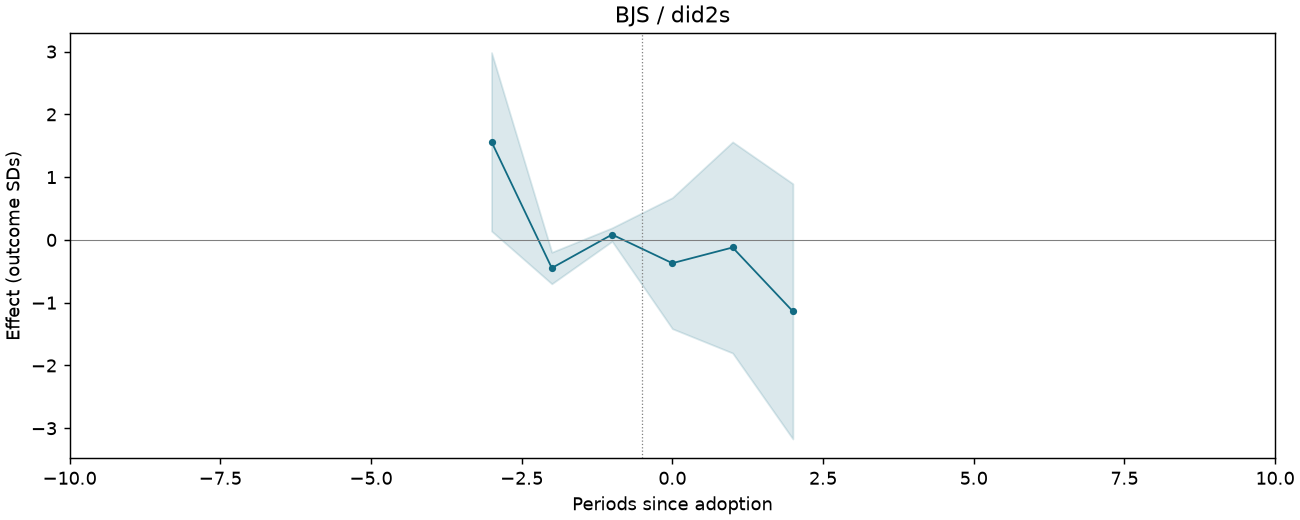
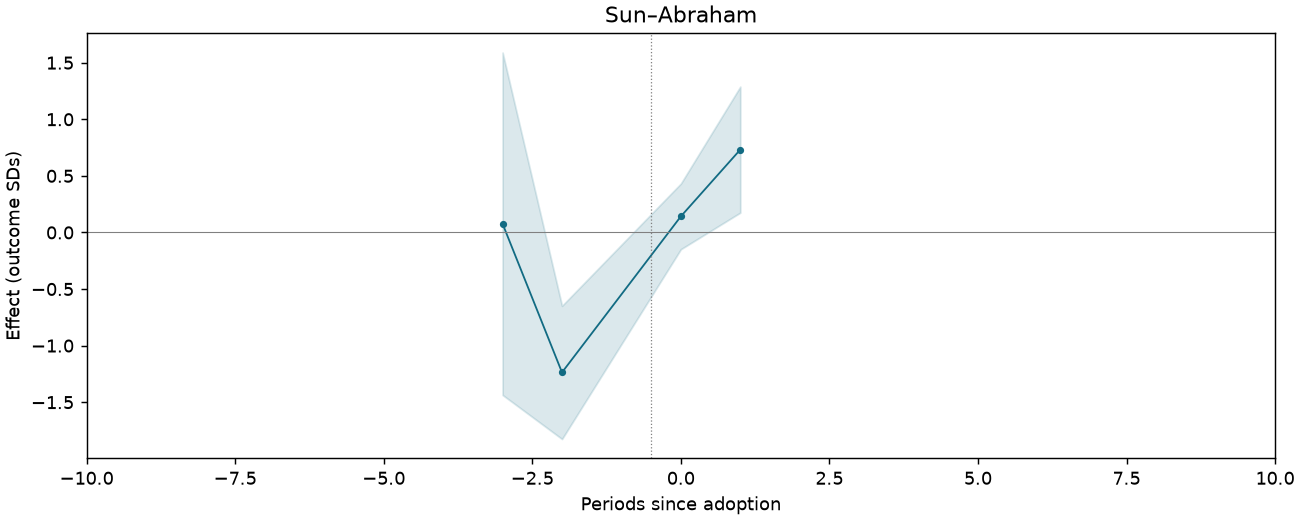
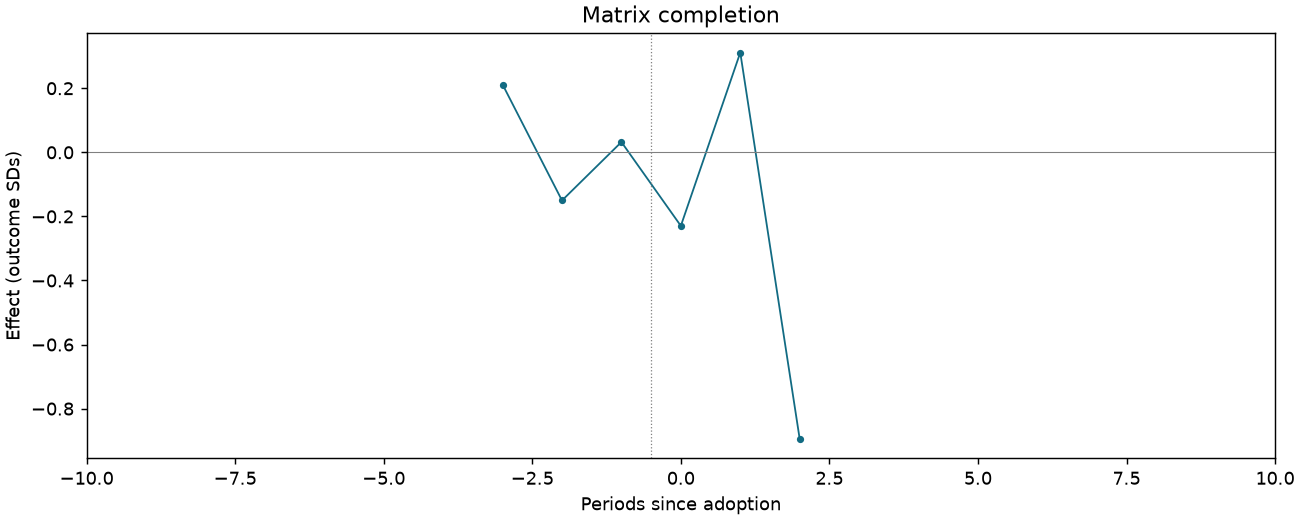
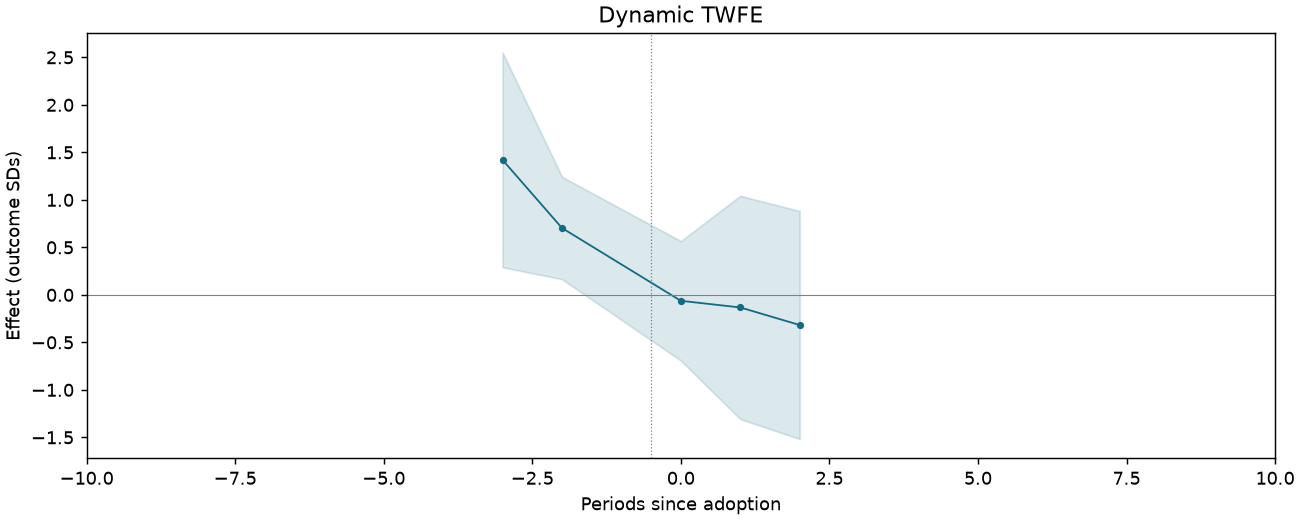
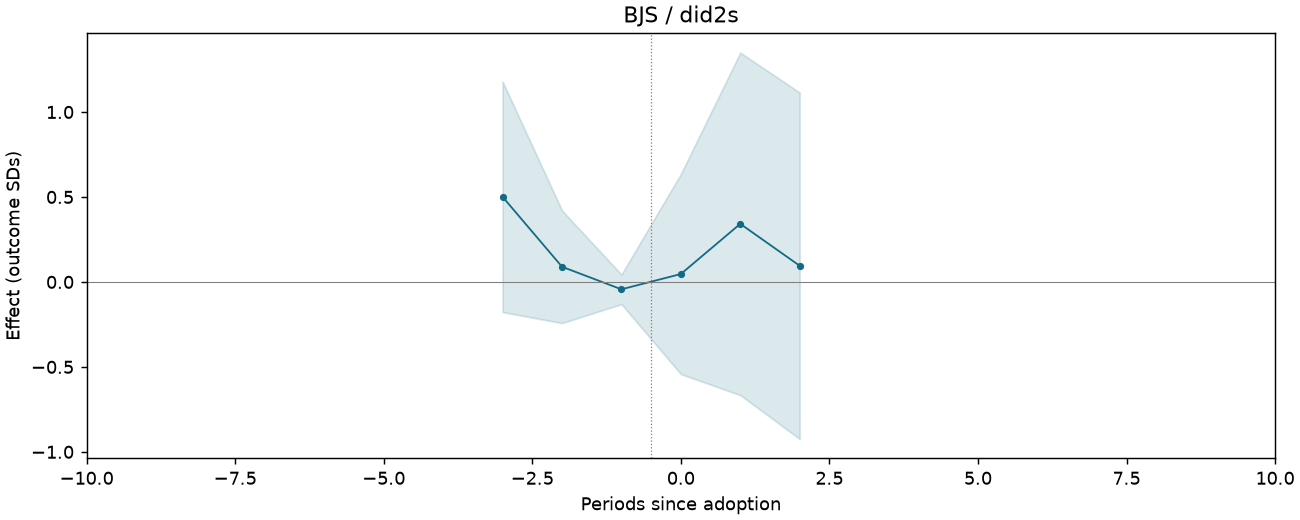
Avoiding risky investment z-score index [follow-up survey sample]
191 observations · 16 units · 16 clusters · 10 treated / 6 control units.
Estimate comparison
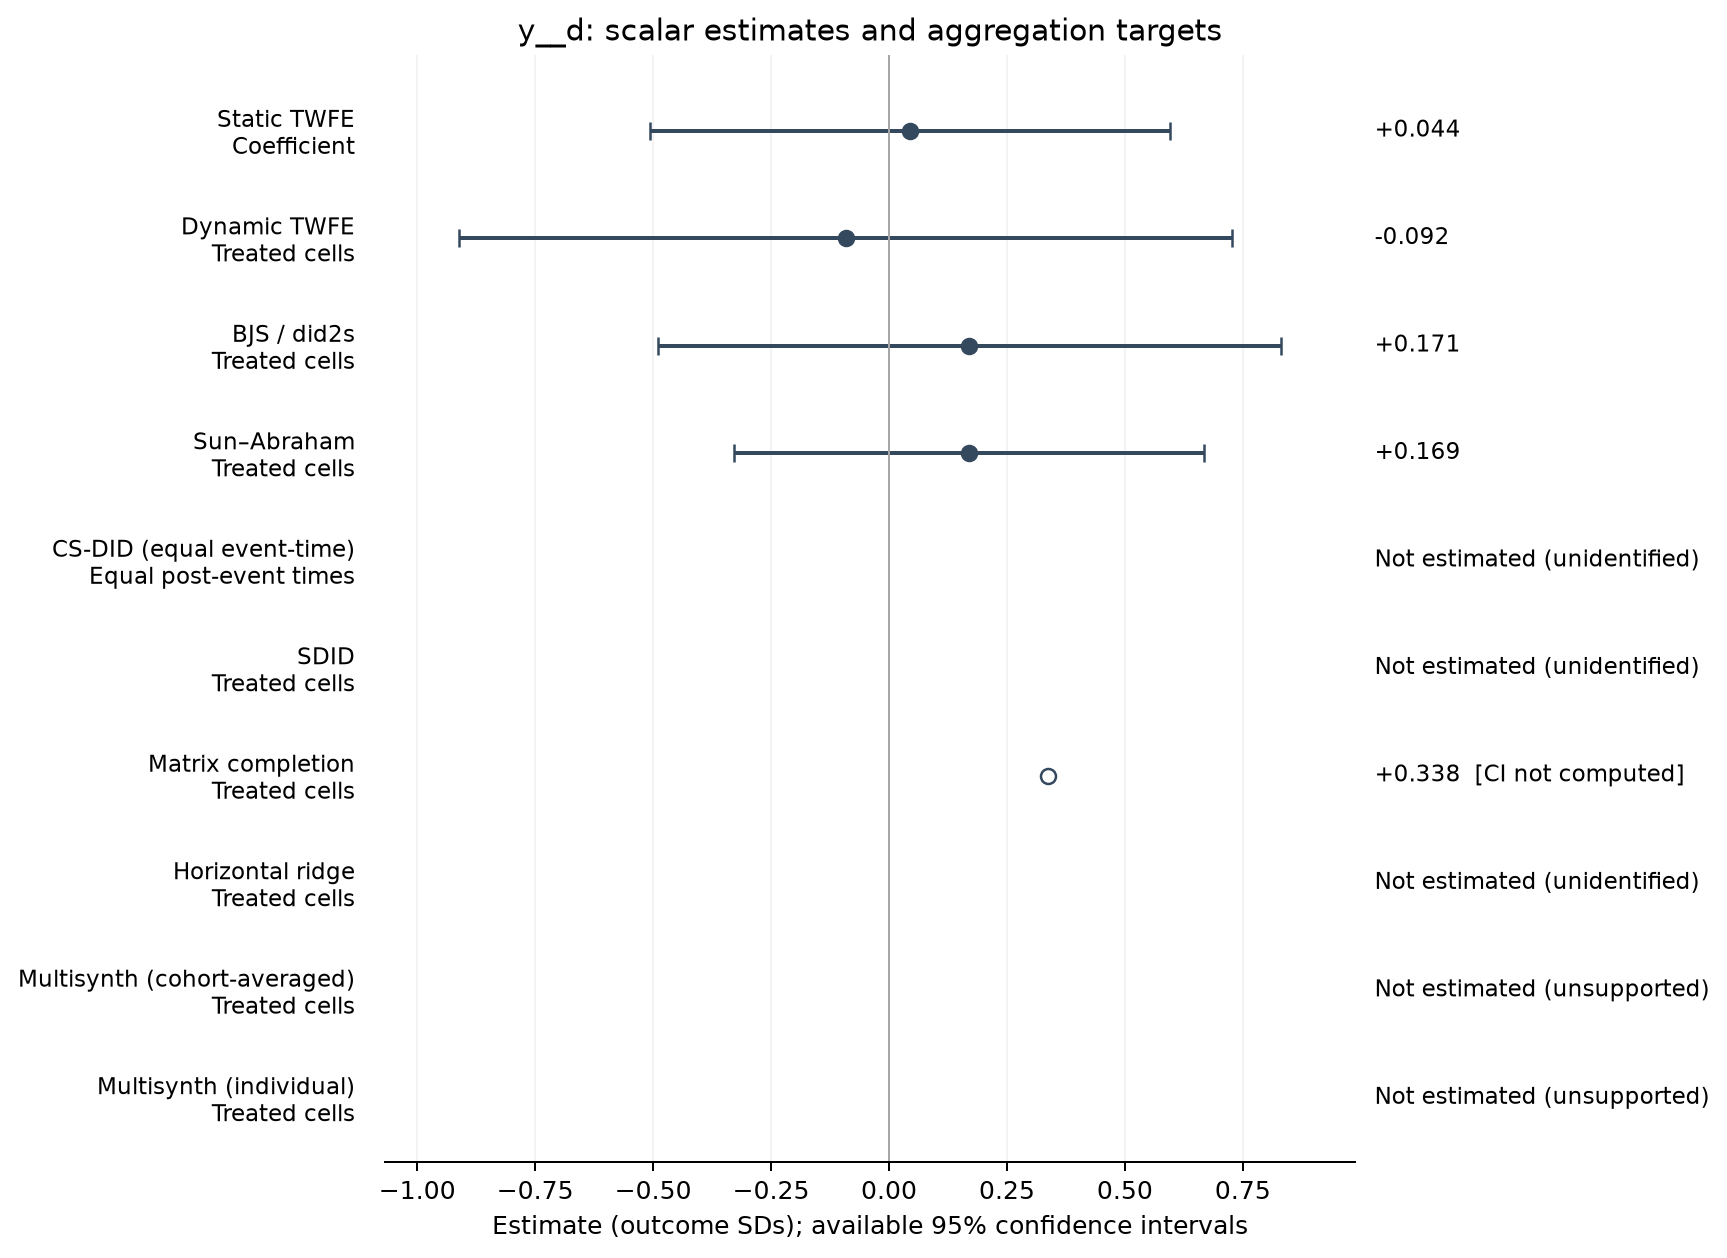
| Estimator | Estimate (SDs) | SE | 95% CI | Averaging |
|---|---|---|---|---|
| Static TWFE | 0.044 | 0.258 | [-0.506, 0.595] | Coefficient |
| Dynamic TWFE | -0.092 | 0.384 | [-0.911, 0.727] | Treated cells |
| BJS / did2s | 0.171 | 0.310 | [-0.490, 0.831] | Treated cells |
| Sun–Abraham | 0.169 | 0.234 | [-0.329, 0.667] | Treated cells |
| Matrix completion | 0.338 | — | — | Treated cells |
Event studies
Periods −10 to +10; pointwise 95% intervals where available.
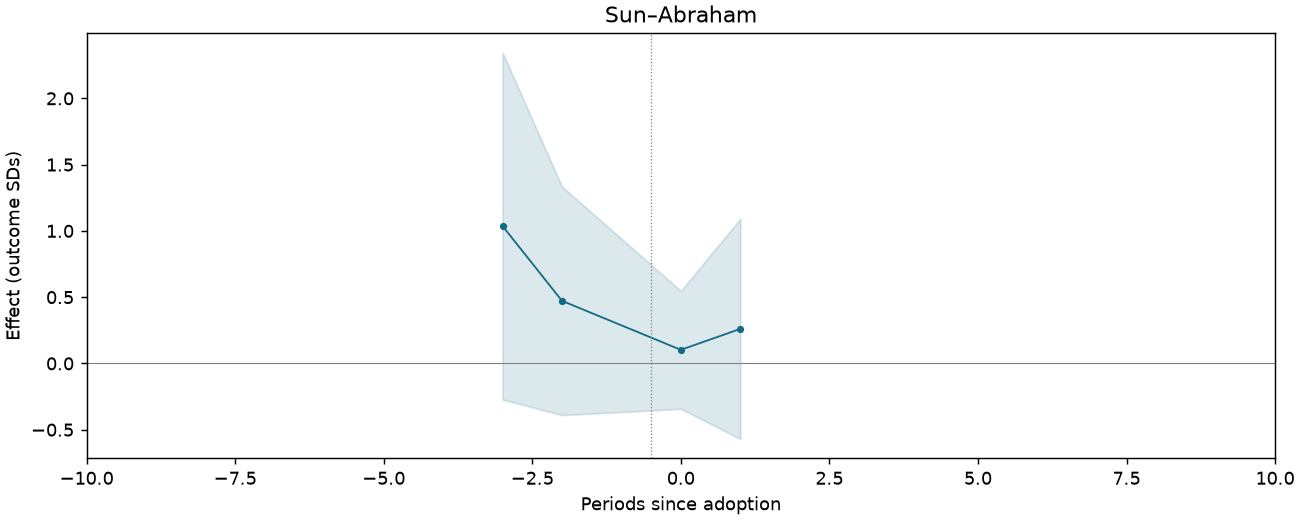
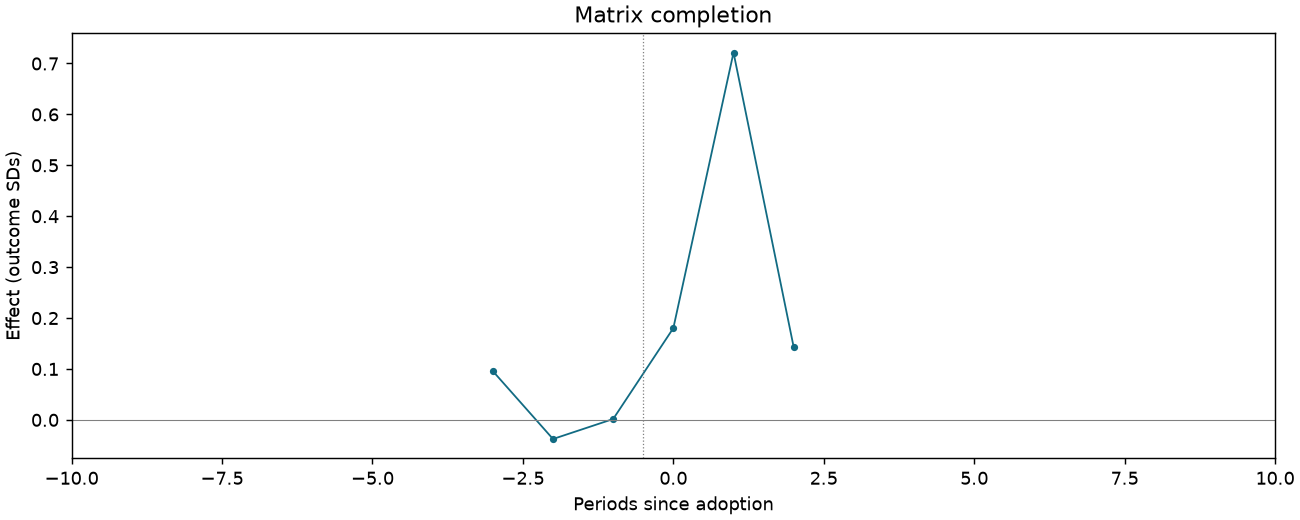
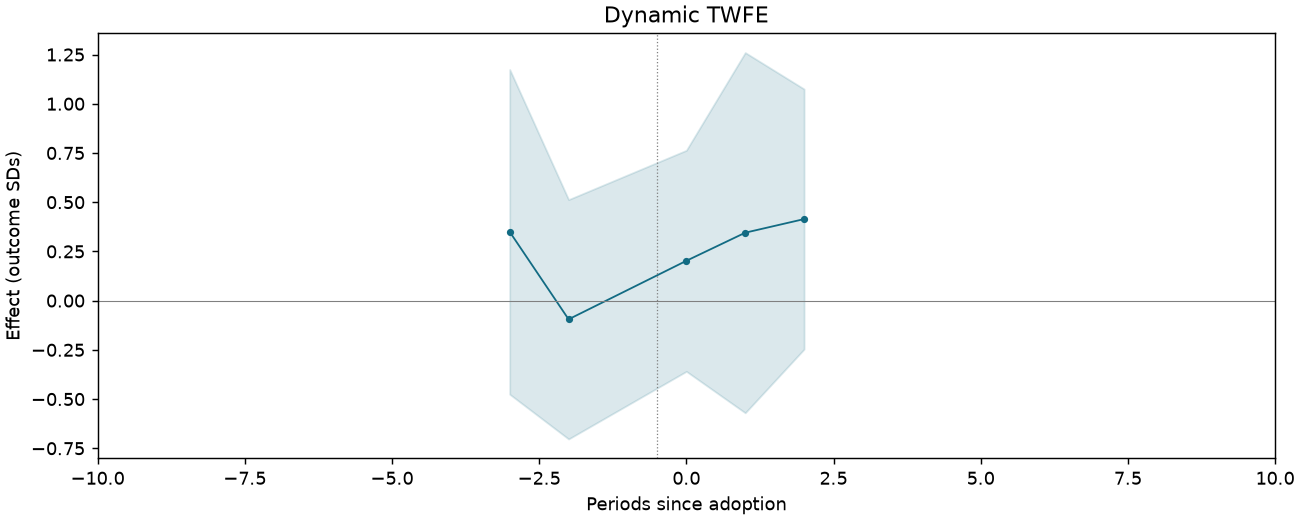
Cooperated with minority [follow-up survey sample]
190 observations · 16 units · 16 clusters · 10 treated / 6 control units.
Estimate comparison
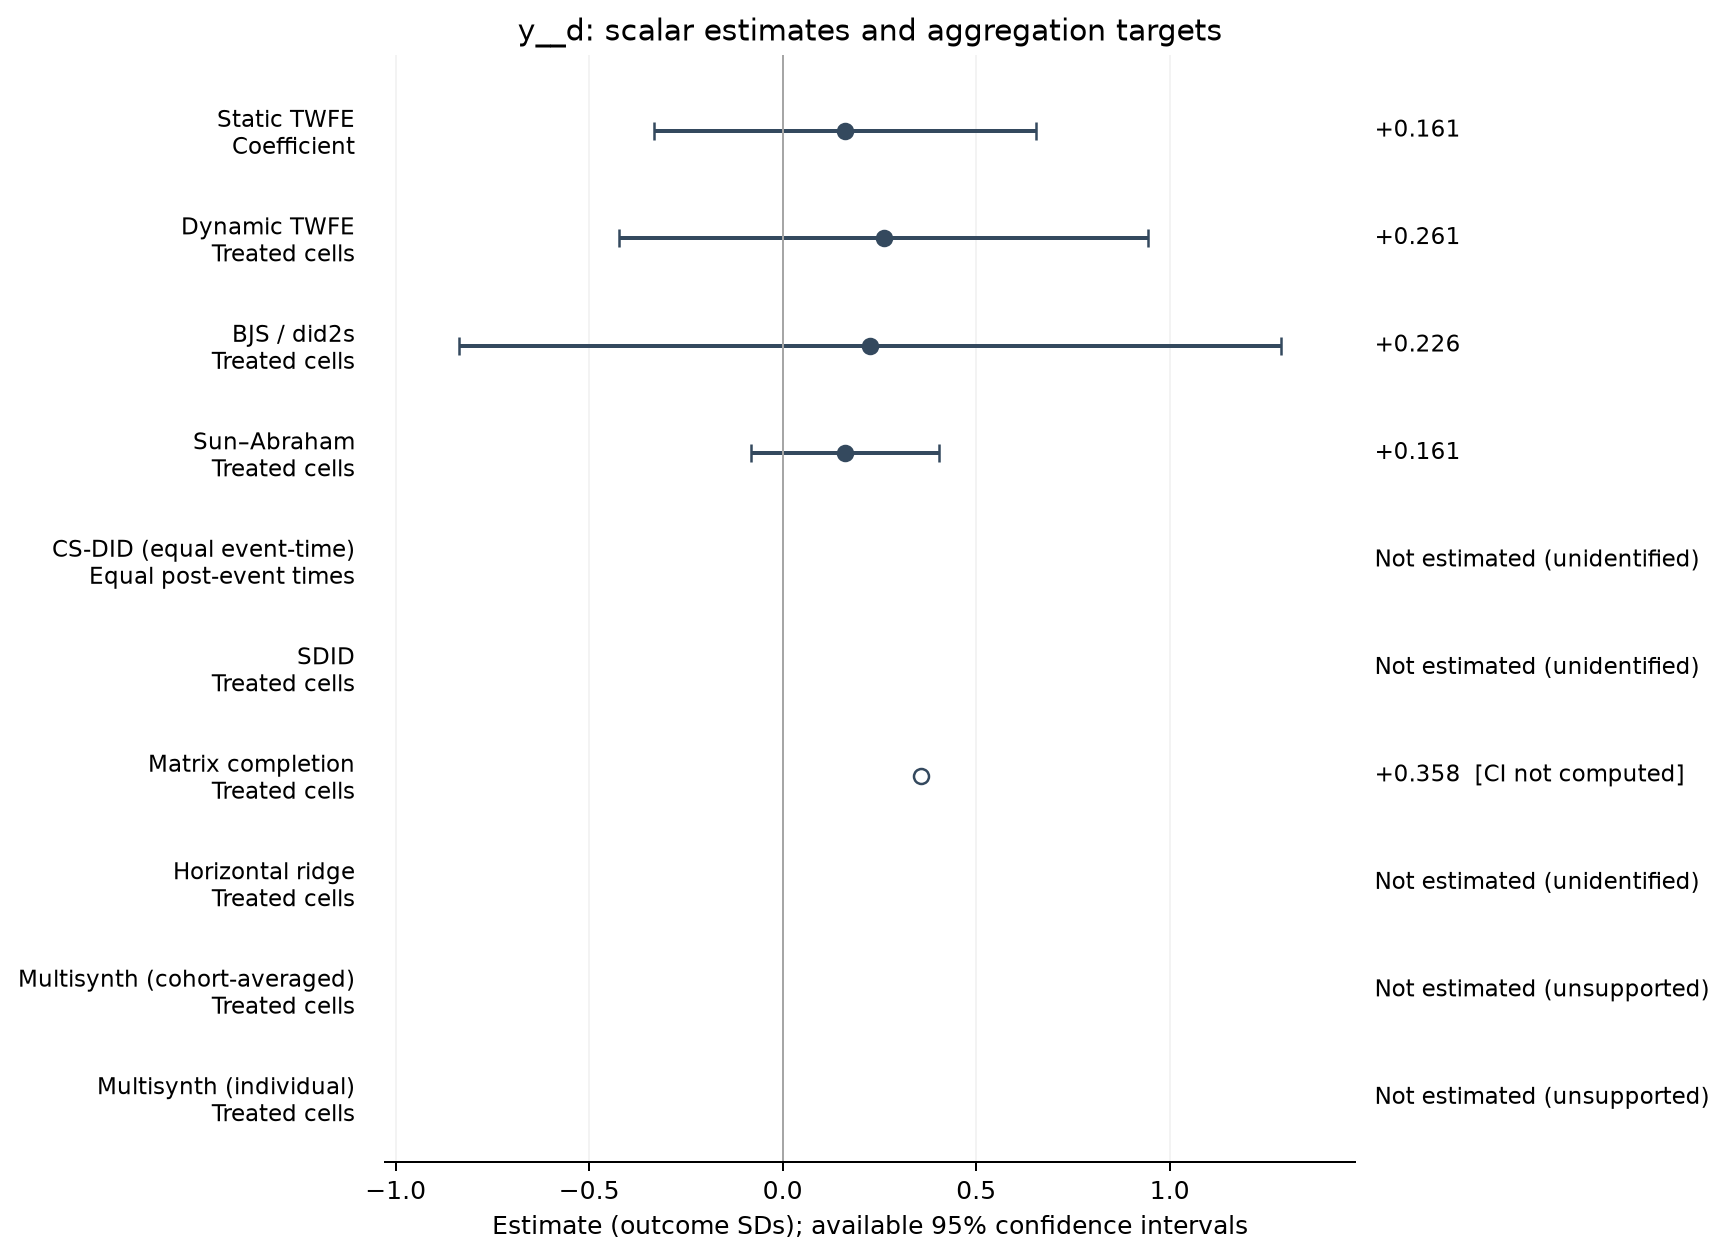
| Estimator | Estimate (SDs) | SE | 95% CI | Averaging |
|---|---|---|---|---|
| Static TWFE | 0.161 | 0.232 | [-0.333, 0.655] | Coefficient |
| Dynamic TWFE | 0.261 | 0.321 | [-0.422, 0.945] | Treated cells |
| BJS / did2s | 0.226 | 0.498 | [-0.836, 1.288] | Treated cells |
| Sun–Abraham | 0.161 | 0.113 | [-0.081, 0.403] | Treated cells |
| Matrix completion | 0.358 | — | — | Treated cells |
Event studies
Periods −10 to +10; pointwise 95% intervals where available.
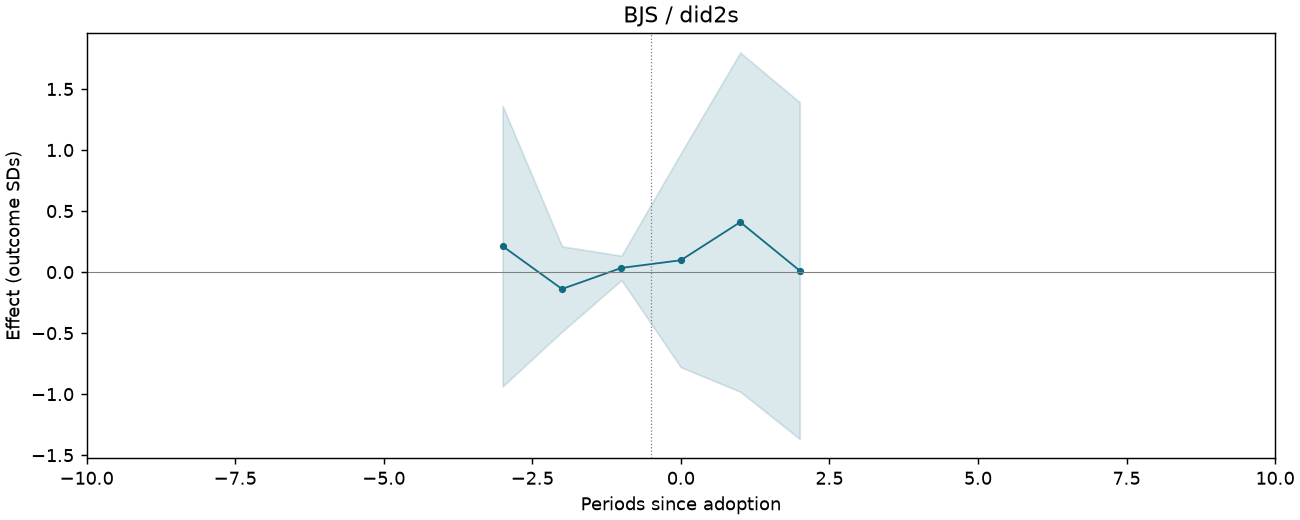
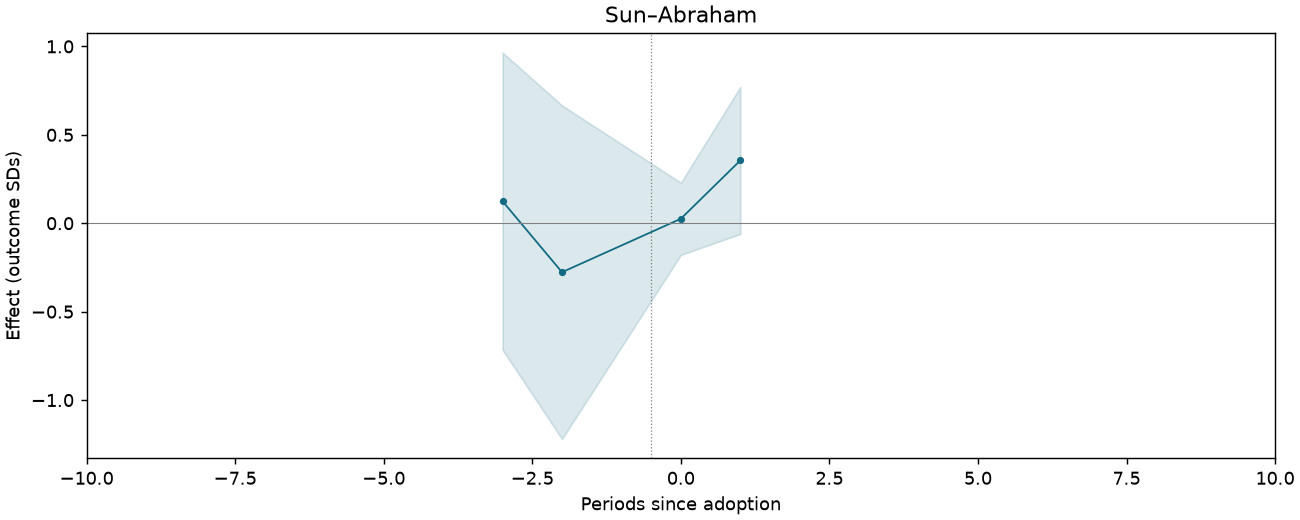
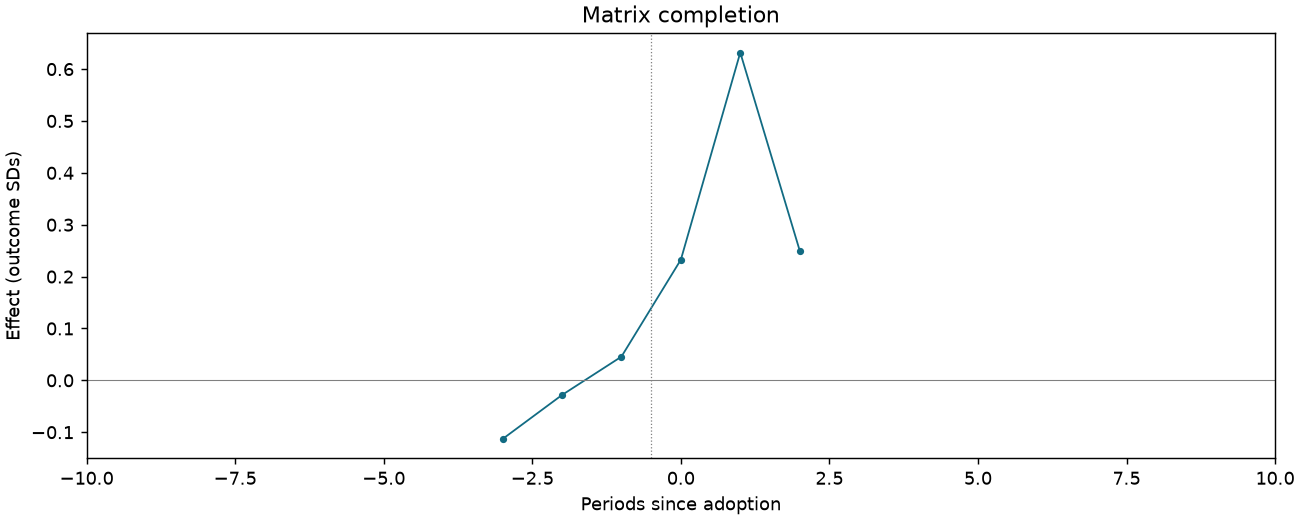
Trust in government officials z-score index [science-track students only]
683 observations · 19 units · 19 clusters · 13 treated / 6 control units.
Estimate comparison
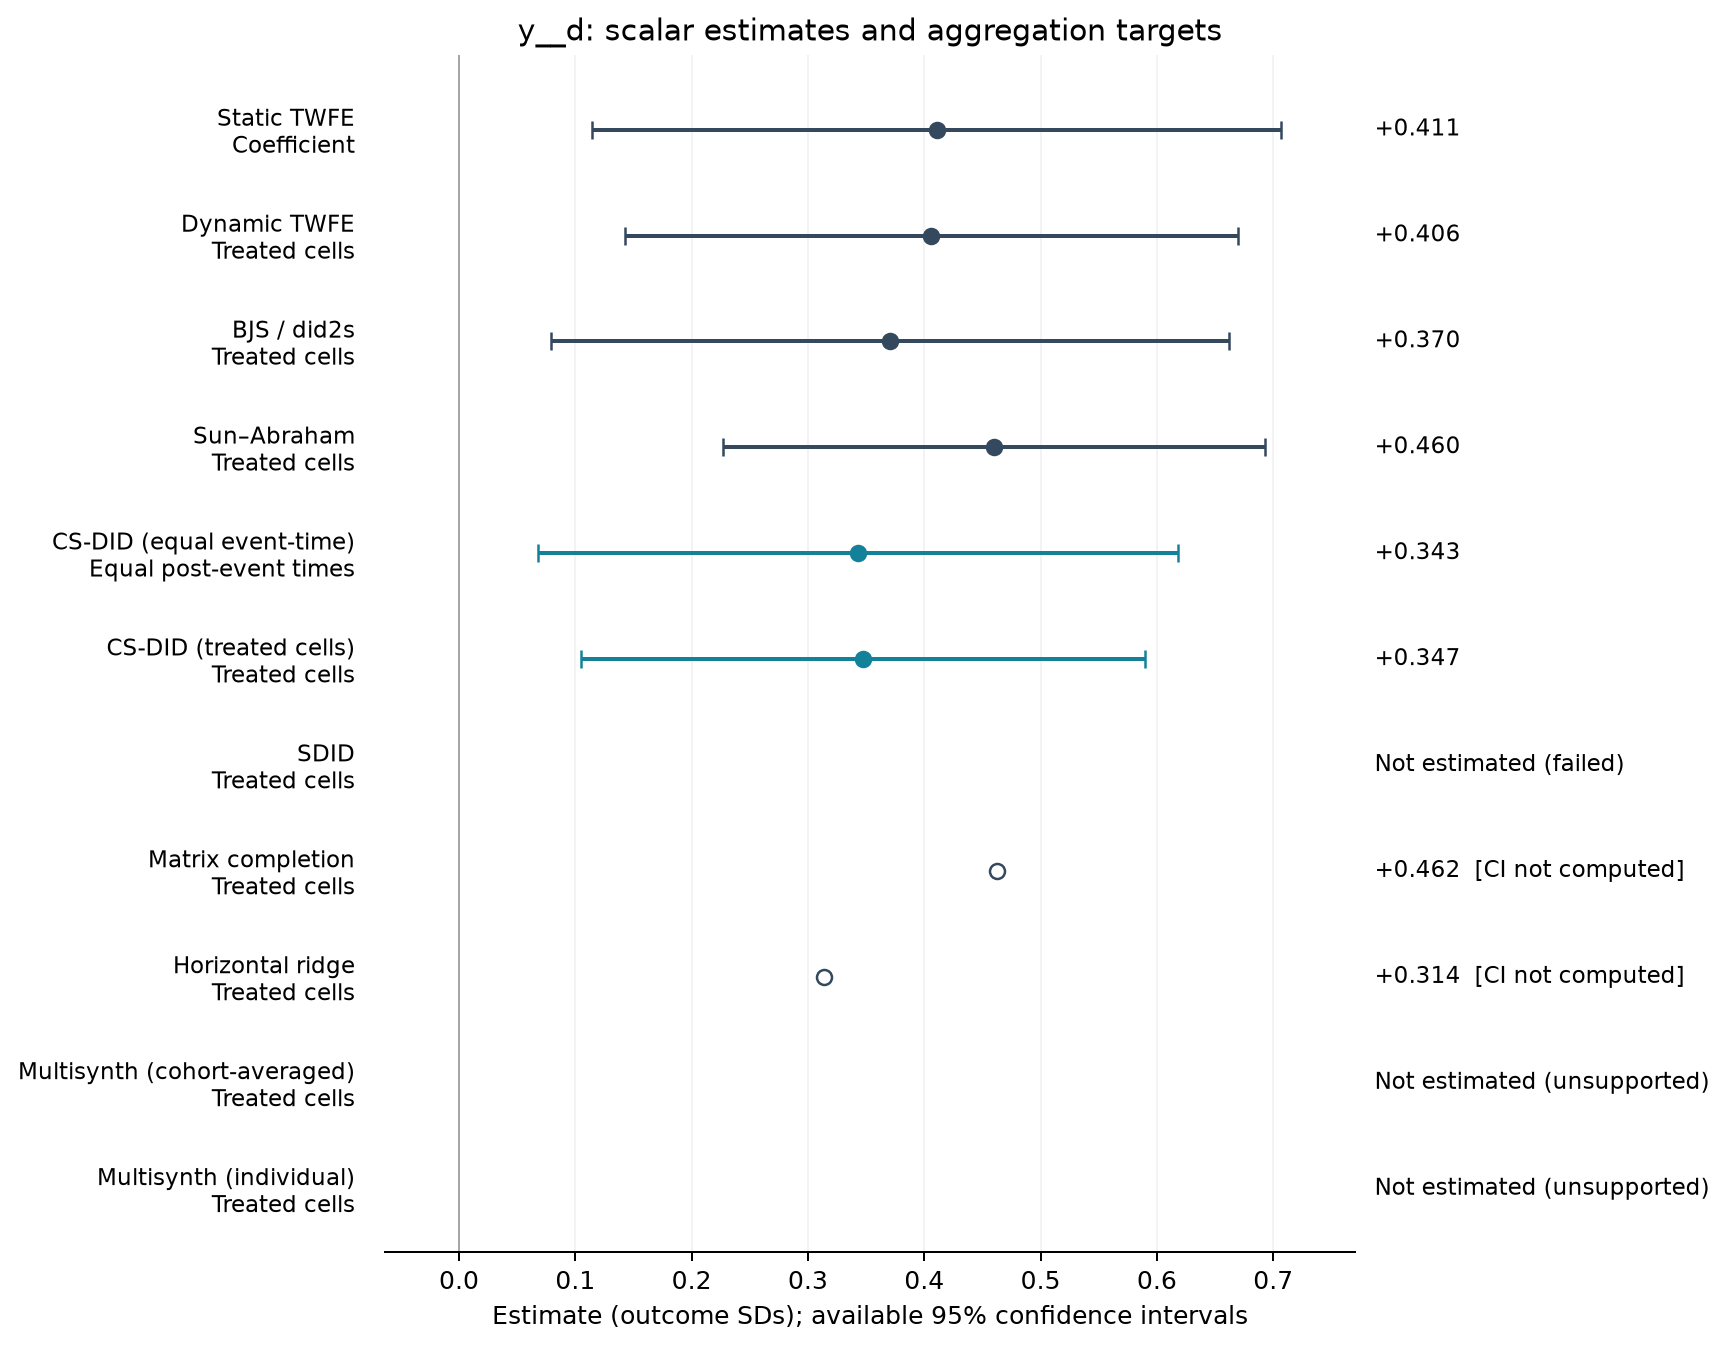
| Estimator | Estimate (SDs) | SE | 95% CI | Averaging |
|---|---|---|---|---|
| Static TWFE | 0.411 | 0.141 | [0.114, 0.707] | Coefficient |
| Dynamic TWFE | 0.406 | 0.125 | [0.142, 0.669] | Treated cells |
| BJS / did2s | 0.370 | 0.139 | [0.079, 0.662] | Treated cells |
| Sun–Abraham | 0.460 | 0.111 | [0.227, 0.693] | Treated cells |
| CS-DID (equal event-time) | 0.343 | 0.140 | [0.068, 0.619] | Equal post-event times |
| CS-DID (treated cells) | 0.347 | 0.124 | [0.105, 0.590] | Treated cells |
| Matrix completion | 0.462 | — | — | Treated cells |
| Horizontal ridge | 0.314 | — | — | Treated cells |
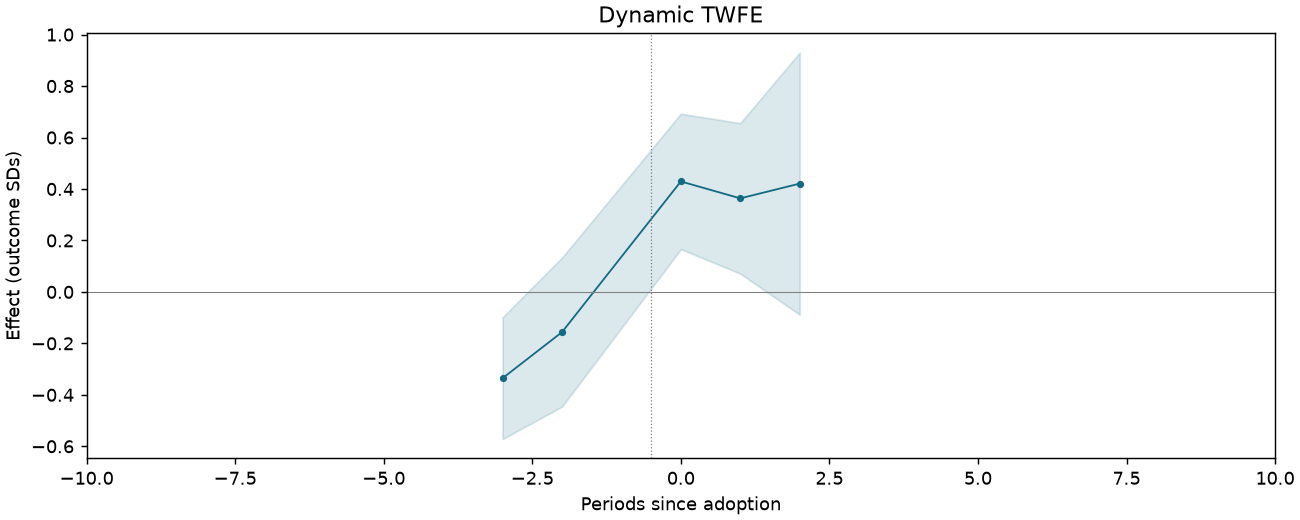
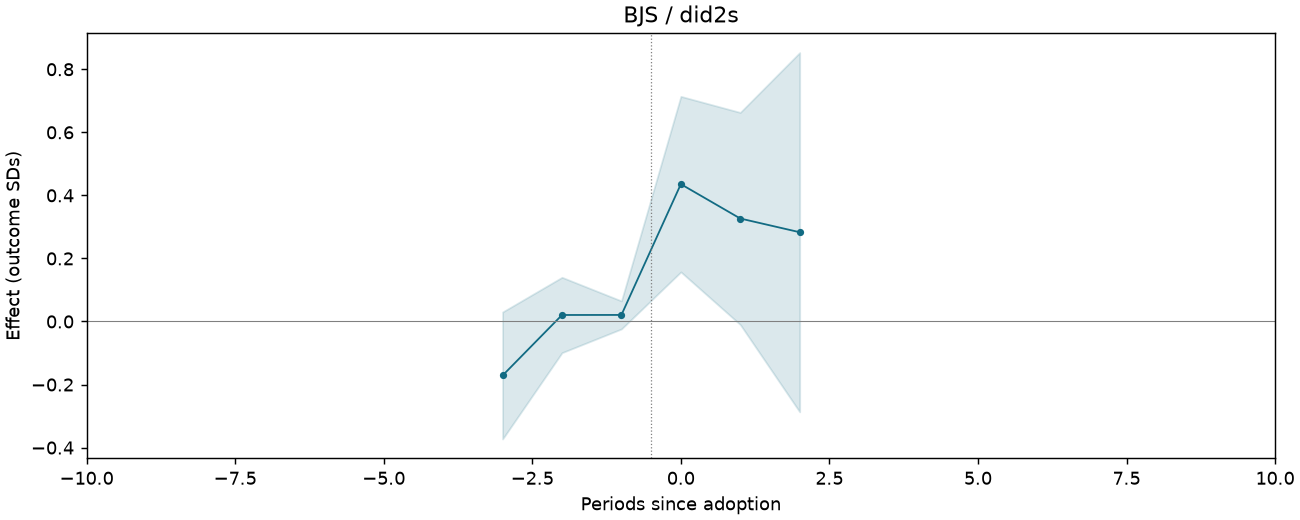
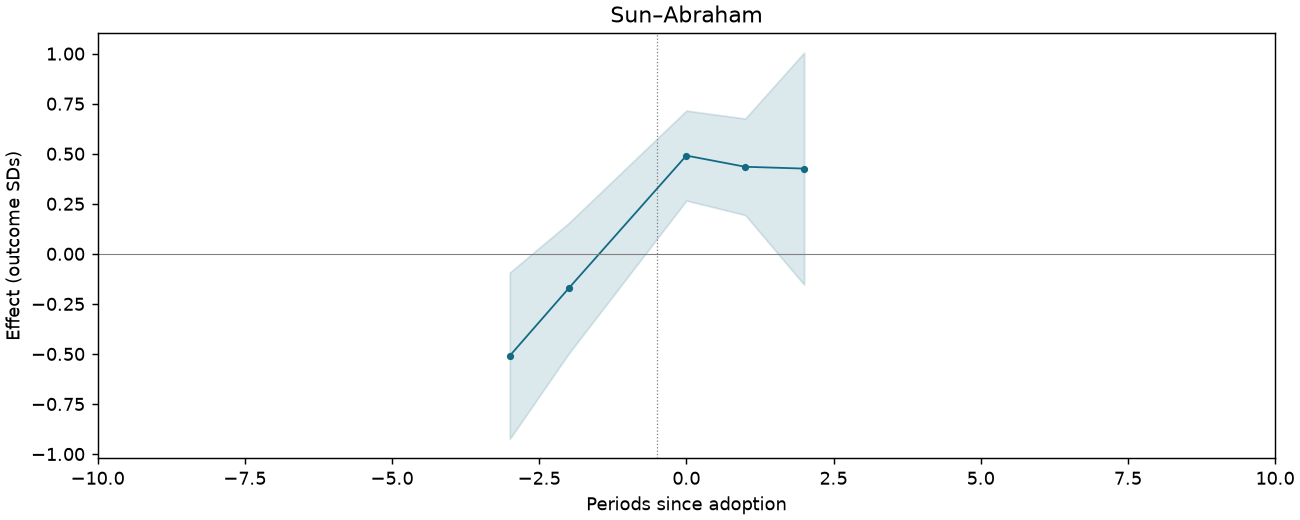
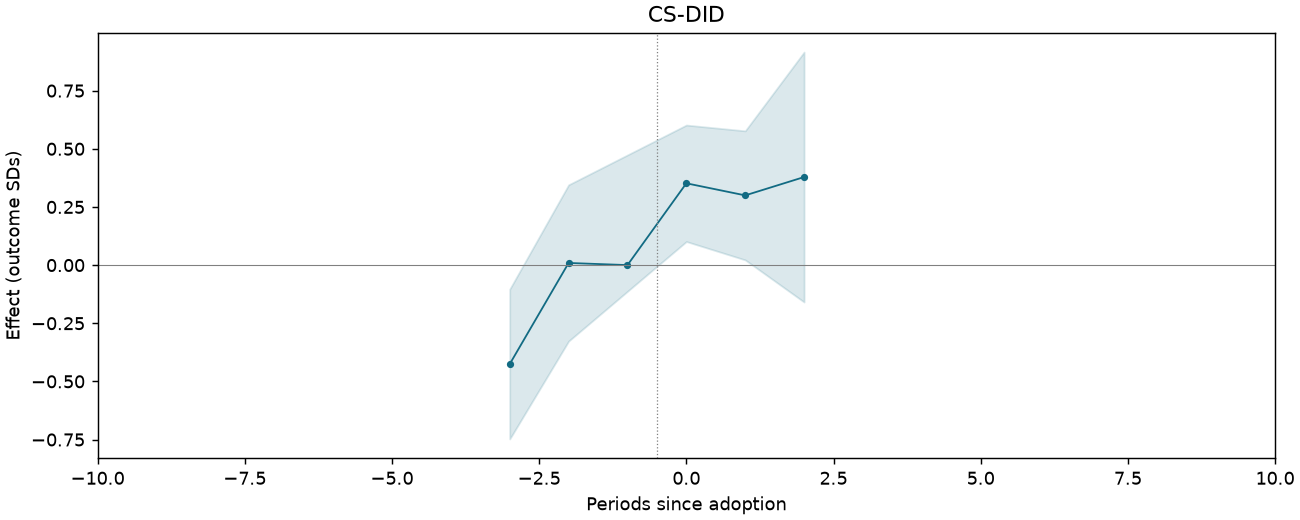
Event studies
Periods −10 to +10; pointwise 95% intervals where available.
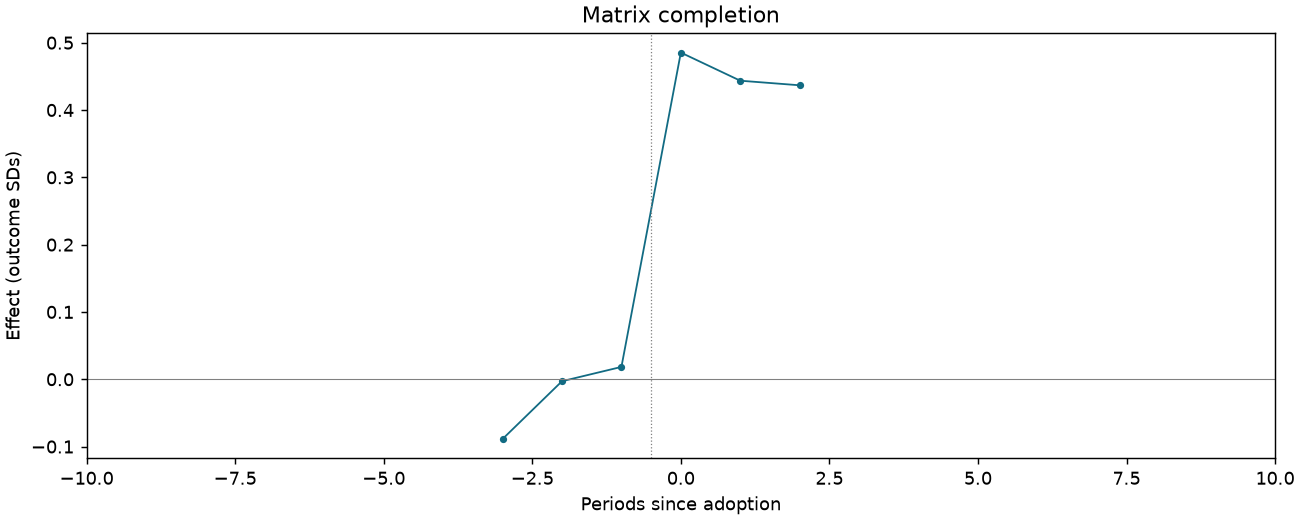
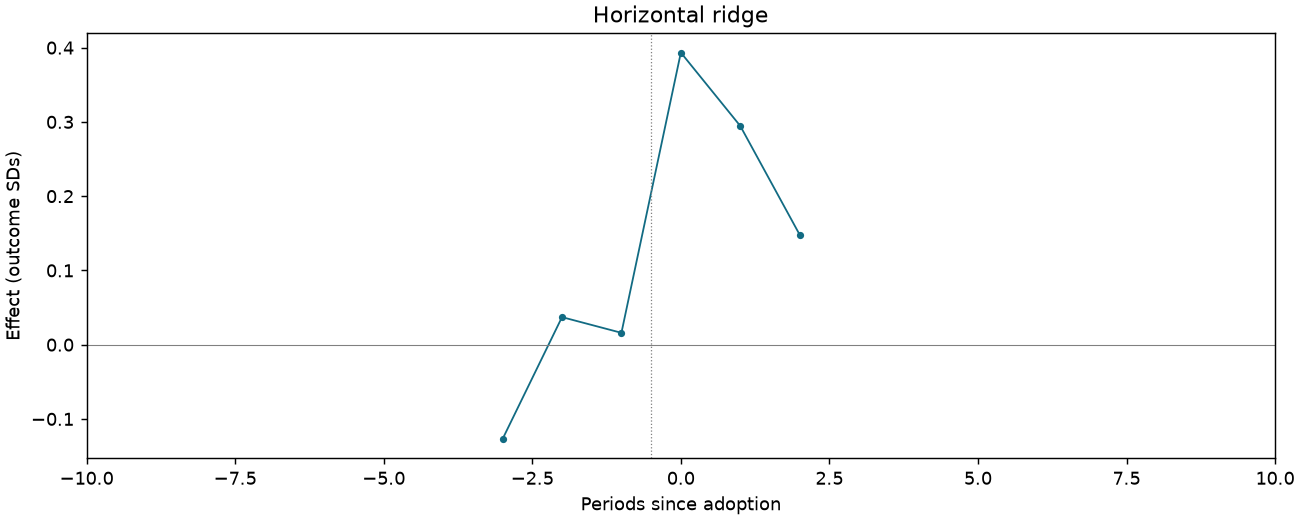
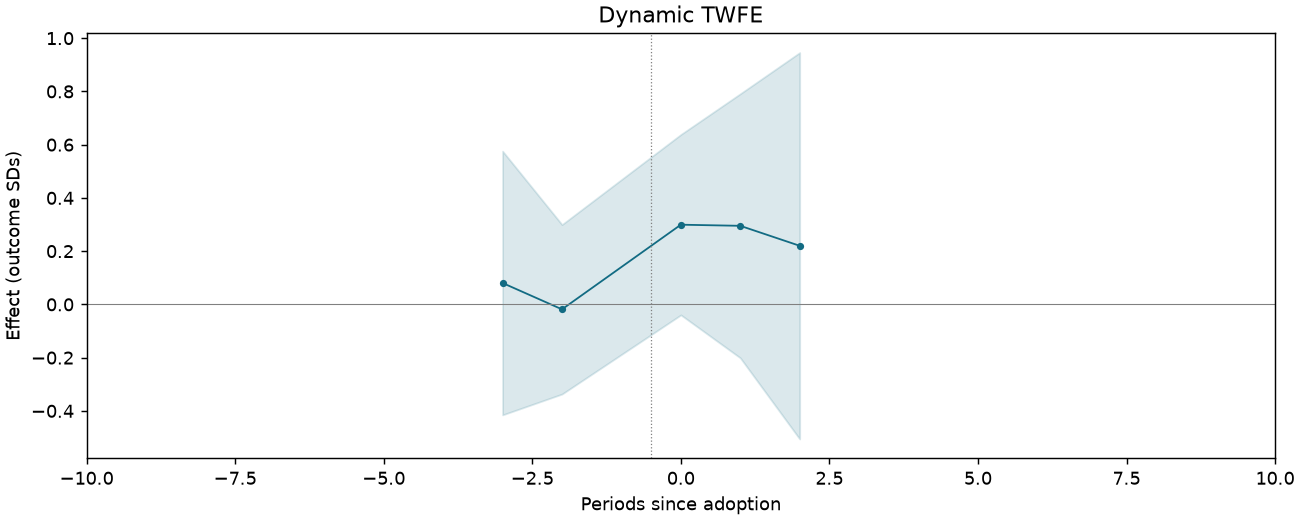
Bribery and civic-mindedness z-score index [science-track students only]
676 observations · 19 units · 19 clusters · 13 treated / 6 control units.
Estimate comparison
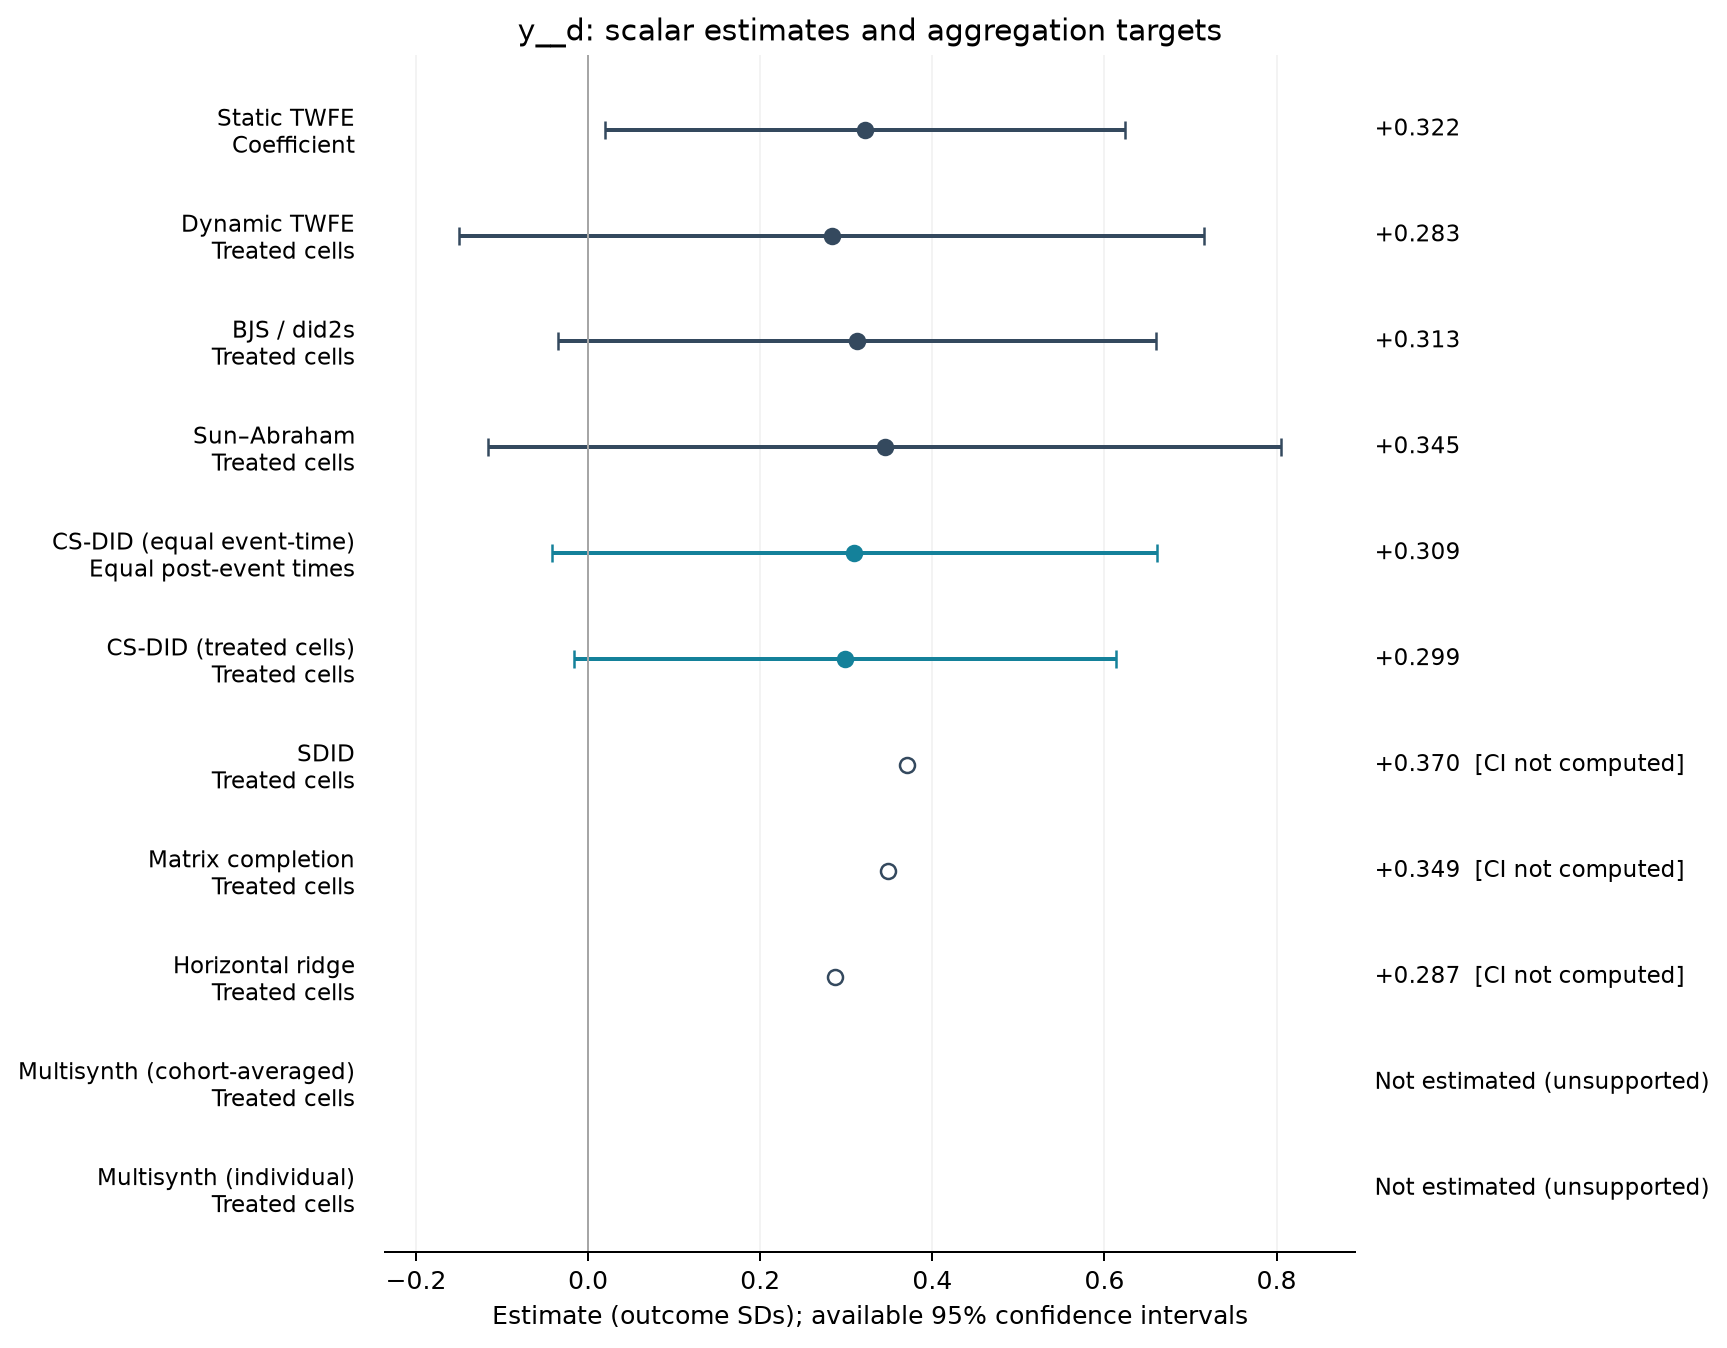
| Estimator | Estimate (SDs) | SE | 95% CI | Averaging |
|---|---|---|---|---|
| Static TWFE | 0.322 | 0.144 | [0.020, 0.624] | Coefficient |
| Dynamic TWFE | 0.283 | 0.206 | [-0.150, 0.716] | Treated cells |
| BJS / did2s | 0.313 | 0.165 | [-0.035, 0.660] | Treated cells |
| Sun–Abraham | 0.345 | 0.219 | [-0.116, 0.805] | Treated cells |
| CS-DID (equal event-time) | 0.309 | 0.179 | [-0.042, 0.661] | Equal post-event times |
| CS-DID (treated cells) | 0.299 | 0.161 | [-0.016, 0.614] | Treated cells |
| SDID | 0.370 | — | — | Treated cells |
| Matrix completion | 0.349 | — | — | Treated cells |
| Horizontal ridge | 0.287 | — | — | Treated cells |
Event studies
Periods −10 to +10; pointwise 95% intervals where available.
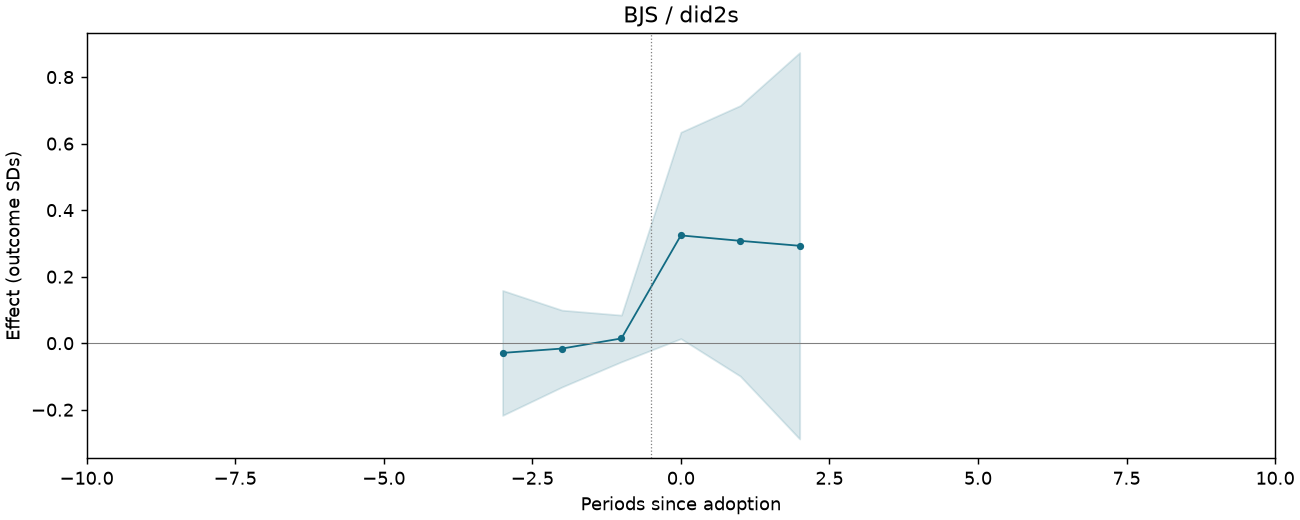
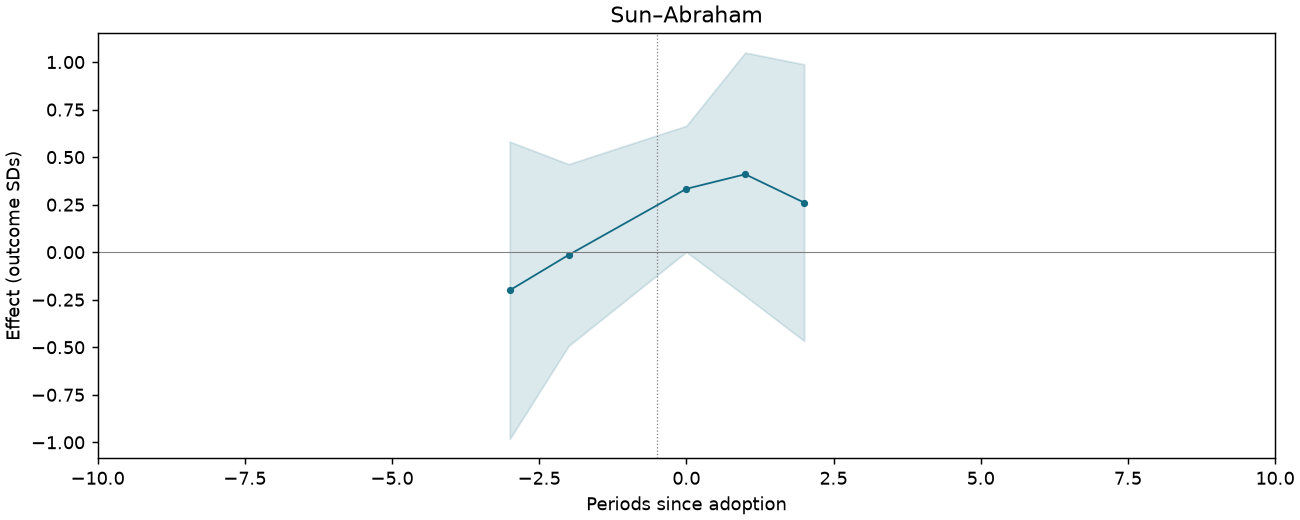
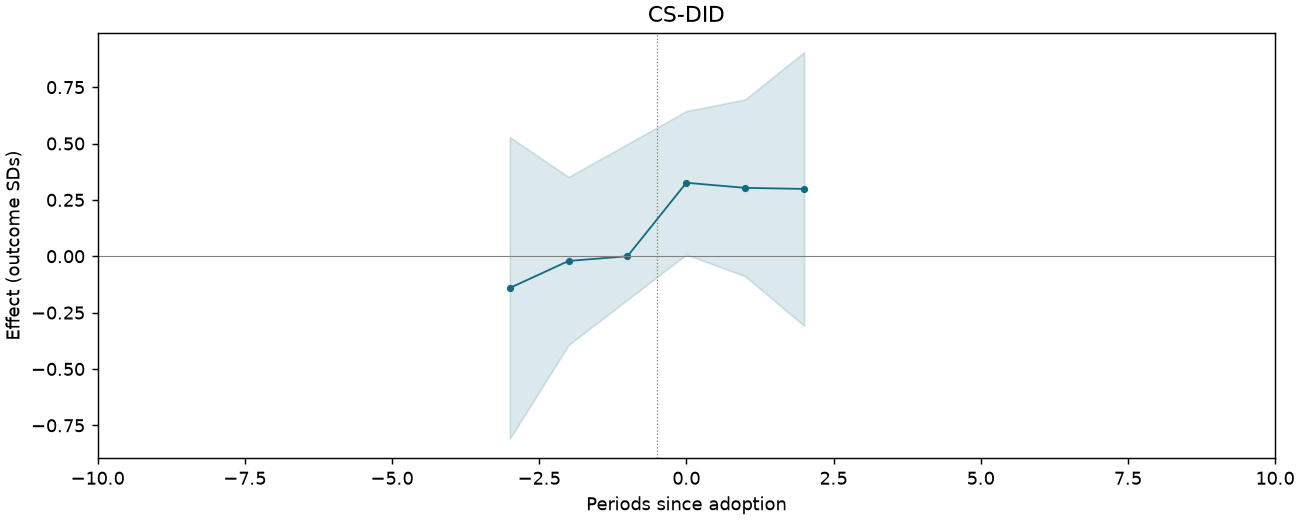
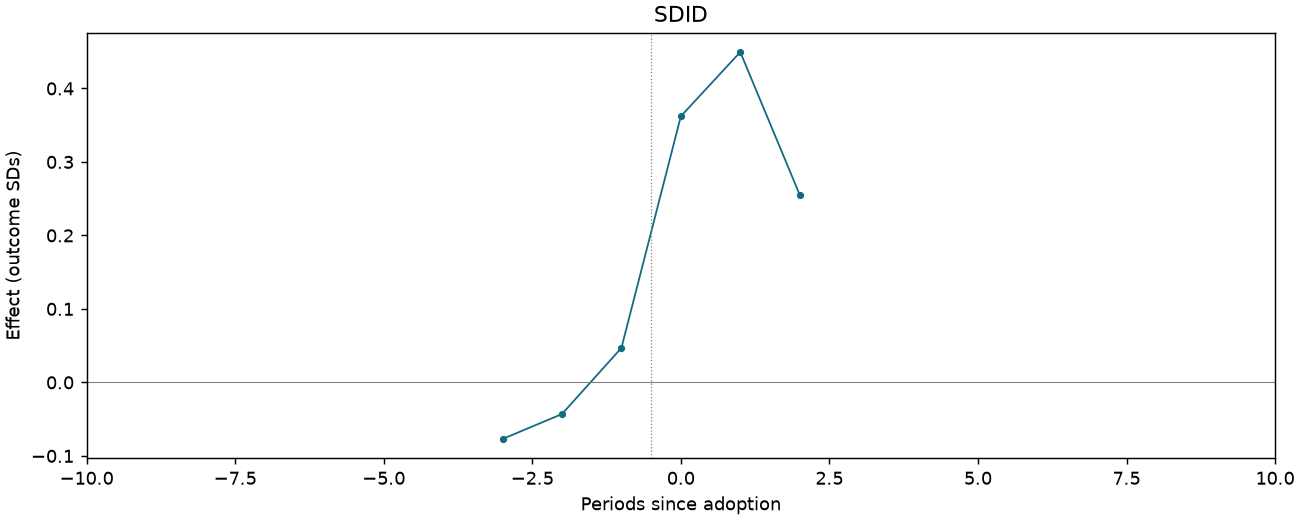
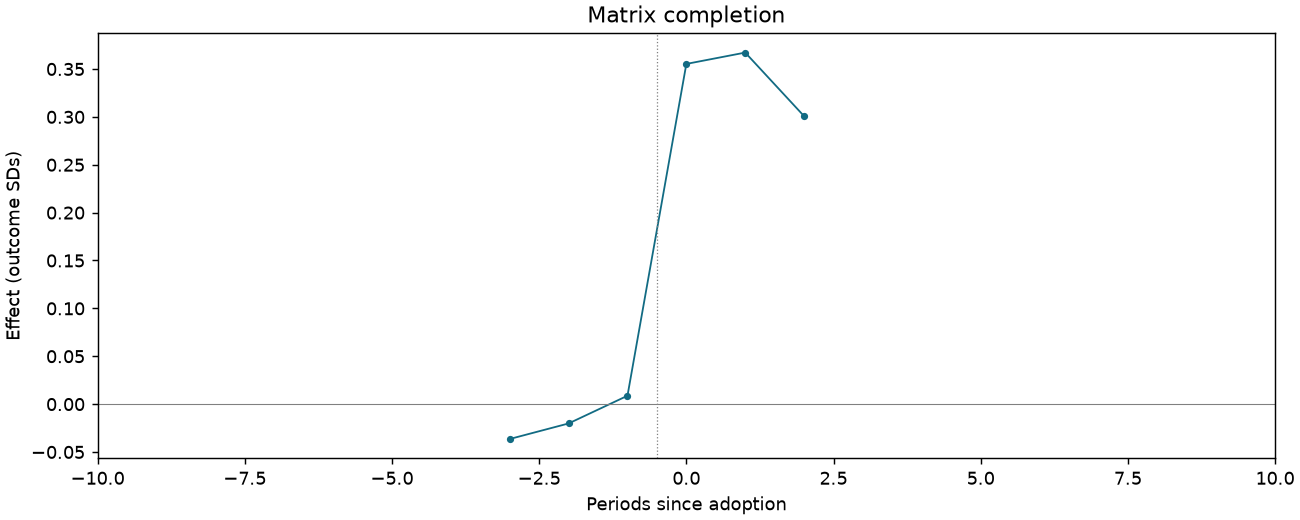
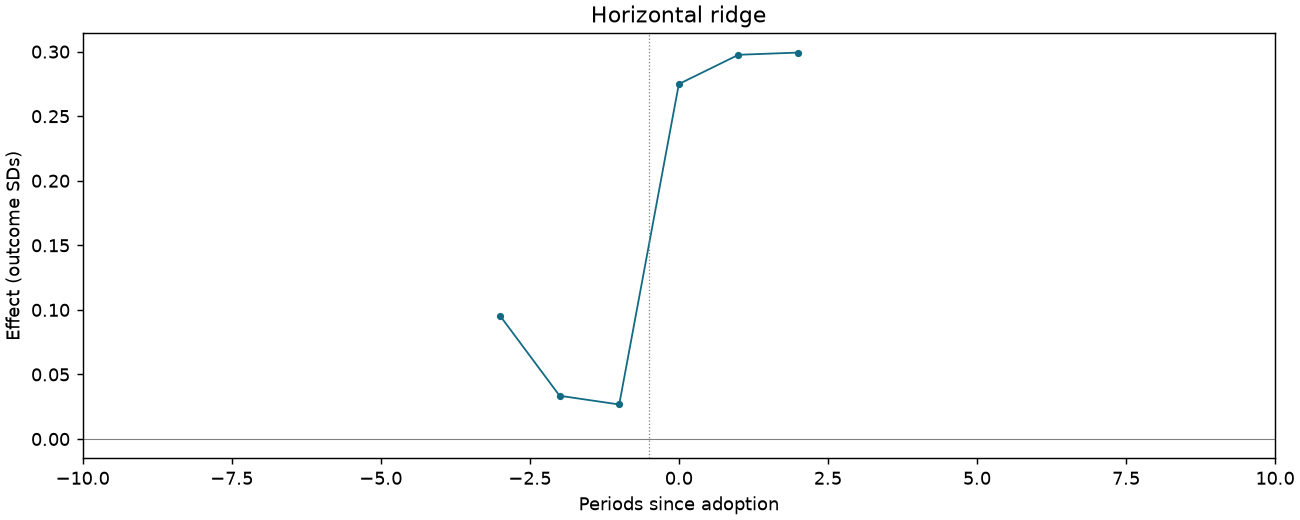
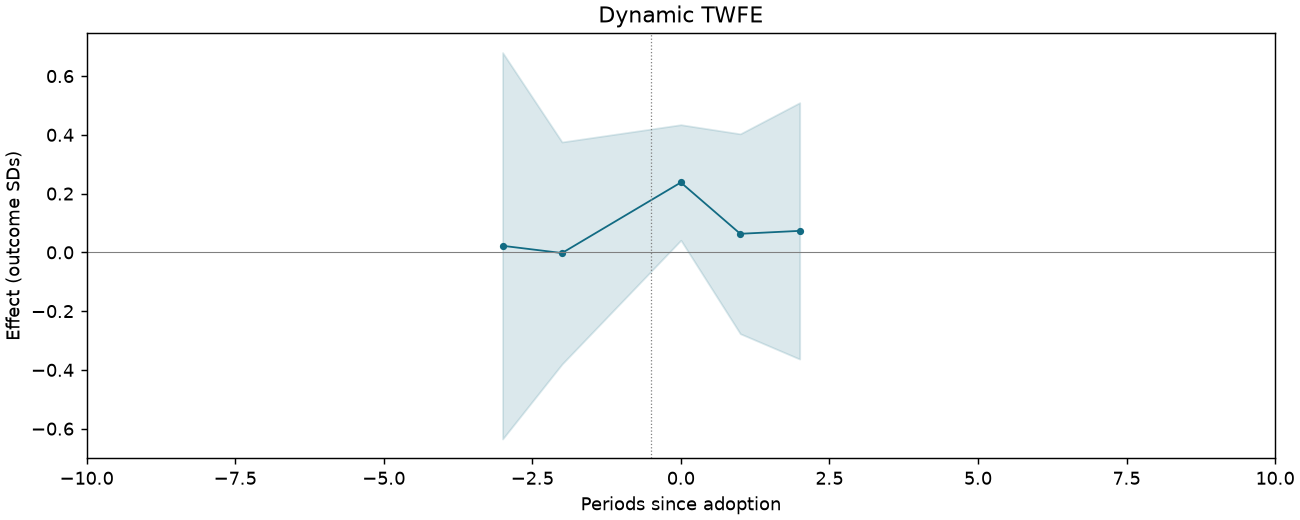
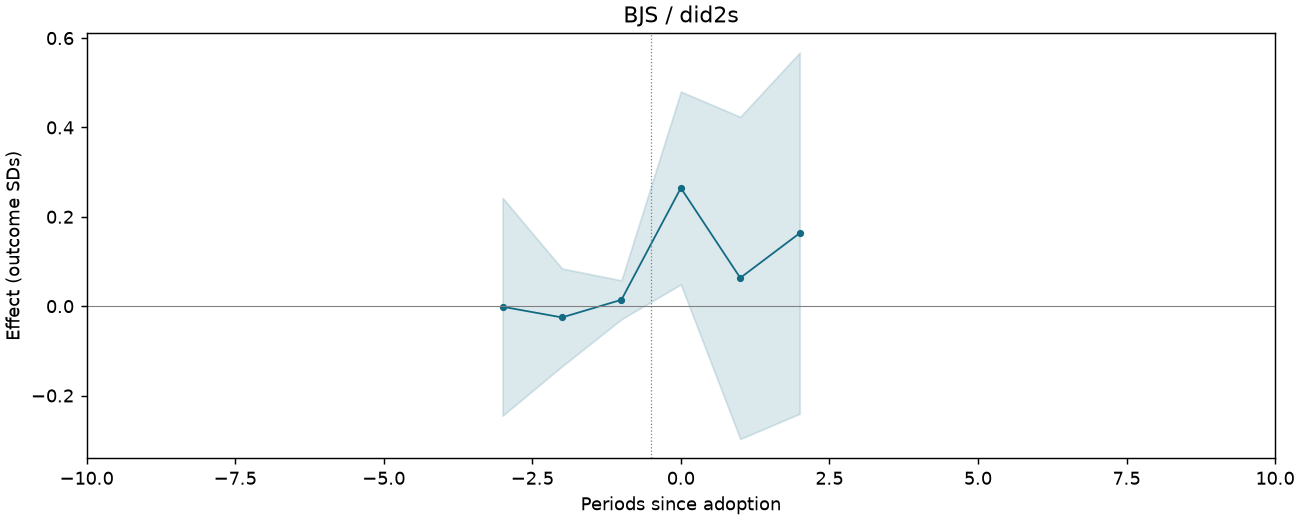
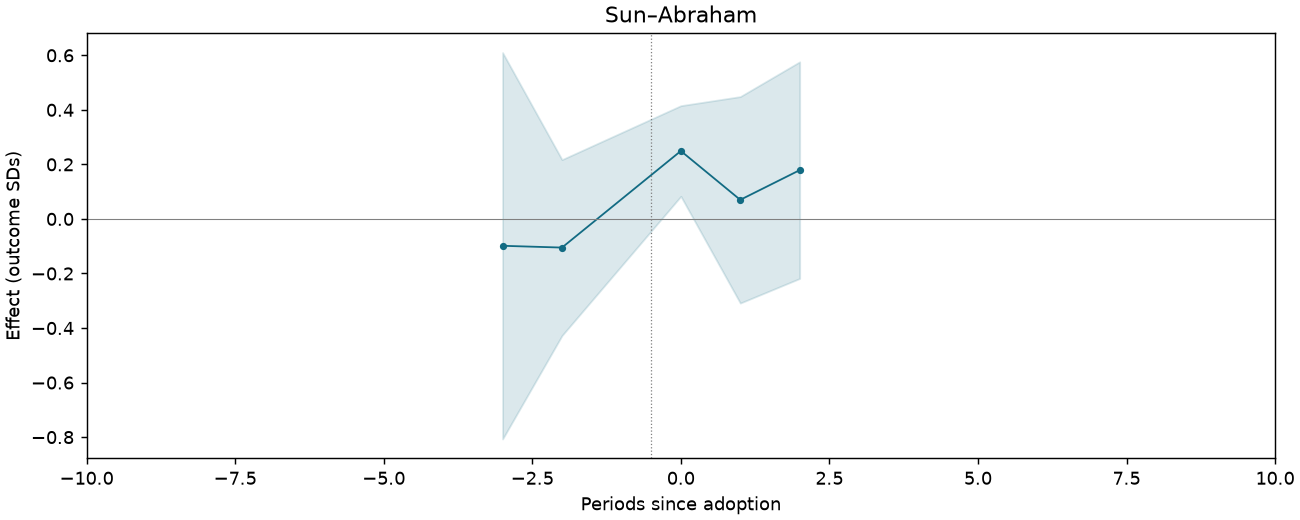
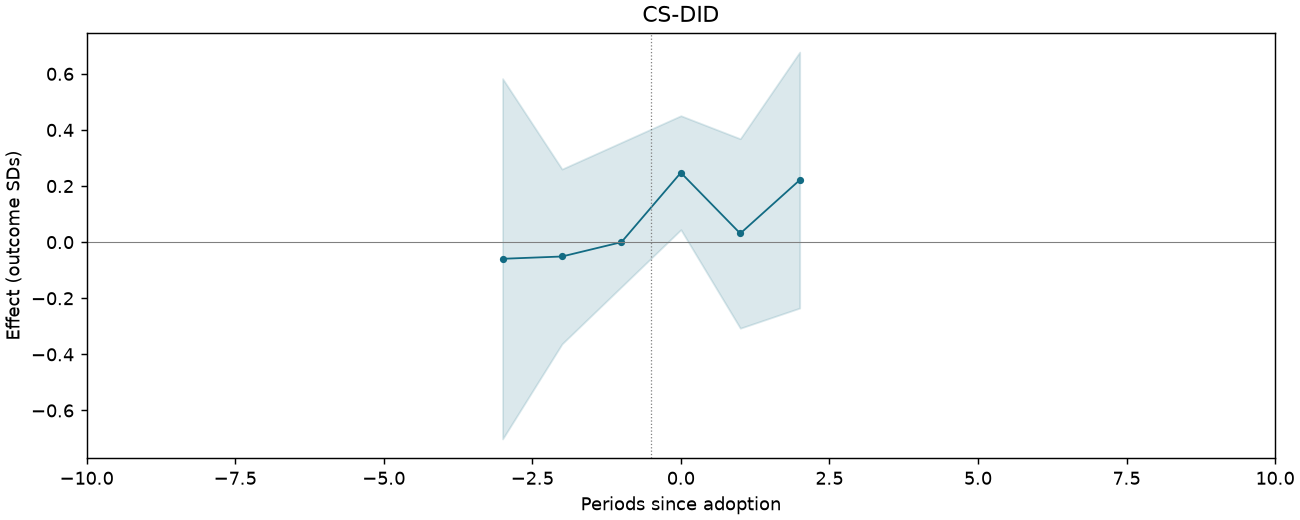
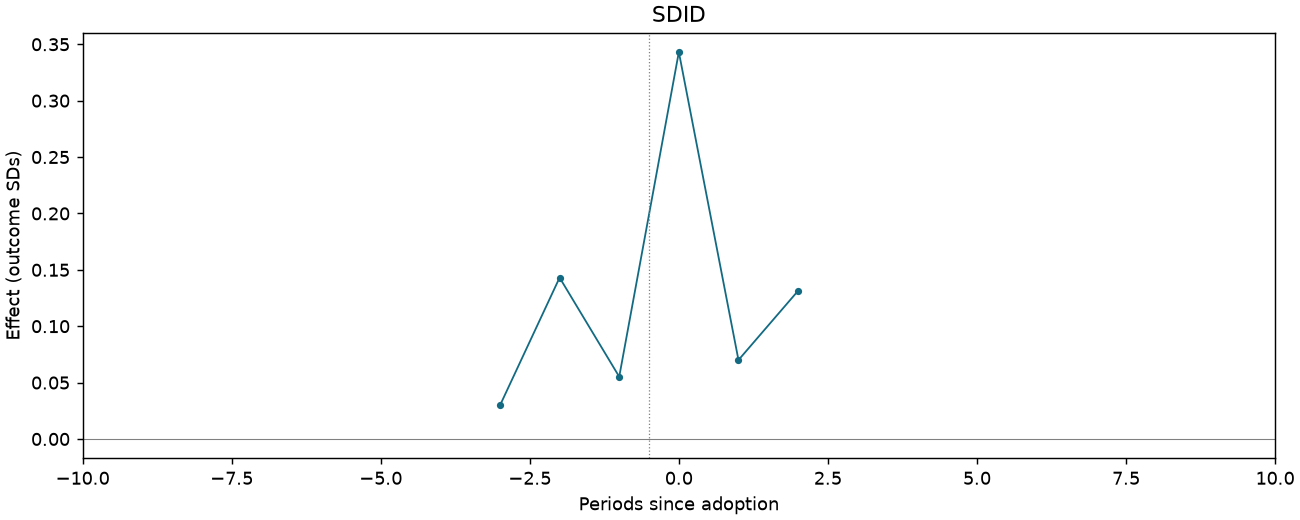
Perception of Chinese democracy z-score index [science-track students only]
674 observations · 19 units · 19 clusters · 13 treated / 6 control units.
Estimate comparison
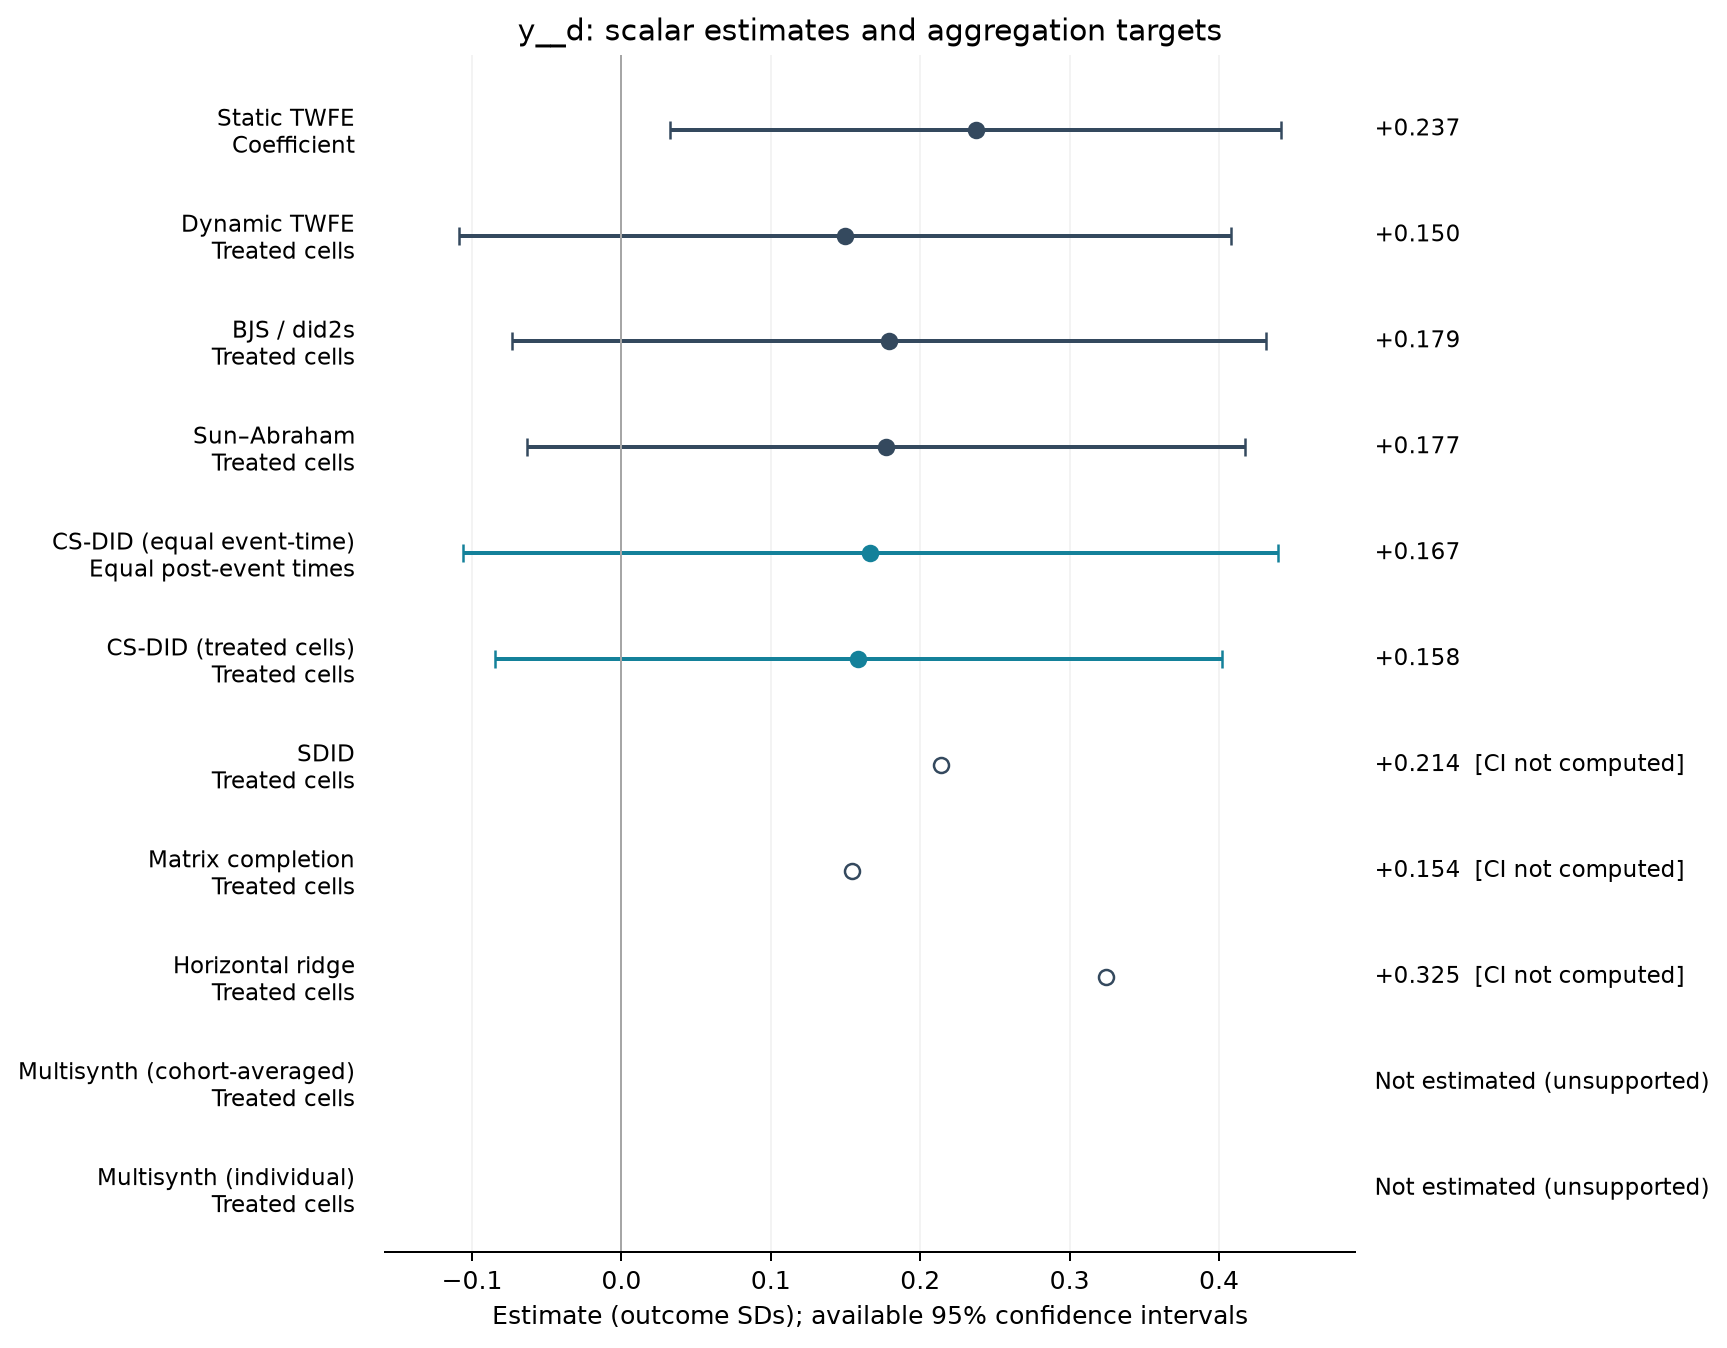
| Estimator | Estimate (SDs) | SE | 95% CI | Averaging |
|---|---|---|---|---|
| Static TWFE | 0.237 | 0.097 | [0.033, 0.442] | Coefficient |
| Dynamic TWFE | 0.150 | 0.123 | [-0.109, 0.408] | Treated cells |
| BJS / did2s | 0.179 | 0.120 | [-0.073, 0.432] | Treated cells |
| Sun–Abraham | 0.177 | 0.114 | [-0.063, 0.417] | Treated cells |
| CS-DID (equal event-time) | 0.167 | 0.139 | [-0.106, 0.440] | Equal post-event times |
| CS-DID (treated cells) | 0.158 | 0.124 | [-0.085, 0.402] | Treated cells |
| SDID | 0.214 | — | — | Treated cells |
| Matrix completion | 0.154 | — | — | Treated cells |
| Horizontal ridge | 0.325 | — | — | Treated cells |
Event studies
Periods −10 to +10; pointwise 95% intervals where available.
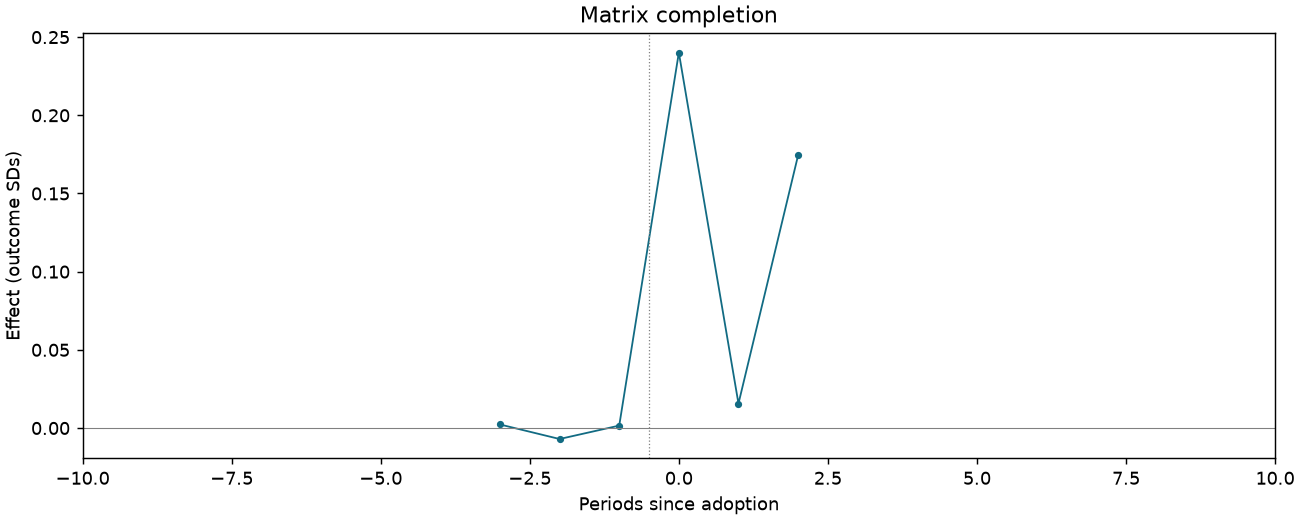
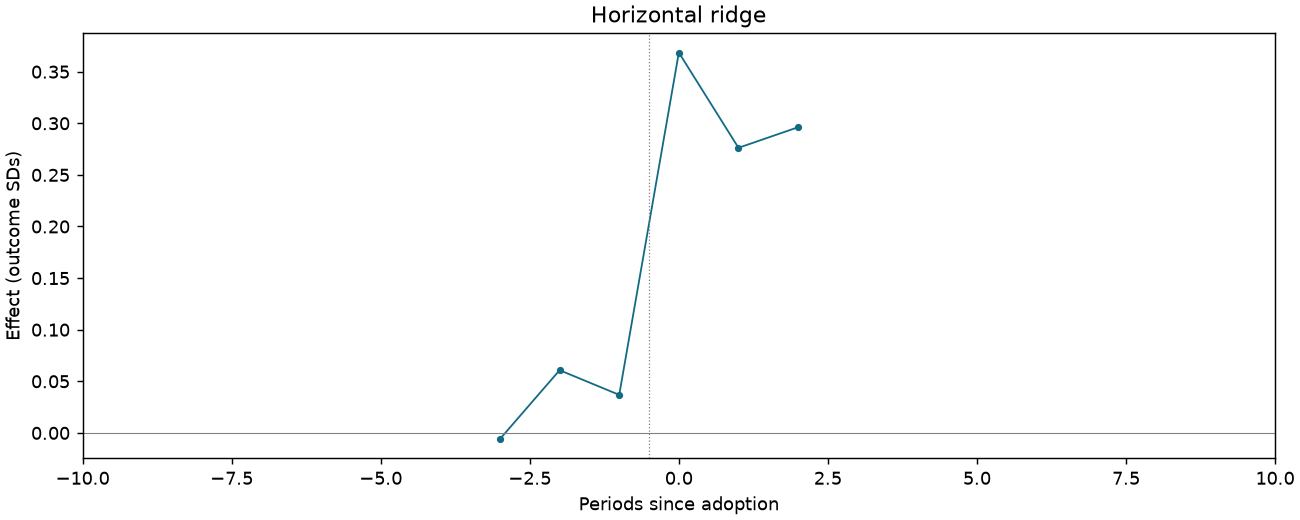
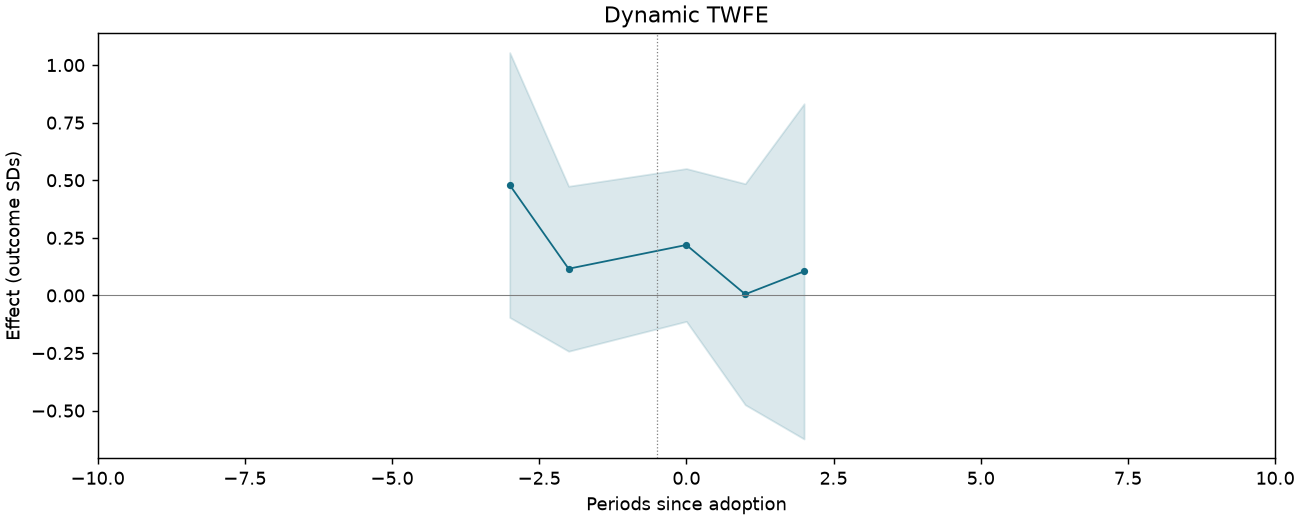
Wisdom of the masses z-score index [science-track students only]
652 observations · 19 units · 19 clusters · 13 treated / 6 control units.
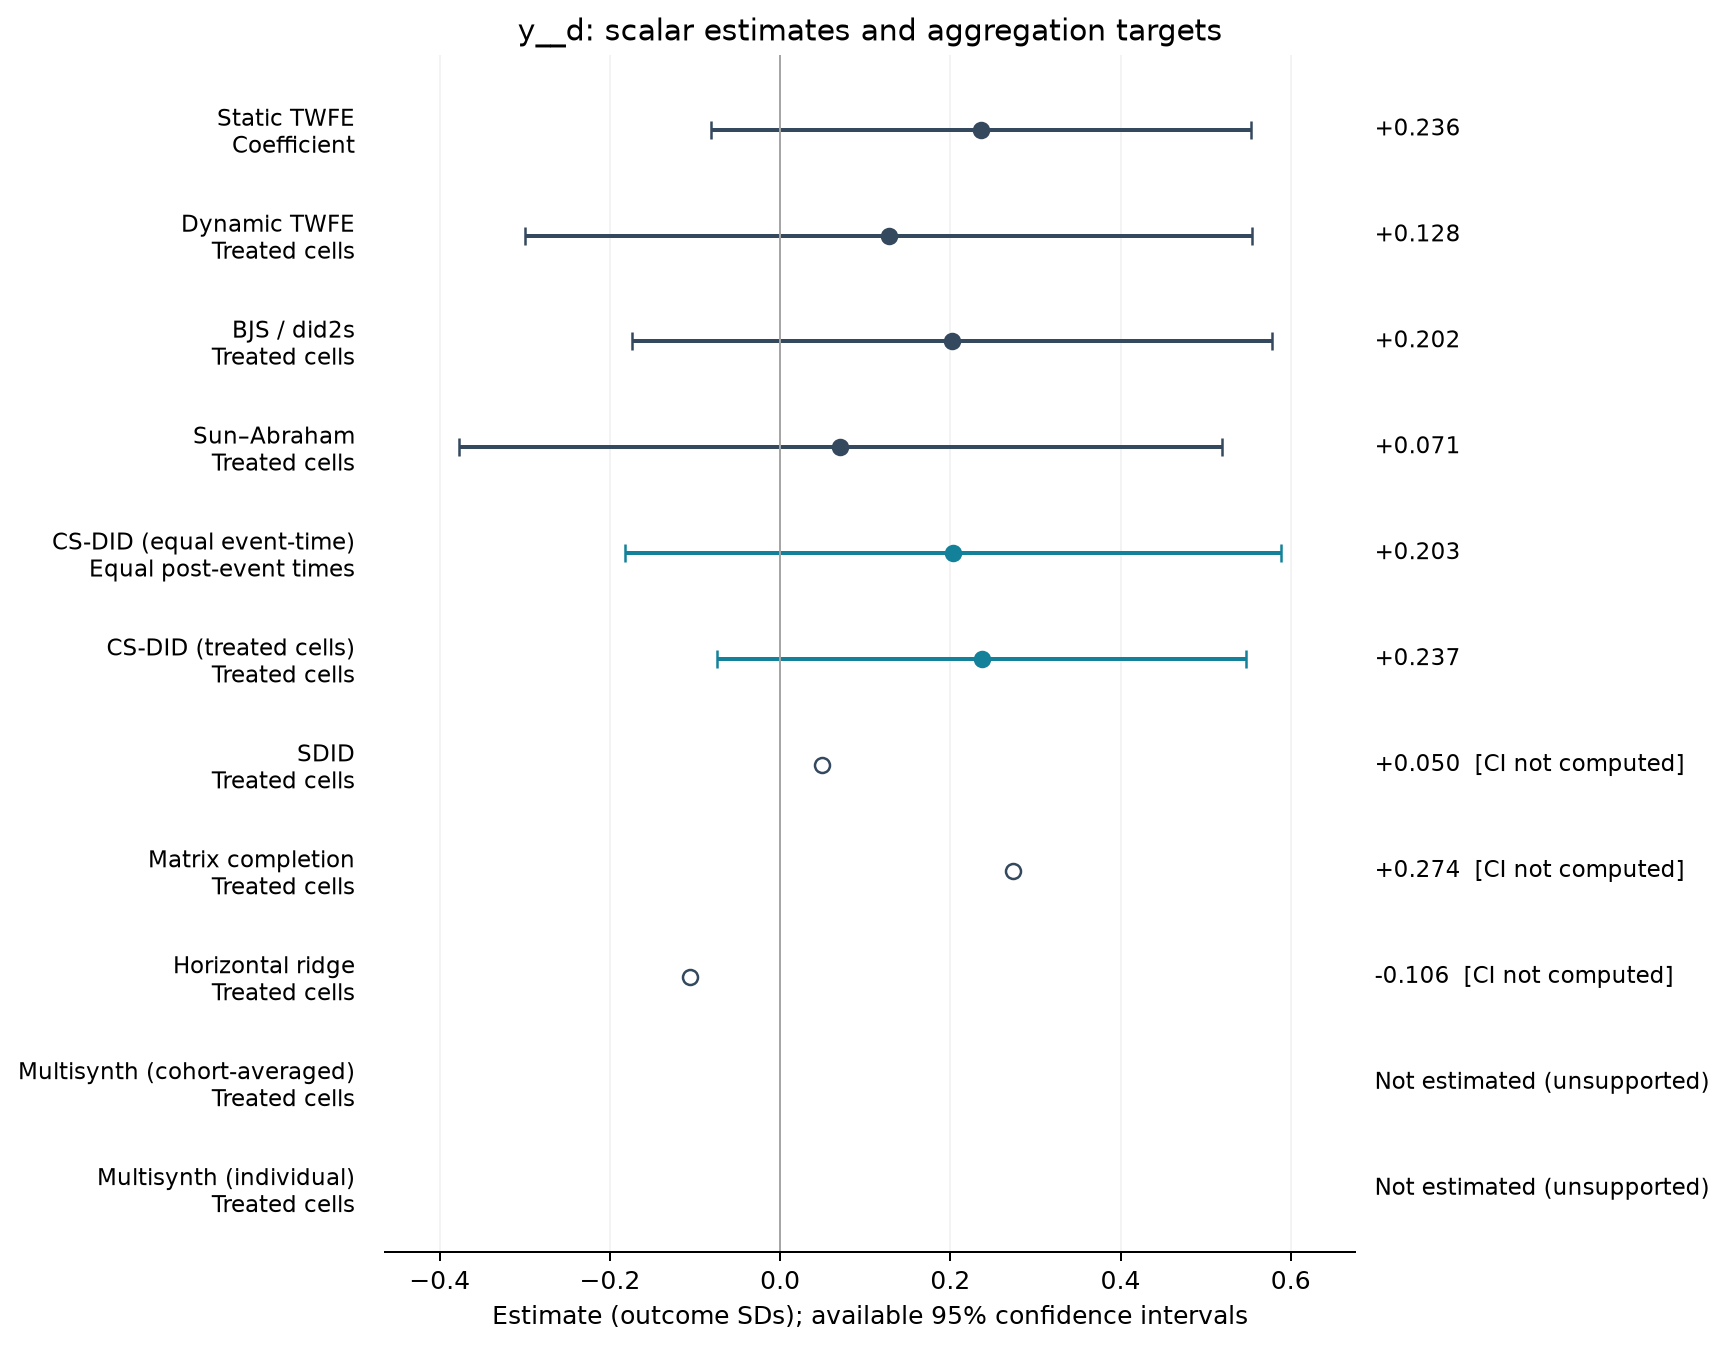
Estimate comparison
| Estimator | Estimate (SDs) | SE | 95% CI | Averaging |
|---|---|---|---|---|
| Static TWFE | 0.236 | 0.151 | [-0.082, 0.553] | Coefficient |
| Dynamic TWFE | 0.128 | 0.203 | [-0.300, 0.555] | Treated cells |
| BJS / did2s | 0.202 | 0.179 | [-0.174, 0.577] | Treated cells |
| Sun–Abraham | 0.071 | 0.213 | [-0.377, 0.519] | Treated cells |
| CS-DID (equal event-time) | 0.203 | 0.197 | [-0.182, 0.589] | Equal post-event times |
| CS-DID (treated cells) | 0.237 | 0.158 | [-0.074, 0.547] | Treated cells |
| SDID | 0.050 | — | — | Treated cells |
| Matrix completion | 0.274 | — | — | Treated cells |
| Horizontal ridge | -0.106 | — | — | Treated cells |
Event studies
Periods −10 to +10; pointwise 95% intervals where available.
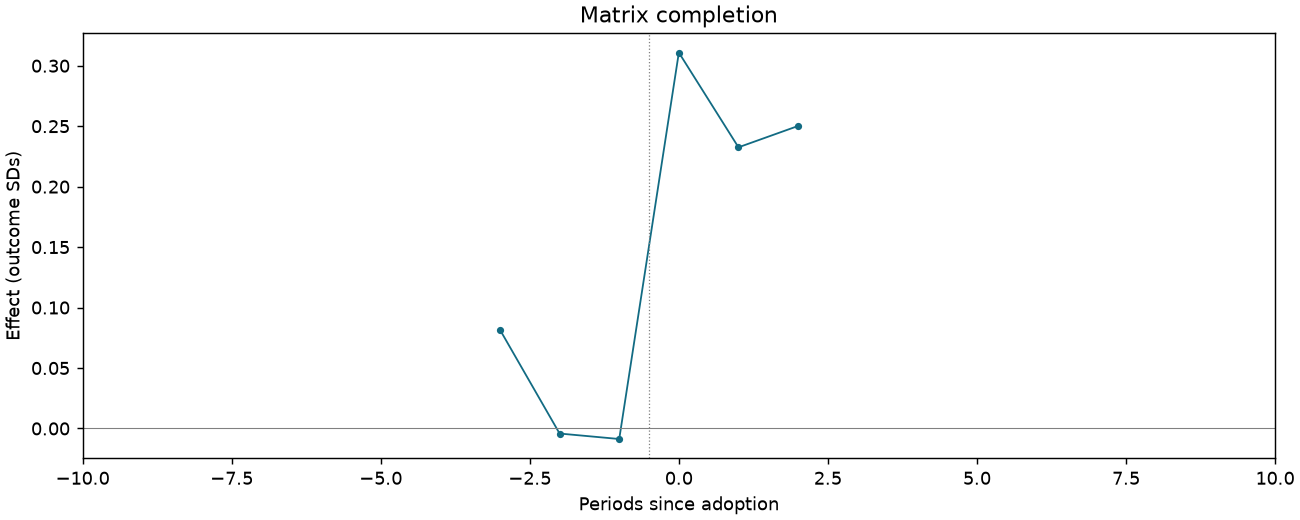
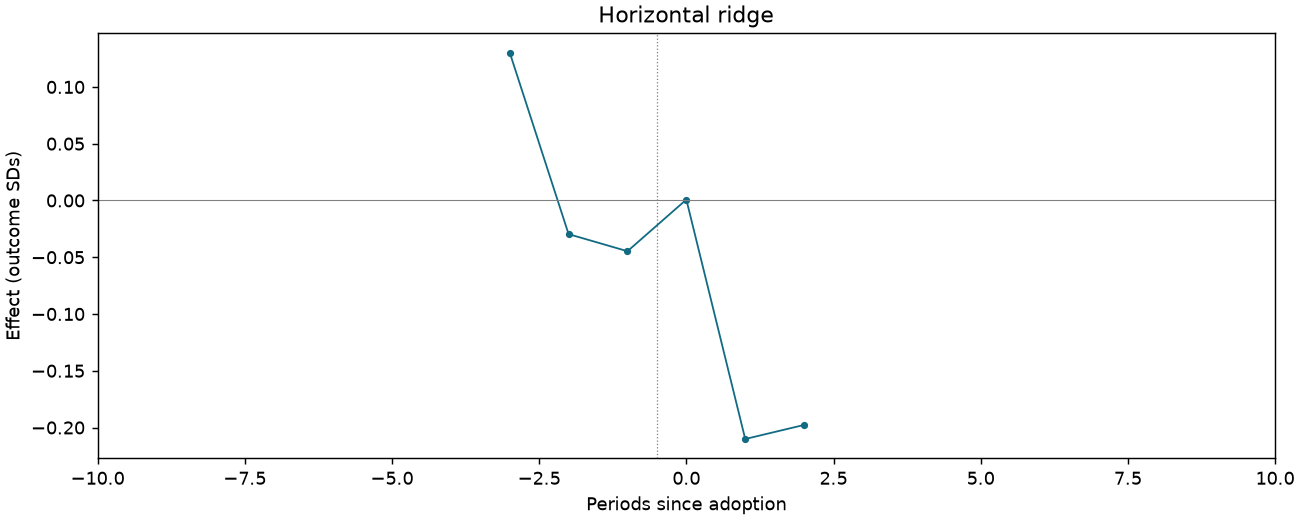
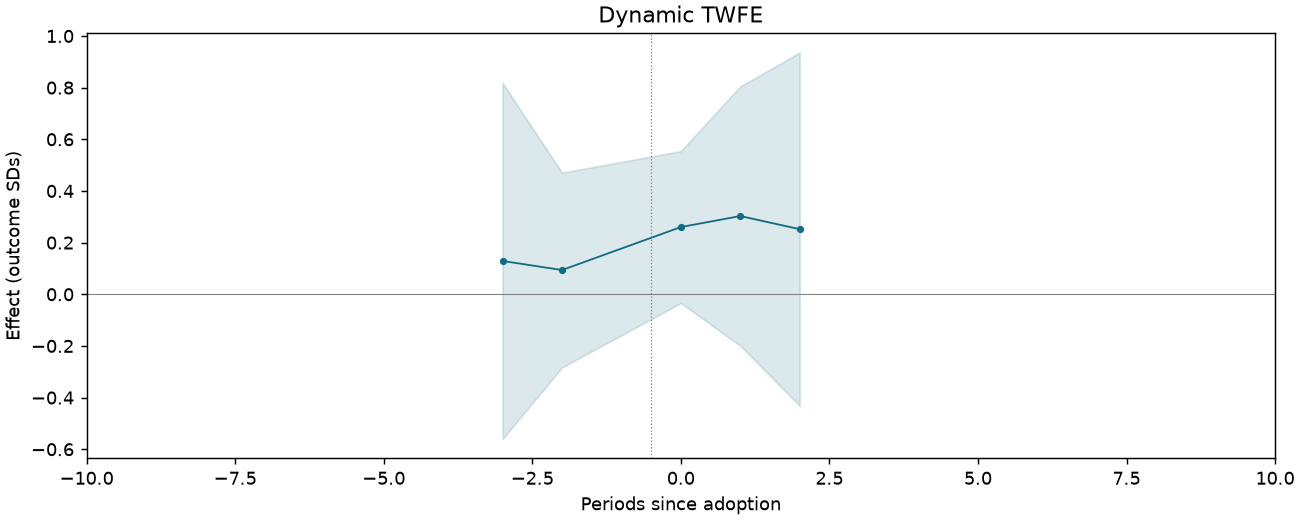
Participation is key for democracy [science-track students only]
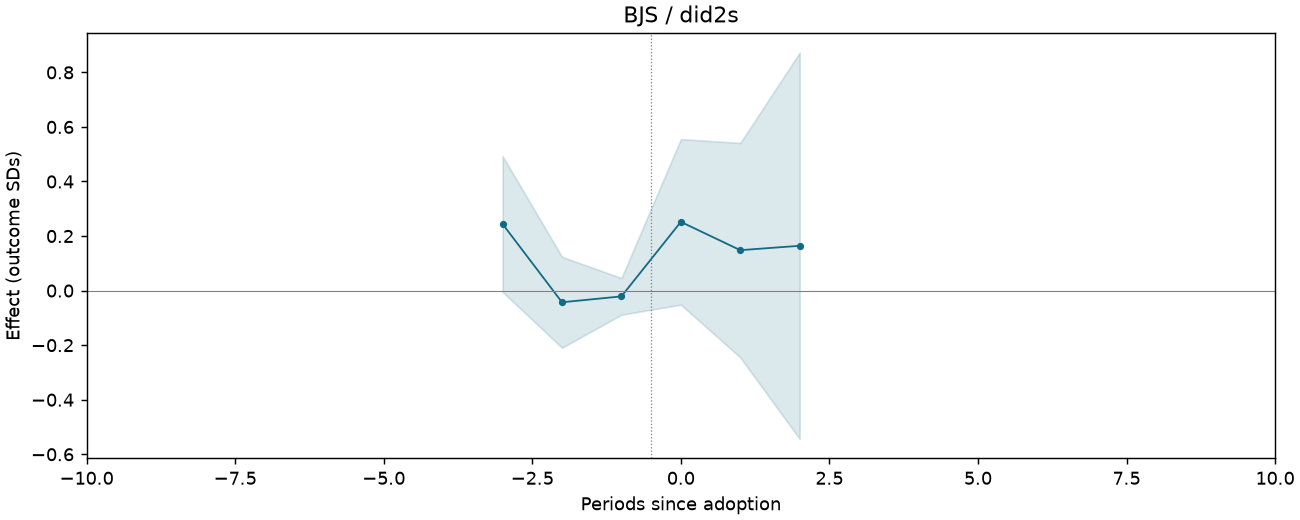
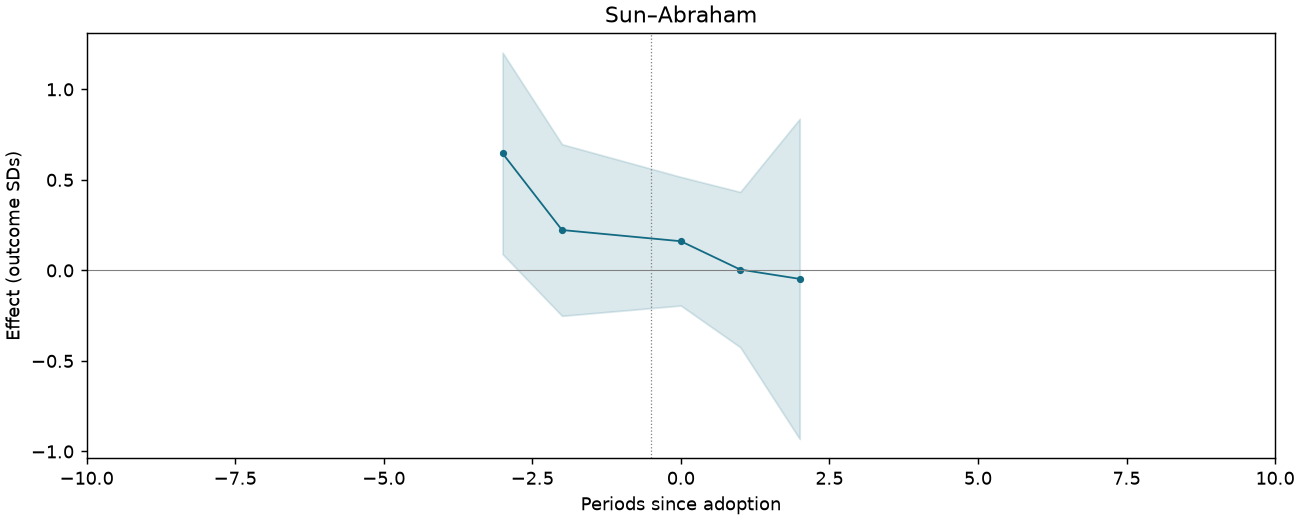
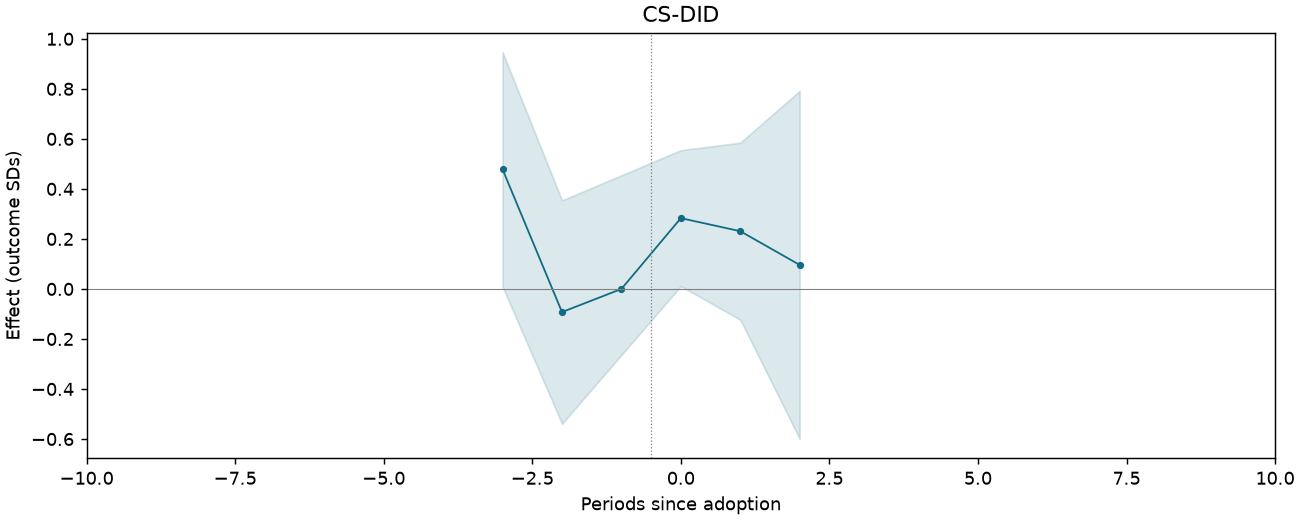
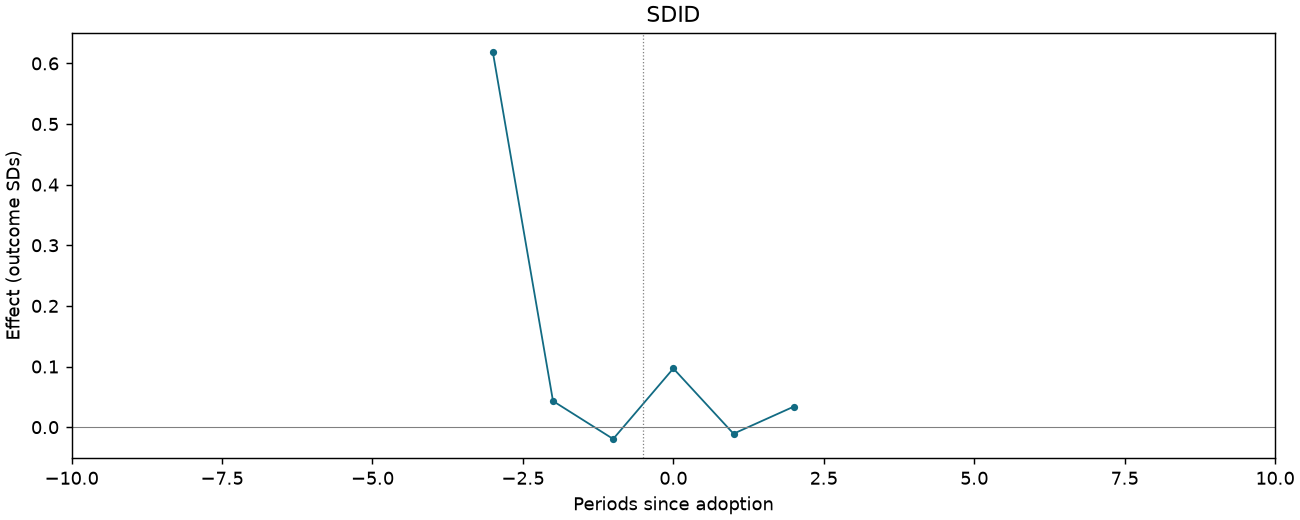
674 observations · 19 units · 19 clusters · 13 treated / 6 control units.
Estimate comparison
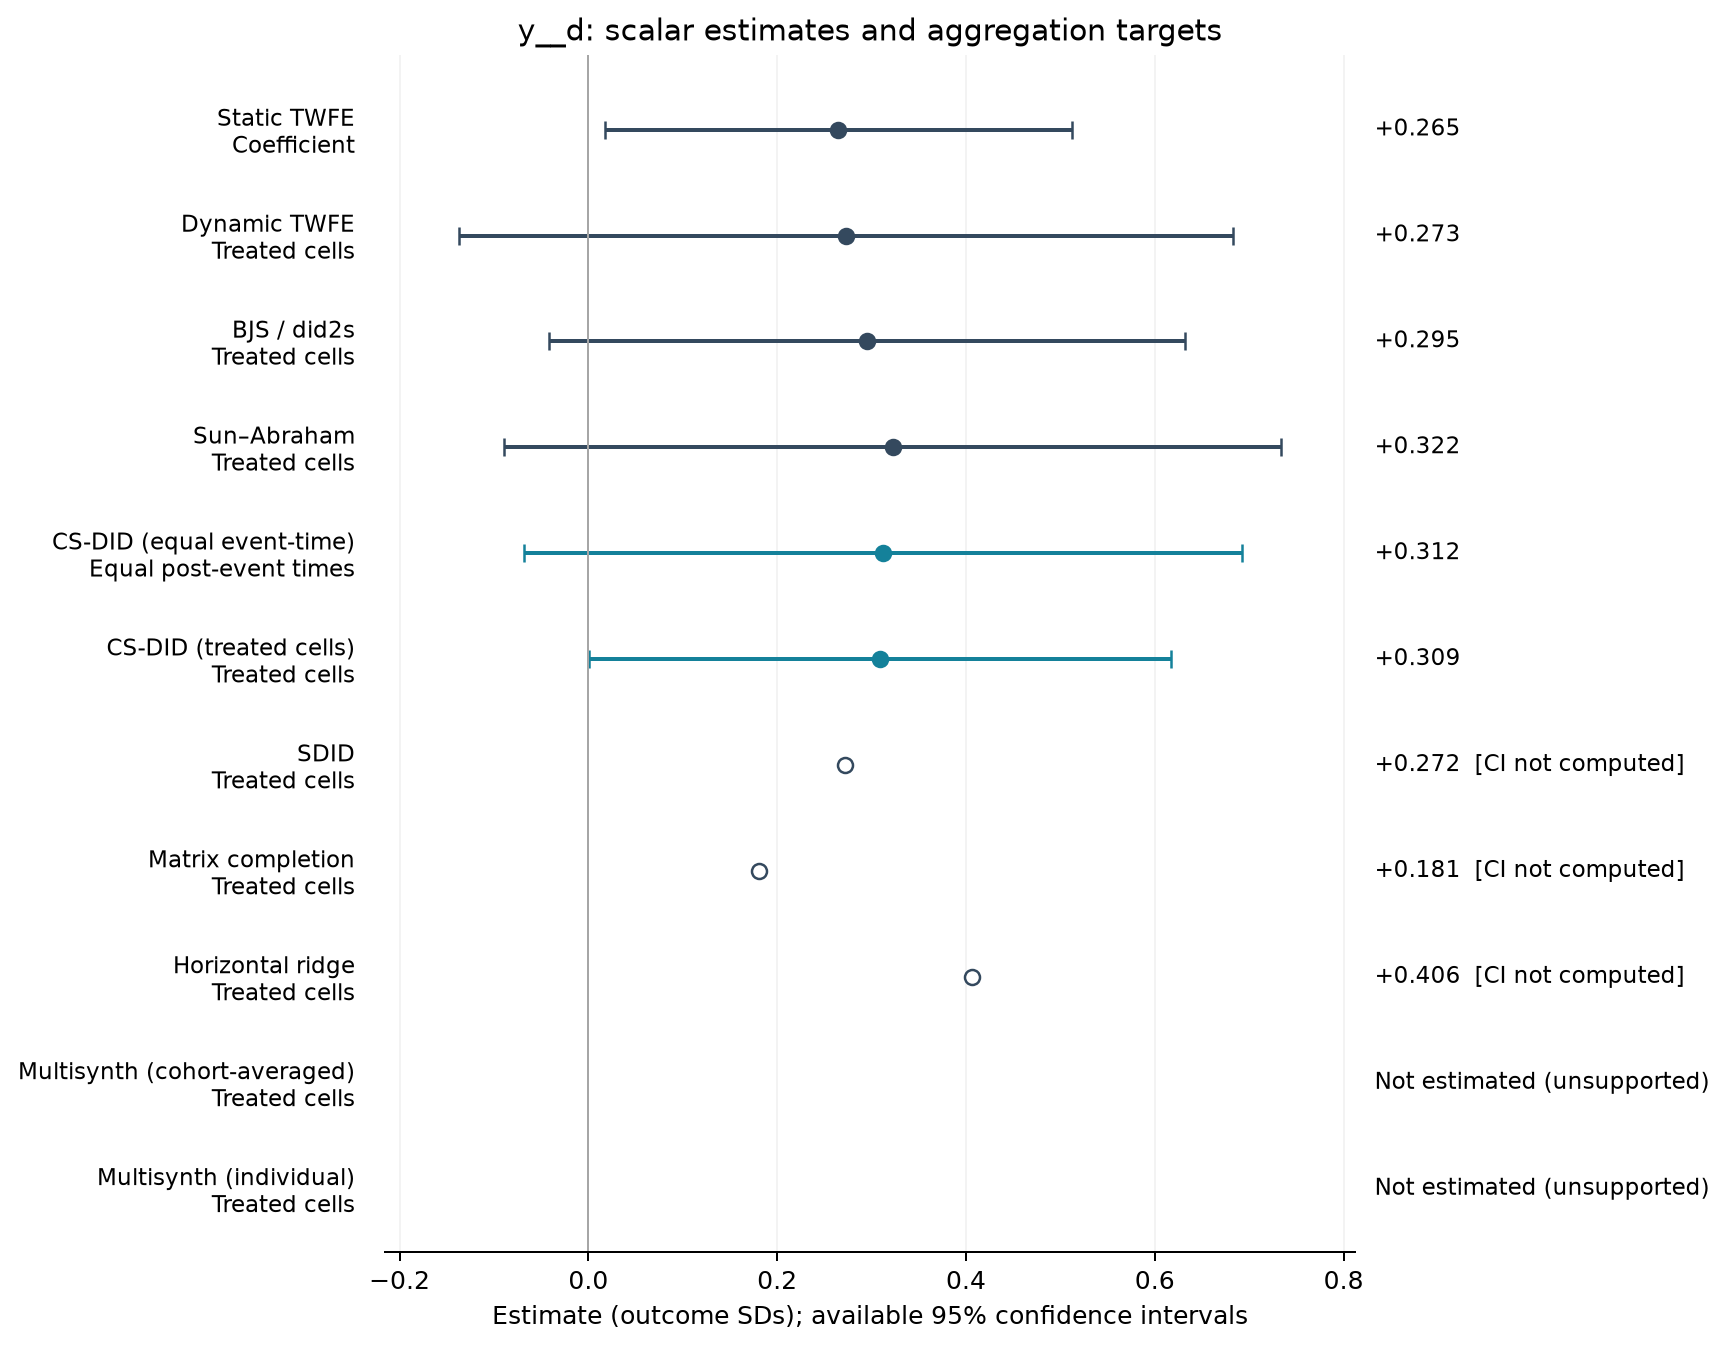
| Estimator | Estimate (SDs) | SE | 95% CI | Averaging |
|---|---|---|---|---|
| Static TWFE | 0.265 | 0.118 | [0.017, 0.512] | Coefficient |
| Dynamic TWFE | 0.273 | 0.195 | [-0.137, 0.682] | Treated cells |
| BJS / did2s | 0.295 | 0.160 | [-0.042, 0.632] | Treated cells |
| Sun–Abraham | 0.322 | 0.196 | [-0.089, 0.734] | Treated cells |
| CS-DID (equal event-time) | 0.312 | 0.194 | [-0.068, 0.692] | Equal post-event times |
| CS-DID (treated cells) | 0.309 | 0.157 | [0.000, 0.618] | Treated cells |
| SDID | 0.272 | — | — | Treated cells |
| Matrix completion | 0.181 | — | — | Treated cells |
| Horizontal ridge | 0.406 | — | — | Treated cells |
Event studies
Periods −10 to +10; pointwise 95% intervals where available.
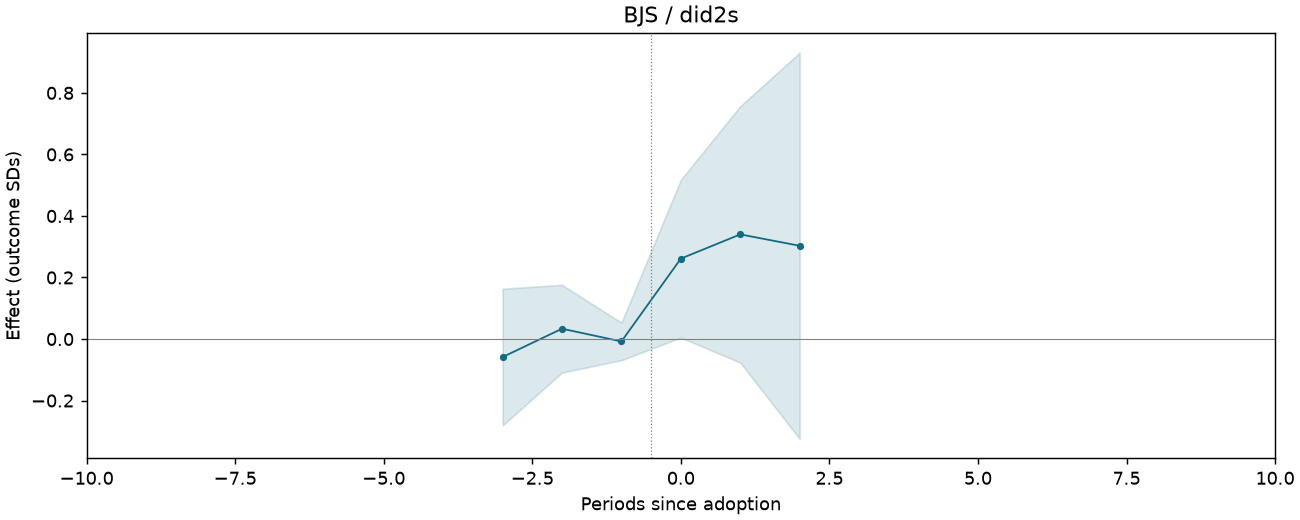
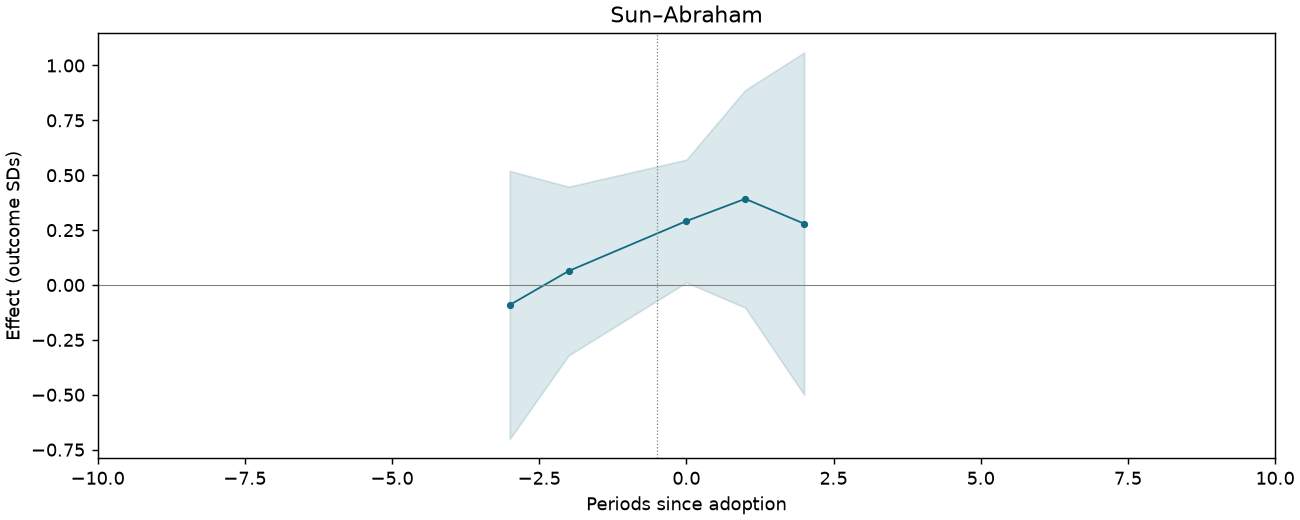
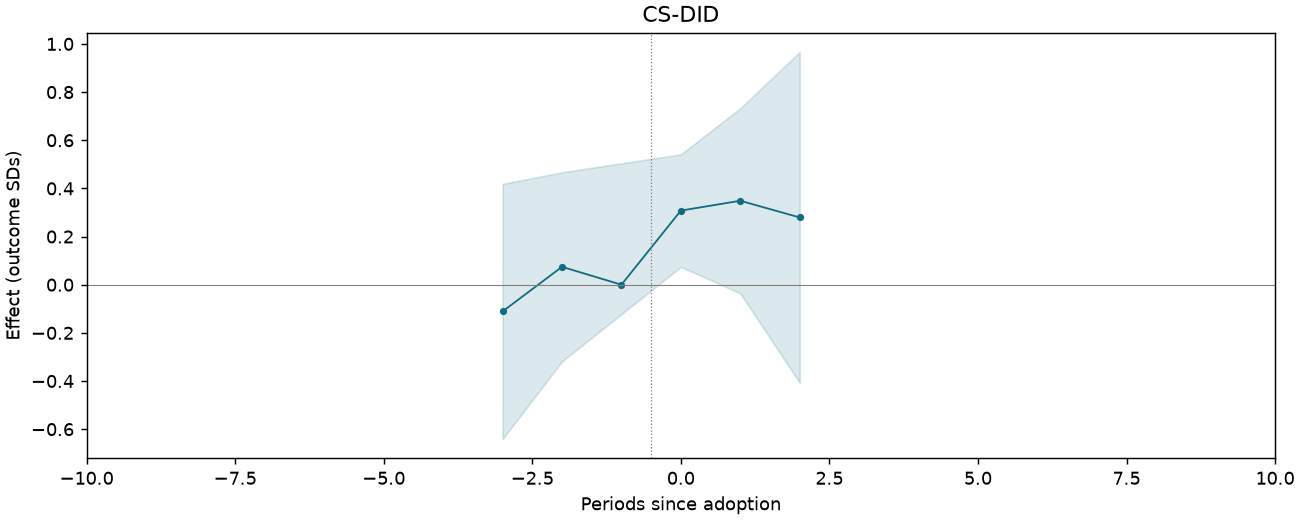
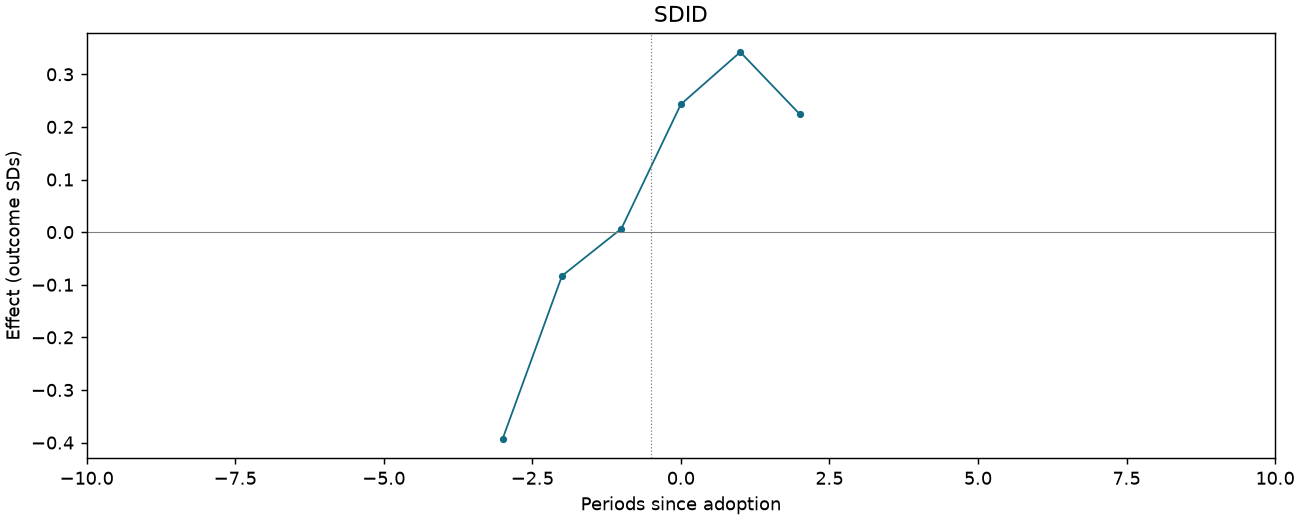
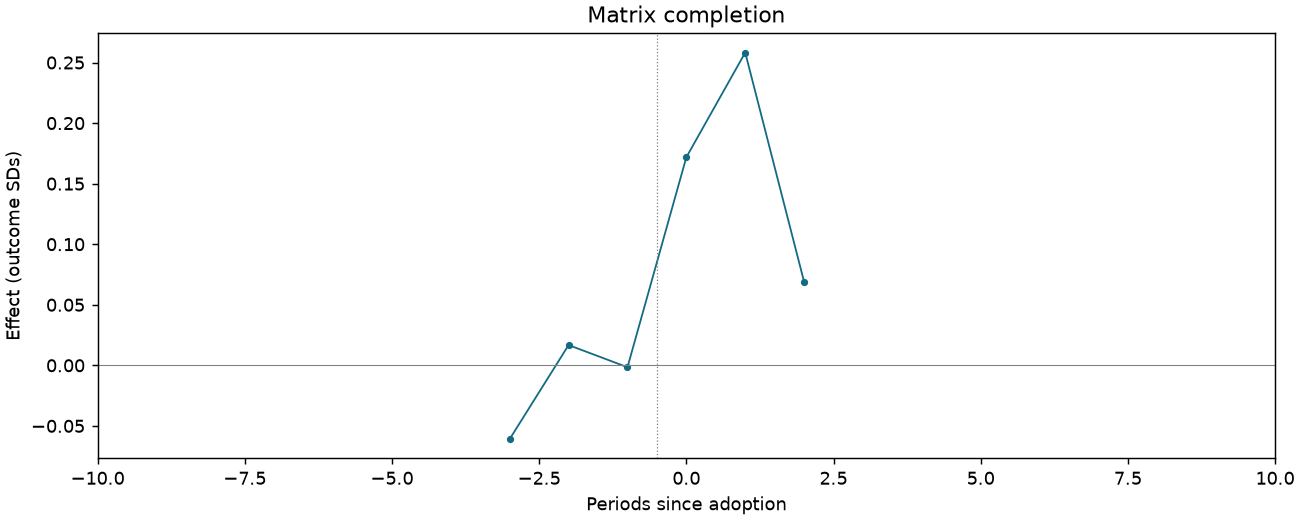
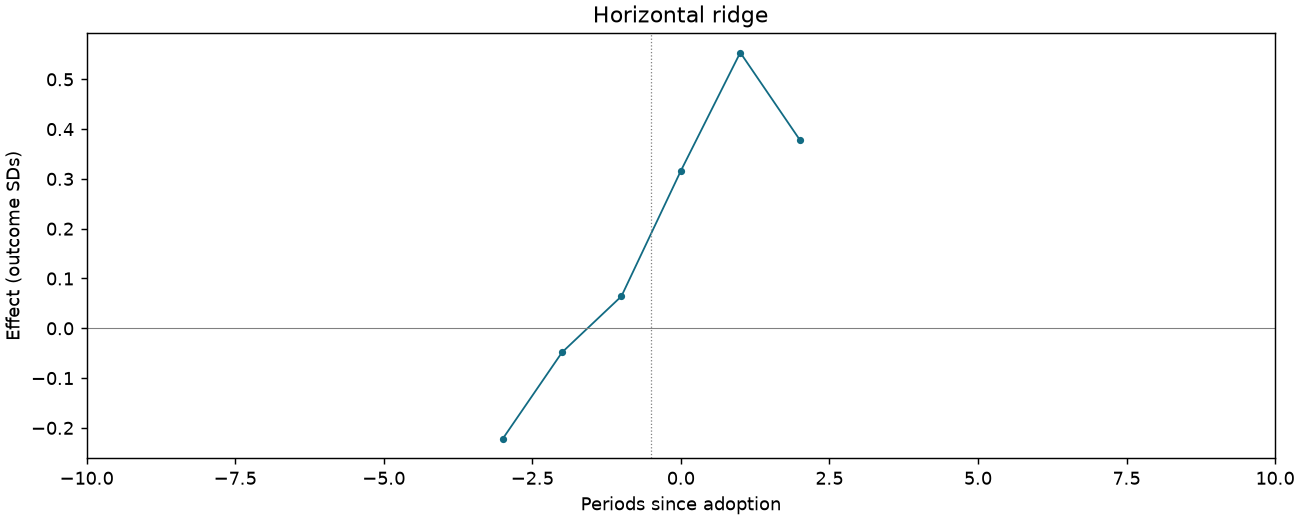
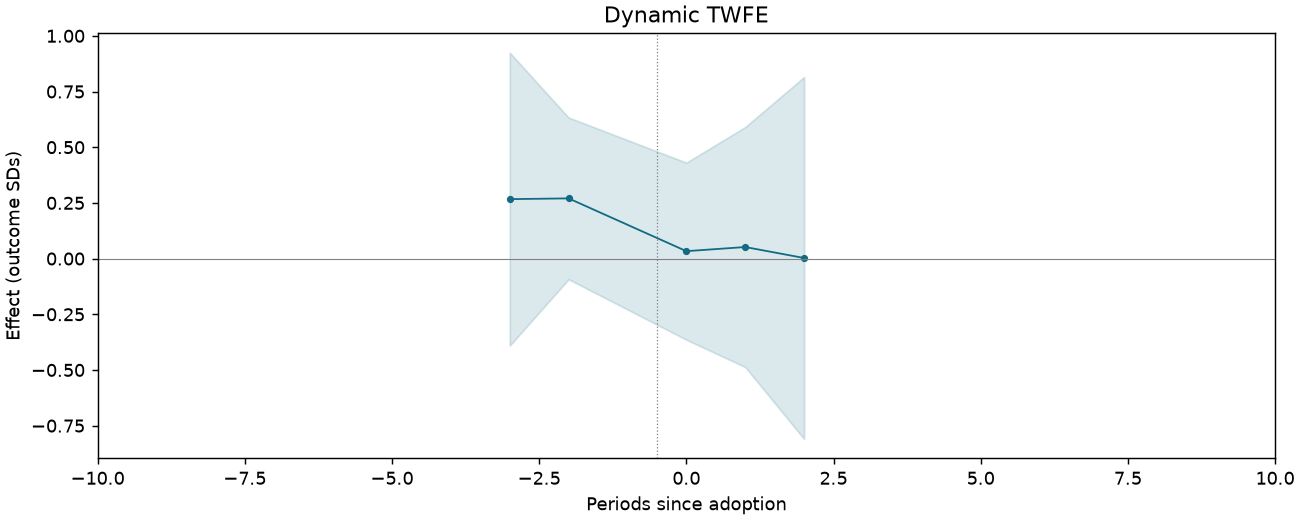
Skeptical of markets [science-track students only]
640 observations · 19 units · 19 clusters · 13 treated / 6 control units.
Estimate comparison
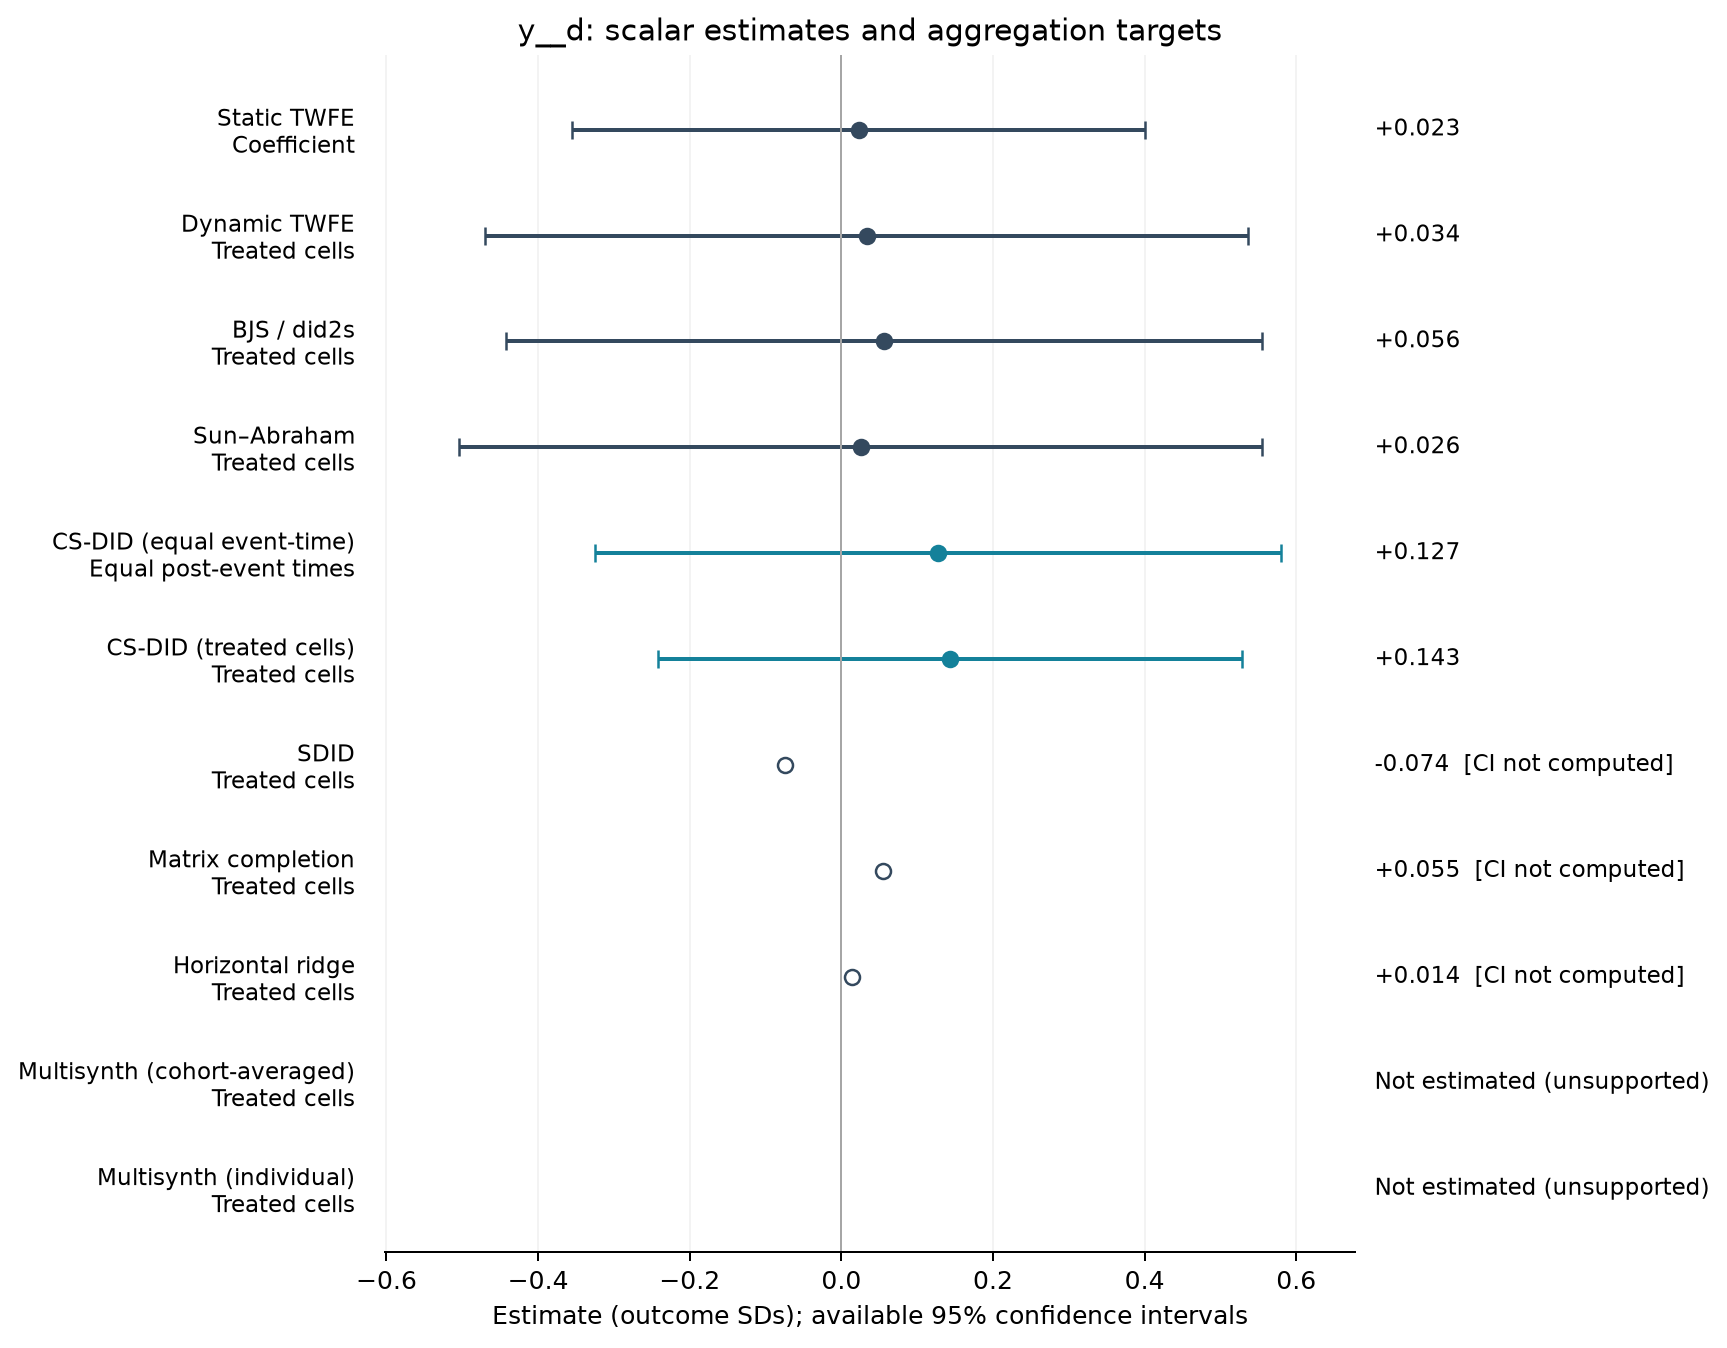
| Estimator | Estimate (SDs) | SE | 95% CI | Averaging |
|---|---|---|---|---|
| Static TWFE | 0.023 | 0.180 | [-0.355, 0.400] | Coefficient |
| Dynamic TWFE | 0.034 | 0.239 | [-0.469, 0.537] | Treated cells |
| BJS / did2s | 0.056 | 0.237 | [-0.442, 0.555] | Treated cells |
| Sun–Abraham | 0.026 | 0.252 | [-0.504, 0.555] | Treated cells |
| CS-DID (equal event-time) | 0.127 | 0.231 | [-0.325, 0.580] | Equal post-event times |
| CS-DID (treated cells) | 0.143 | 0.197 | [-0.242, 0.529] | Treated cells |
| SDID | -0.074 | — | — | Treated cells |
| Matrix completion | 0.055 | — | — | Treated cells |
| Horizontal ridge | 0.014 | — | — | Treated cells |
Event studies
Periods −10 to +10; pointwise 95% intervals where available.
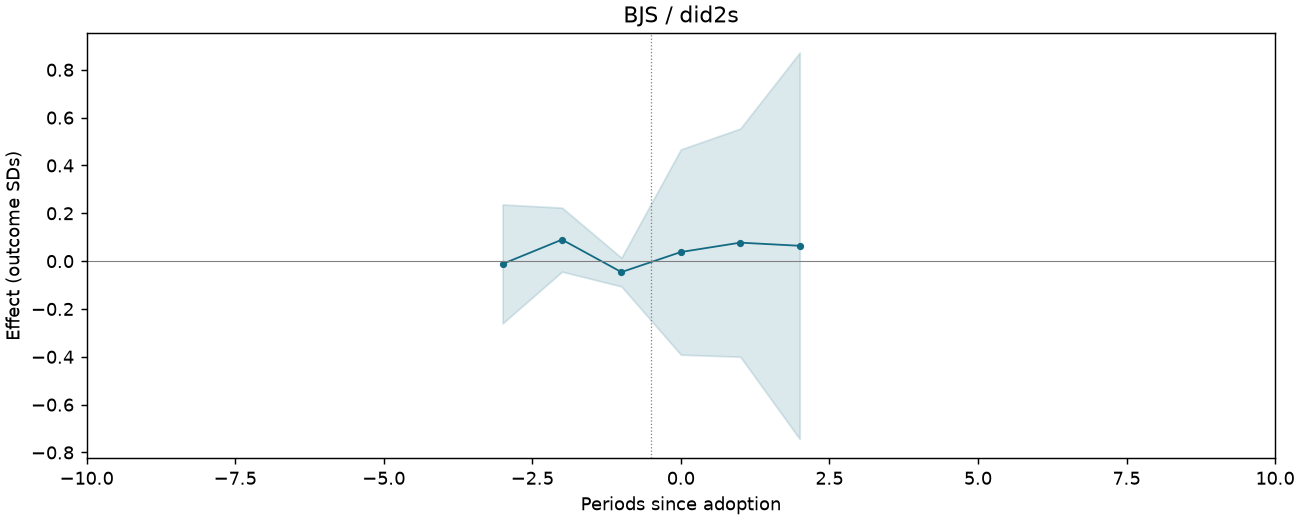
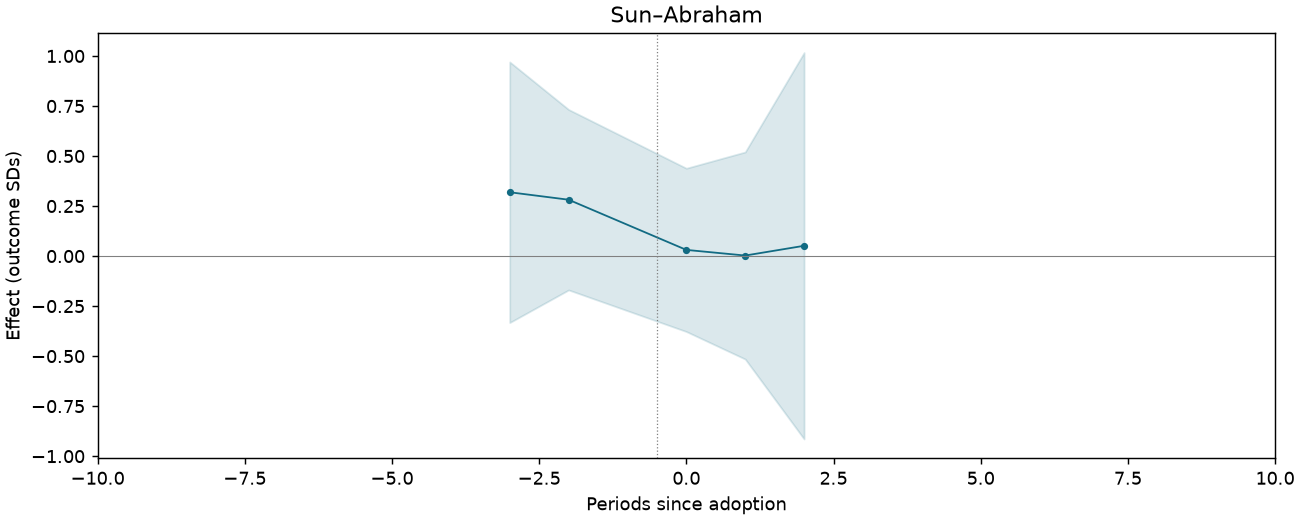
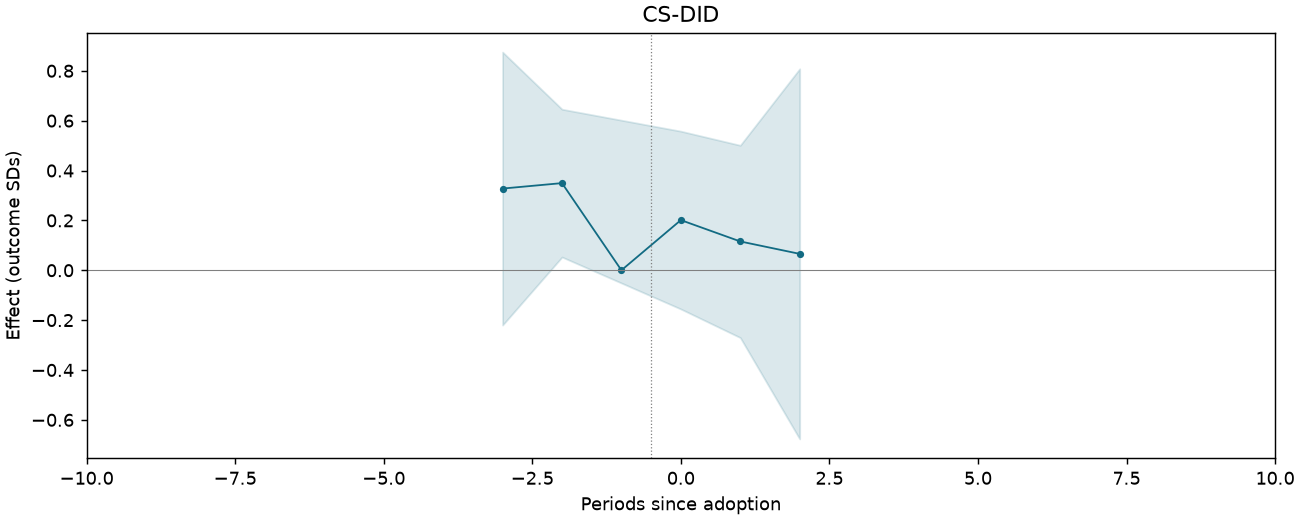
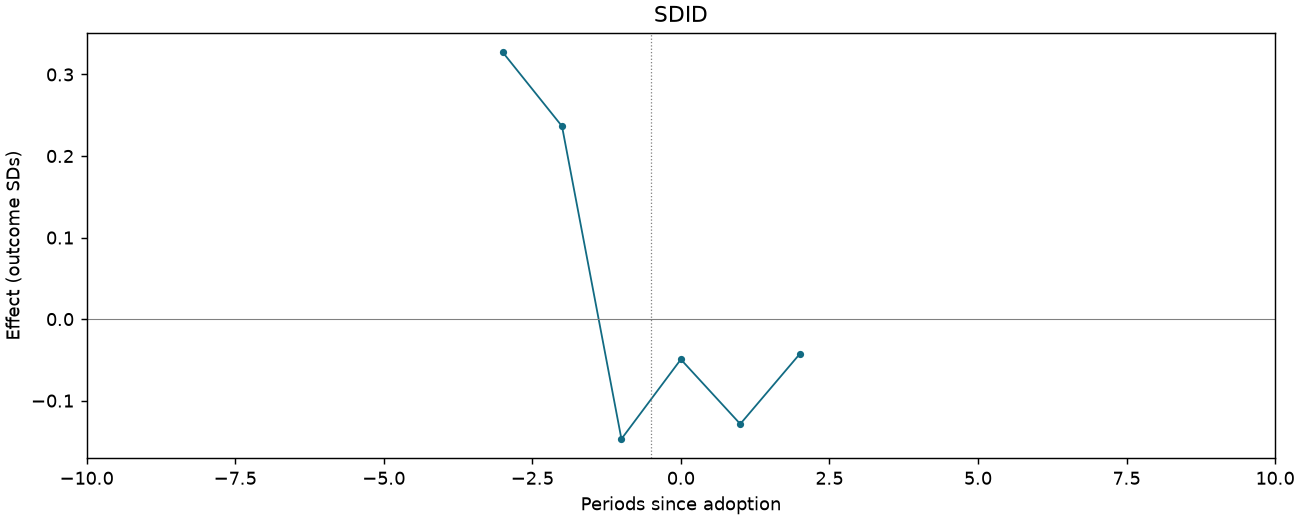
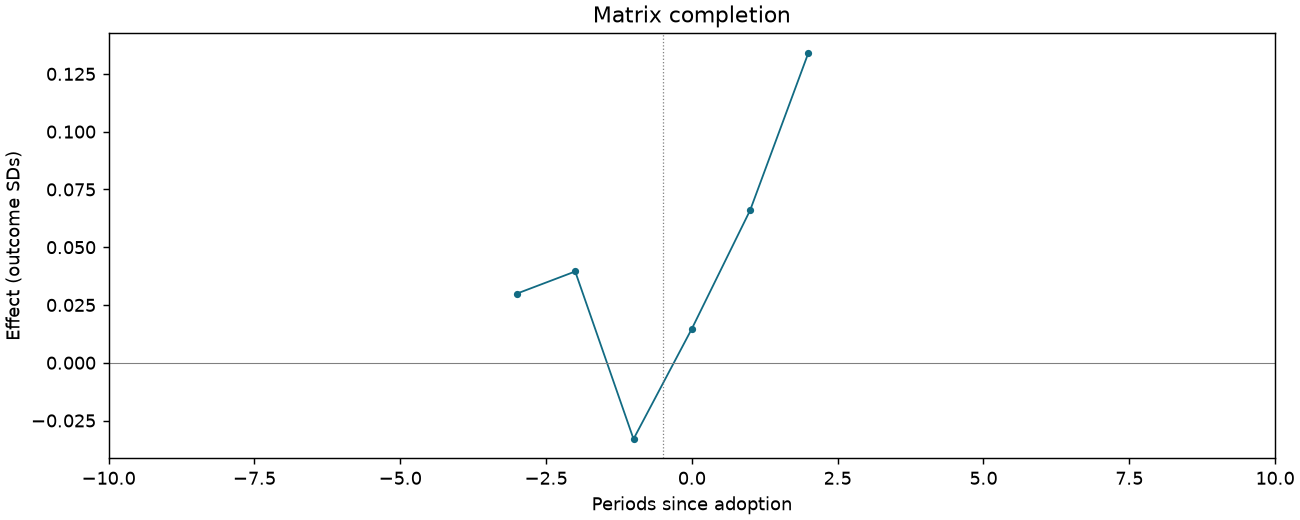
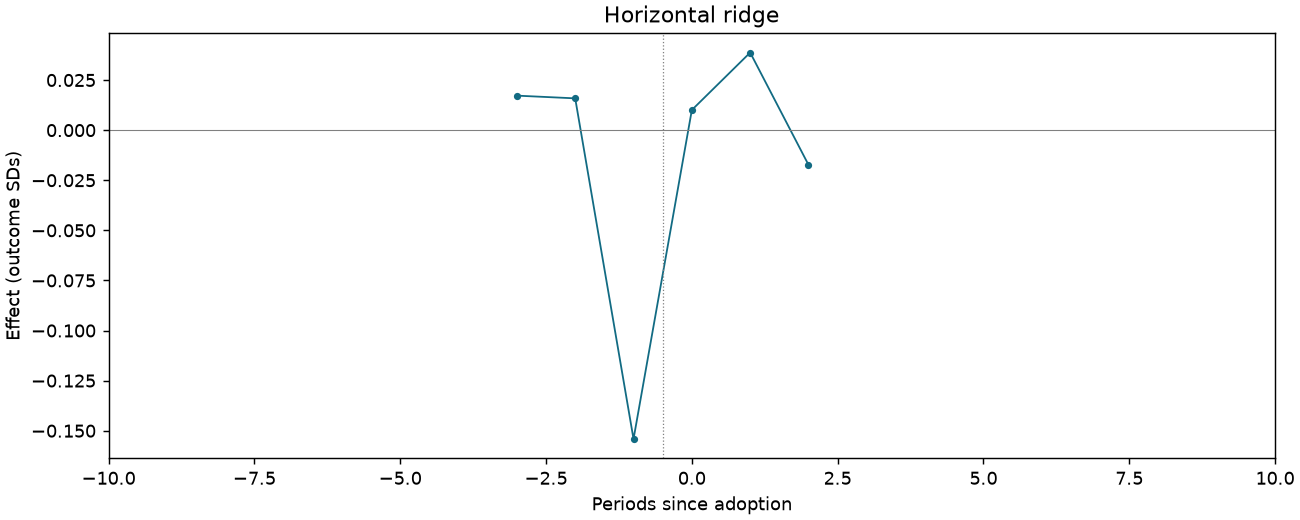
Ethnic identity z-score index [science-track students only]
700 observations · 19 units · 19 clusters · 13 treated / 6 control units.
Estimate comparison
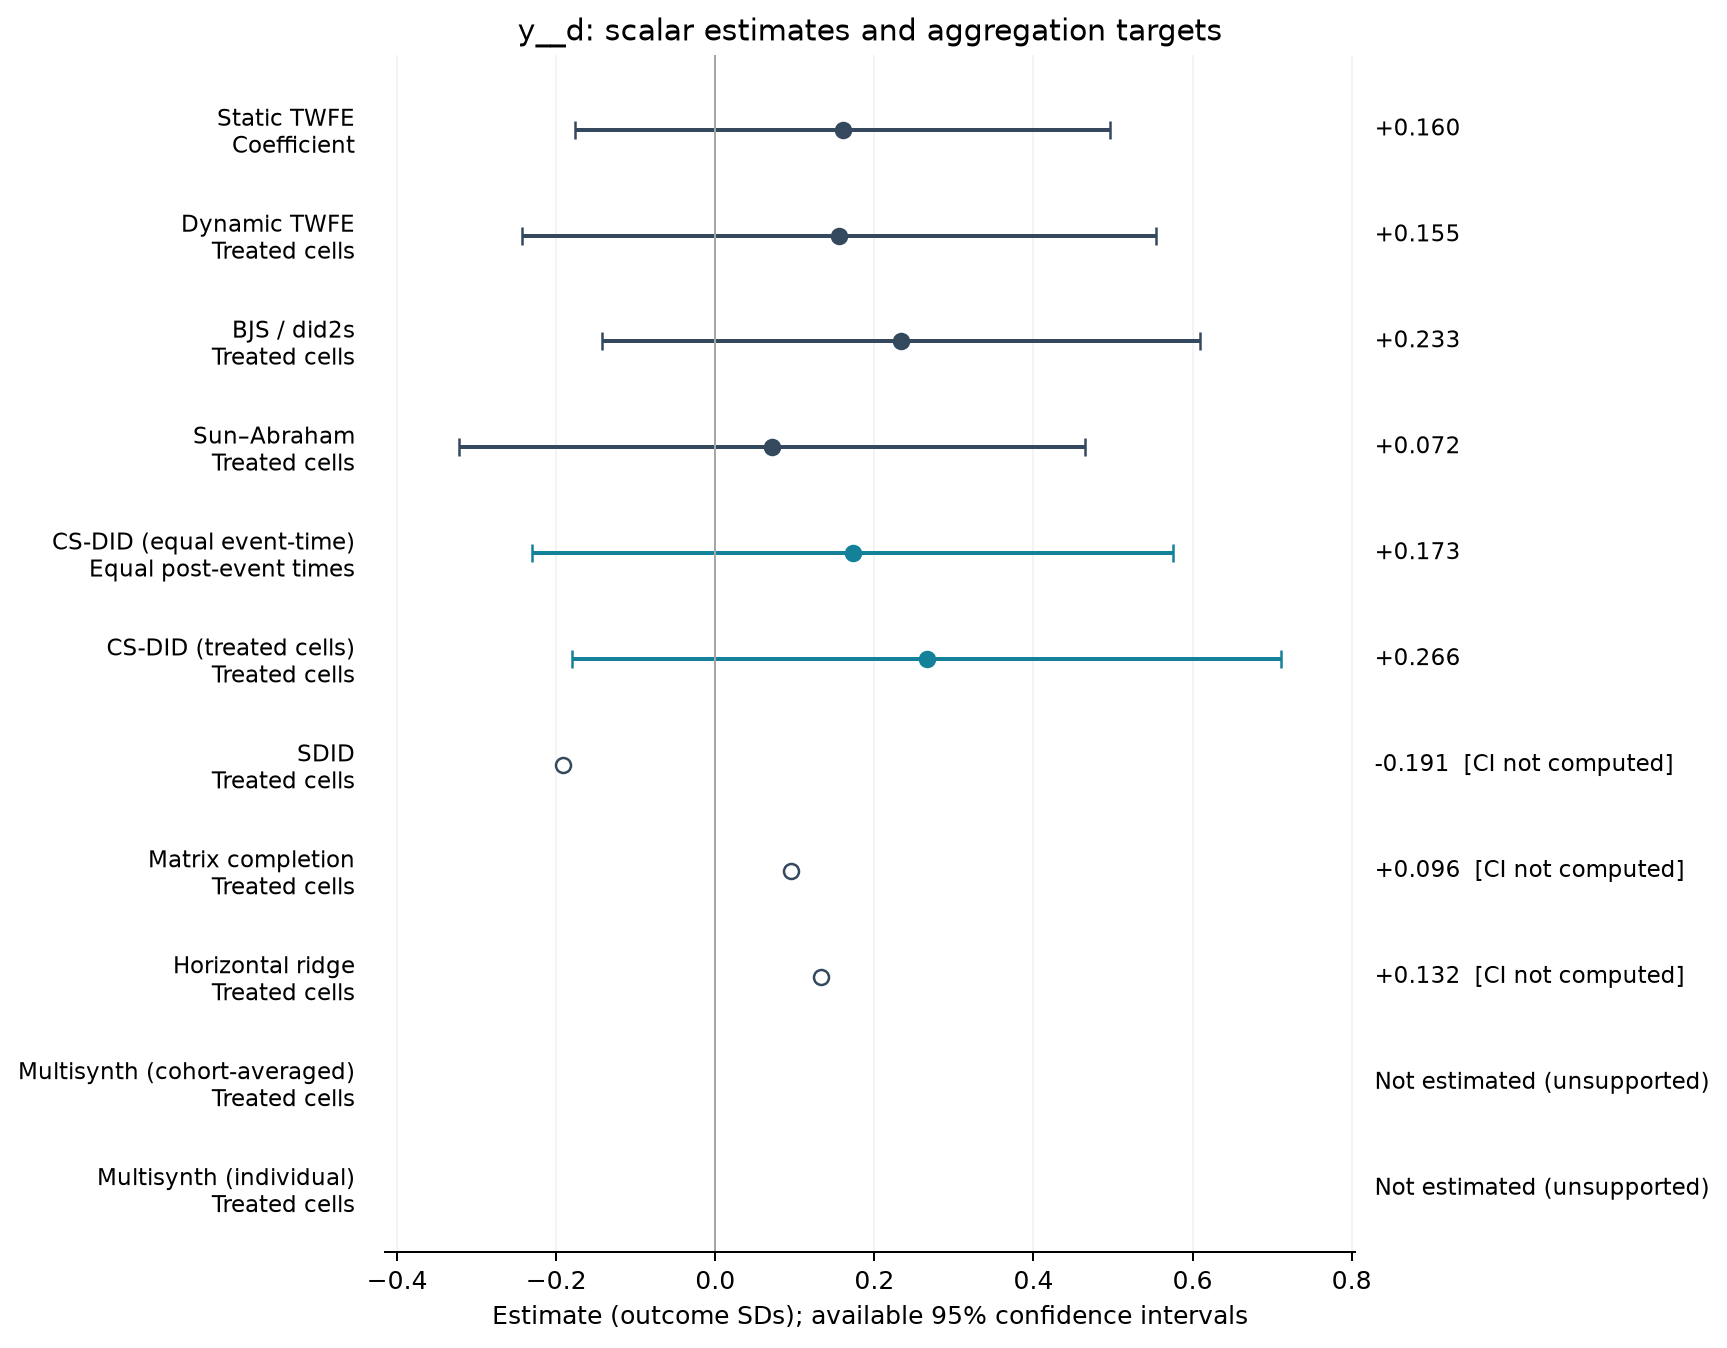
| Estimator | Estimate (SDs) | SE | 95% CI | Averaging |
|---|---|---|---|---|
| Static TWFE | 0.160 | 0.160 | [-0.176, 0.497] | Coefficient |
| Dynamic TWFE | 0.155 | 0.190 | [-0.244, 0.554] | Treated cells |
| BJS / did2s | 0.233 | 0.179 | [-0.142, 0.609] | Treated cells |
| Sun–Abraham | 0.072 | 0.187 | [-0.322, 0.465] | Treated cells |
| CS-DID (equal event-time) | 0.173 | 0.206 | [-0.230, 0.576] | Equal post-event times |
| CS-DID (treated cells) | 0.266 | 0.227 | [-0.180, 0.711] | Treated cells |
| SDID | -0.191 | — | — | Treated cells |
| Matrix completion | 0.096 | — | — | Treated cells |
| Horizontal ridge | 0.132 | — | — | Treated cells |
Event studies
Periods −10 to +10; pointwise 95% intervals where available.
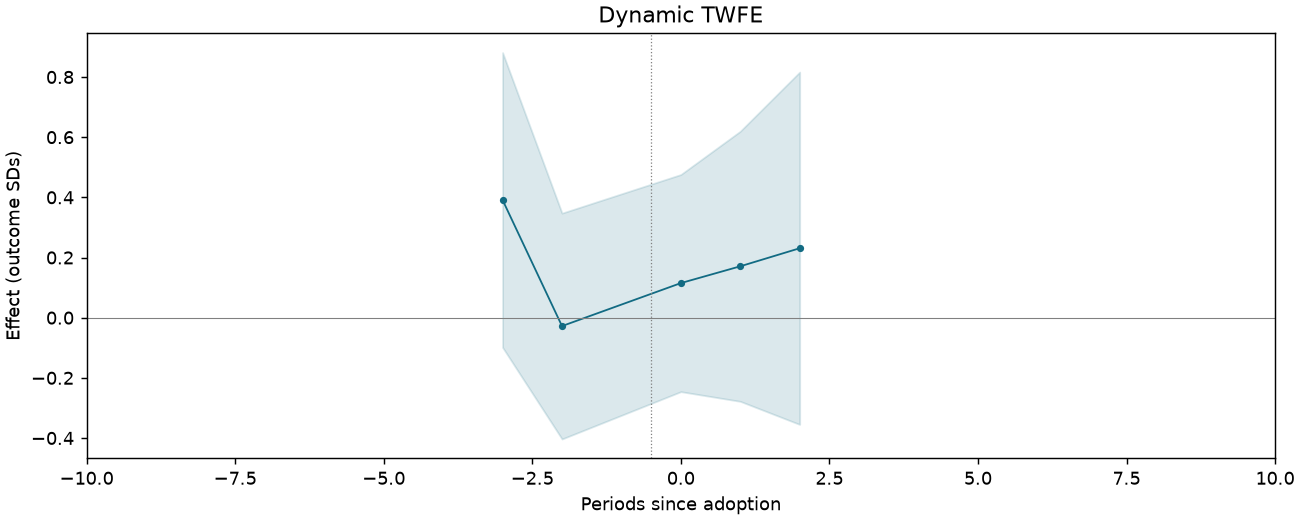
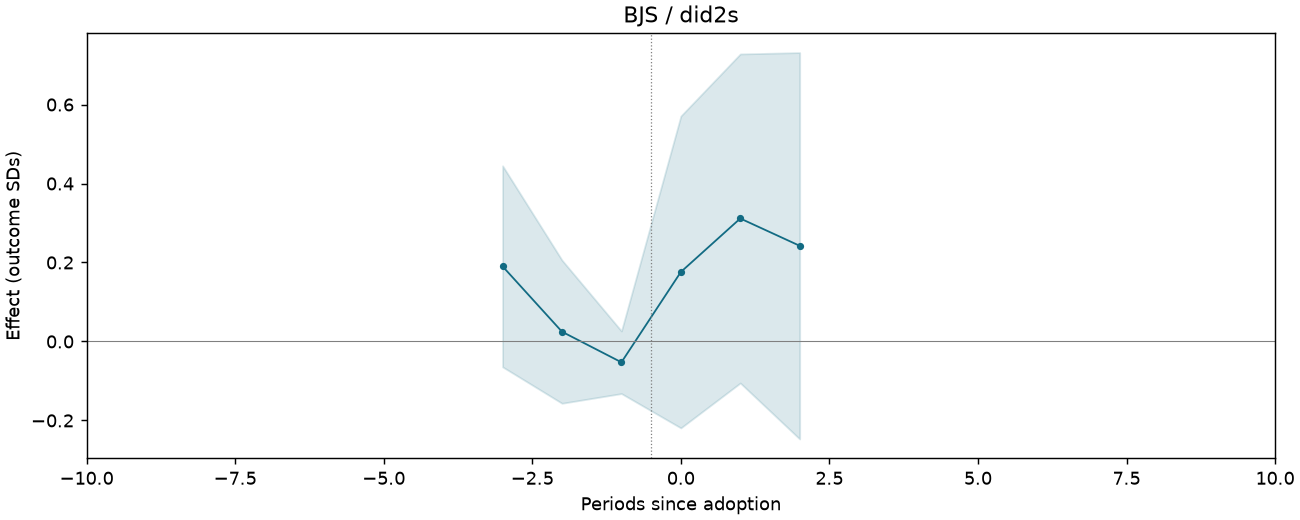
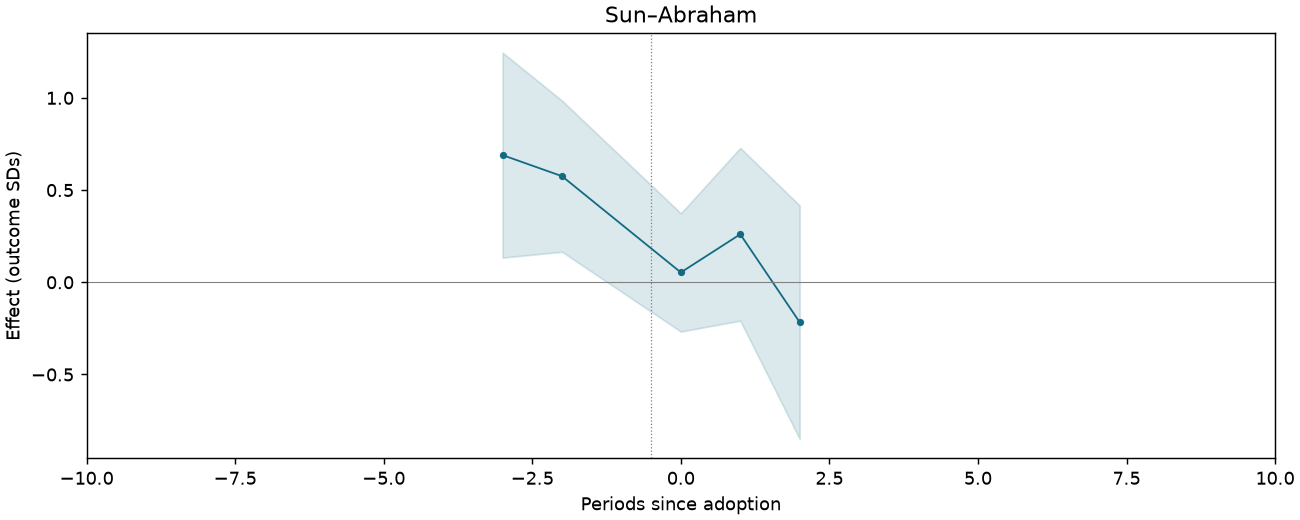
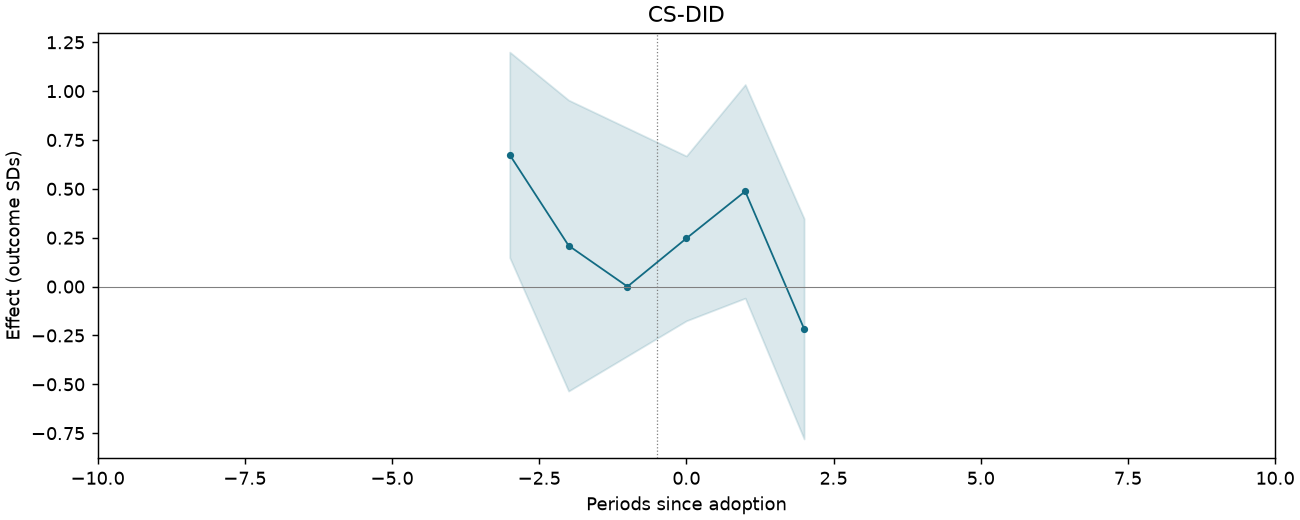
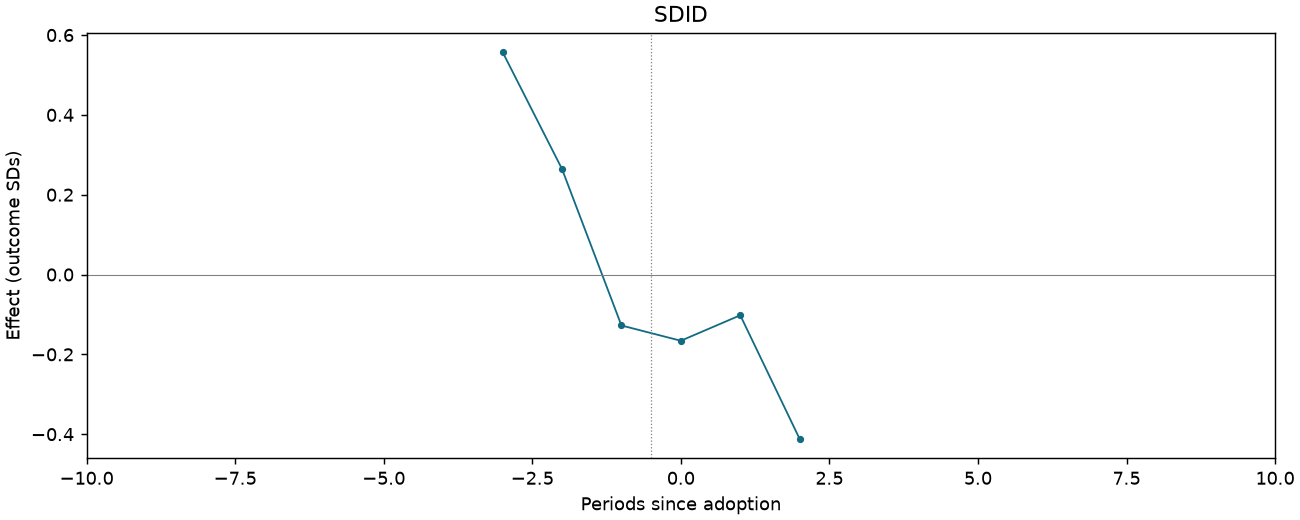
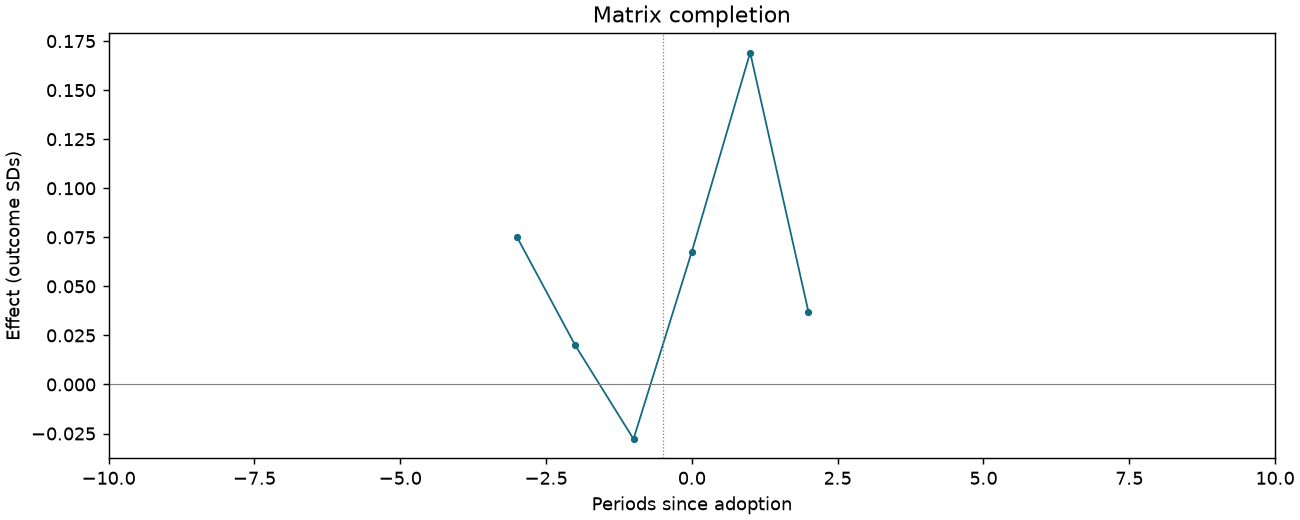
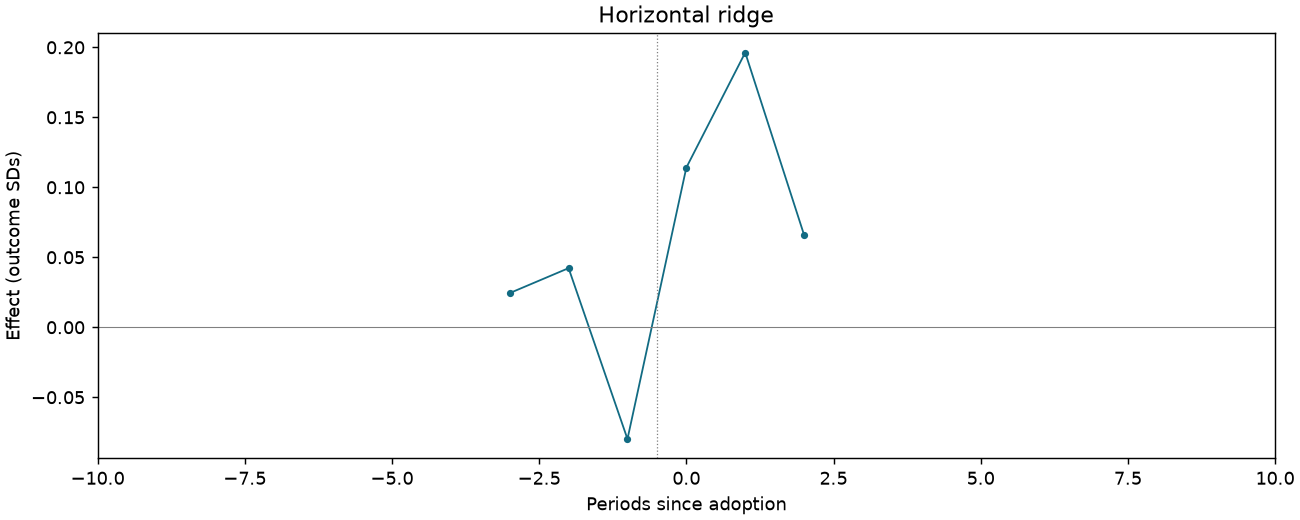
Identity: Chinese [science-track students only]
661 observations · 19 units · 19 clusters · 13 treated / 6 control units.
Estimate comparison
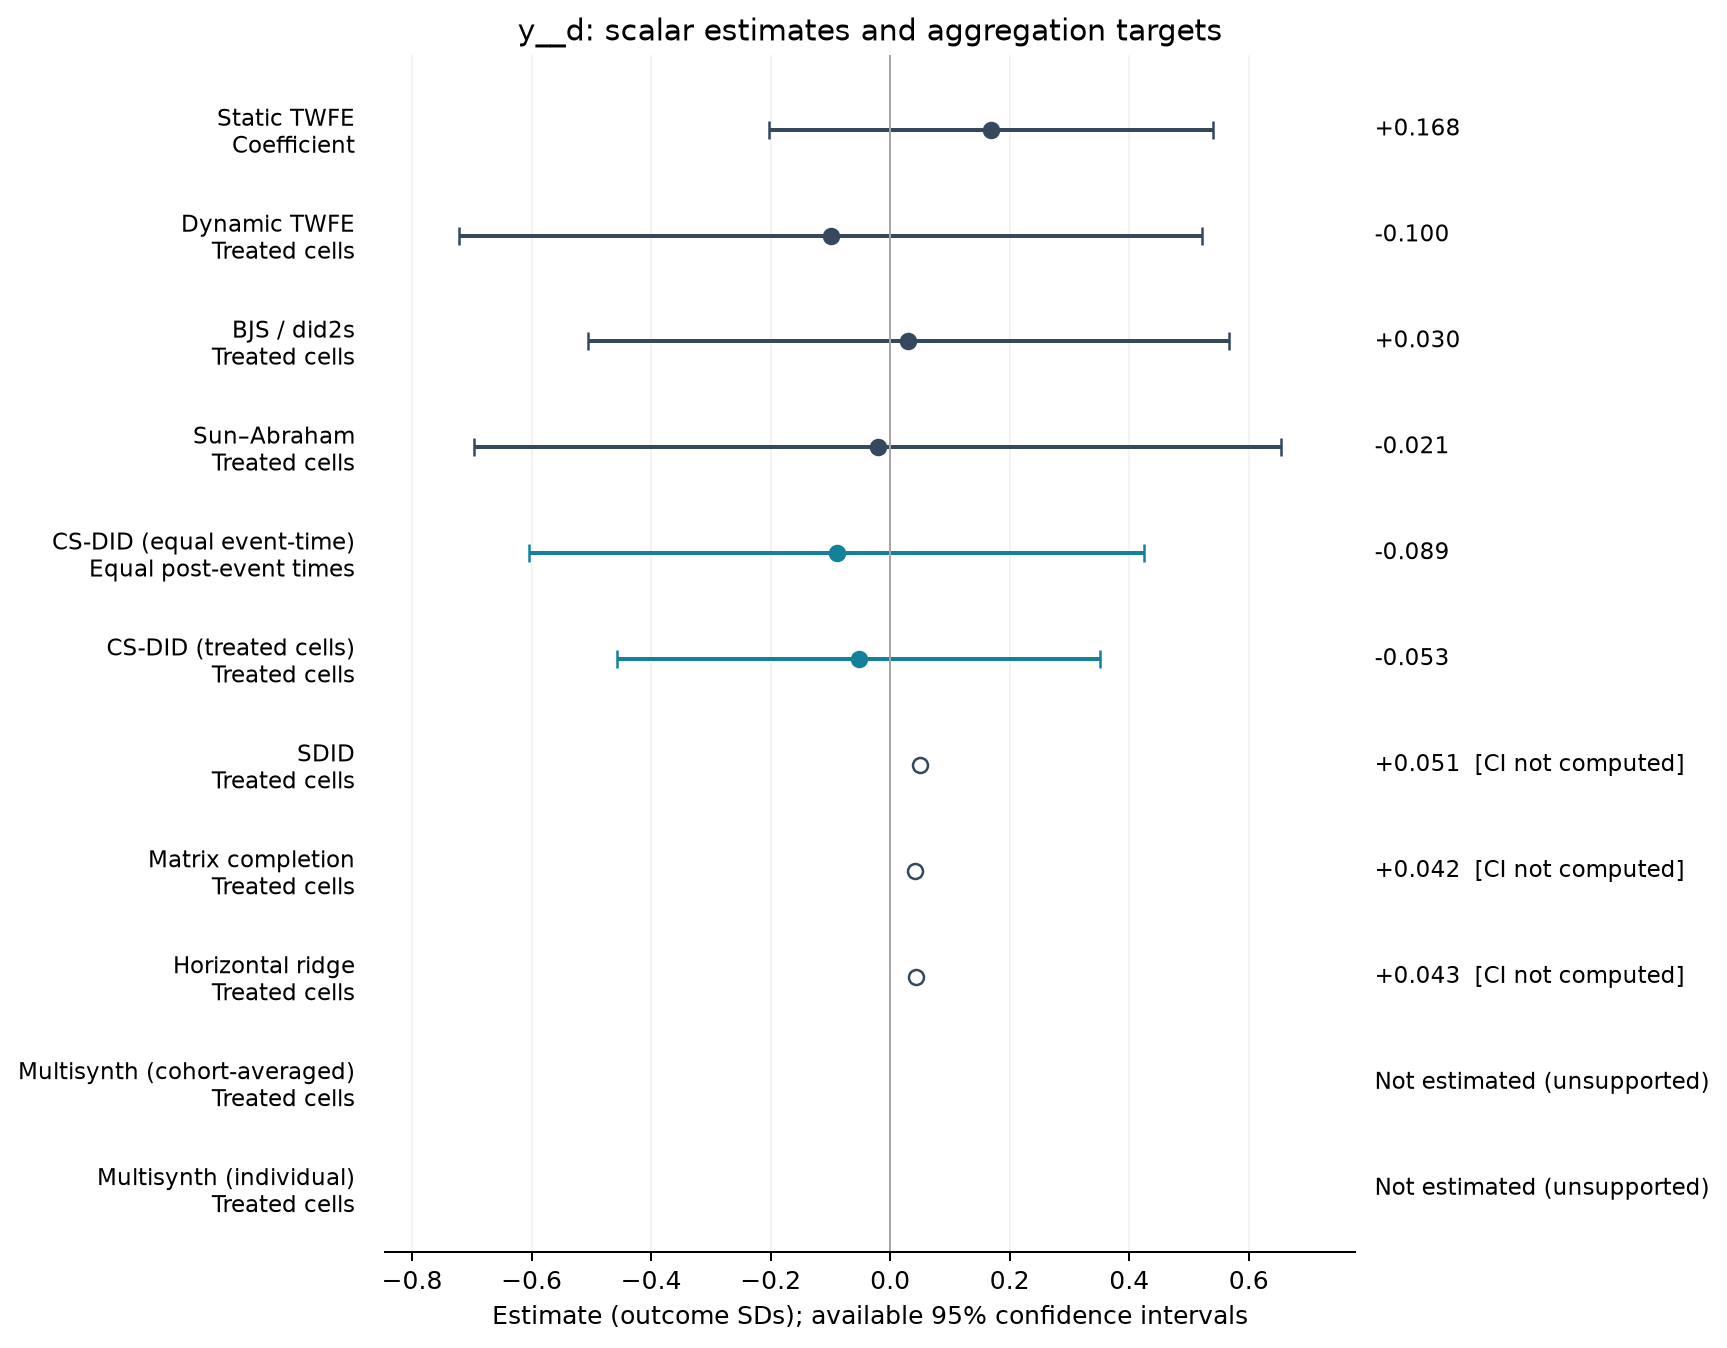
| Estimator | Estimate (SDs) | SE | 95% CI | Averaging |
|---|---|---|---|---|
| Static TWFE | 0.168 | 0.177 | [-0.203, 0.539] | Coefficient |
| Dynamic TWFE | -0.100 | 0.296 | [-0.721, 0.522] | Treated cells |
| BJS / did2s | 0.030 | 0.255 | [-0.506, 0.566] | Treated cells |
| Sun–Abraham | -0.021 | 0.321 | [-0.696, 0.654] | Treated cells |
| CS-DID (equal event-time) | -0.089 | 0.262 | [-0.604, 0.425] | Equal post-event times |
| CS-DID (treated cells) | -0.053 | 0.206 | [-0.456, 0.351] | Treated cells |
| SDID | 0.051 | — | — | Treated cells |
| Matrix completion | 0.042 | — | — | Treated cells |
| Horizontal ridge | 0.043 | — | — | Treated cells |
Event studies
Periods −10 to +10; pointwise 95% intervals where available.
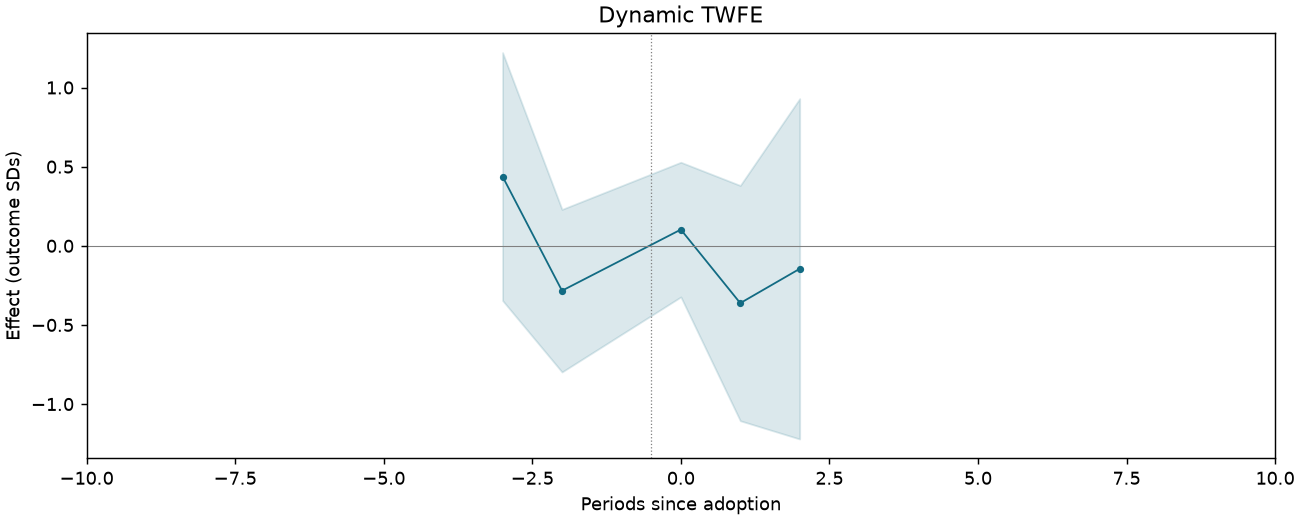
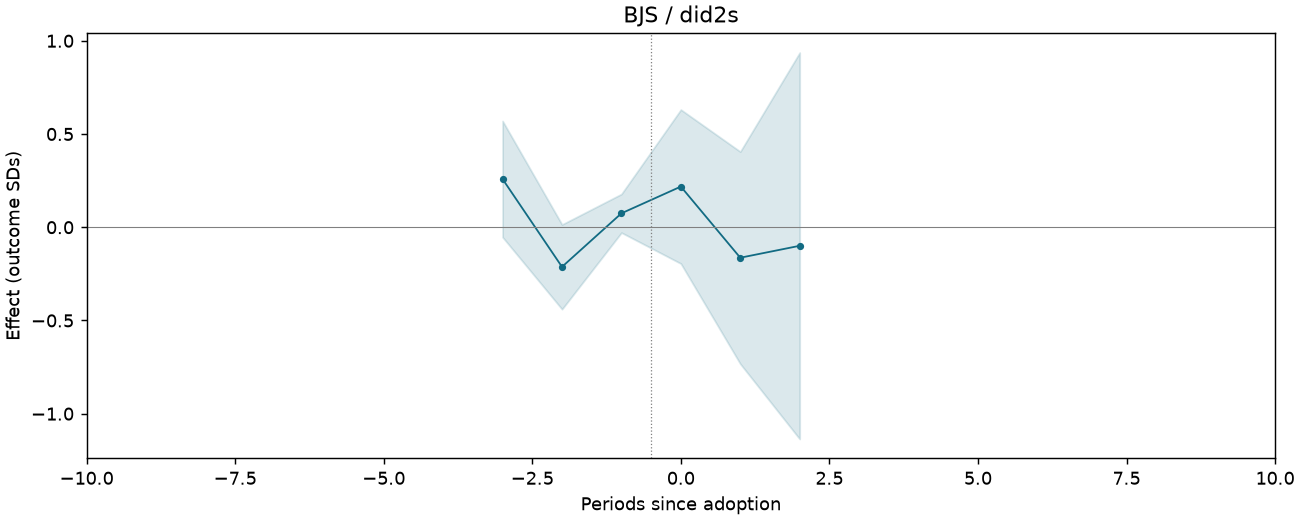
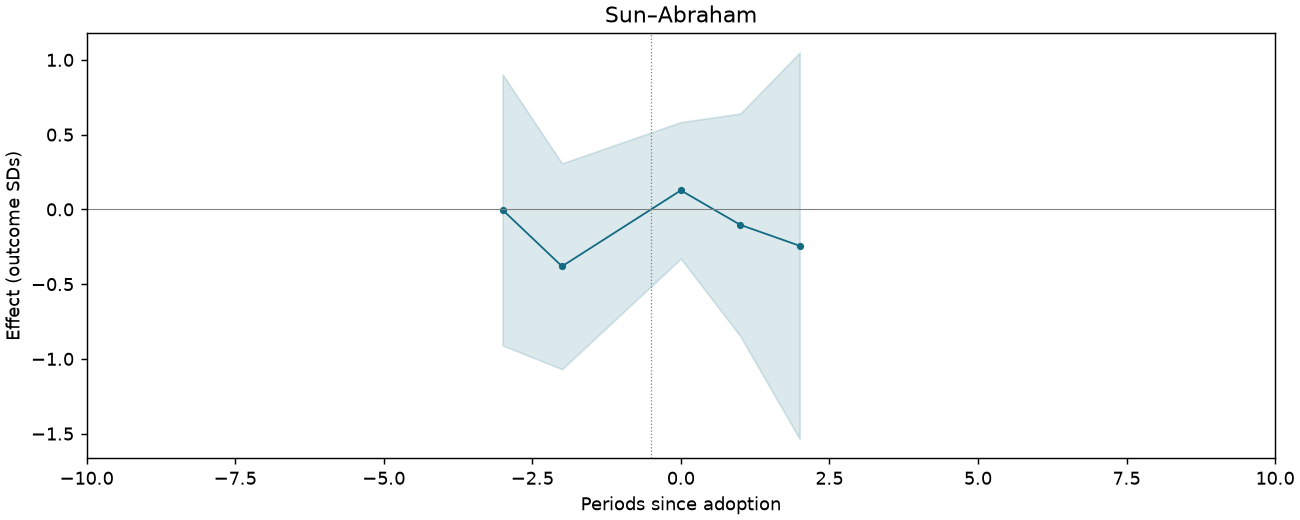
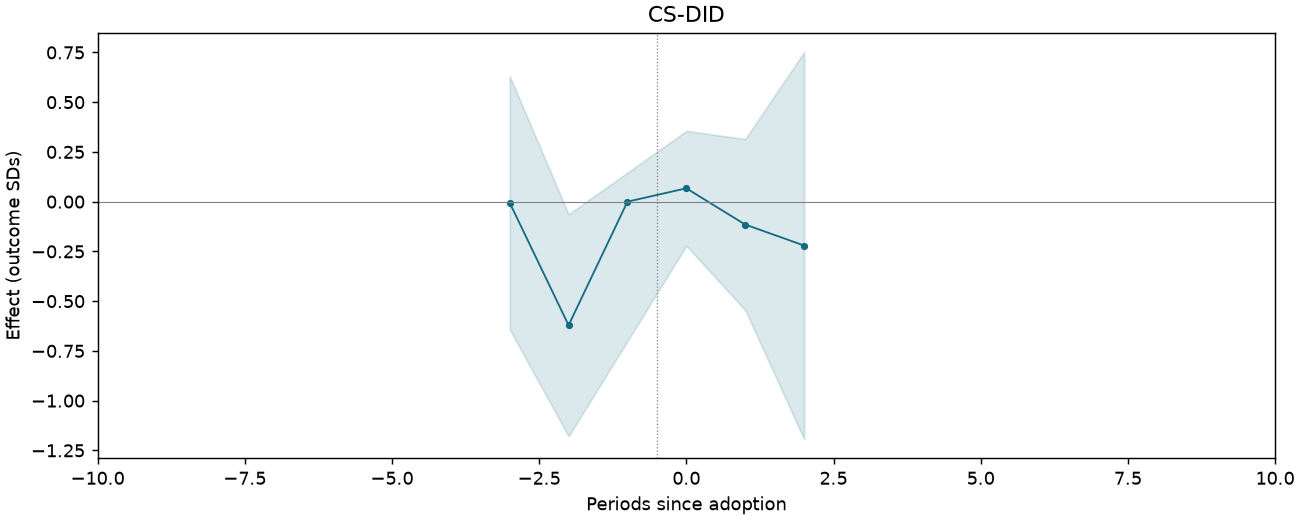
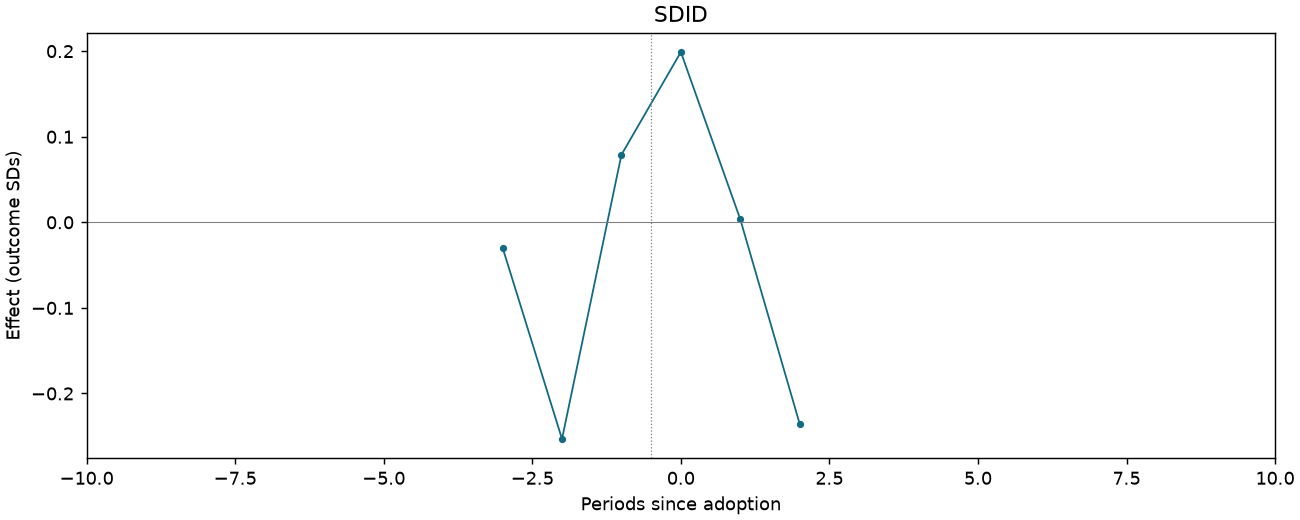
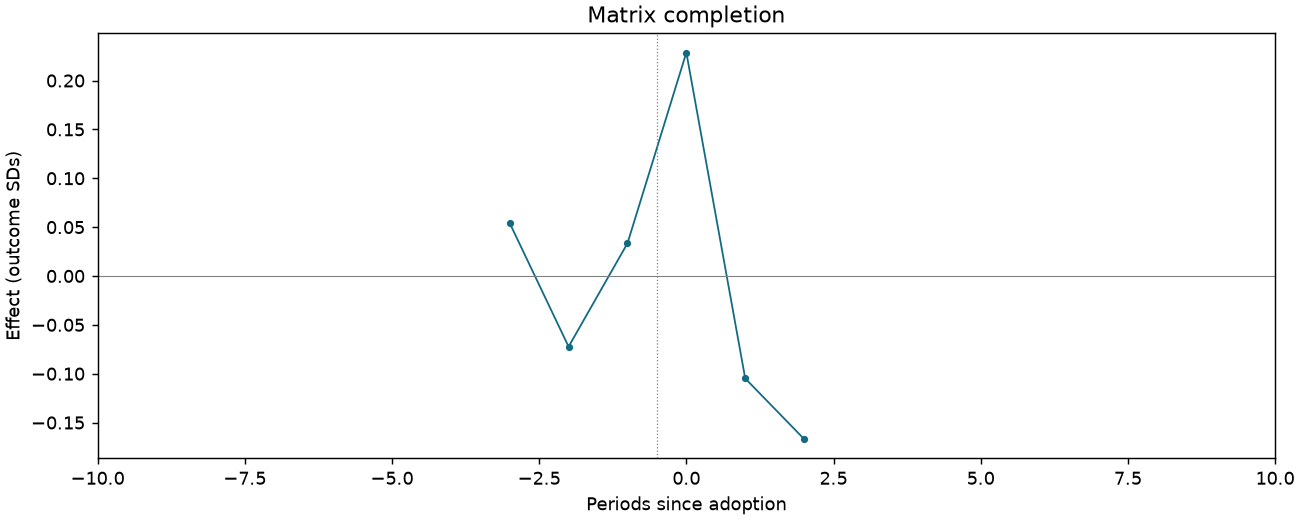
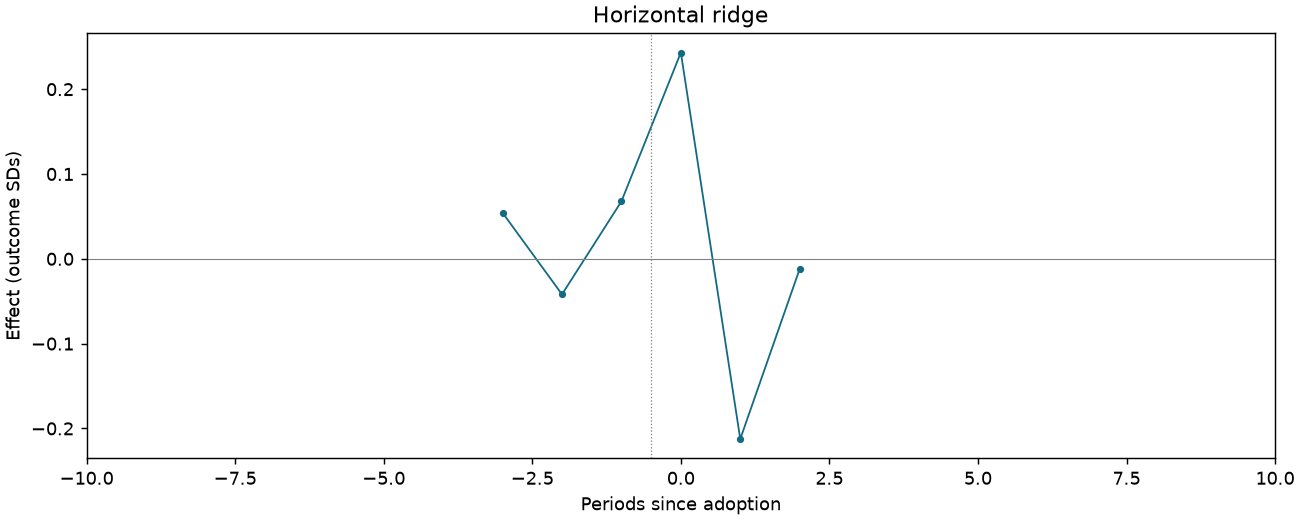
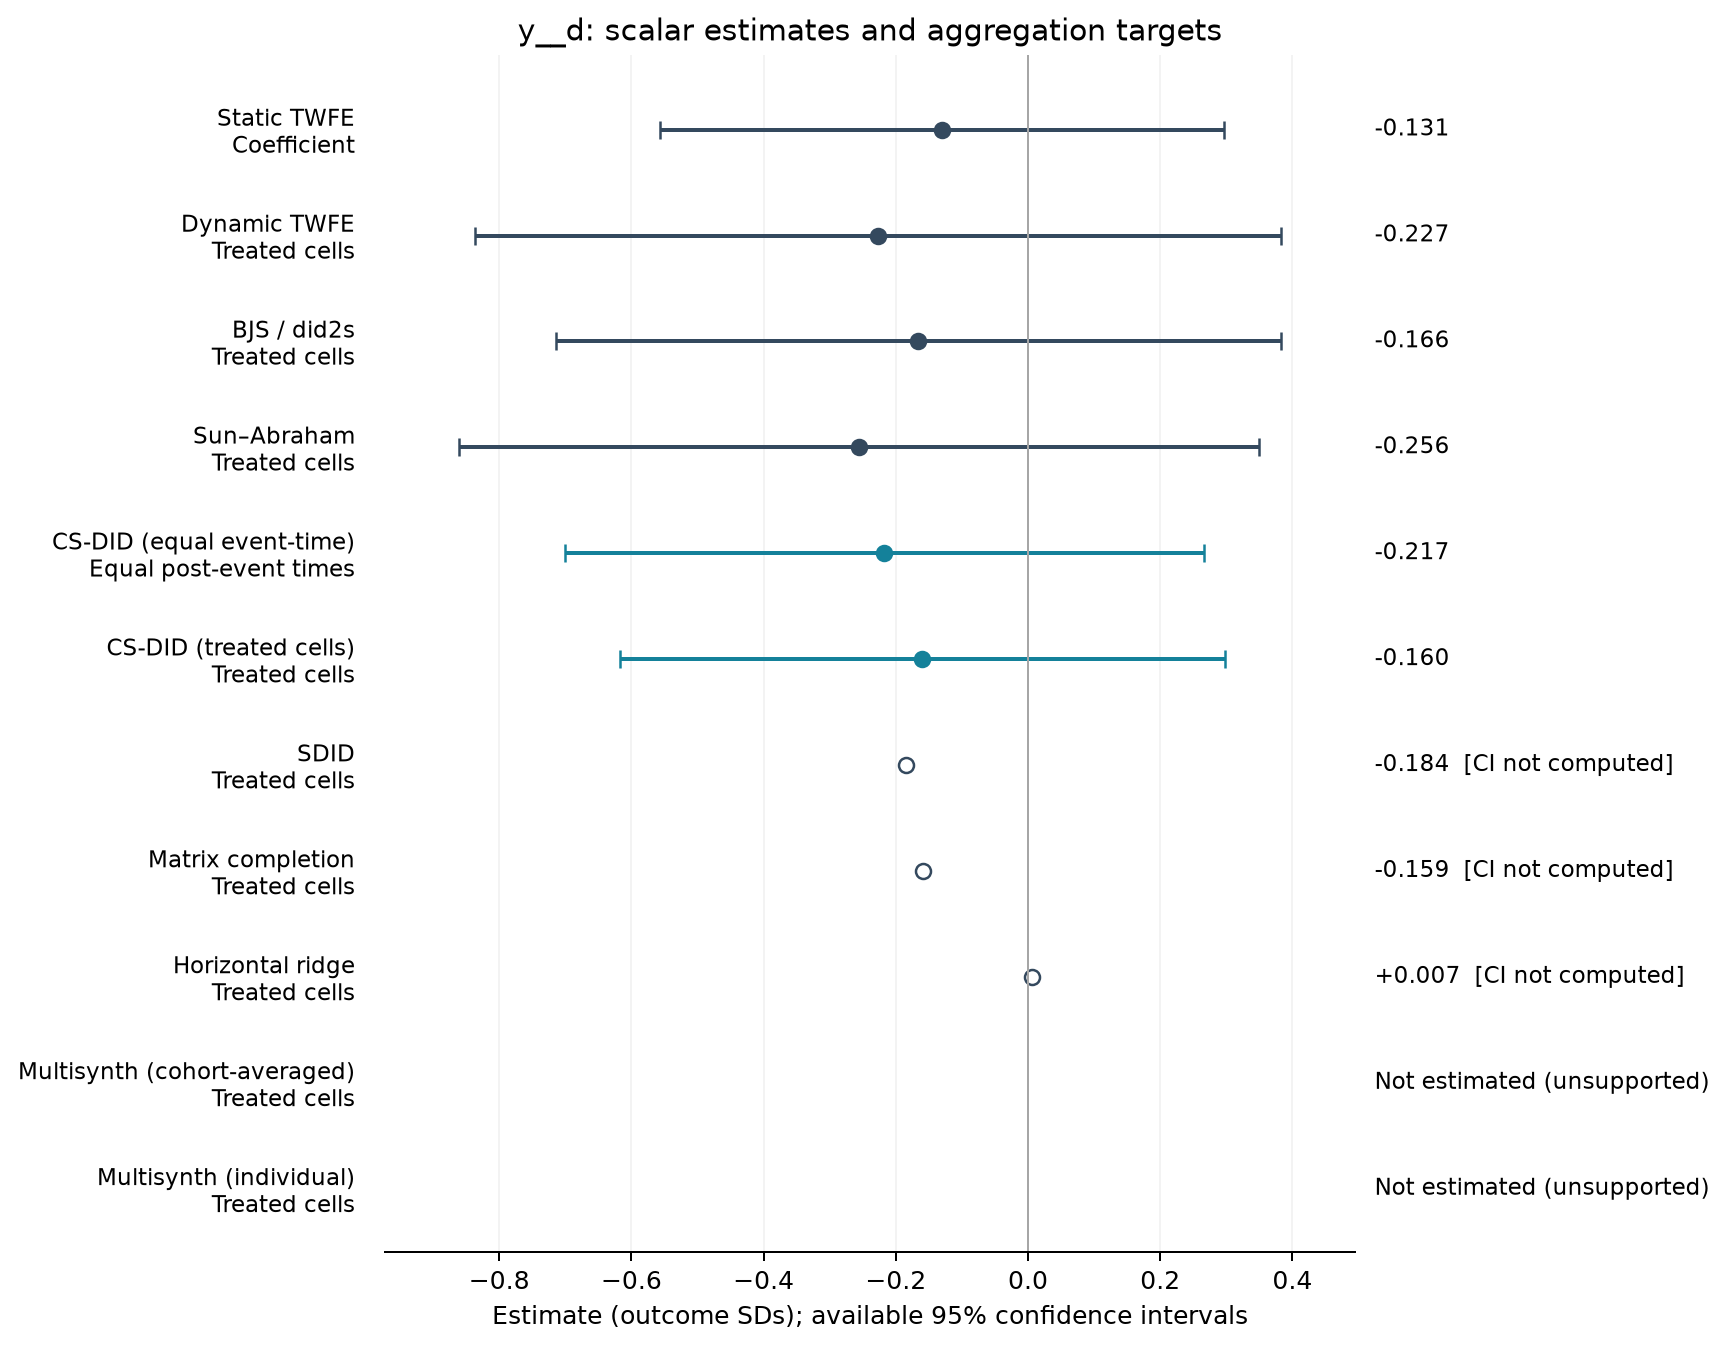
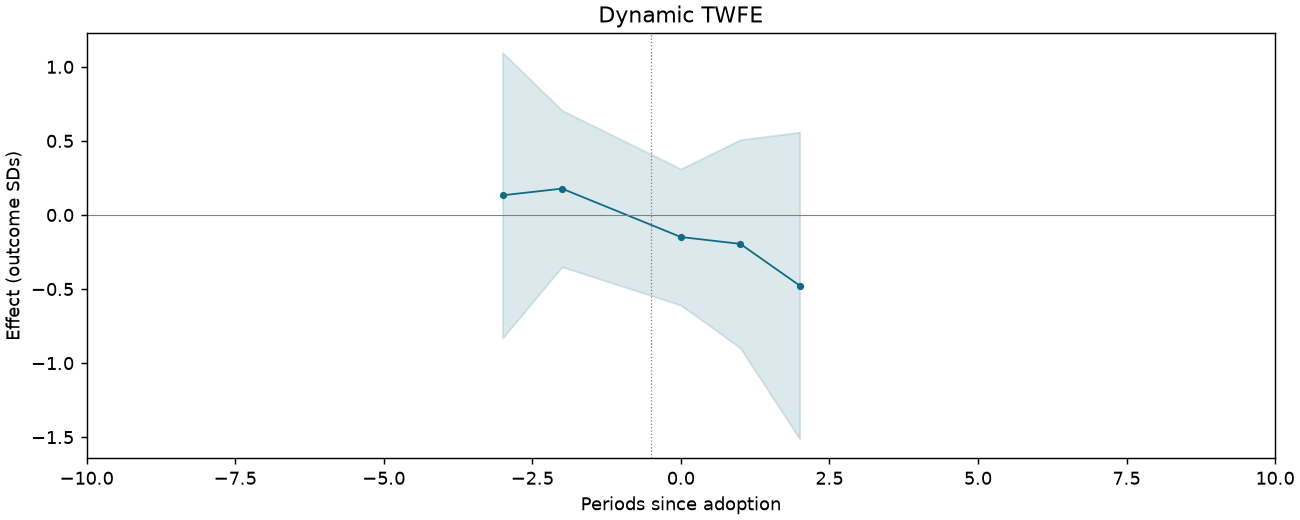
Attitudes about environment z-score index [science-track students only]
664 observations · 19 units · 19 clusters · 13 treated / 6 control units.
Estimate comparison
| Estimator | Estimate (SDs) | SE | 95% CI | Averaging |
|---|---|---|---|---|
| Static TWFE | -0.131 | 0.203 | [-0.557, 0.296] | Coefficient |
| Dynamic TWFE | -0.227 | 0.290 | [-0.836, 0.383] | Treated cells |
| BJS / did2s | -0.166 | 0.261 | [-0.715, 0.383] | Treated cells |
| Sun–Abraham | -0.256 | 0.288 | [-0.861, 0.349] | Treated cells |
| CS-DID (equal event-time) | -0.217 | 0.246 | [-0.700, 0.266] | Equal post-event times |
| CS-DID (treated cells) | -0.160 | 0.233 | [-0.617, 0.297] | Treated cells |
| SDID | -0.184 | — | — | Treated cells |
| Matrix completion | -0.159 | — | — | Treated cells |
| Horizontal ridge | 0.007 | — | — | Treated cells |
Event studies
Periods −10 to +10; pointwise 95% intervals where available.
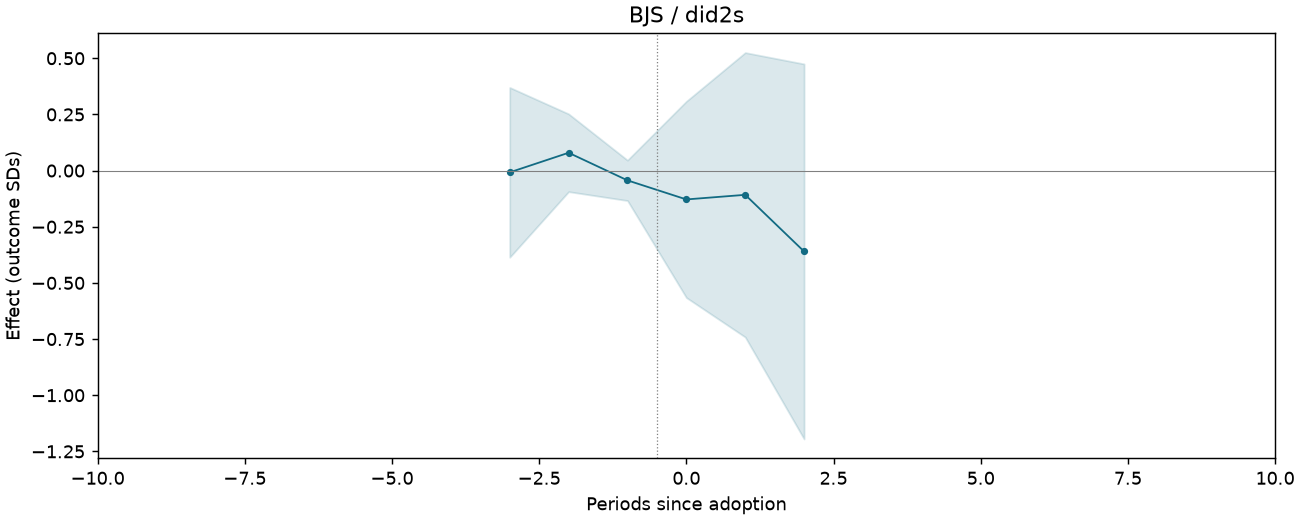
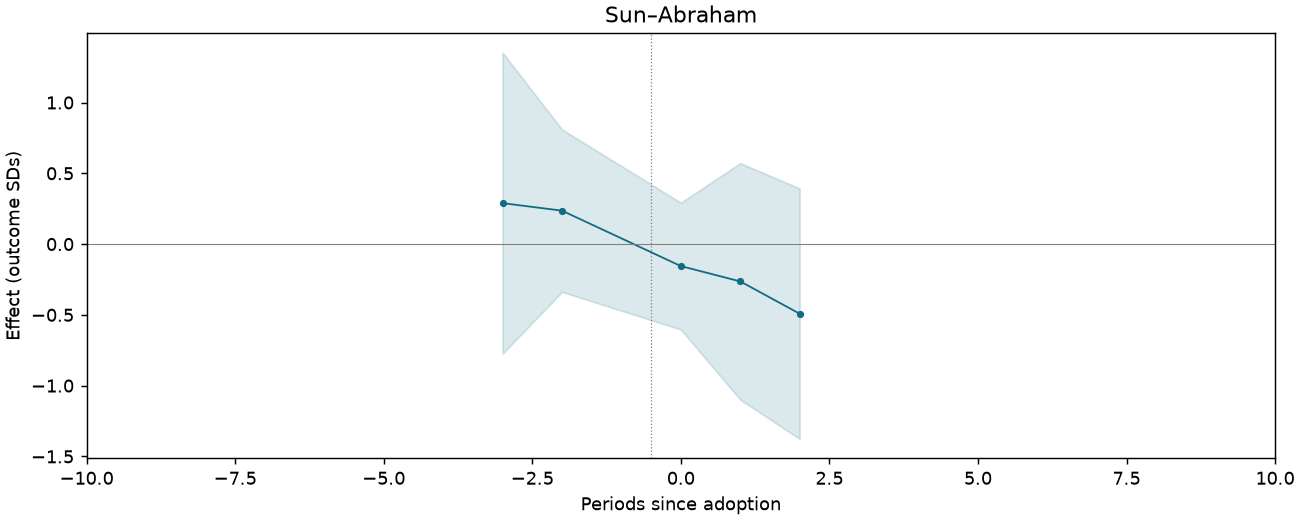
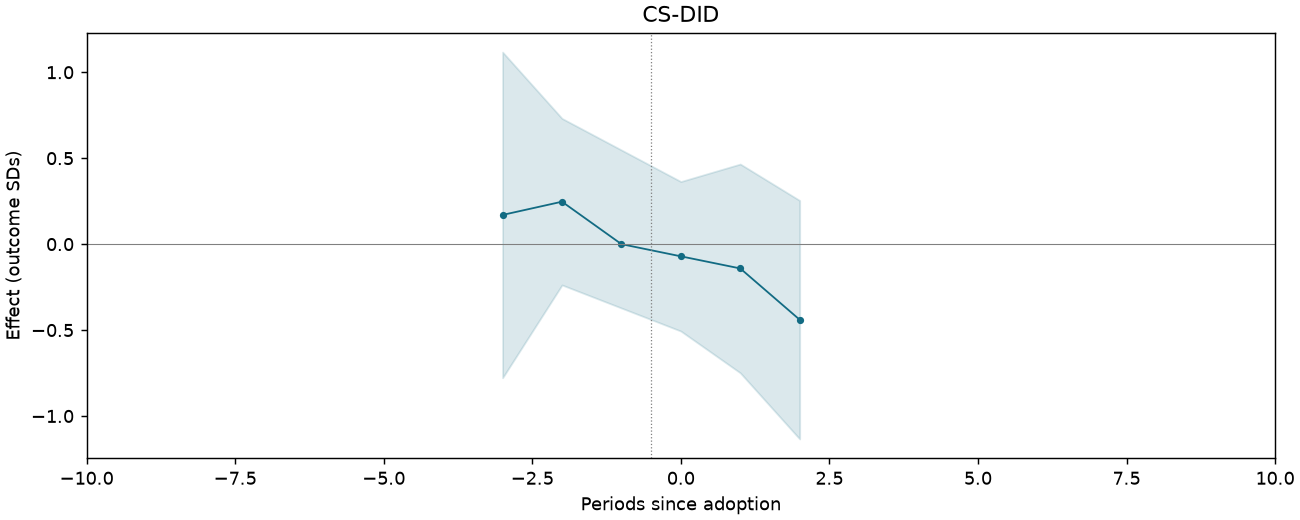
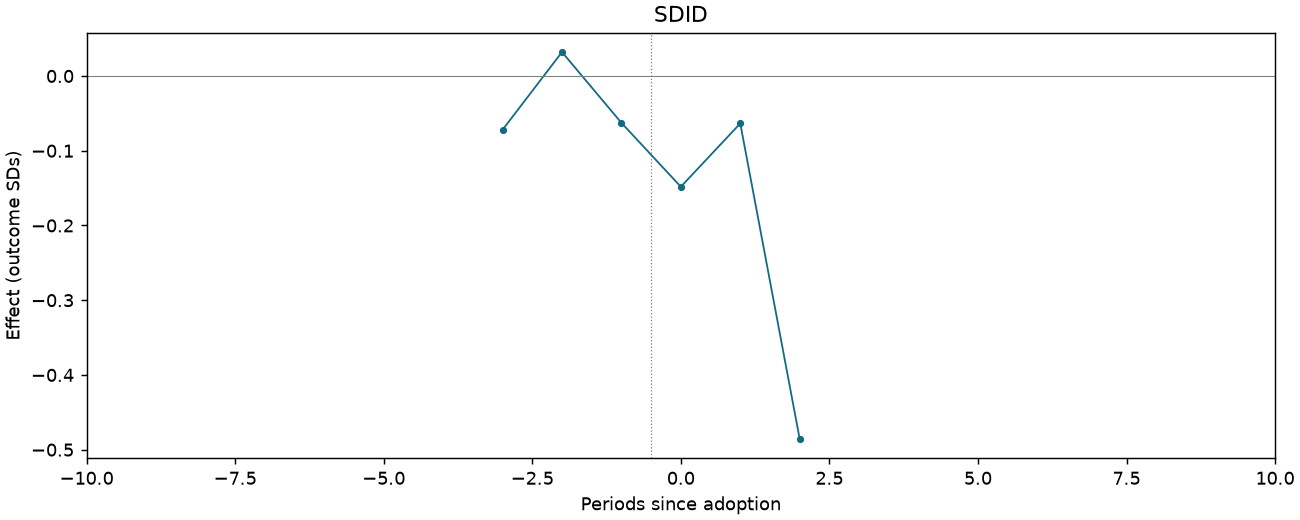
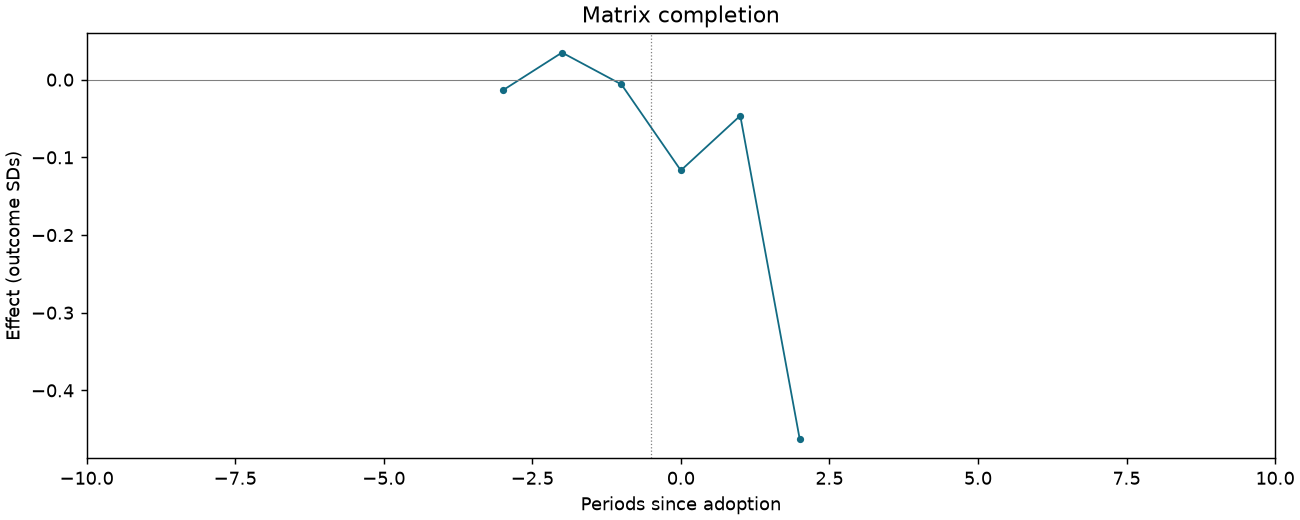
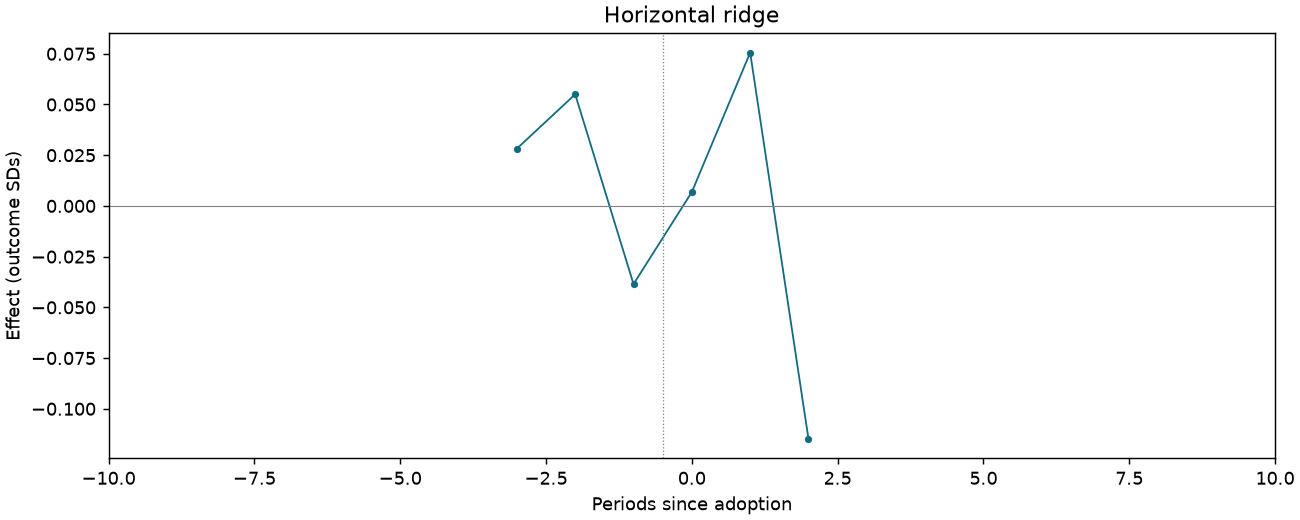
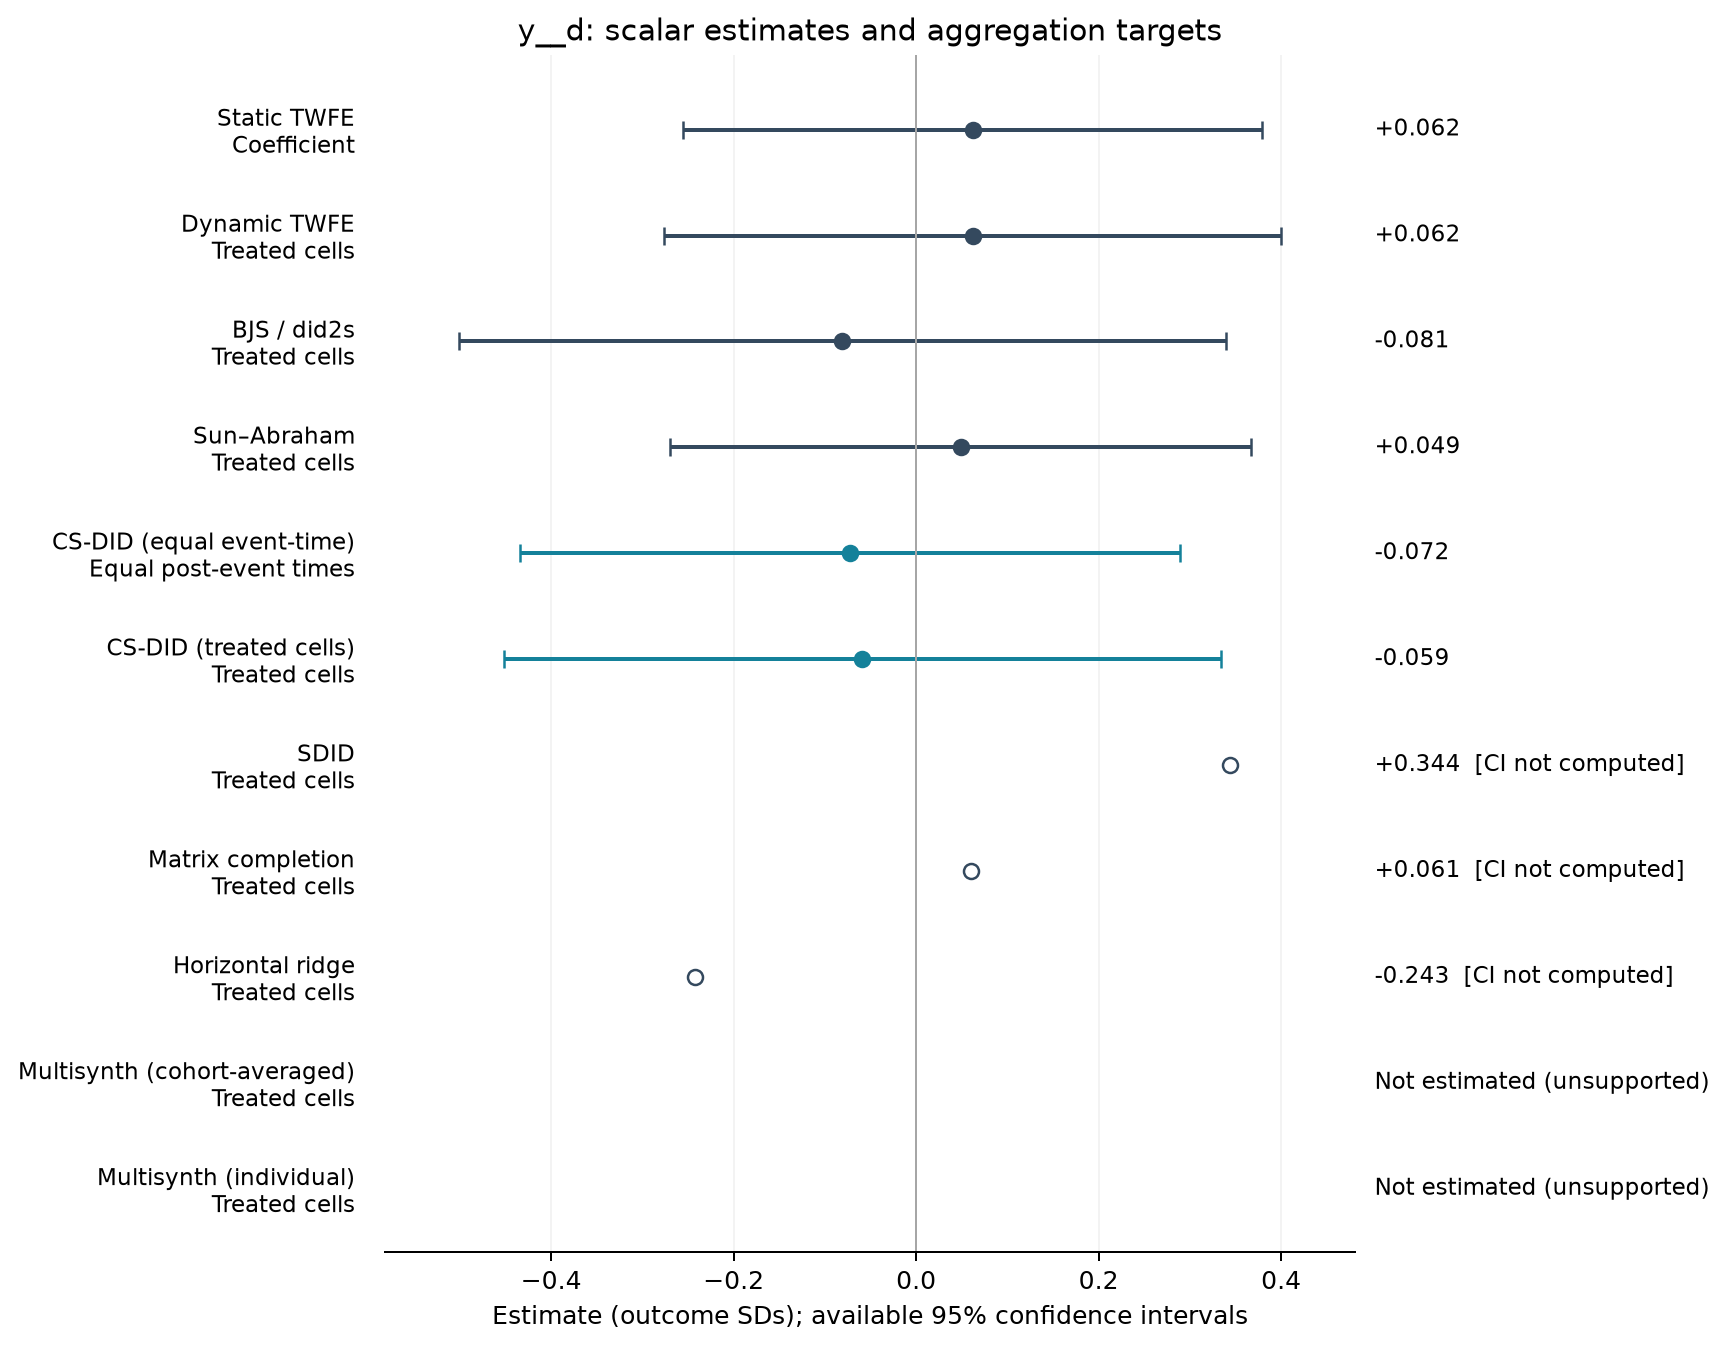
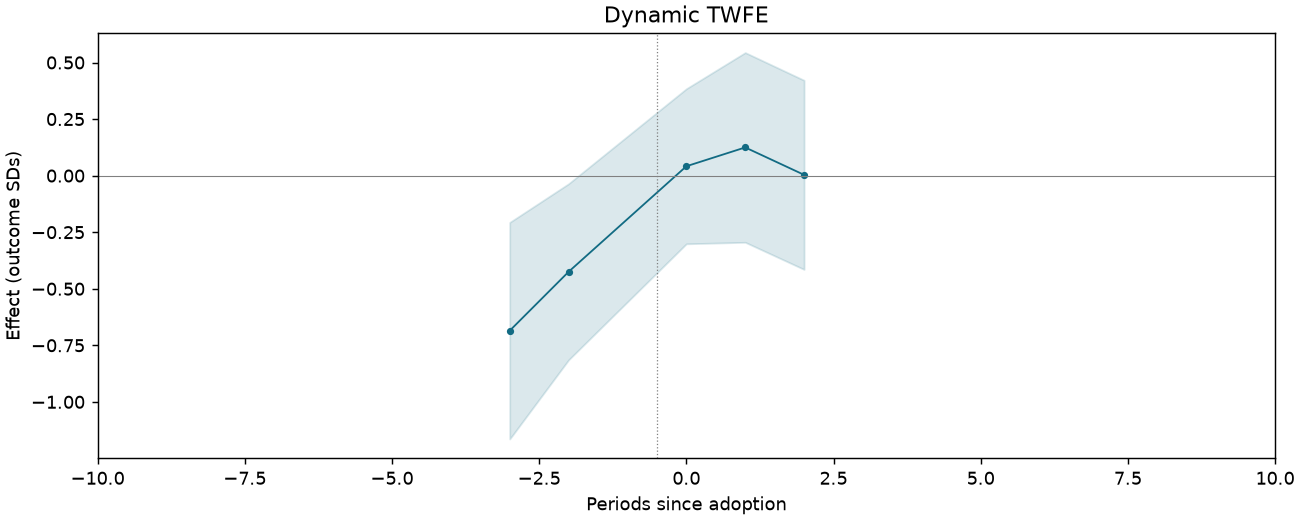
Political behavior z-score index [science-track students only]
659 observations · 19 units · 19 clusters · 13 treated / 6 control units.
Estimate comparison
| Estimator | Estimate (SDs) | SE | 95% CI | Averaging |
|---|---|---|---|---|
| Static TWFE | 0.062 | 0.151 | [-0.255, 0.379] | Coefficient |
| Dynamic TWFE | 0.062 | 0.161 | [-0.276, 0.400] | Treated cells |
| BJS / did2s | -0.081 | 0.200 | [-0.501, 0.339] | Treated cells |
| Sun–Abraham | 0.049 | 0.152 | [-0.270, 0.368] | Treated cells |
| CS-DID (equal event-time) | -0.072 | 0.184 | [-0.434, 0.289] | Equal post-event times |
| CS-DID (treated cells) | -0.059 | 0.200 | [-0.452, 0.334] | Treated cells |
| SDID | 0.344 | — | — | Treated cells |
| Matrix completion | 0.061 | — | — | Treated cells |
| Horizontal ridge | -0.243 | — | — | Treated cells |
Event studies
Periods −10 to +10; pointwise 95% intervals where available.
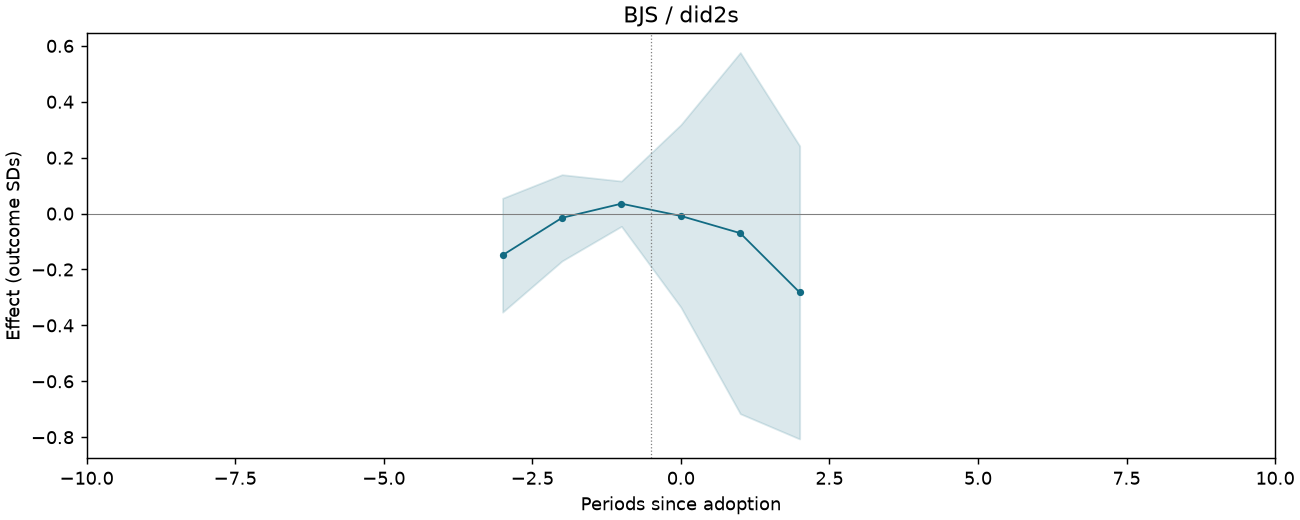
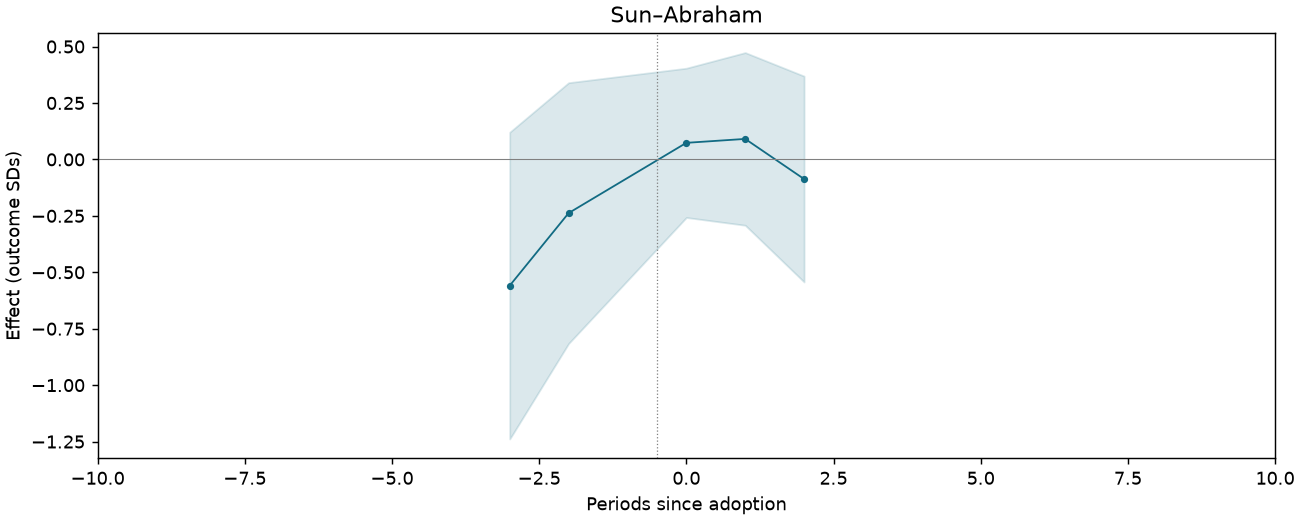
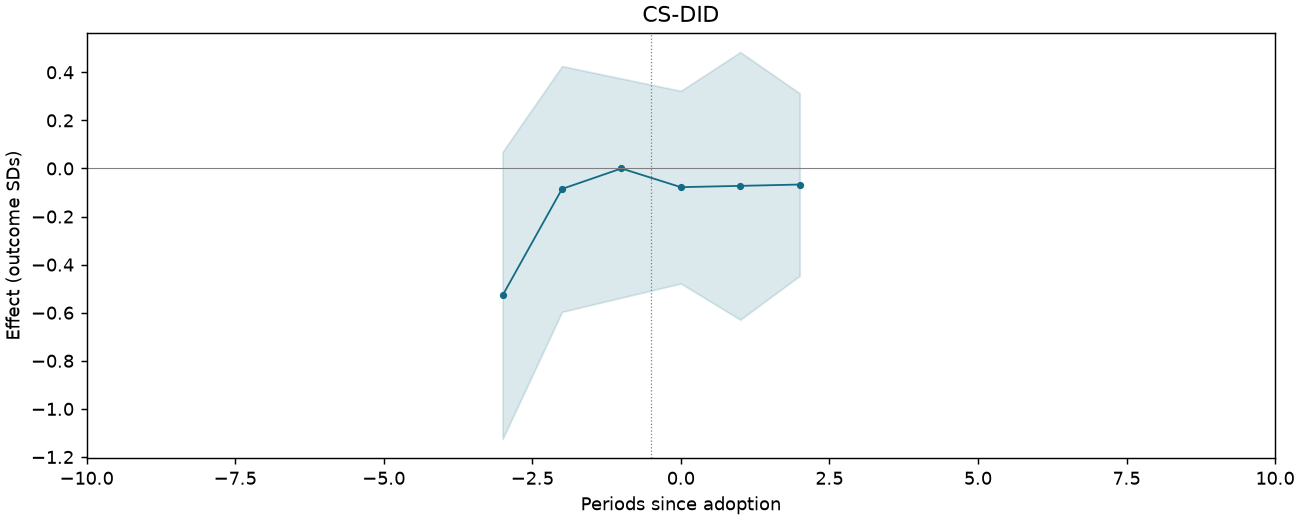
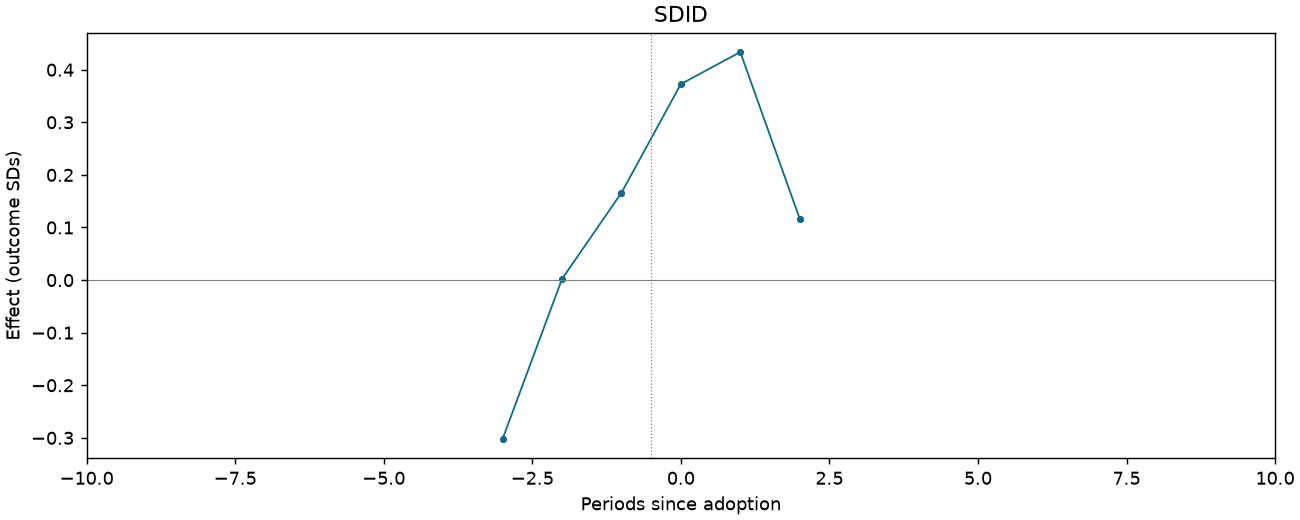
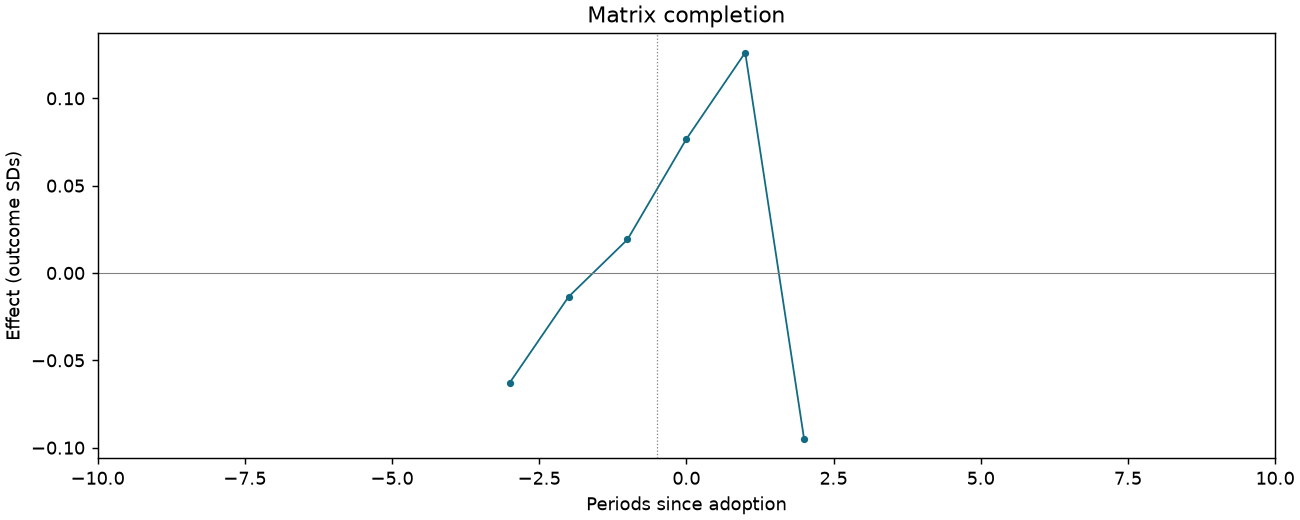
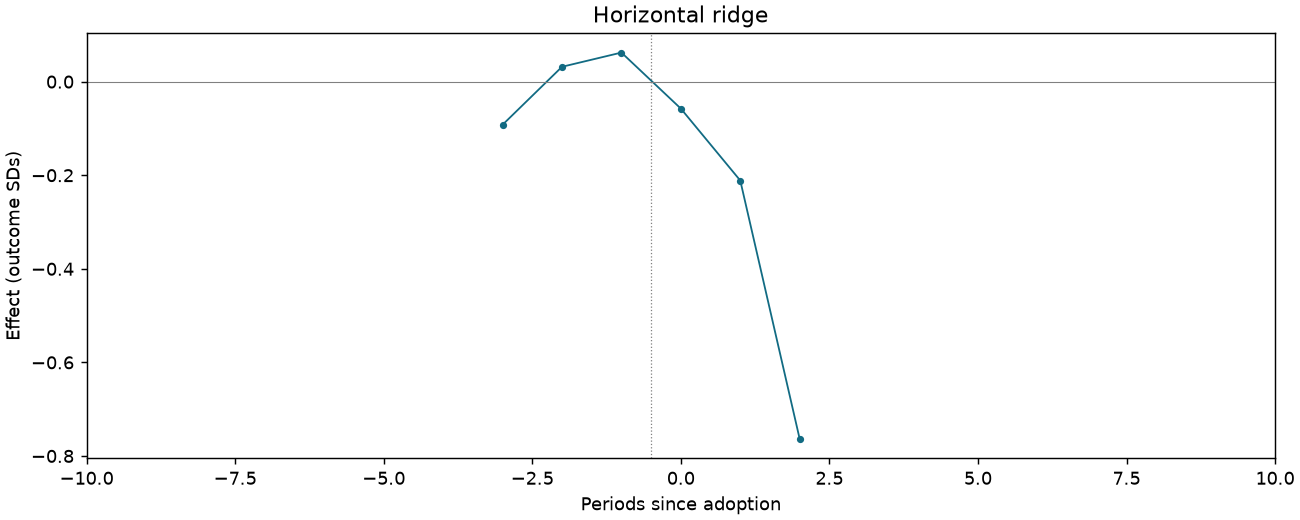
Avoiding risky investment z-score index [science-track students only]
659 observations · 19 units · 19 clusters · 13 treated / 6 control units.
Estimate comparison
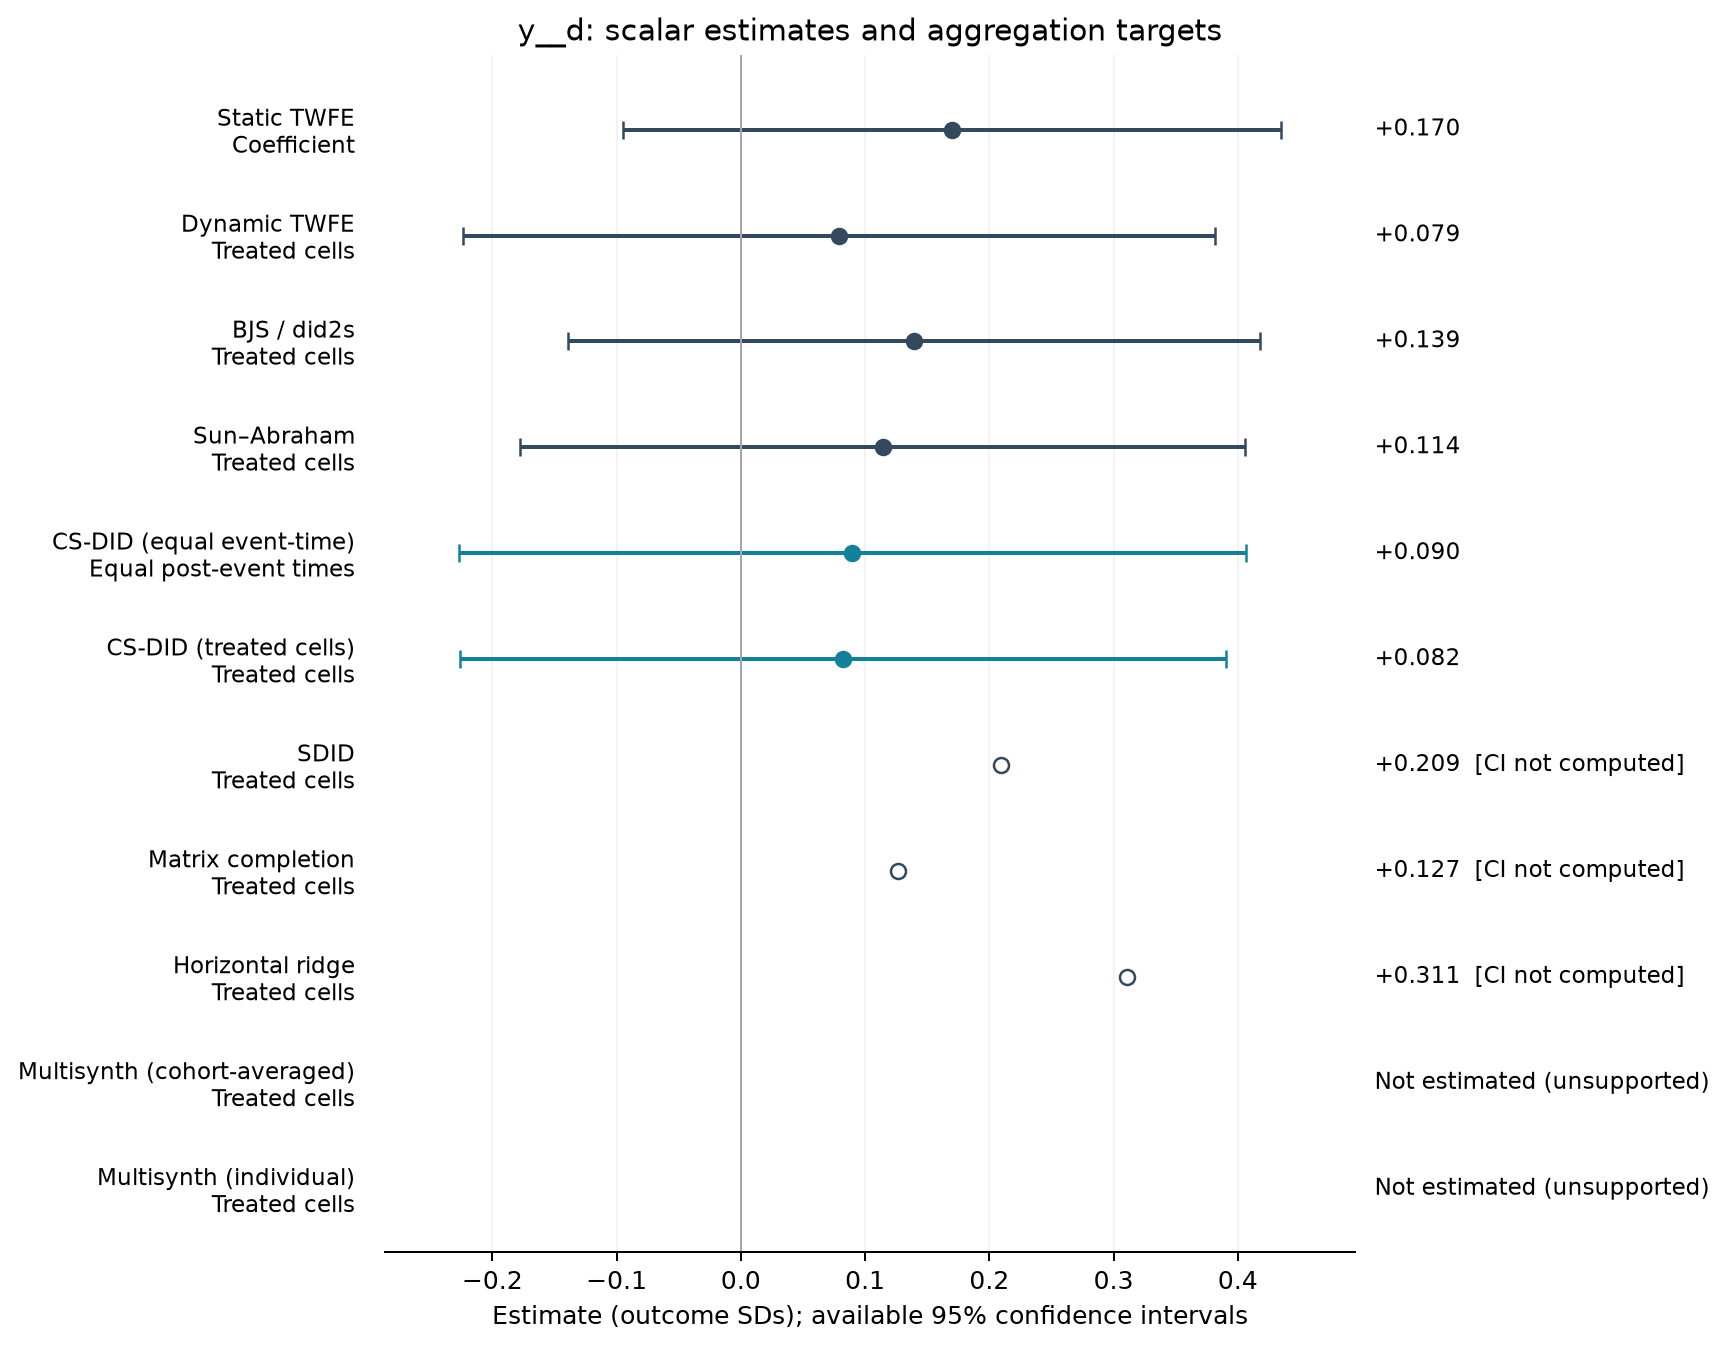
| Estimator | Estimate (SDs) | SE | 95% CI | Averaging |
|---|---|---|---|---|
| Static TWFE | 0.170 | 0.126 | [-0.095, 0.435] | Coefficient |
| Dynamic TWFE | 0.079 | 0.144 | [-0.224, 0.381] | Treated cells |
| BJS / did2s | 0.139 | 0.133 | [-0.139, 0.418] | Treated cells |
| Sun–Abraham | 0.114 | 0.139 | [-0.178, 0.406] | Treated cells |
| CS-DID (equal event-time) | 0.090 | 0.162 | [-0.227, 0.406] | Equal post-event times |
| CS-DID (treated cells) | 0.082 | 0.157 | [-0.226, 0.391] | Treated cells |
| SDID | 0.209 | — | — | Treated cells |
| Matrix completion | 0.127 | — | — | Treated cells |
| Horizontal ridge | 0.311 | — | — | Treated cells |
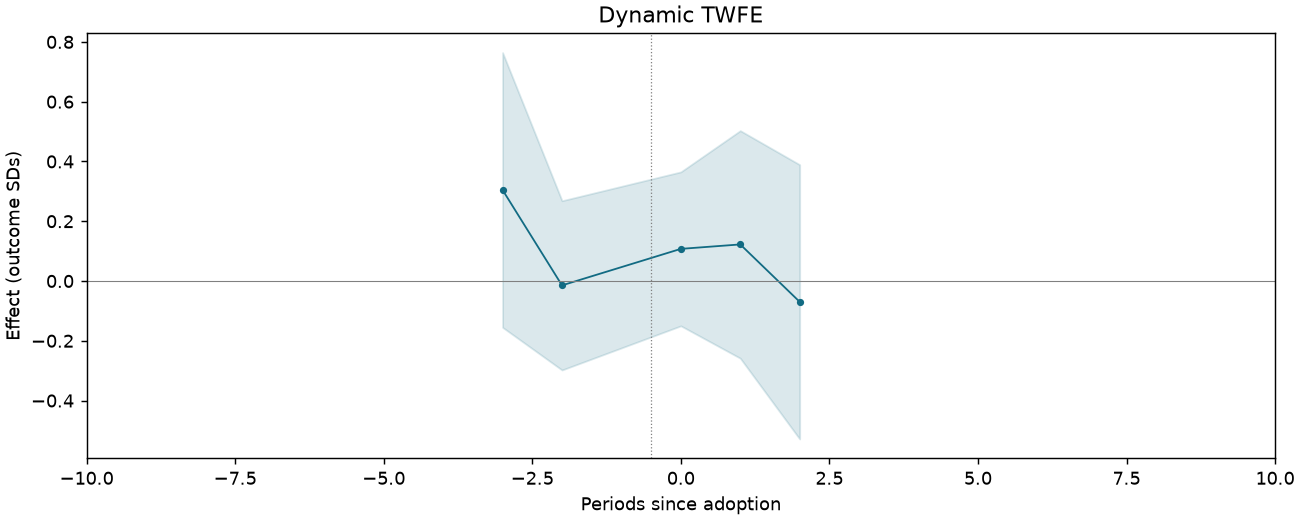
Event studies
Periods −10 to +10; pointwise 95% intervals where available.
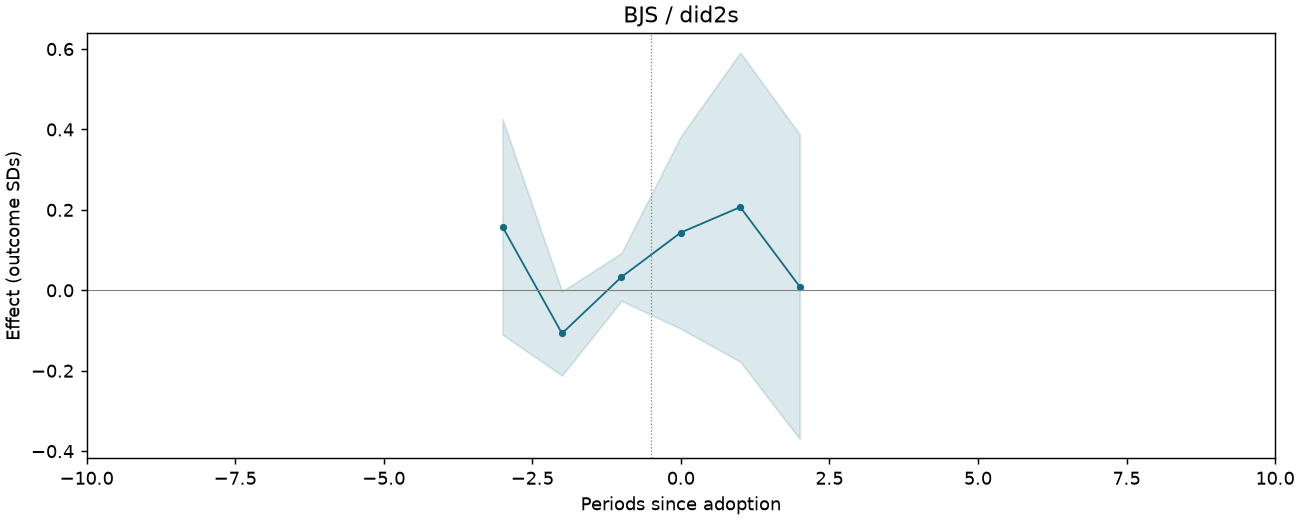
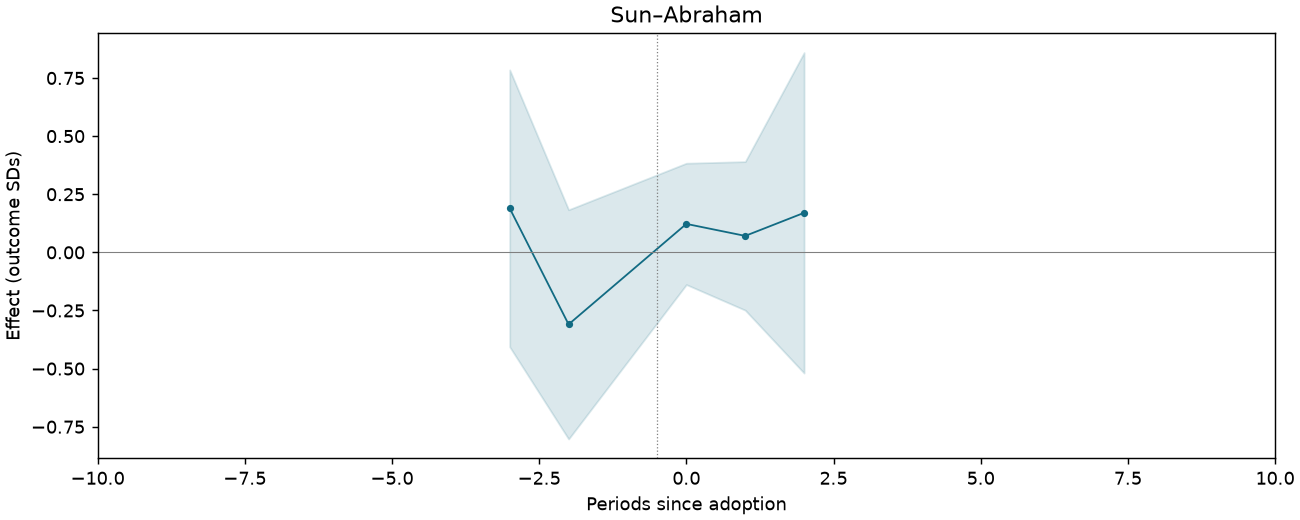
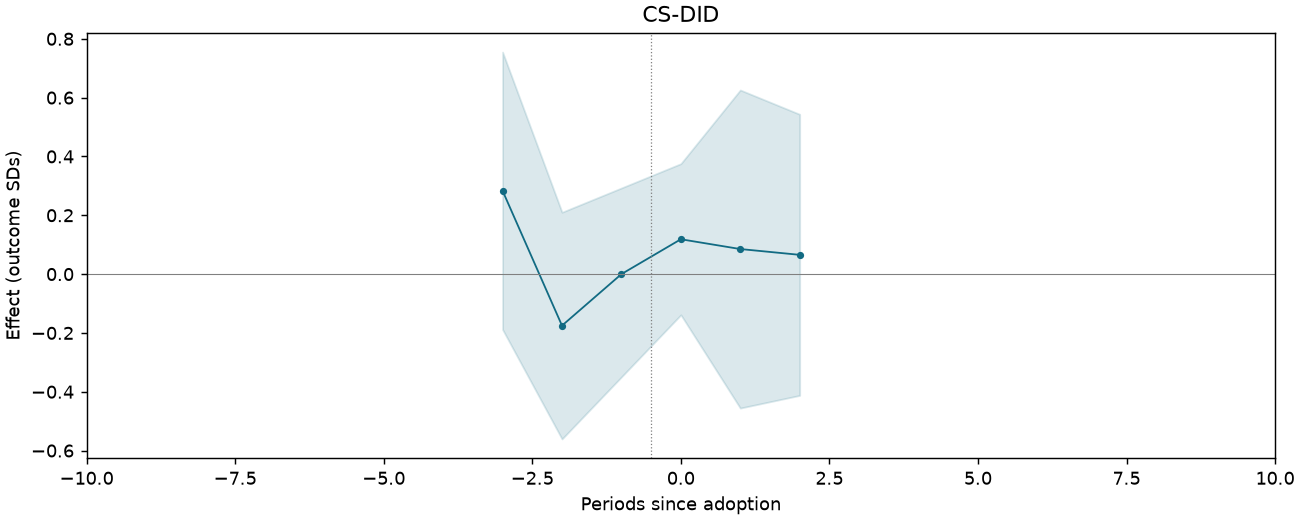
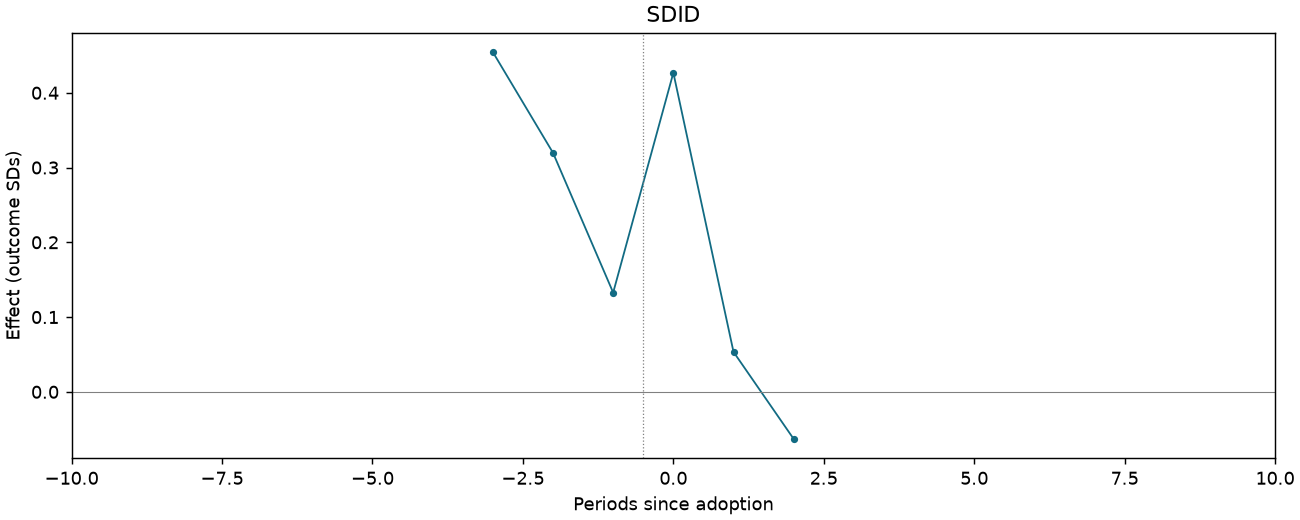
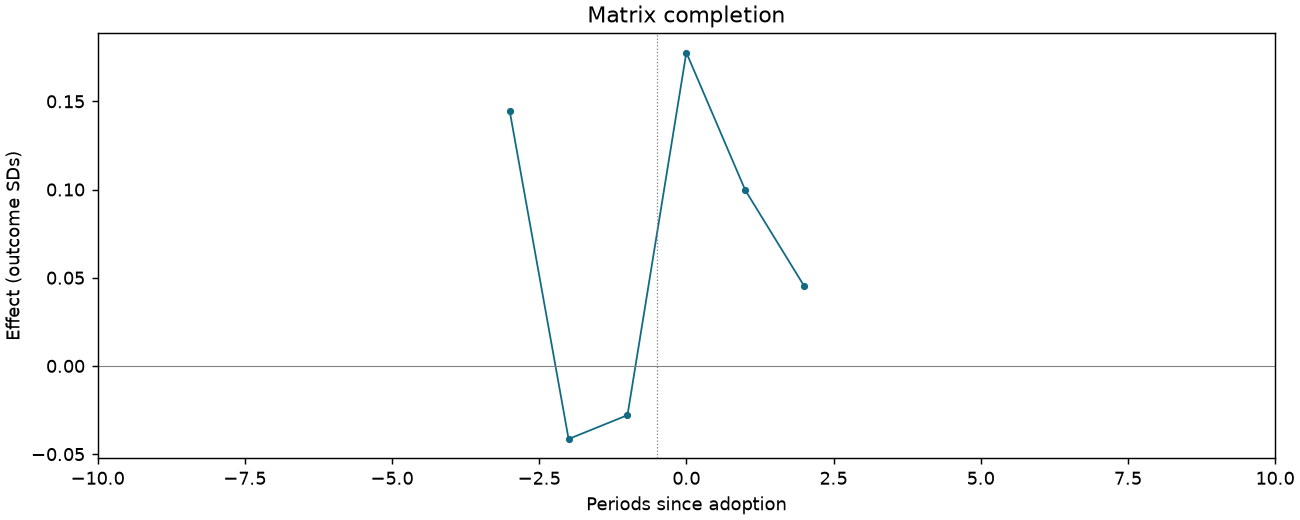
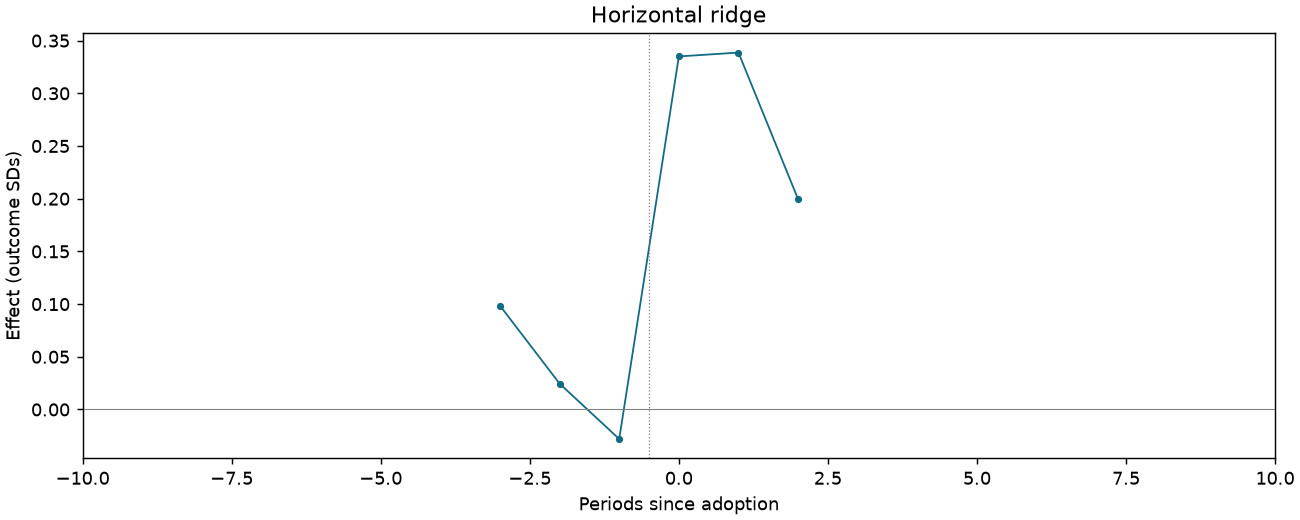
Cooperated with minority [science-track students only]
659 observations · 19 units · 19 clusters · 13 treated / 6 control units.
Estimate comparison
| Estimator | Estimate (SDs) | SE | 95% CI | Averaging |
|---|---|---|---|---|
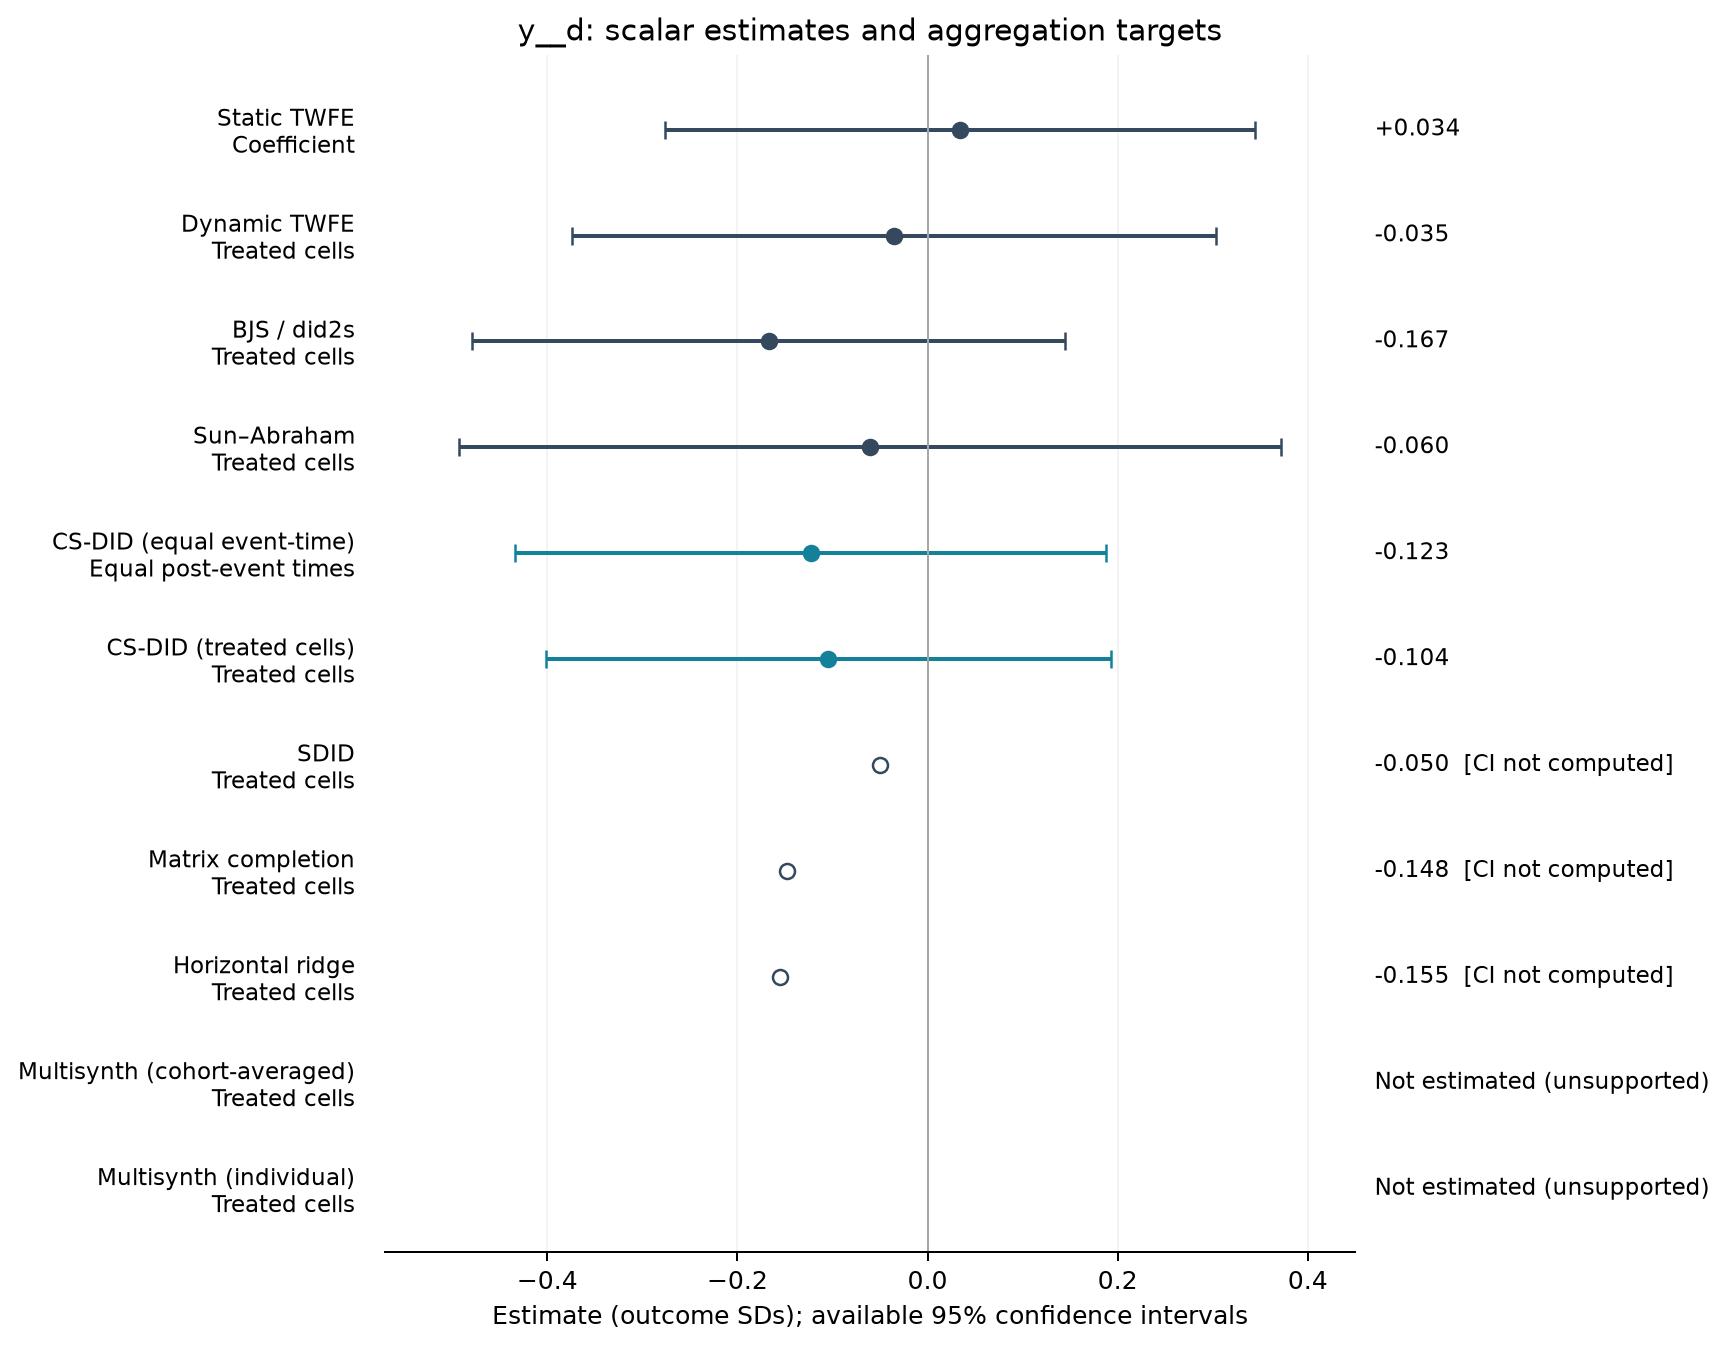
| Static TWFE | 0.034 | 0.148 | [-0.276, 0.345] | Coefficient |
| Dynamic TWFE | -0.035 | 0.161 | [-0.374, 0.303] | Treated cells |
| BJS / did2s | -0.167 | 0.148 | [-0.479, 0.144] | Treated cells |
| Sun–Abraham | -0.060 | 0.206 | [-0.493, 0.372] | Treated cells |
| CS-DID (equal event-time) | -0.123 | 0.159 | [-0.434, 0.188] | Equal post-event times |
| CS-DID (treated cells) | -0.104 | 0.152 | [-0.402, 0.193] | Treated cells |
| SDID | -0.050 | — | — | Treated cells |
| Matrix completion | -0.148 | — | — | Treated cells |
| Horizontal ridge | -0.155 | — | — | Treated cells |
Event studies
Periods −10 to +10; pointwise 95% intervals where available.
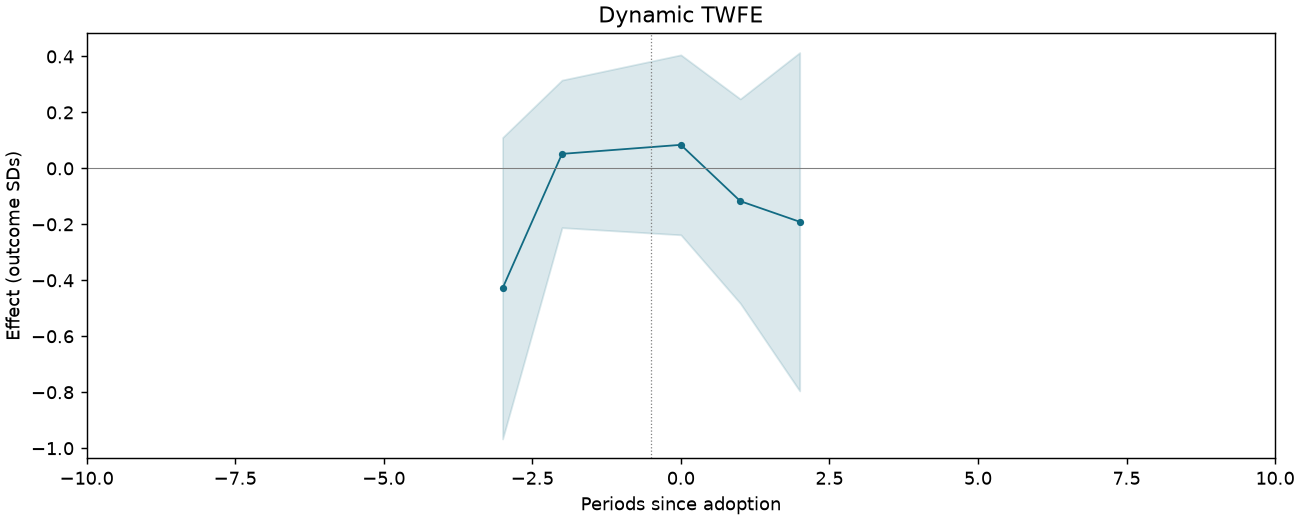
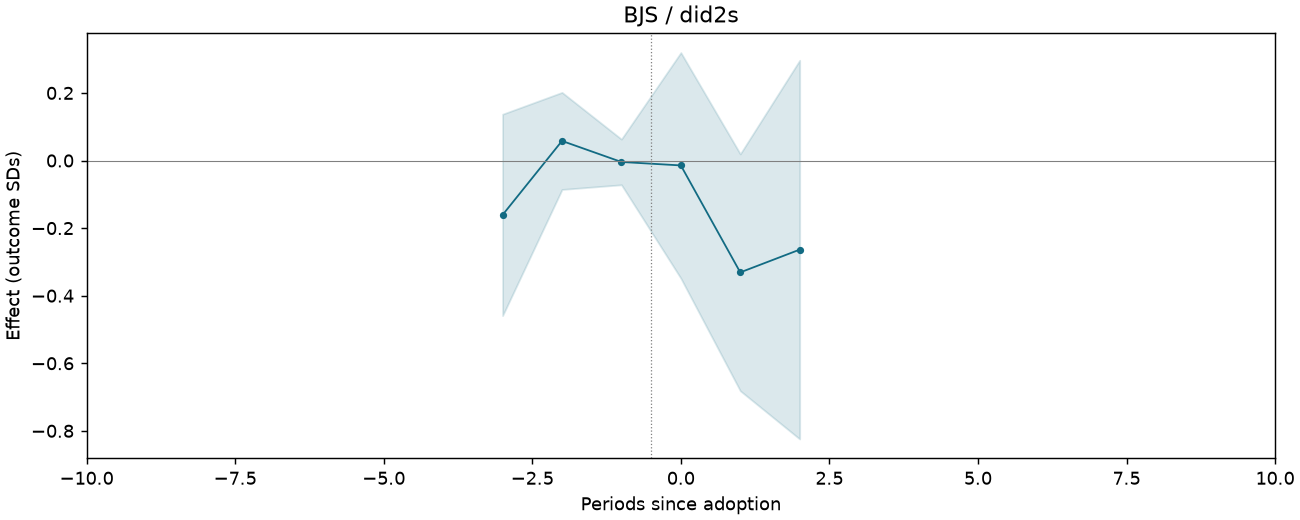
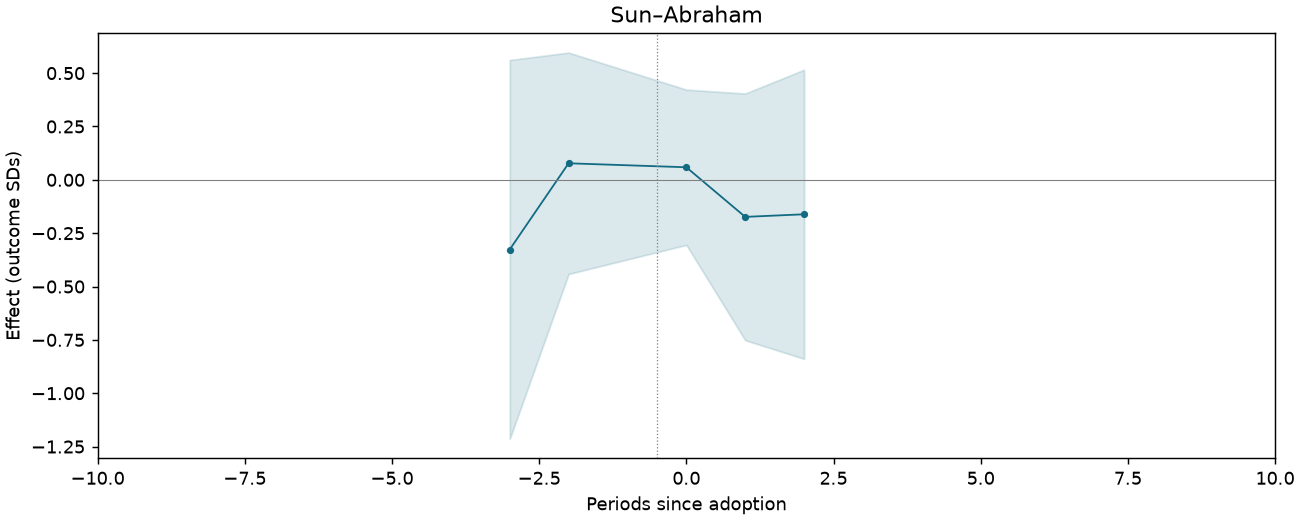
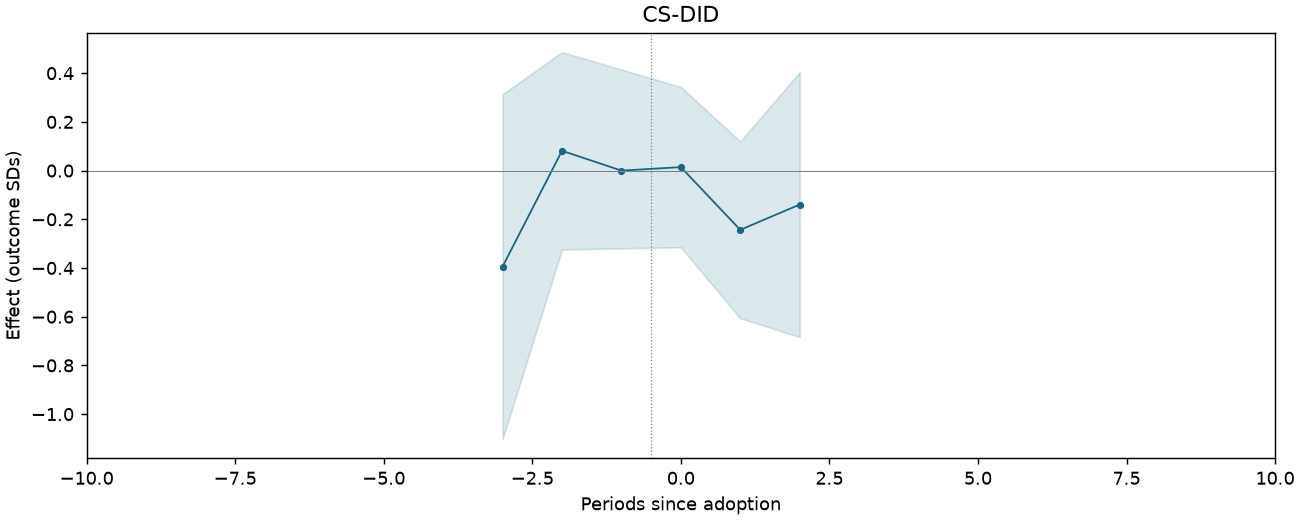
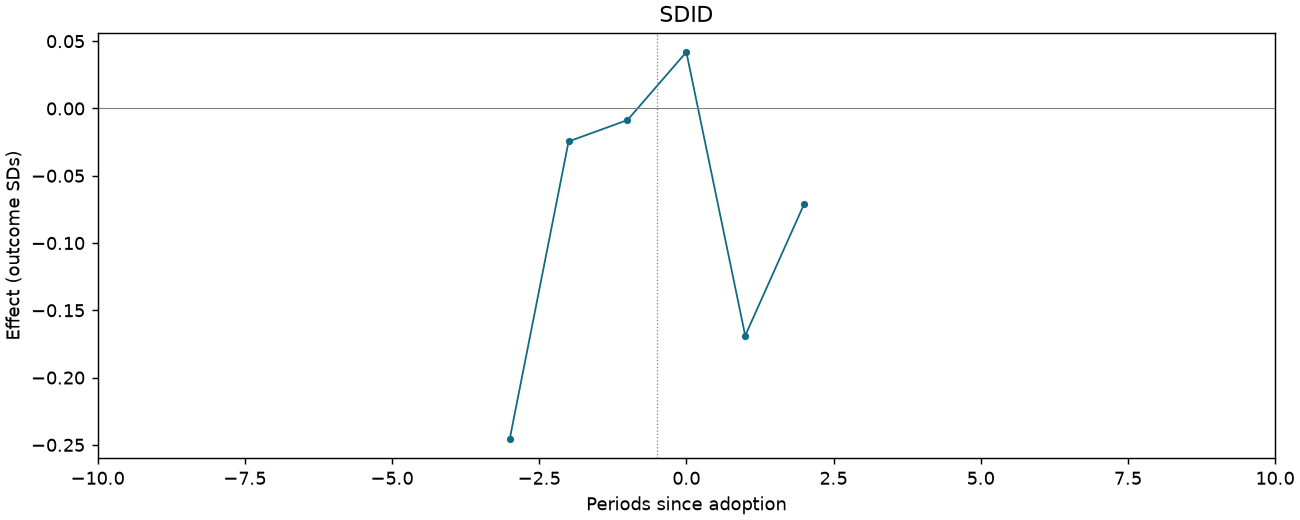
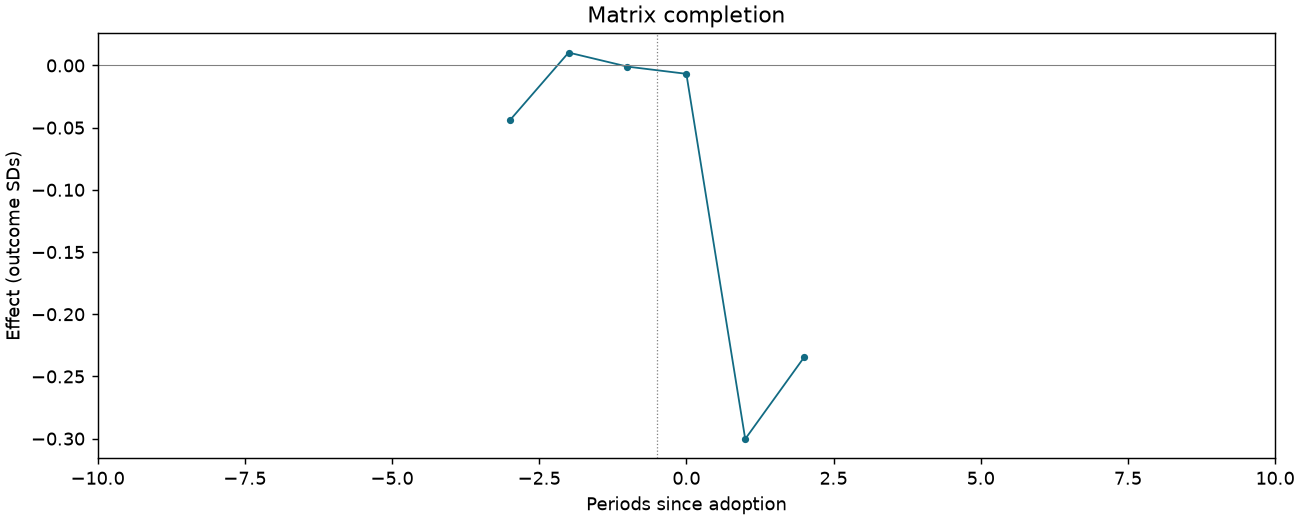
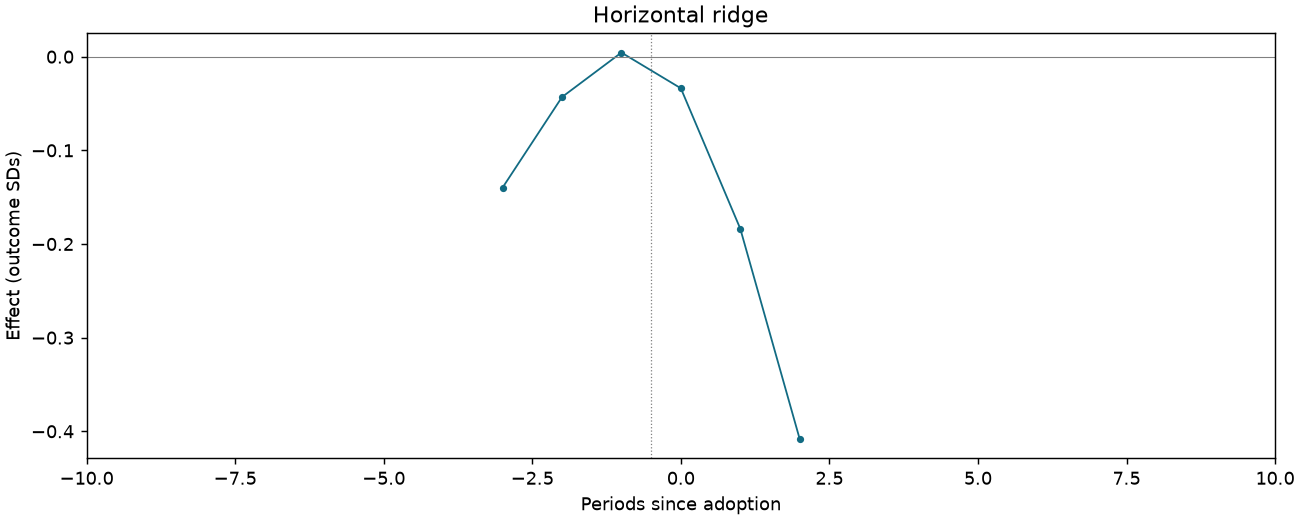
Trust in government officials z-score index [humanities-track students only]
288 observations · 18 units · 18 clusters · 11 treated / 7 control units.
Estimate comparison
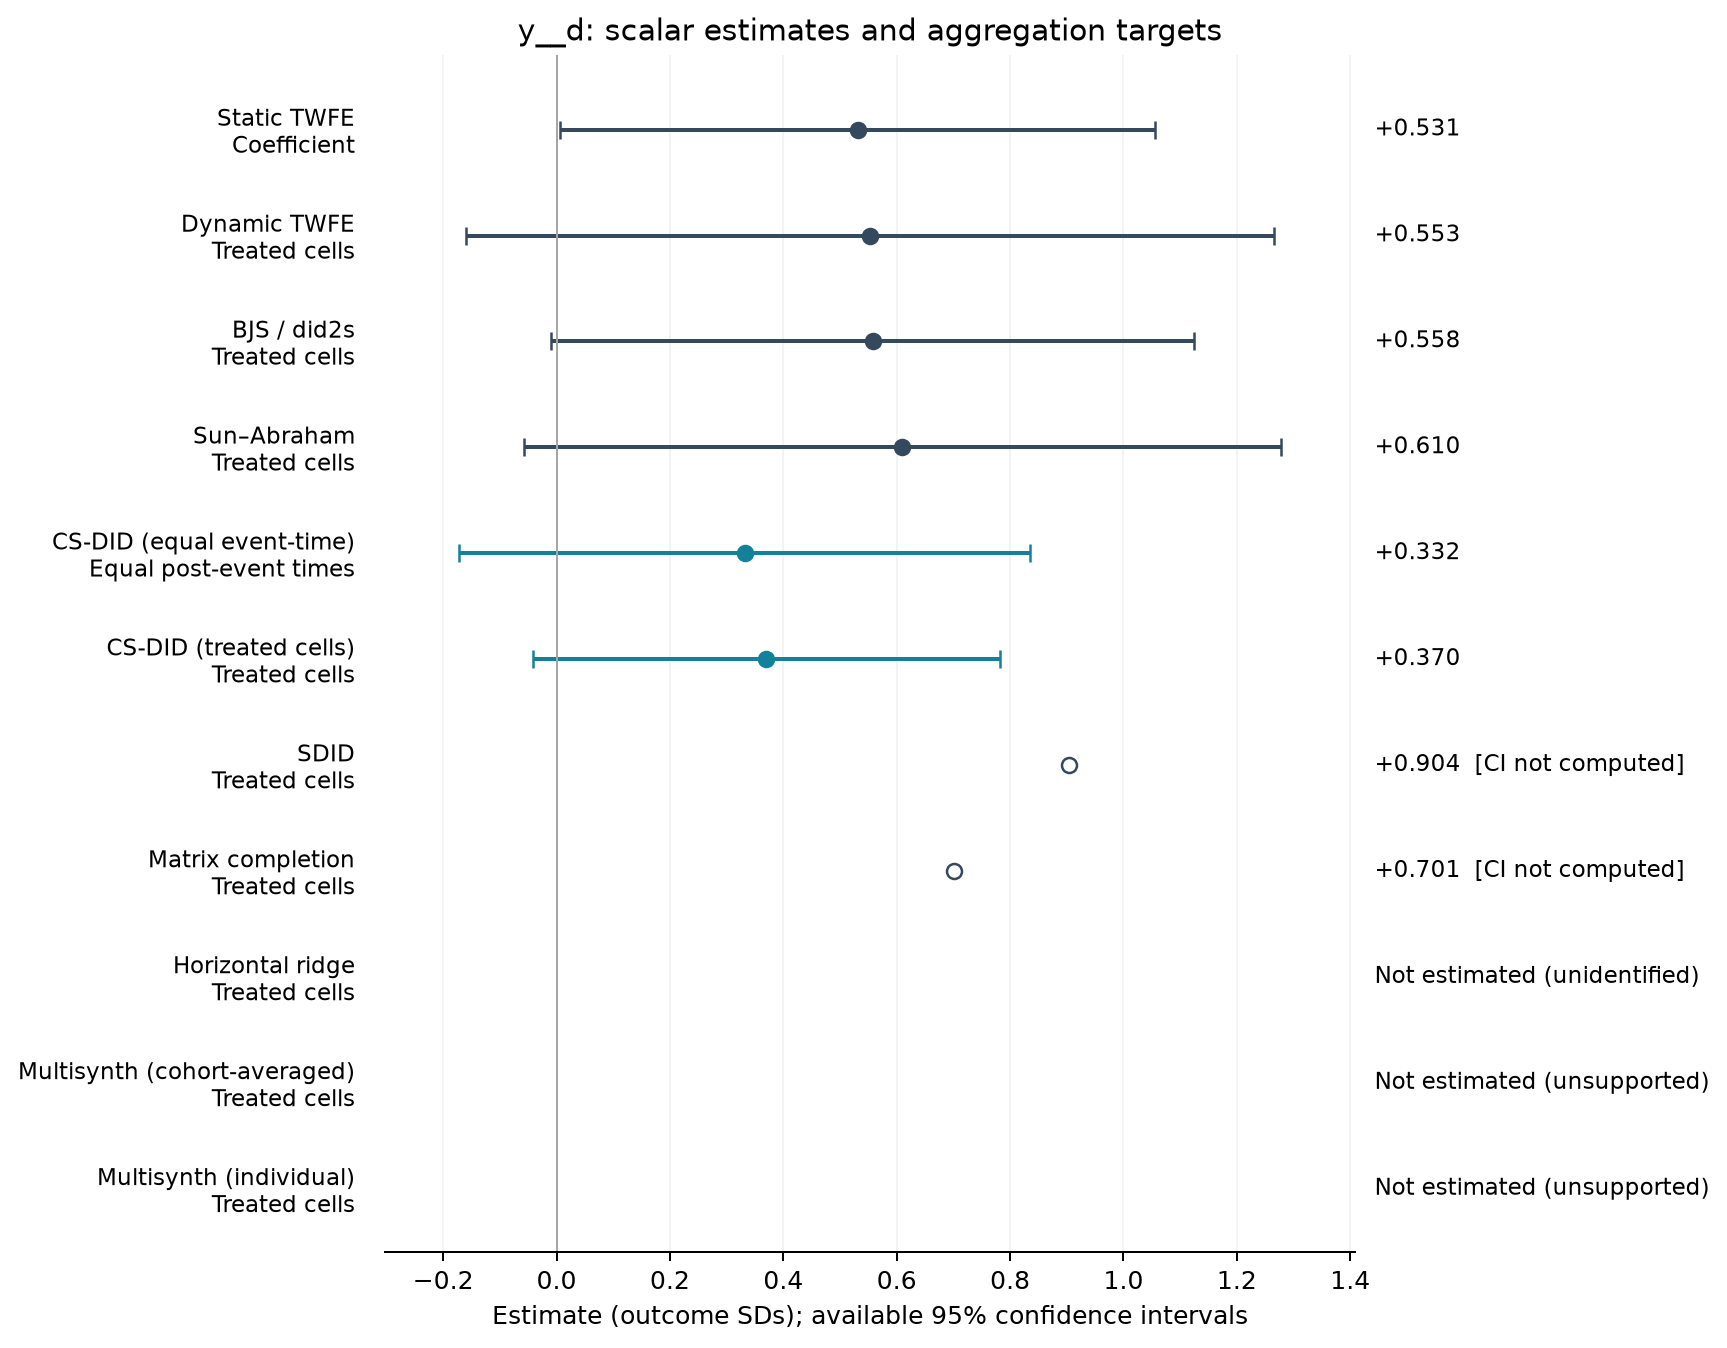
| Estimator | Estimate (SDs) | SE | 95% CI | Averaging |
|---|---|---|---|---|
| Static TWFE | 0.531 | 0.248 | [0.007, 1.055] | Coefficient |
| Dynamic TWFE | 0.553 | 0.338 | [-0.160, 1.265] | Treated cells |
| BJS / did2s | 0.558 | 0.269 | [-0.009, 1.125] | Treated cells |
| Sun–Abraham | 0.610 | 0.317 | [-0.058, 1.278] | Treated cells |
| CS-DID (equal event-time) | 0.332 | 0.257 | [-0.172, 0.836] | Equal post-event times |
| CS-DID (treated cells) | 0.370 | 0.210 | [-0.042, 0.782] | Treated cells |
| SDID | 0.904 | — | — | Treated cells |
| Matrix completion | 0.701 | — | — | Treated cells |
Event studies
Periods −10 to +10; pointwise 95% intervals where available.
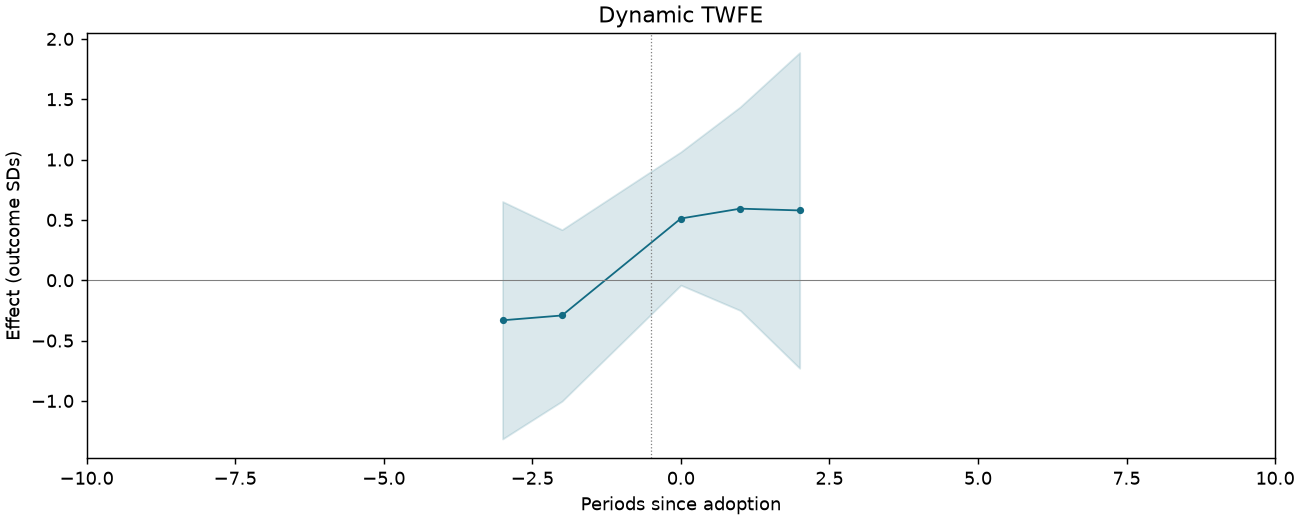
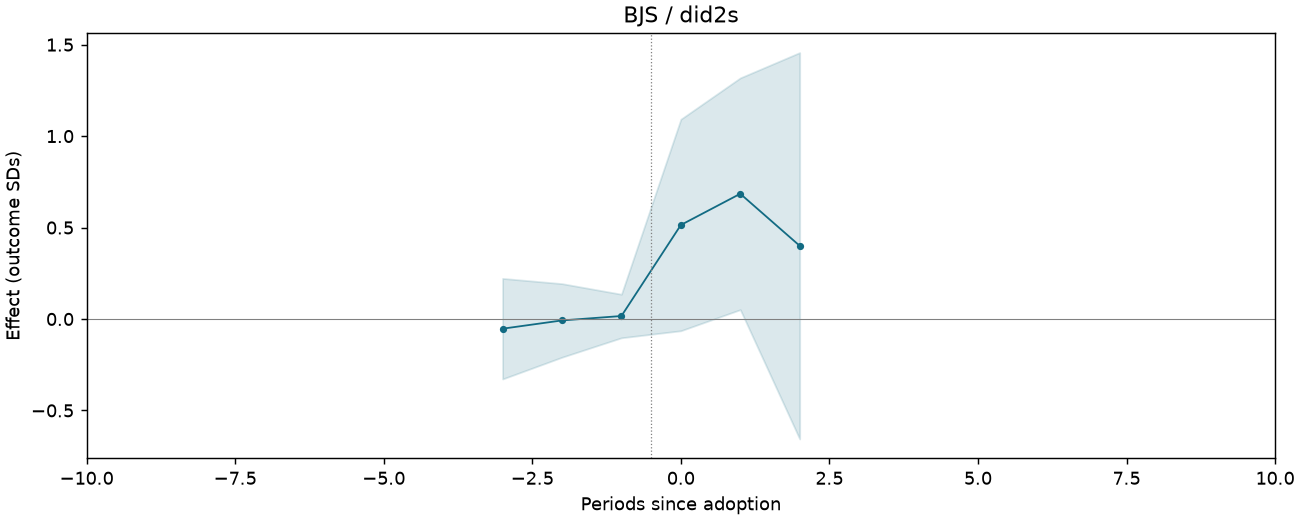
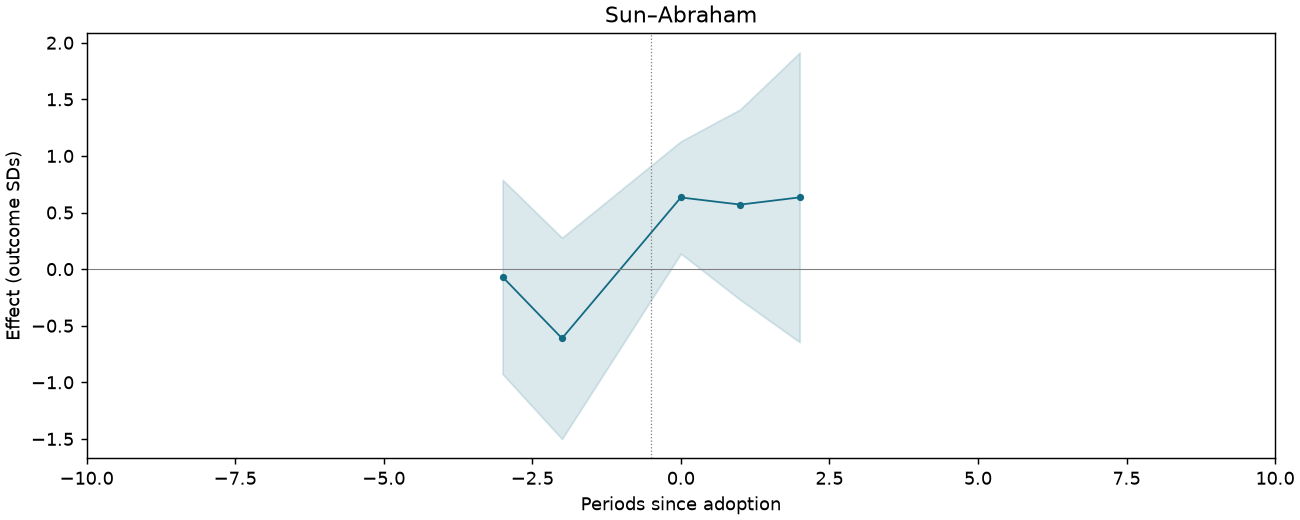
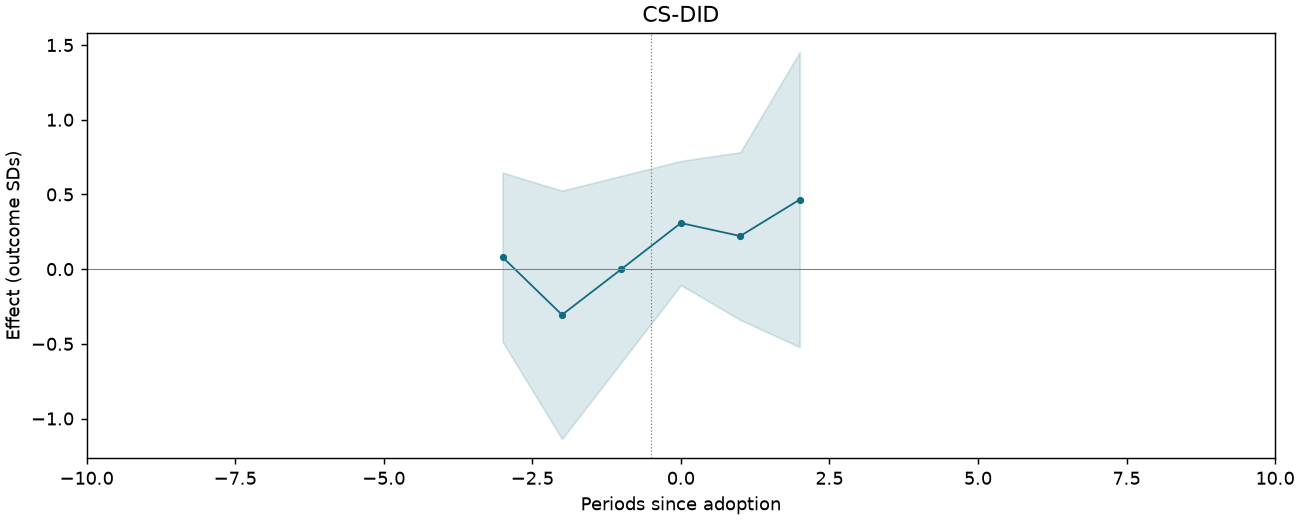
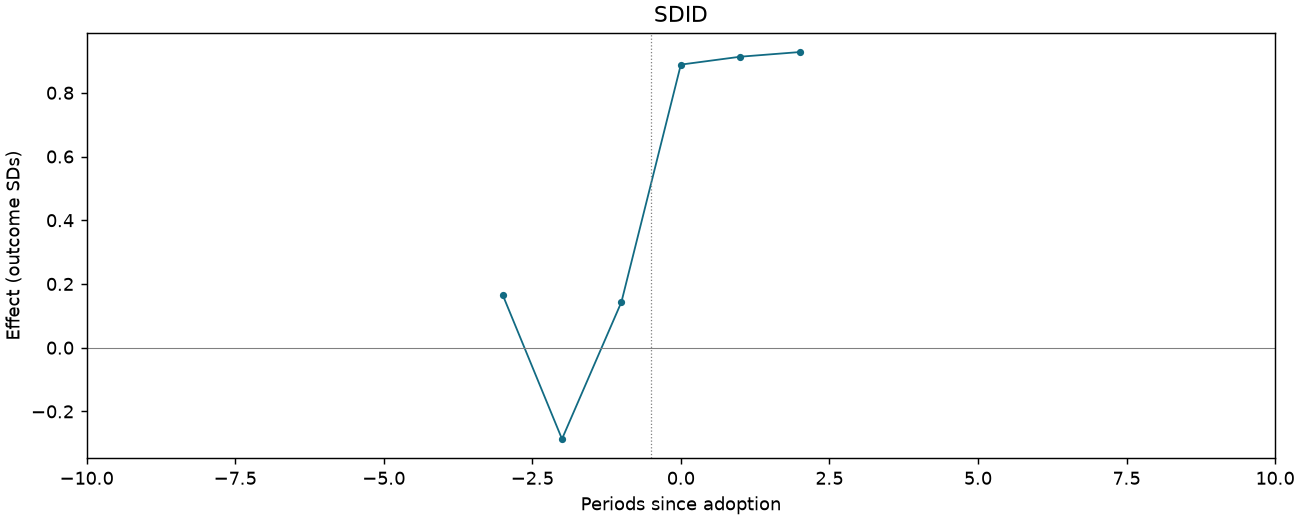
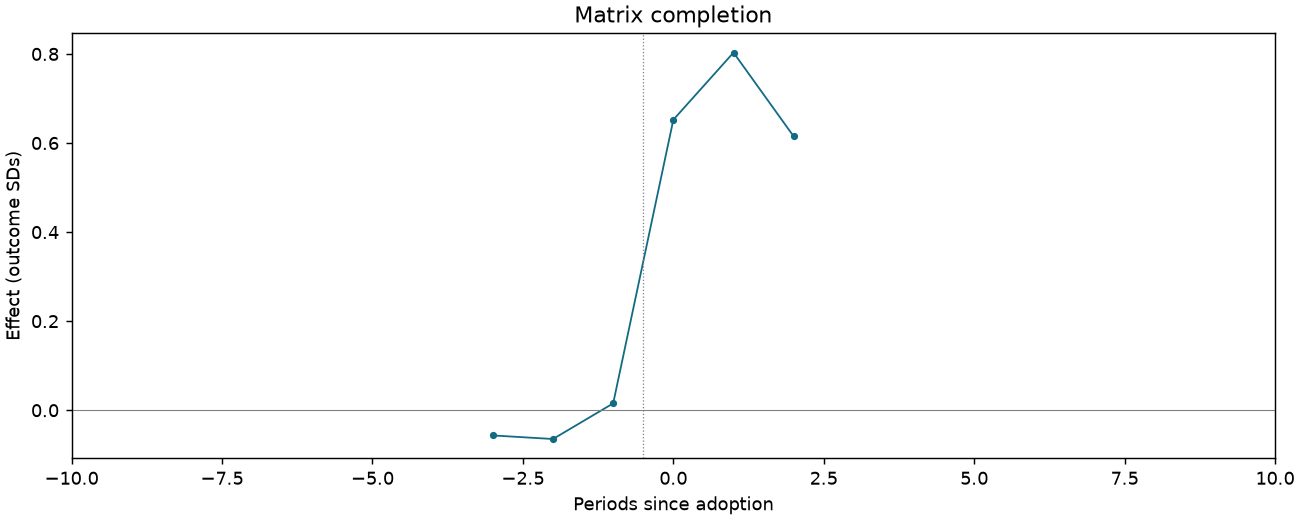
Bribery and civic-mindedness z-score index [humanities-track students only]
281 observations · 18 units · 18 clusters · 11 treated / 7 control units.
Estimate comparison
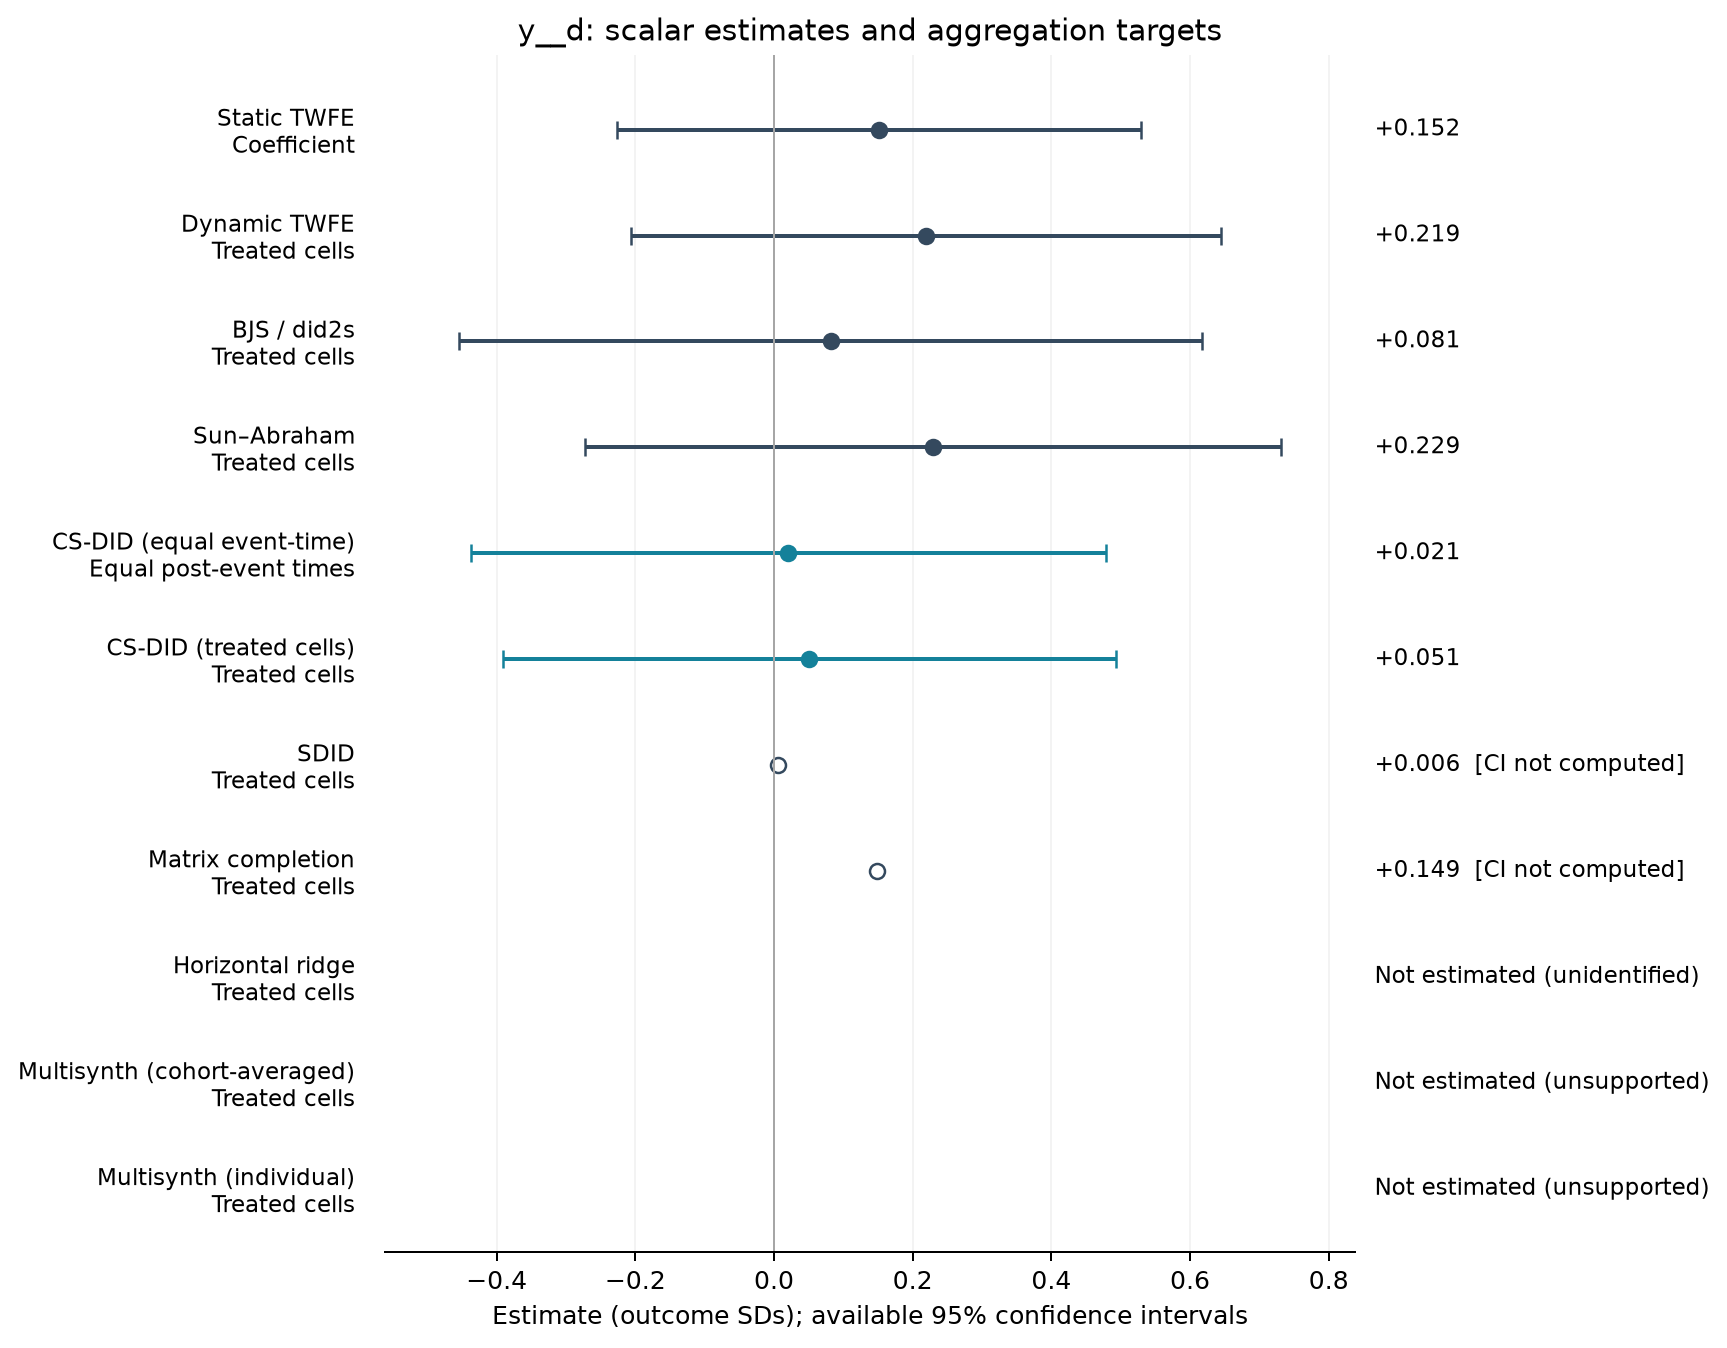
| Estimator | Estimate (SDs) | SE | 95% CI | Averaging |
|---|---|---|---|---|
| Static TWFE | 0.152 | 0.179 | [-0.226, 0.530] | Coefficient |
| Dynamic TWFE | 0.219 | 0.202 | [-0.206, 0.645] | Treated cells |
| BJS / did2s | 0.081 | 0.254 | [-0.454, 0.617] | Treated cells |
| Sun–Abraham | 0.229 | 0.238 | [-0.273, 0.731] | Treated cells |
| CS-DID (equal event-time) | 0.021 | 0.233 | [-0.437, 0.478] | Equal post-event times |
| CS-DID (treated cells) | 0.051 | 0.226 | [-0.392, 0.493] | Treated cells |
| SDID | 0.006 | — | — | Treated cells |
| Matrix completion | 0.149 | — | — | Treated cells |
Event studies
Periods −10 to +10; pointwise 95% intervals where available.
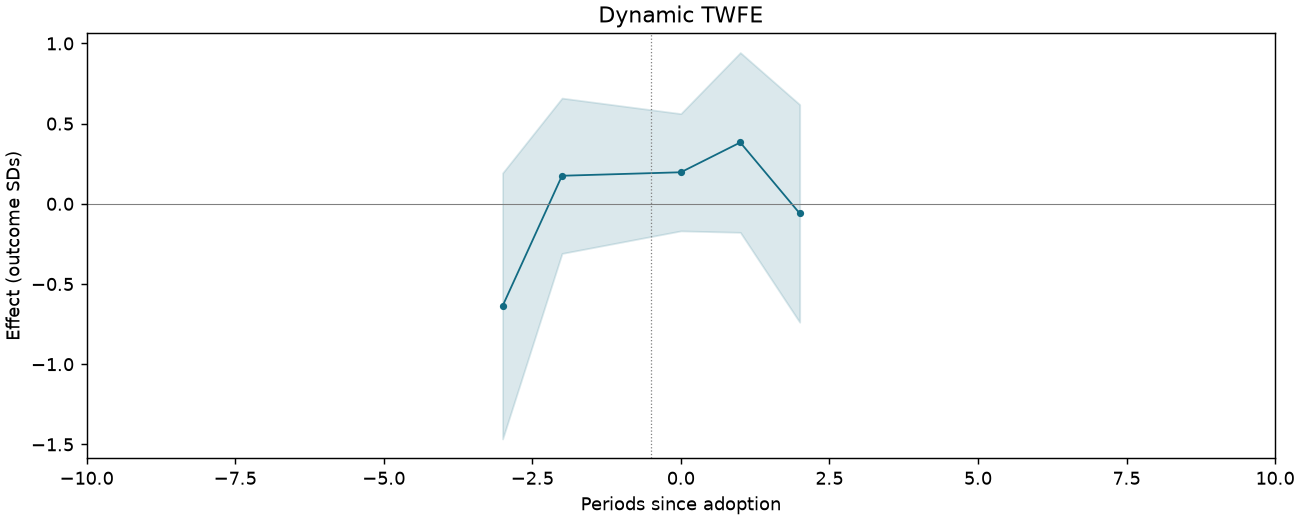
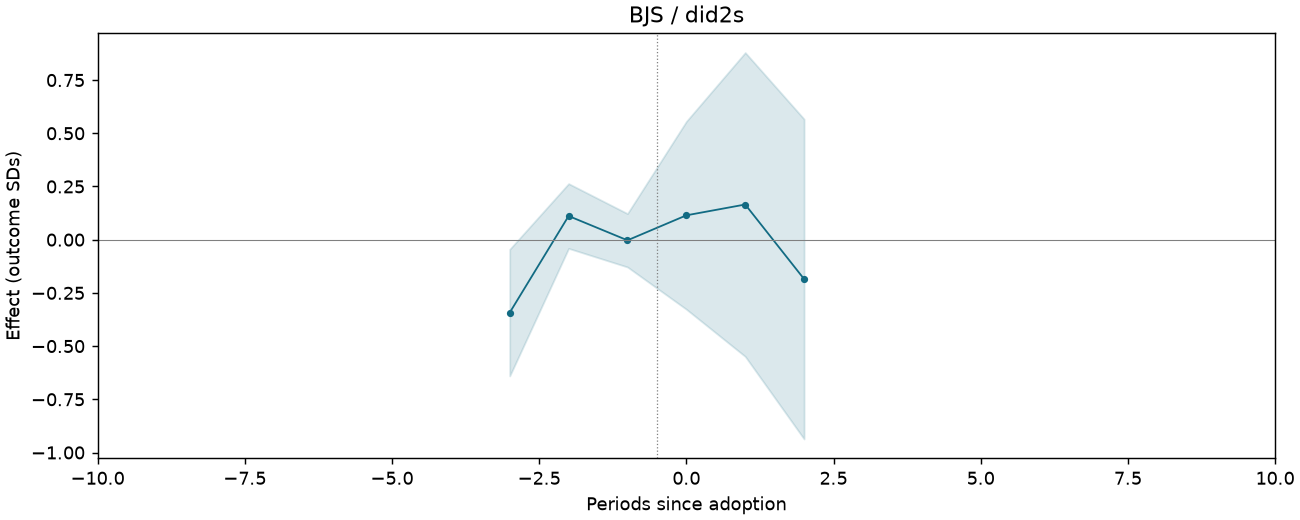
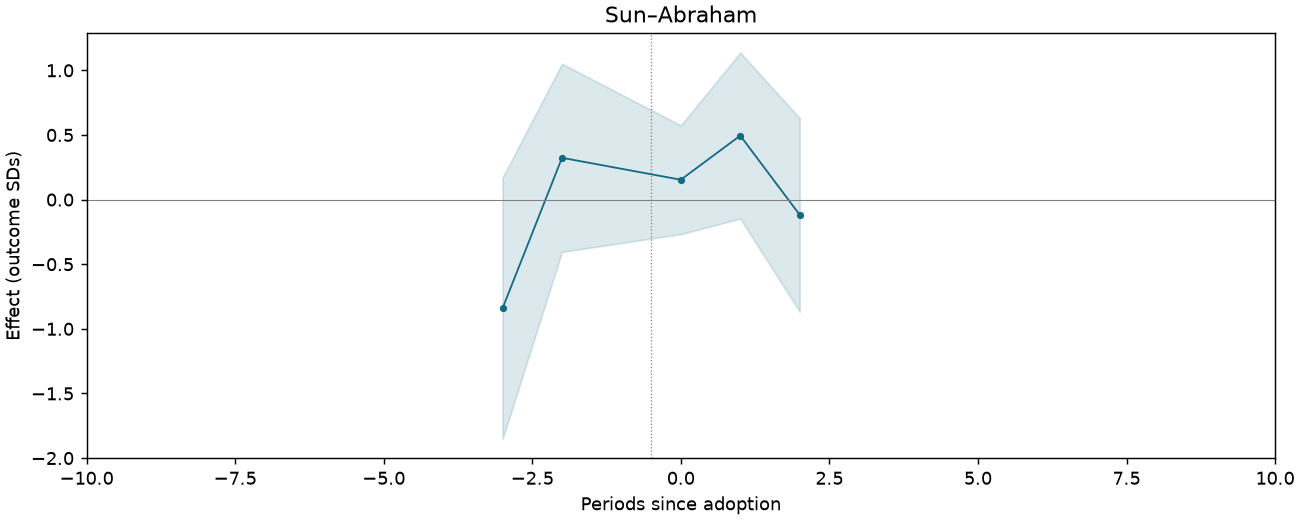
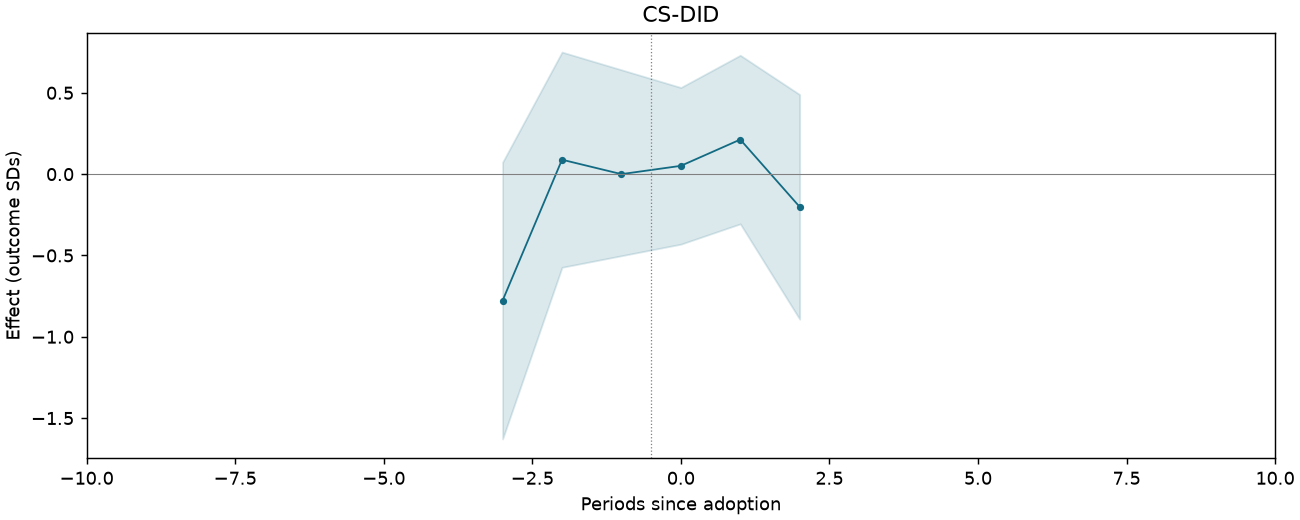
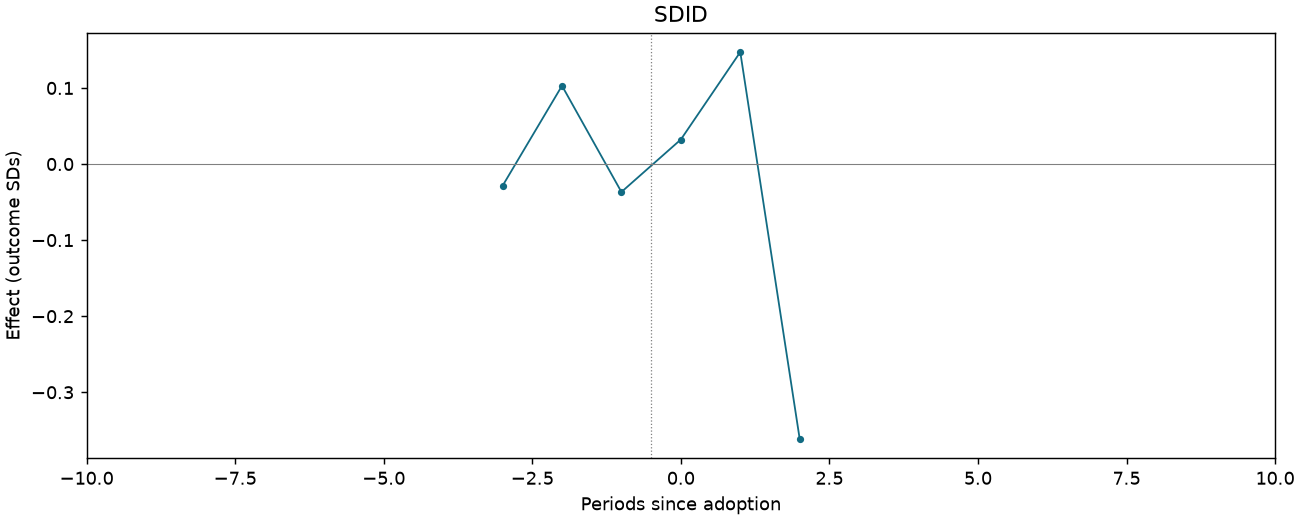
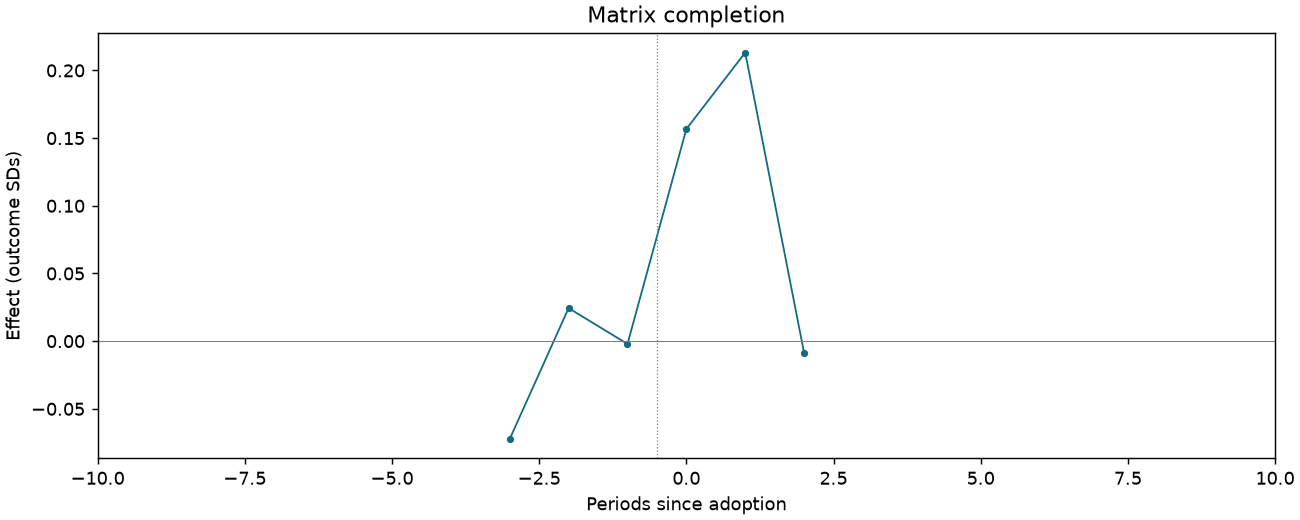
Perception of Chinese democracy z-score index [humanities-track students only]
264 observations · 17 units · 17 clusters · 10 treated / 7 control units.
Estimate comparison
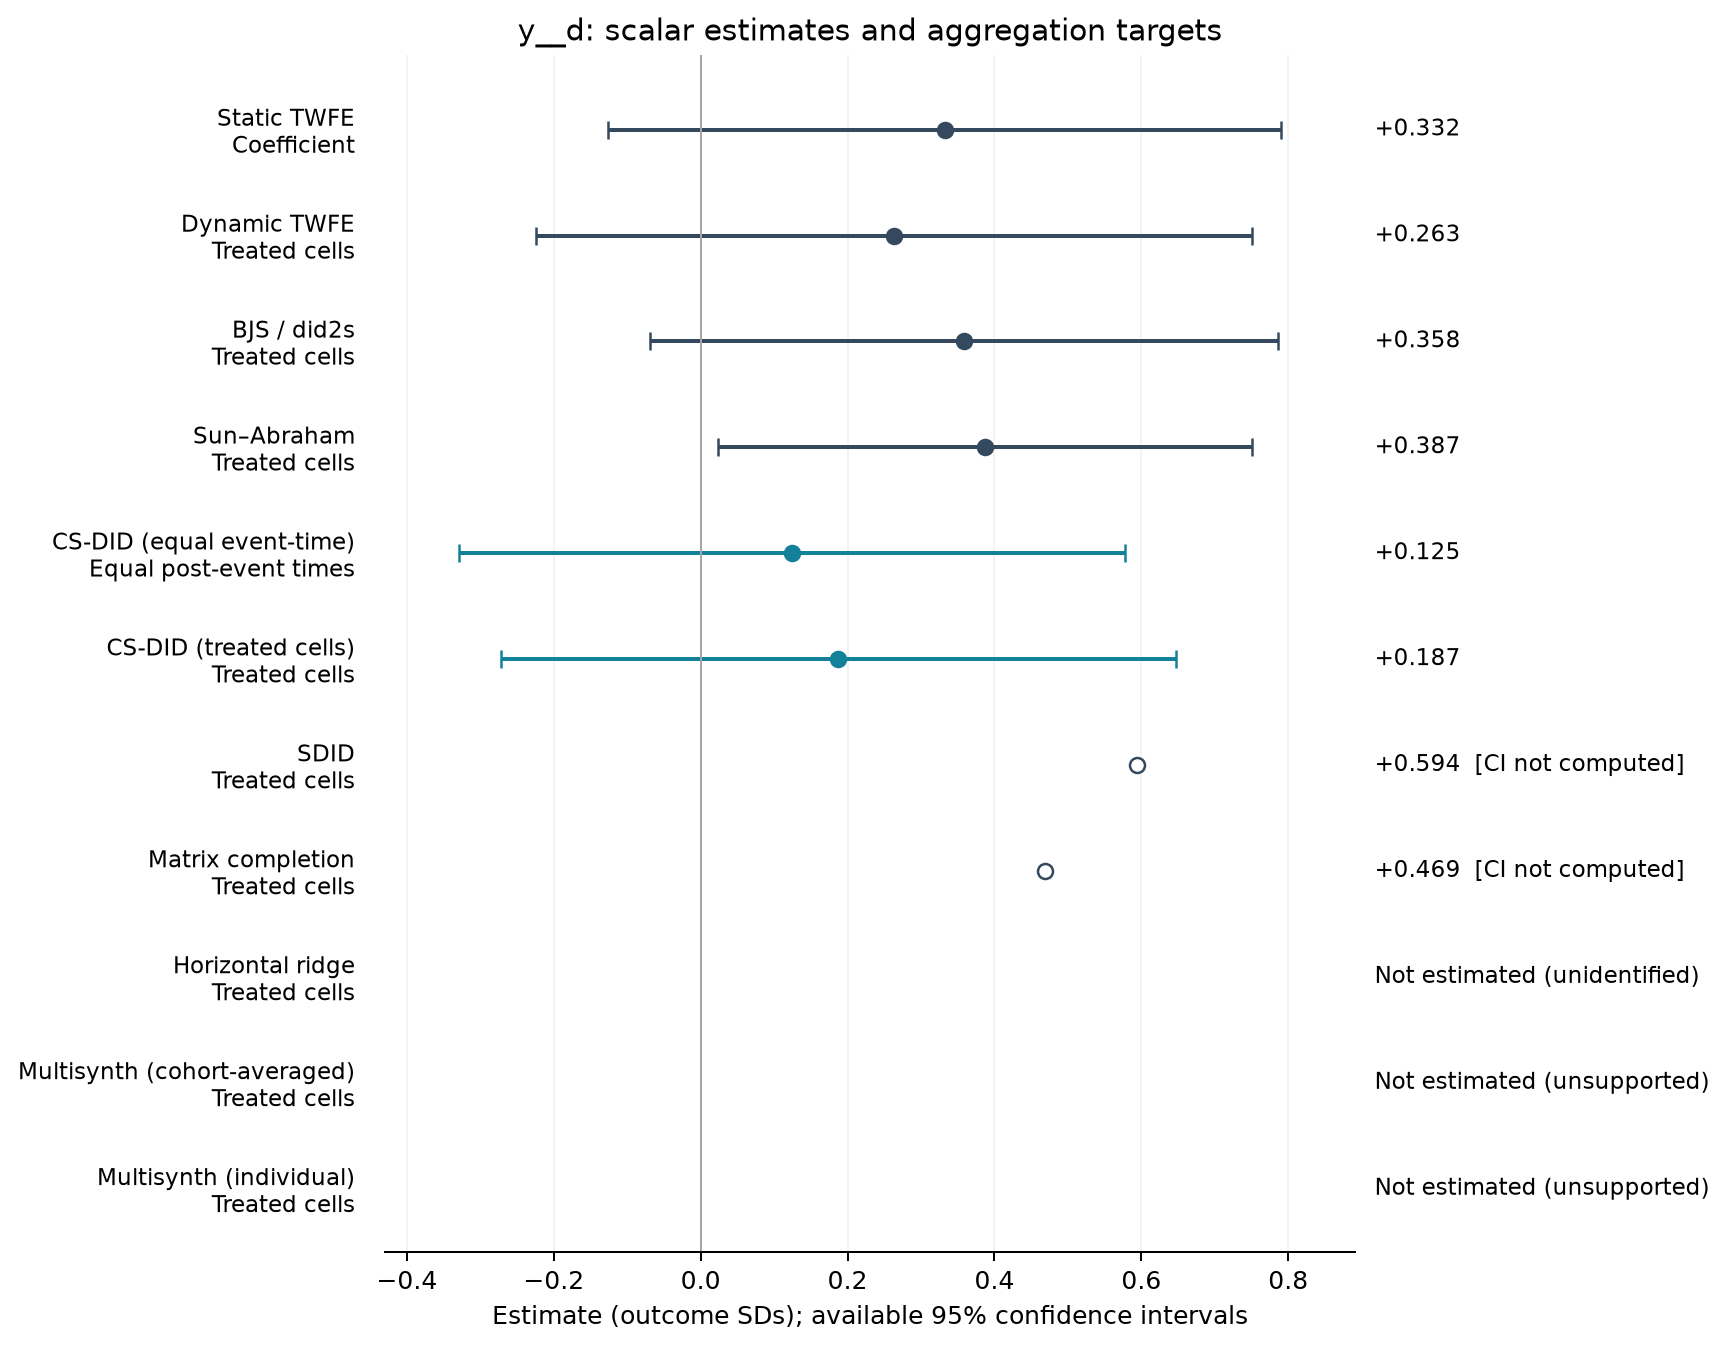
| Estimator | Estimate (SDs) | SE | 95% CI | Averaging |
|---|---|---|---|---|
| Static TWFE | 0.332 | 0.216 | [-0.126, 0.790] | Coefficient |
| Dynamic TWFE | 0.263 | 0.230 | [-0.224, 0.750] | Treated cells |
| BJS / did2s | 0.358 | 0.202 | [-0.069, 0.786] | Treated cells |
| Sun–Abraham | 0.387 | 0.172 | [0.023, 0.751] | Treated cells |
| CS-DID (equal event-time) | 0.125 | 0.231 | [-0.329, 0.578] | Equal post-event times |
| CS-DID (treated cells) | 0.187 | 0.235 | [-0.272, 0.647] | Treated cells |
| SDID | 0.594 | — | — | Treated cells |
| Matrix completion | 0.469 | — | — | Treated cells |
Event studies
Periods −10 to +10; pointwise 95% intervals where available.
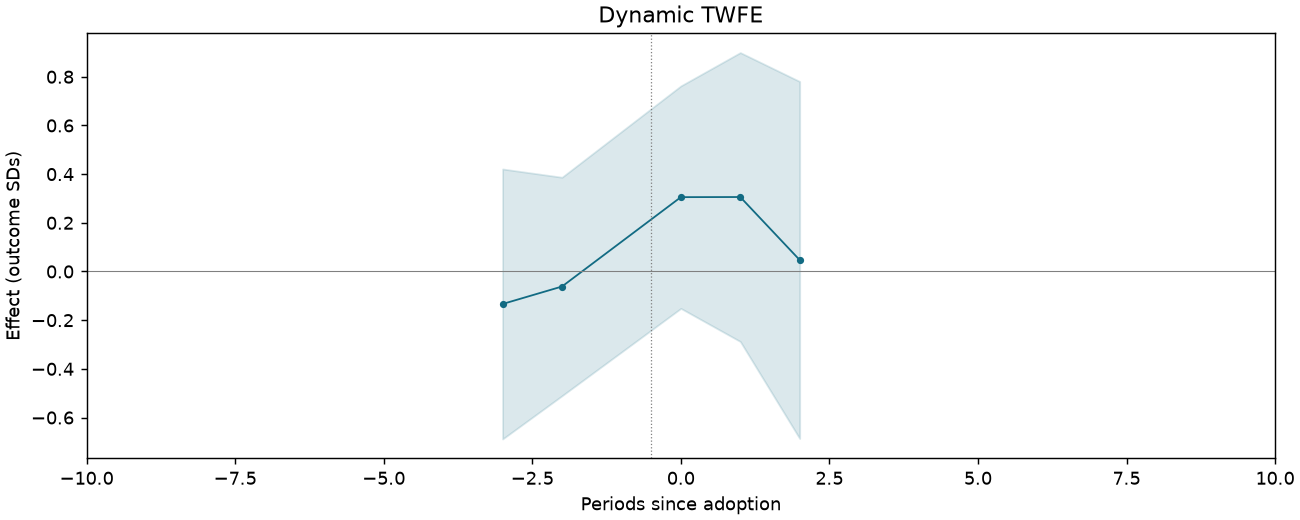
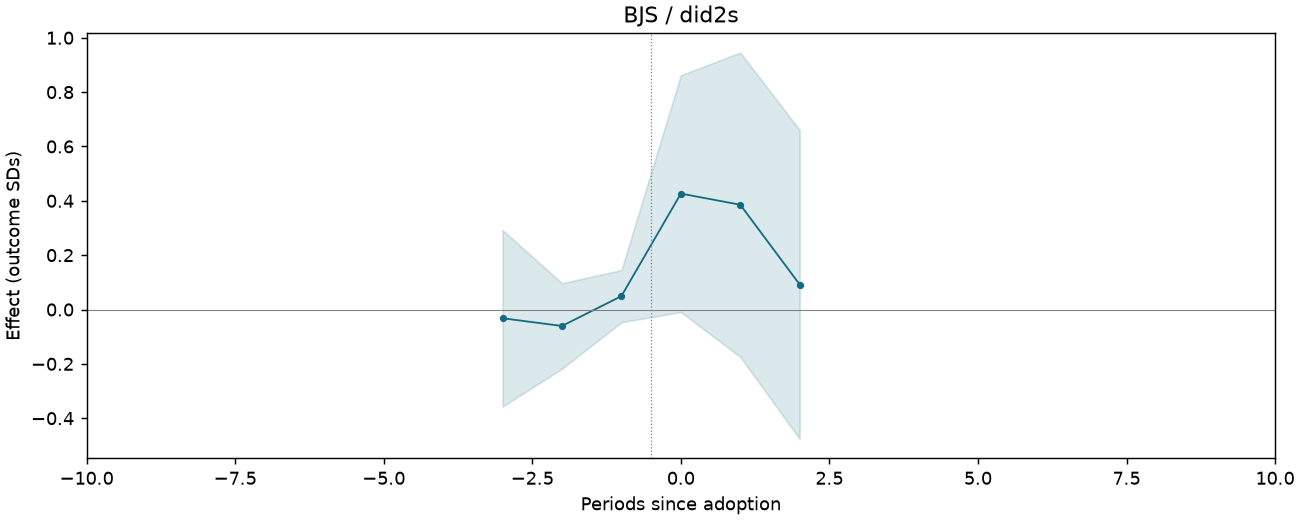
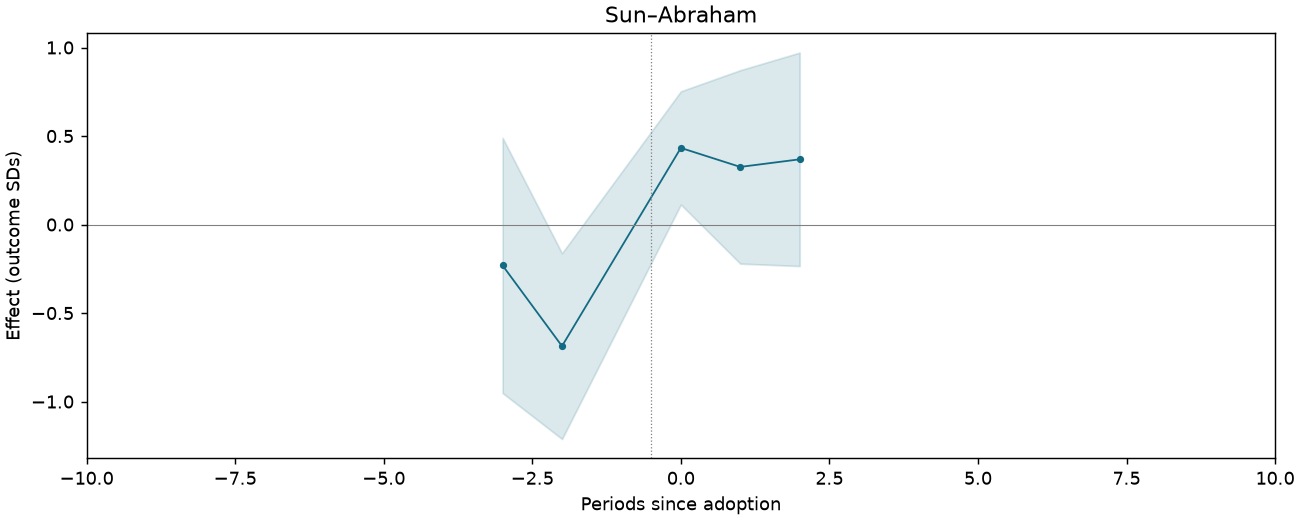
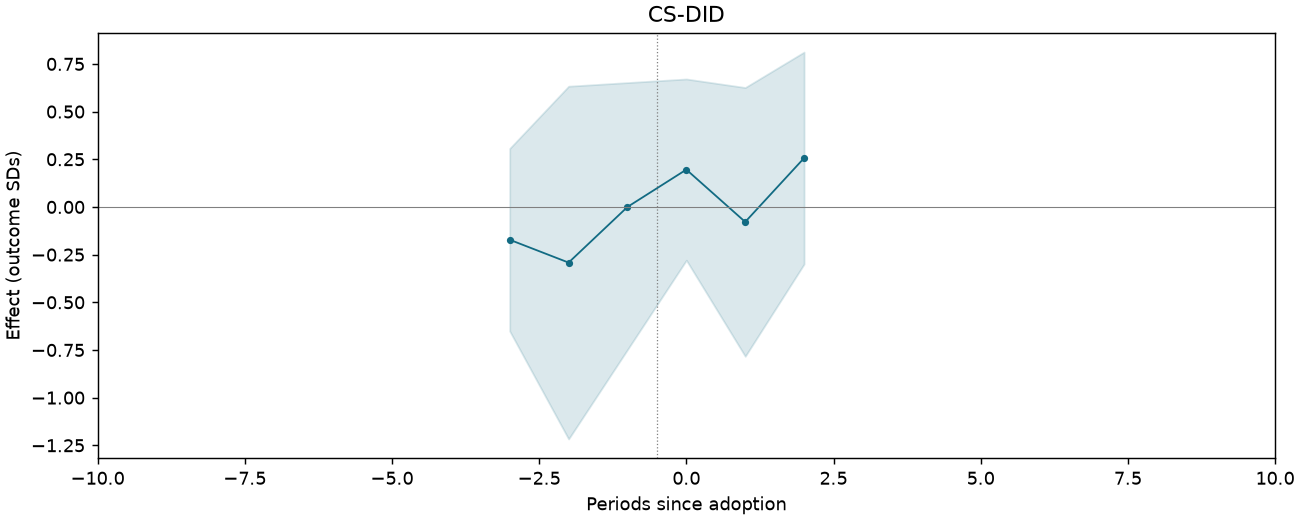
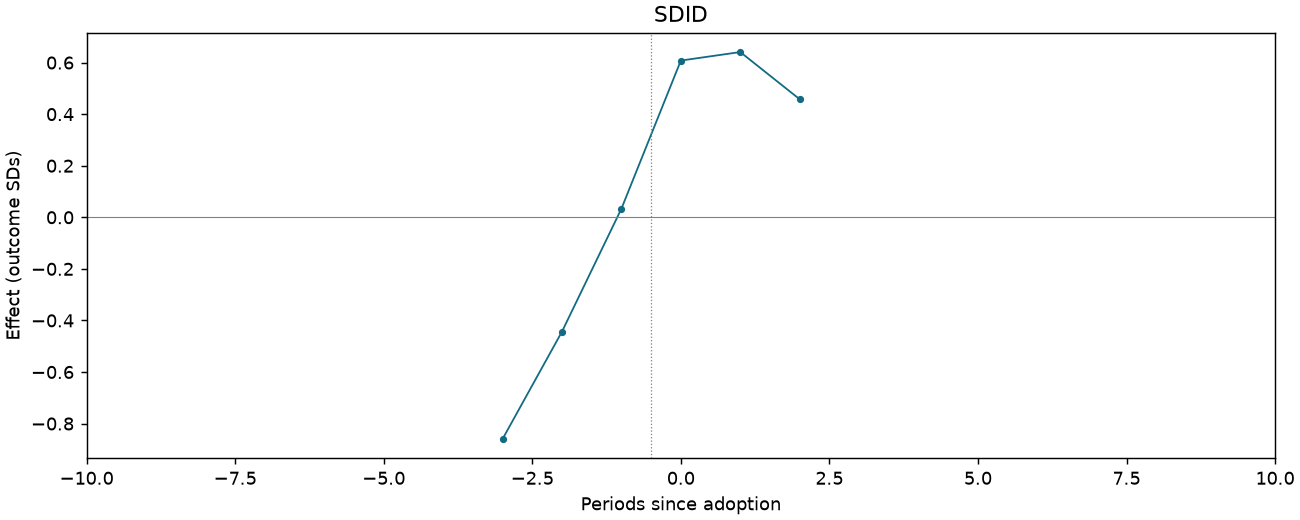
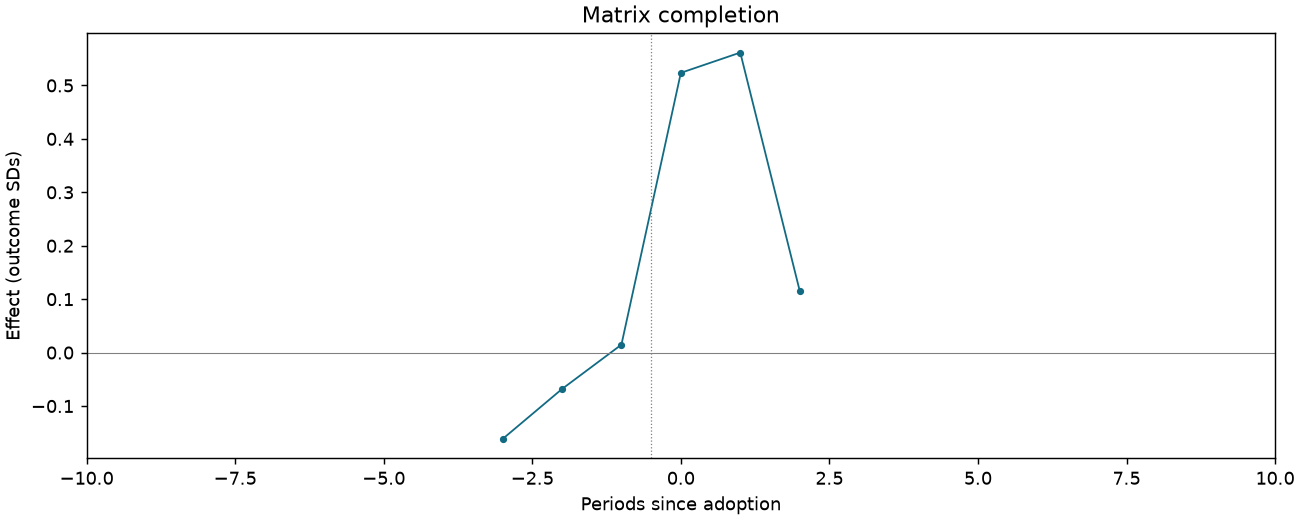
Wisdom of the masses z-score index [humanities-track students only]
250 observations · 17 units · 17 clusters · 10 treated / 7 control units.
Estimate comparison
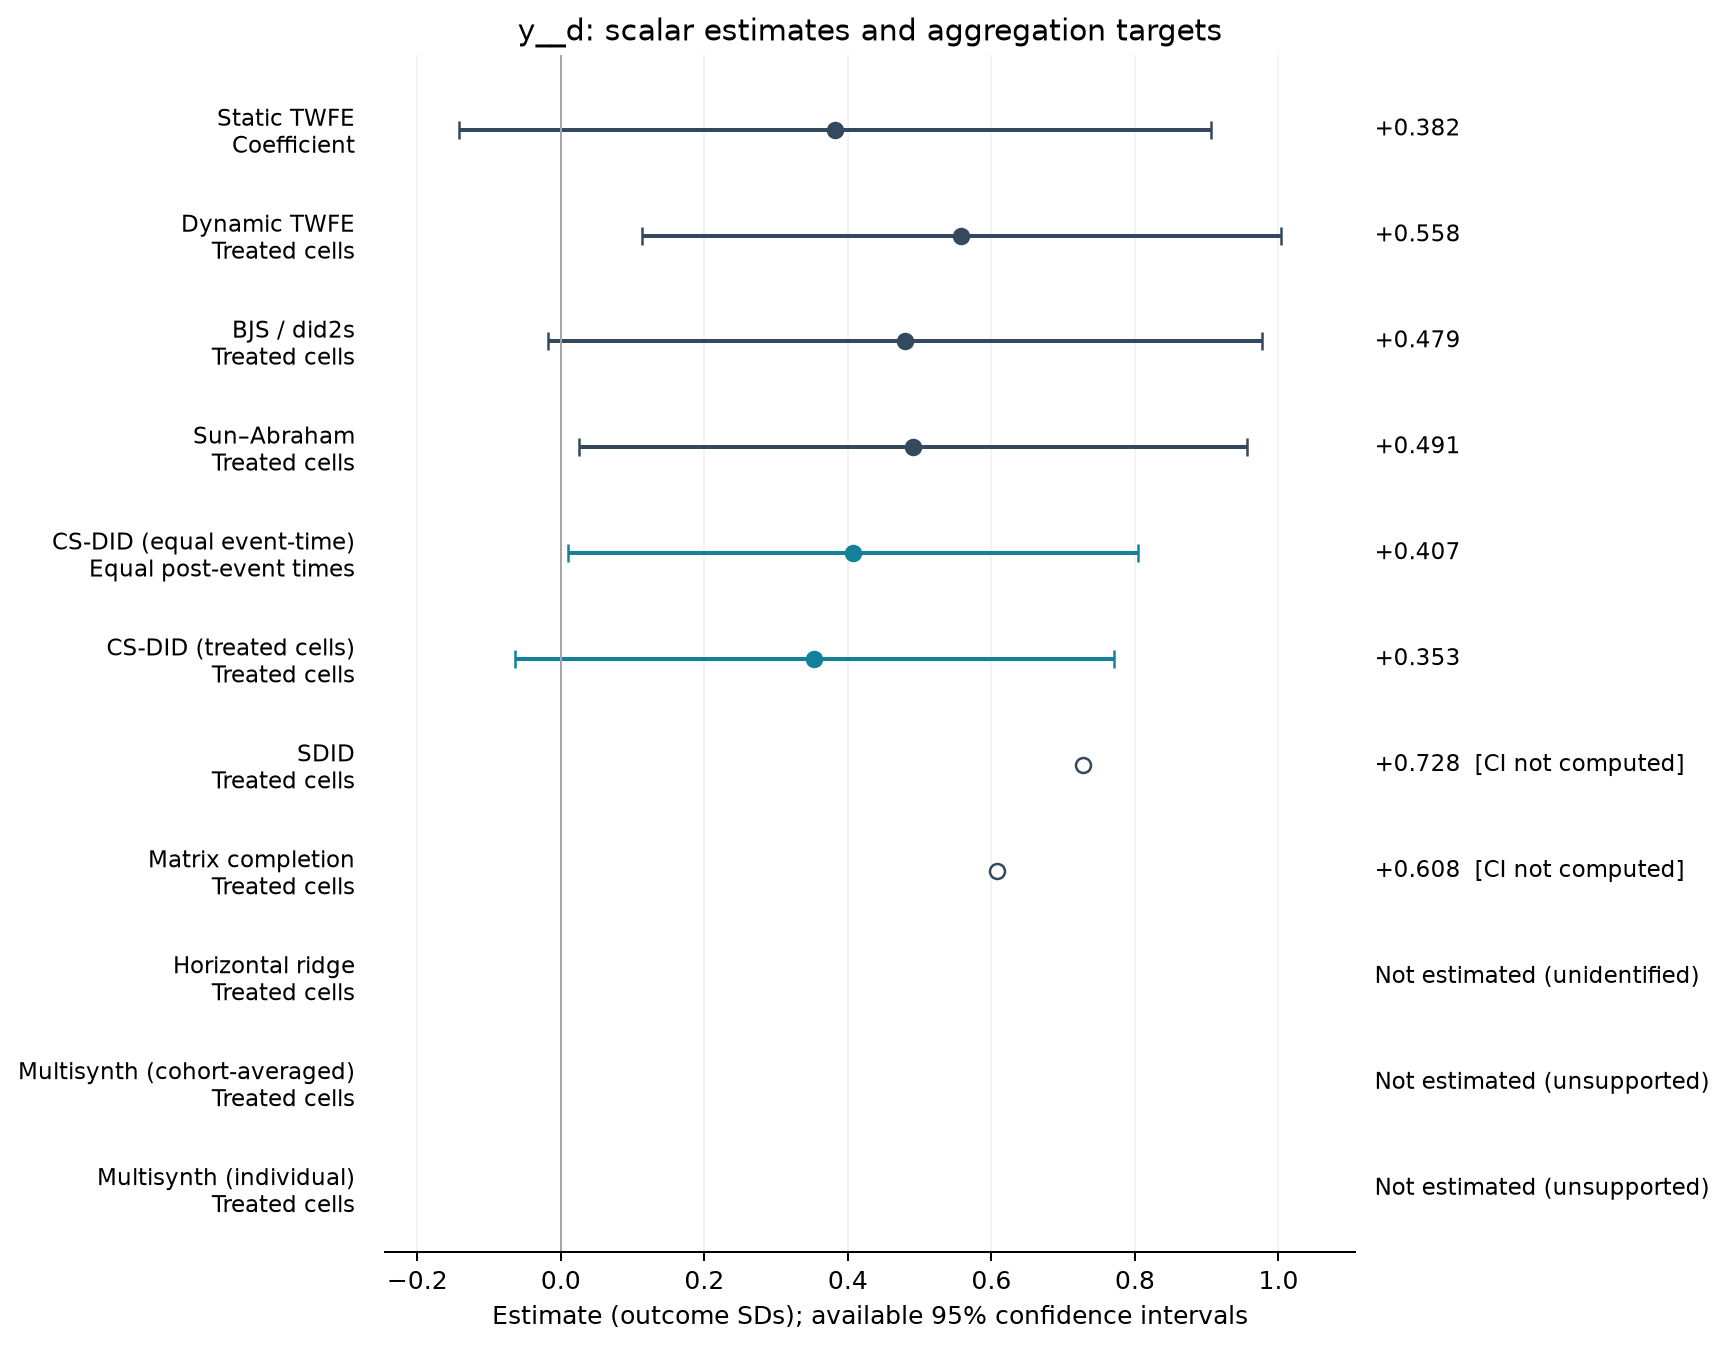
| Estimator | Estimate (SDs) | SE | 95% CI | Averaging |
|---|---|---|---|---|
| Static TWFE | 0.382 | 0.247 | [-0.142, 0.907] | Coefficient |
| Dynamic TWFE | 0.558 | 0.210 | [0.113, 1.004] | Treated cells |
| BJS / did2s | 0.479 | 0.235 | [-0.018, 0.977] | Treated cells |
| Sun–Abraham | 0.491 | 0.220 | [0.025, 0.956] | Treated cells |
| CS-DID (equal event-time) | 0.407 | 0.203 | [0.009, 0.804] | Equal post-event times |
| CS-DID (treated cells) | 0.353 | 0.213 | [-0.063, 0.770] | Treated cells |
| SDID | 0.728 | — | — | Treated cells |
| Matrix completion | 0.608 | — | — | Treated cells |
Event studies
Periods −10 to +10; pointwise 95% intervals where available.
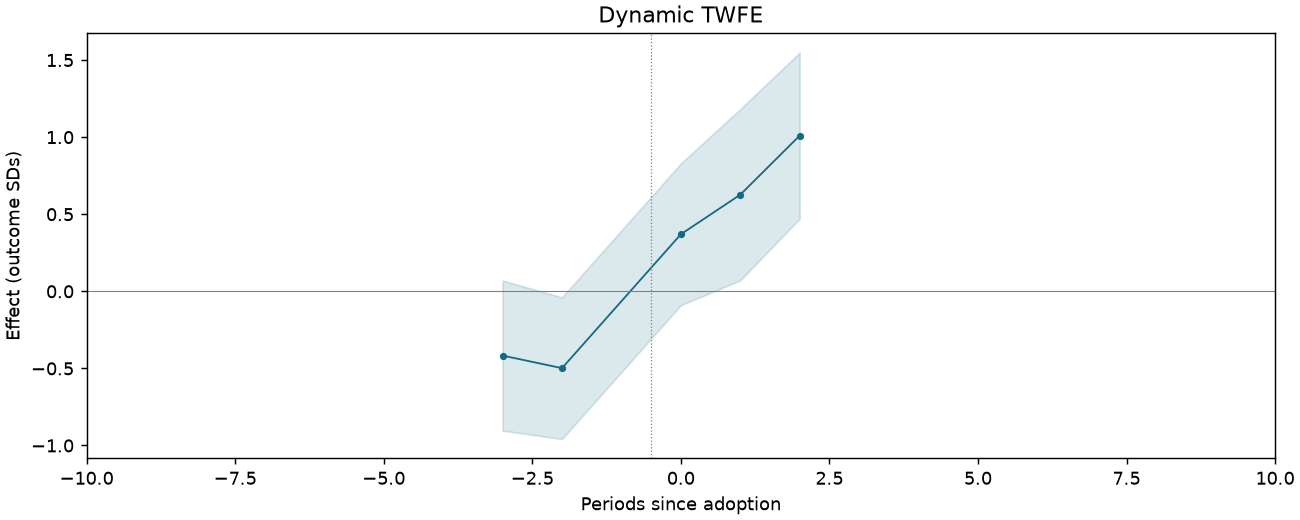
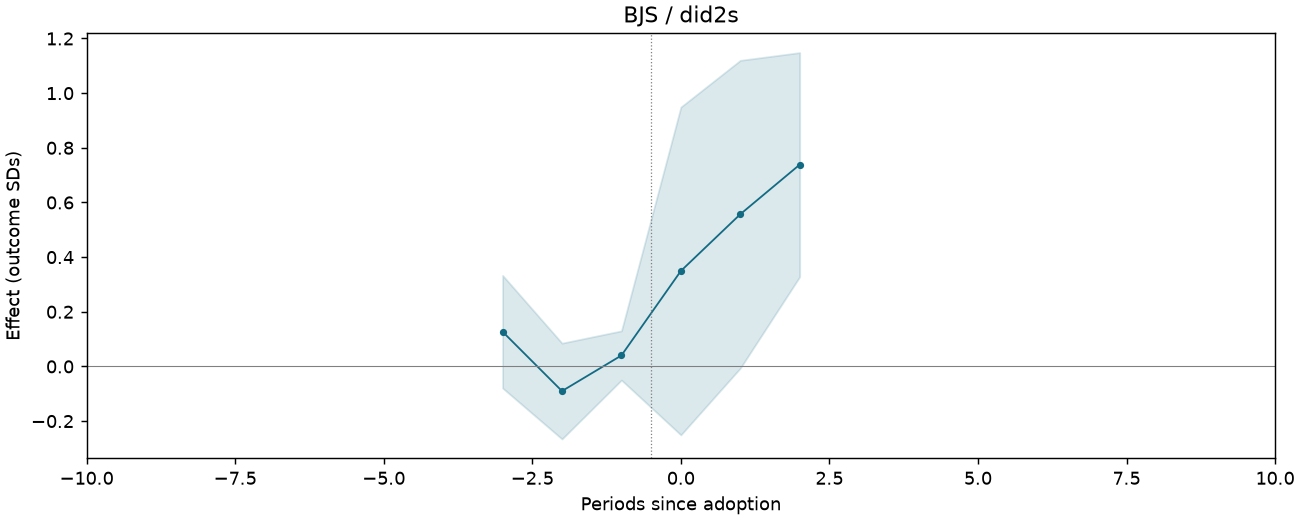
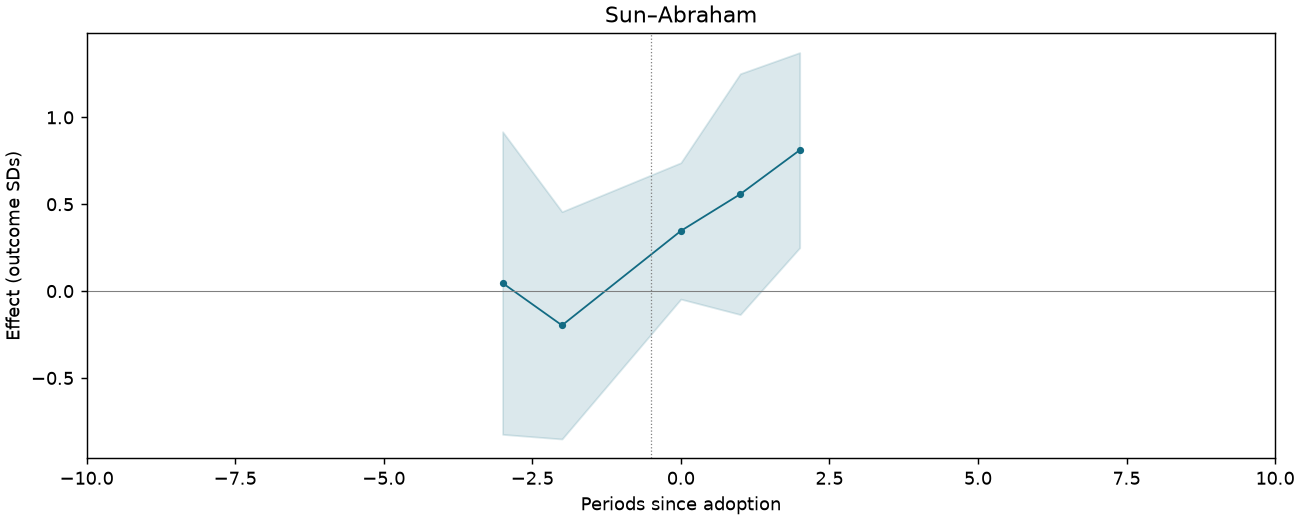
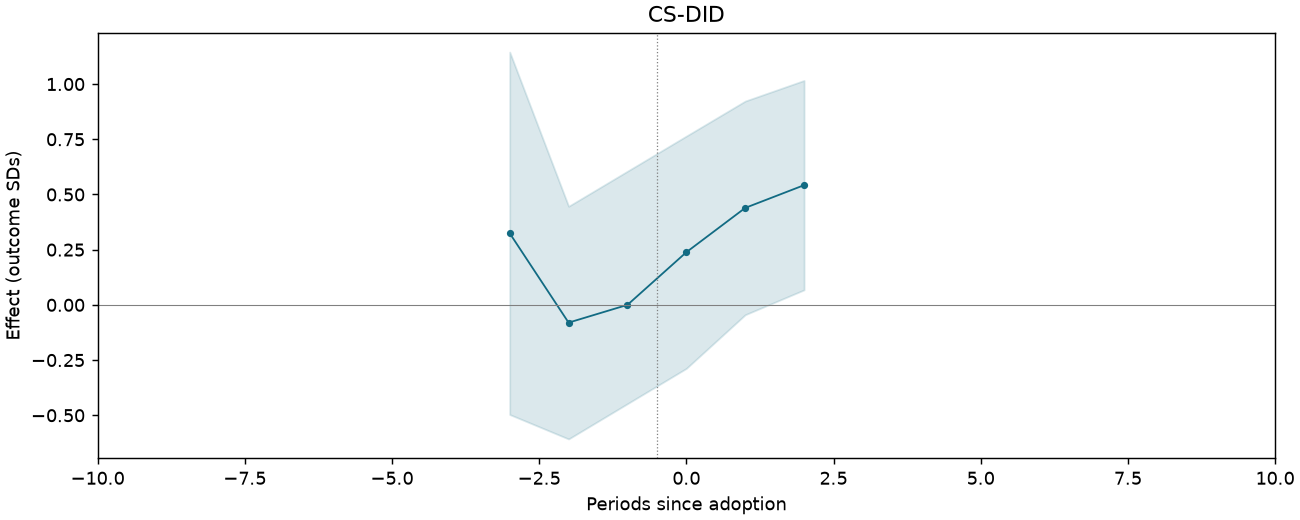
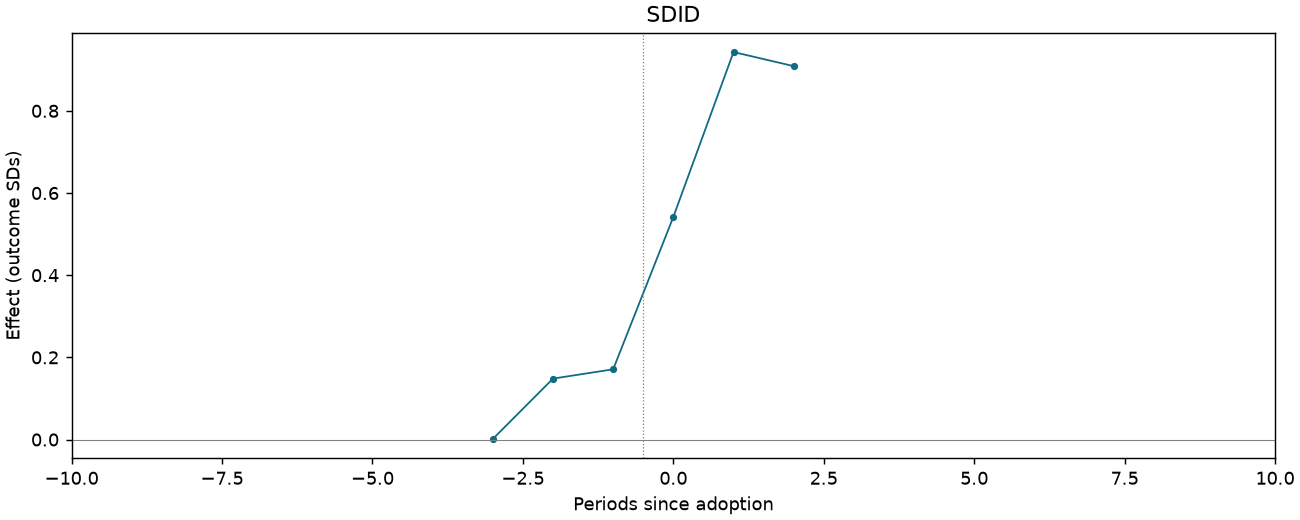
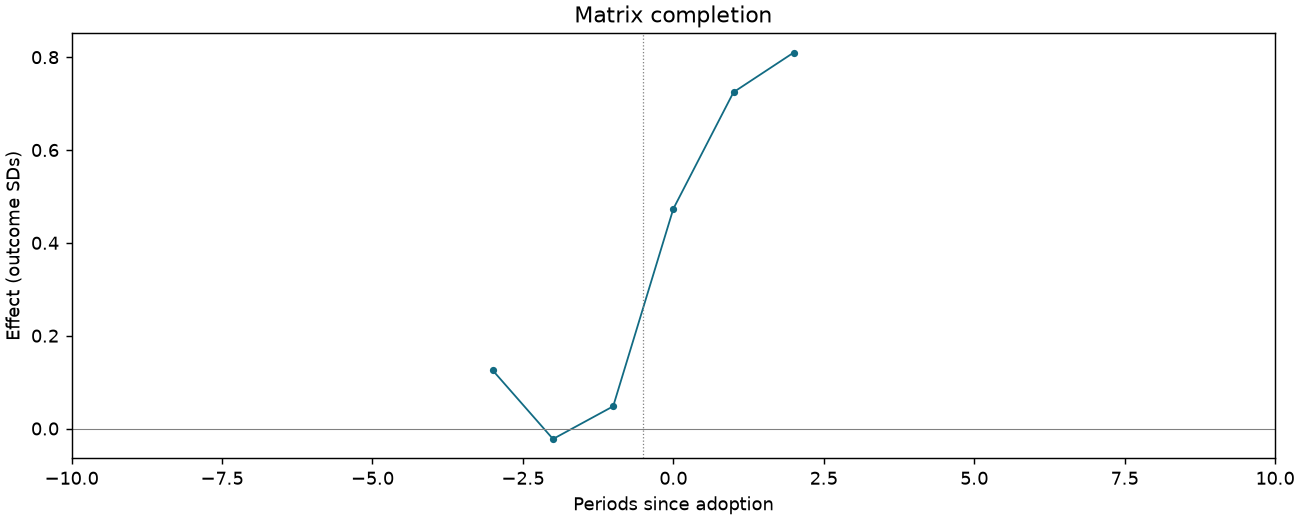
Participation is key for democracy [humanities-track students only]
264 observations · 17 units · 17 clusters · 10 treated / 7 control units.
Estimate comparison
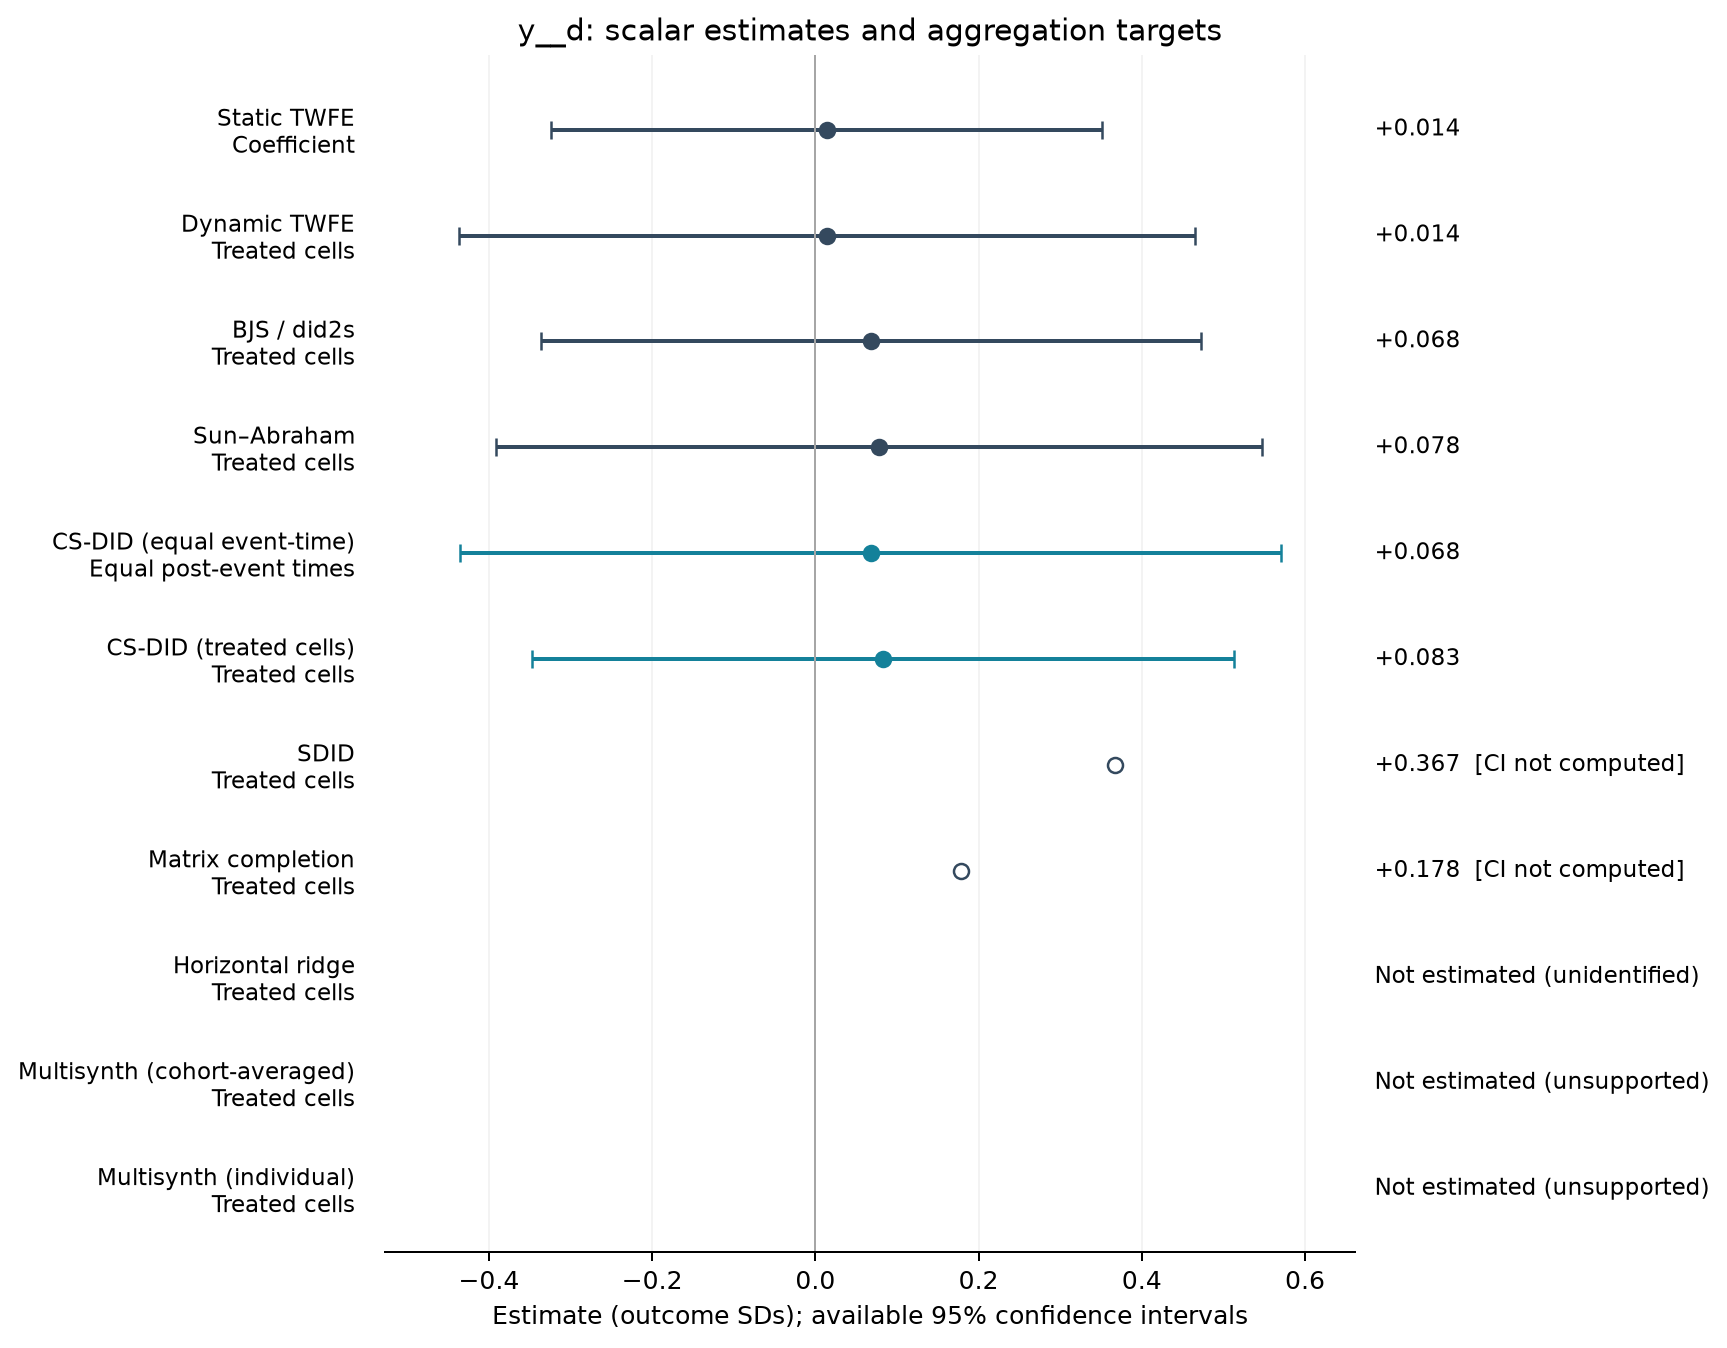
| Estimator | Estimate (SDs) | SE | 95% CI | Averaging |
|---|---|---|---|---|
| Static TWFE | 0.014 | 0.159 | [-0.323, 0.351] | Coefficient |
| Dynamic TWFE | 0.014 | 0.213 | [-0.437, 0.465] | Treated cells |
| BJS / did2s | 0.068 | 0.191 | [-0.336, 0.472] | Treated cells |
| Sun–Abraham | 0.078 | 0.221 | [-0.392, 0.547] | Treated cells |
| CS-DID (equal event-time) | 0.068 | 0.257 | [-0.435, 0.571] | Equal post-event times |
| CS-DID (treated cells) | 0.083 | 0.220 | [-0.348, 0.513] | Treated cells |
| SDID | 0.367 | — | — | Treated cells |
| Matrix completion | 0.178 | — | — | Treated cells |
Event studies
Periods −10 to +10; pointwise 95% intervals where available.
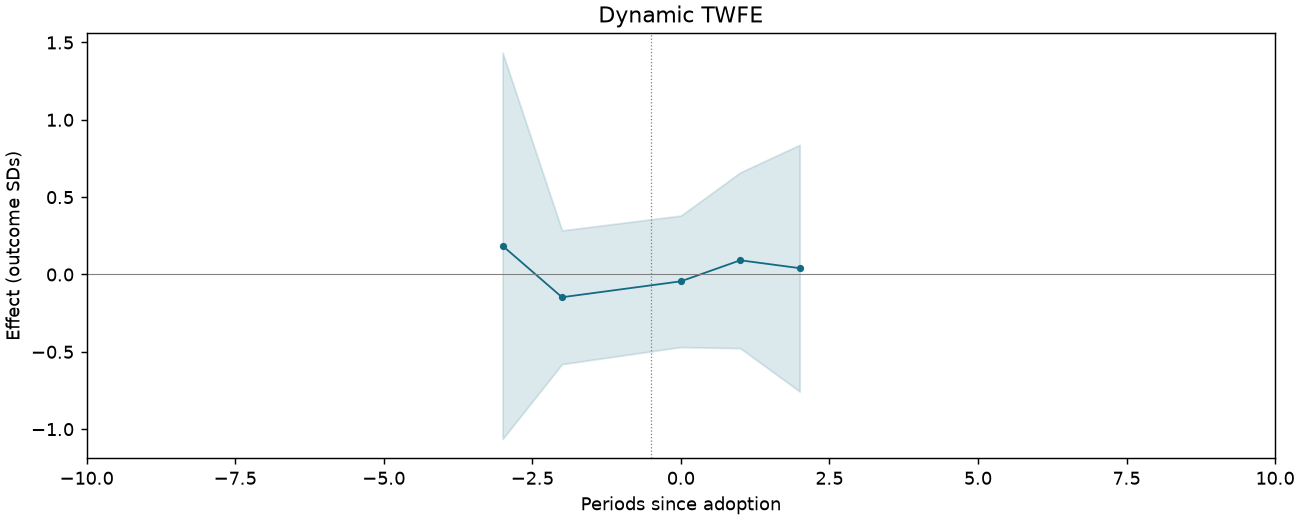
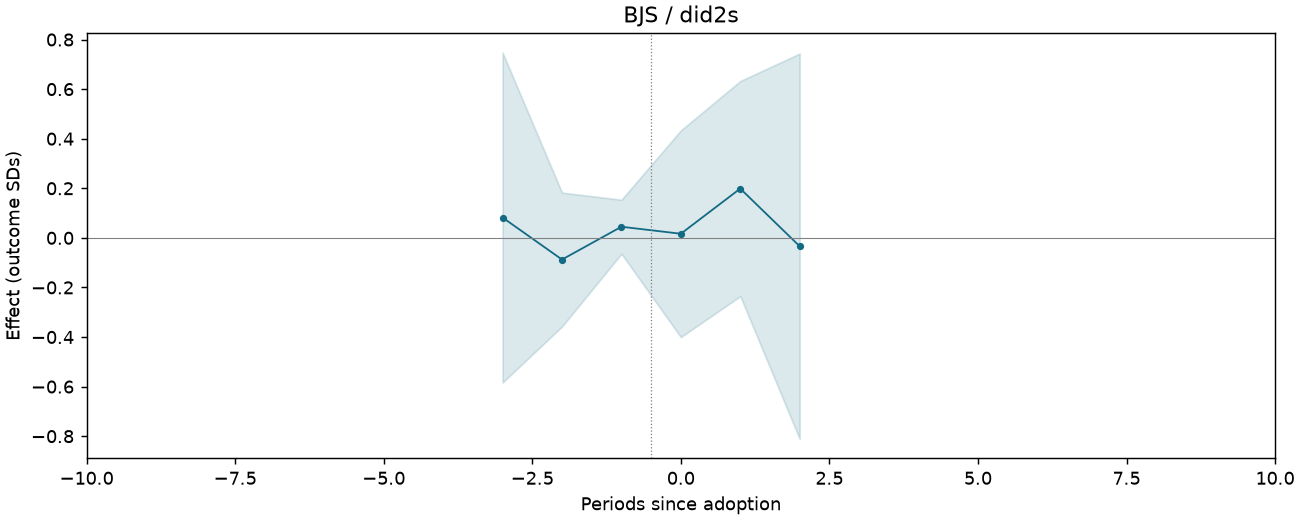
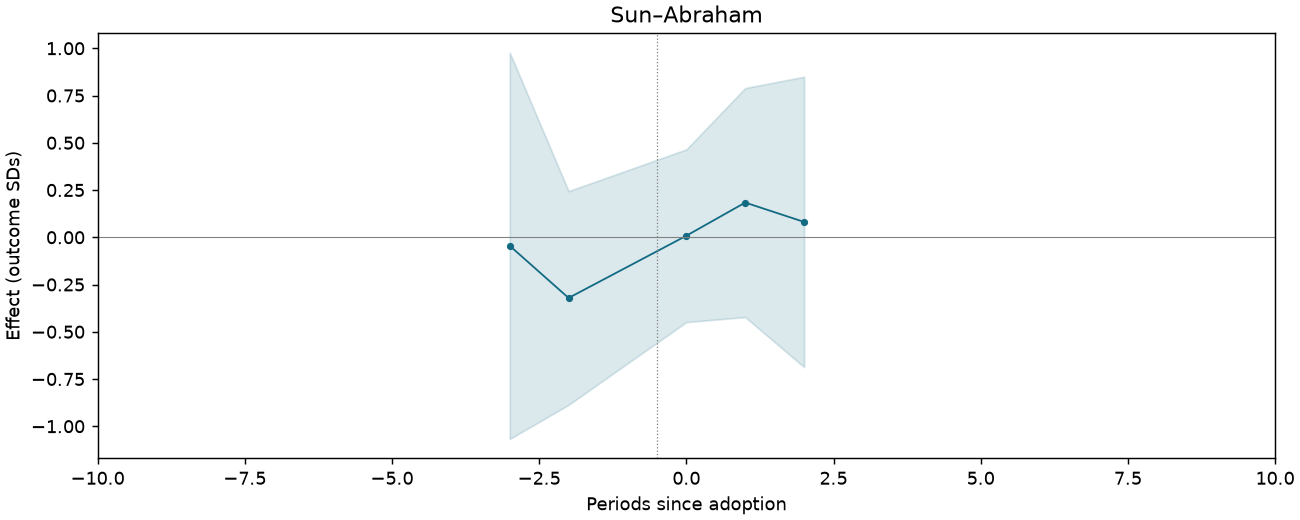
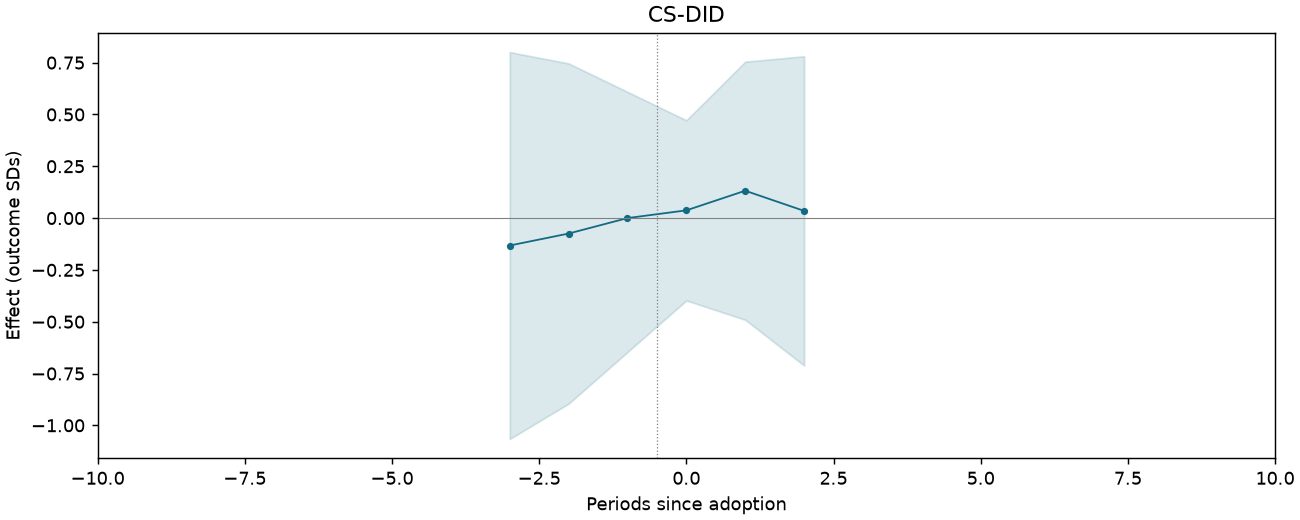
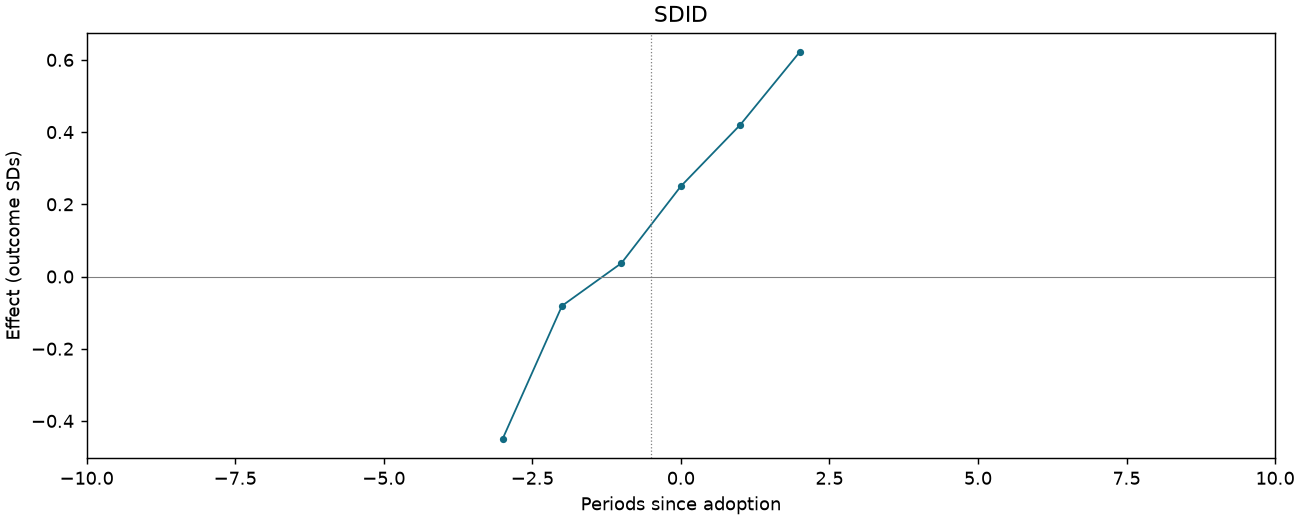
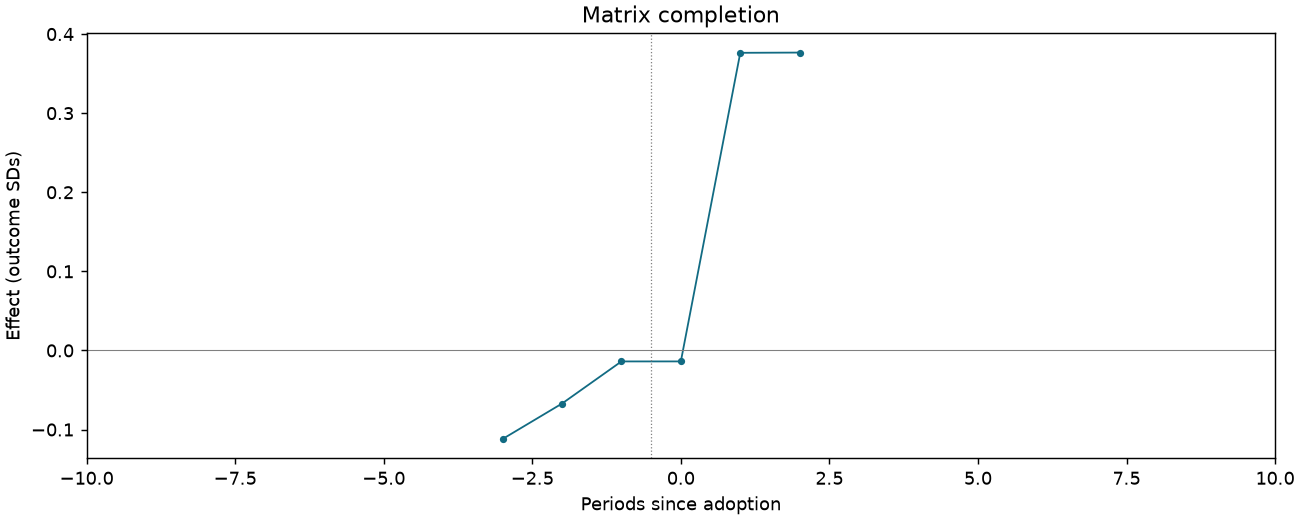
Skeptical of markets [humanities-track students only]
246 observations · 17 units · 17 clusters · 10 treated / 7 control units.
Estimate comparison
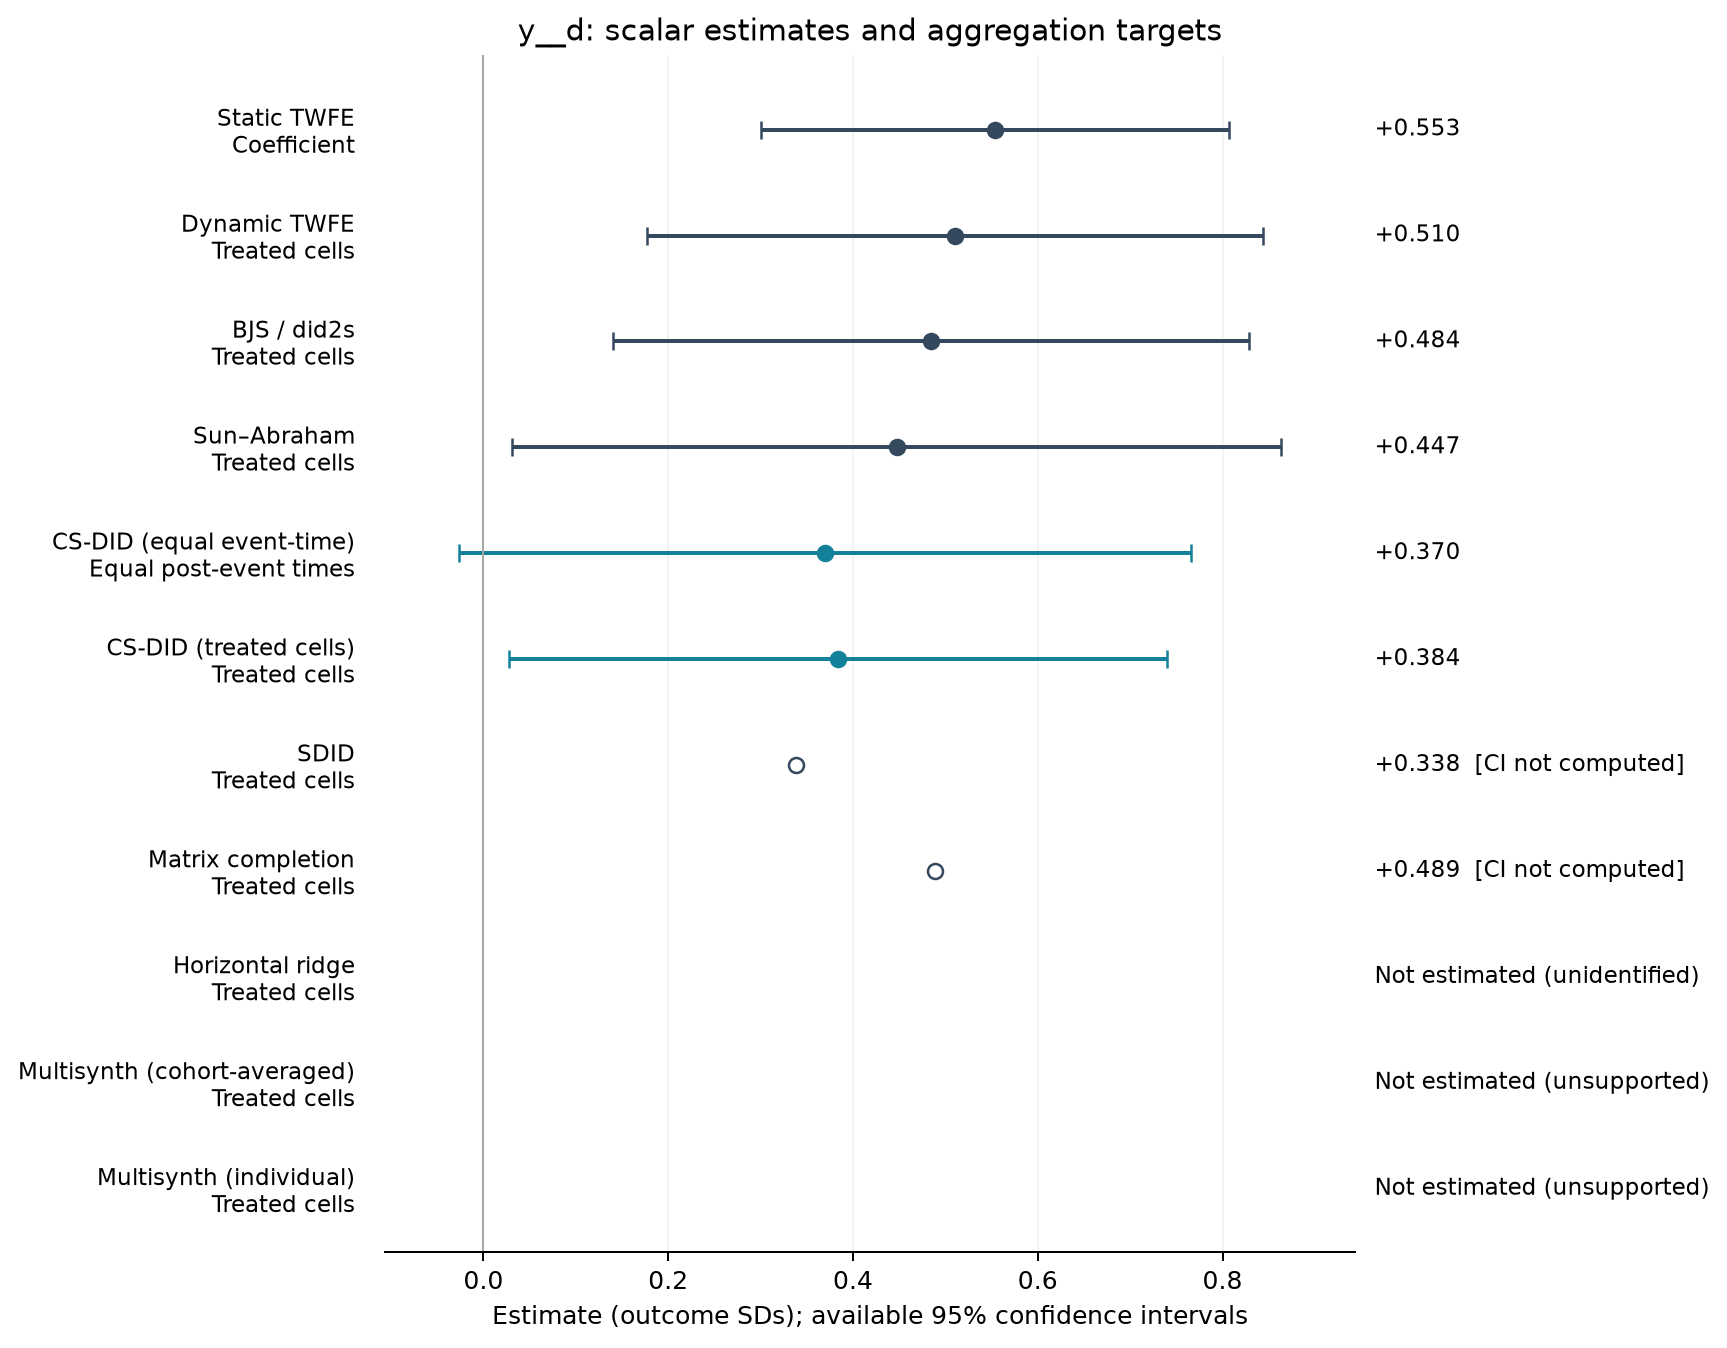
| Estimator | Estimate (SDs) | SE | 95% CI | Averaging |
|---|---|---|---|---|
| Static TWFE | 0.553 | 0.119 | [0.300, 0.807] | Coefficient |
| Dynamic TWFE | 0.510 | 0.157 | [0.177, 0.844] | Treated cells |
| BJS / did2s | 0.484 | 0.162 | [0.140, 0.828] | Treated cells |
| Sun–Abraham | 0.447 | 0.196 | [0.031, 0.864] | Treated cells |
| CS-DID (equal event-time) | 0.370 | 0.202 | [-0.026, 0.766] | Equal post-event times |
| CS-DID (treated cells) | 0.384 | 0.182 | [0.028, 0.740] | Treated cells |
| SDID | 0.338 | — | — | Treated cells |
| Matrix completion | 0.489 | — | — | Treated cells |
Event studies
Periods −10 to +10; pointwise 95% intervals where available.
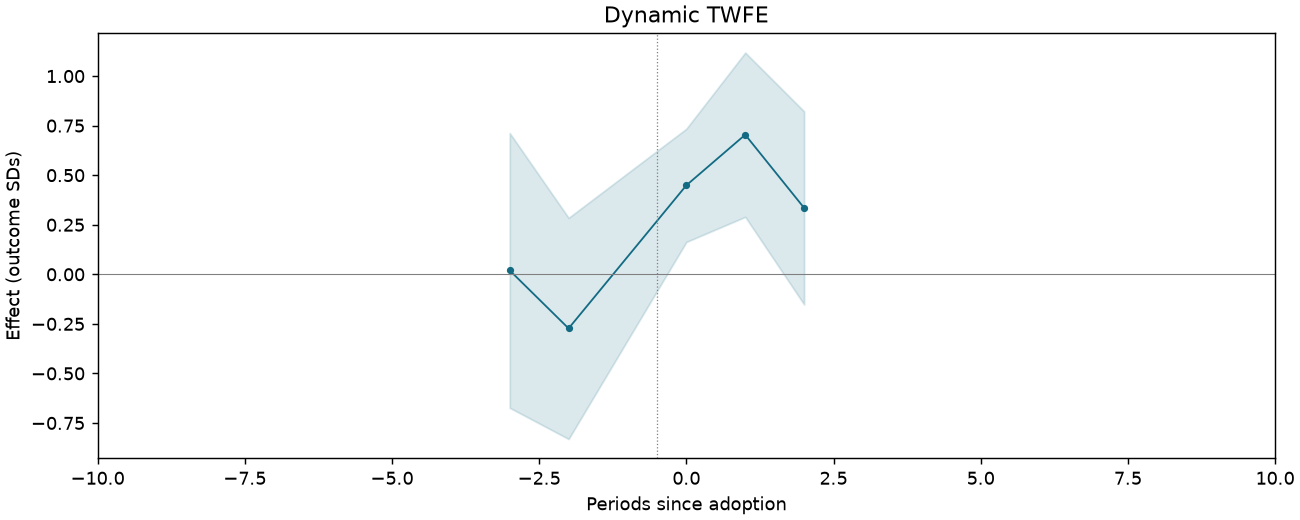
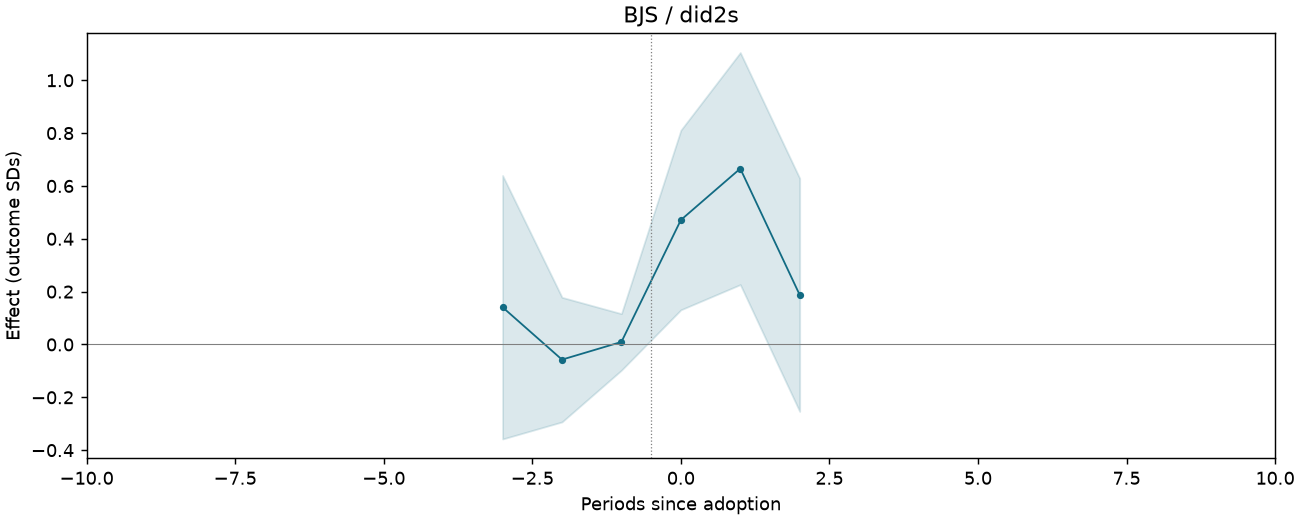
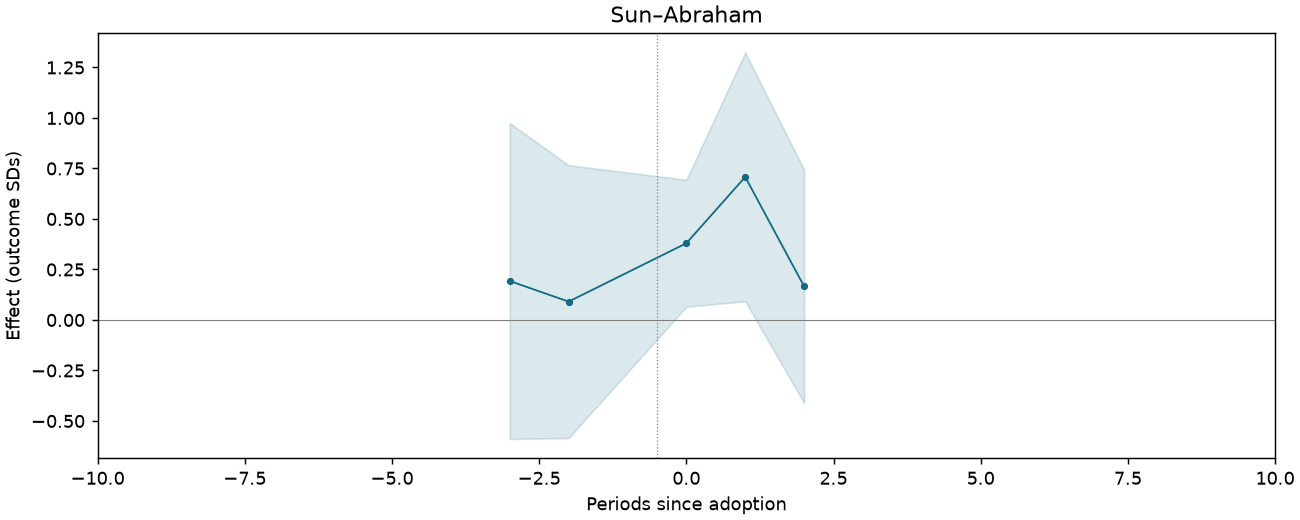
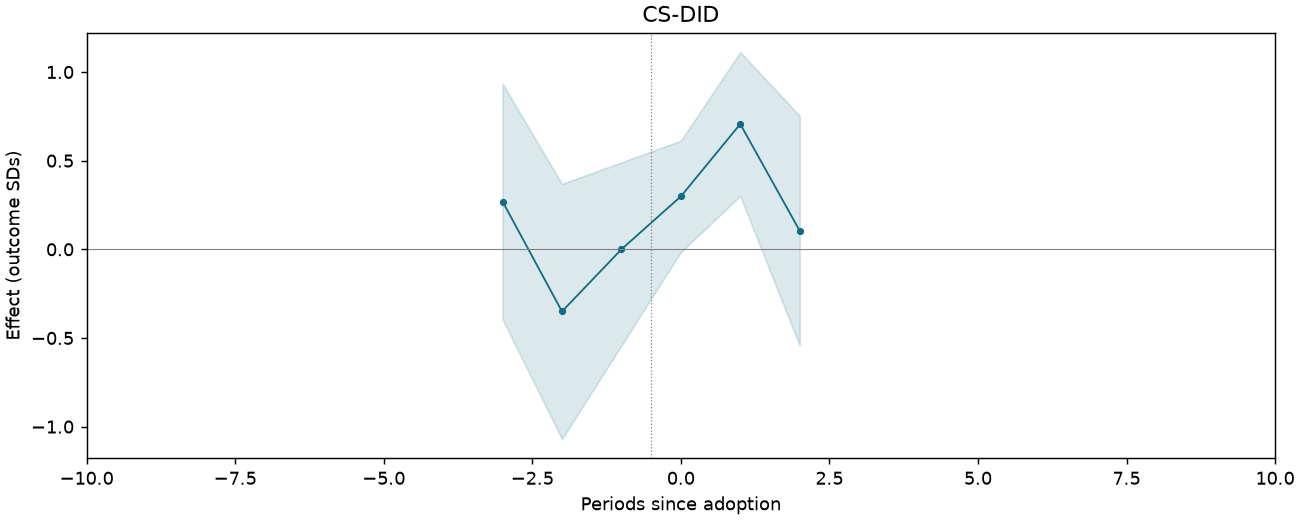
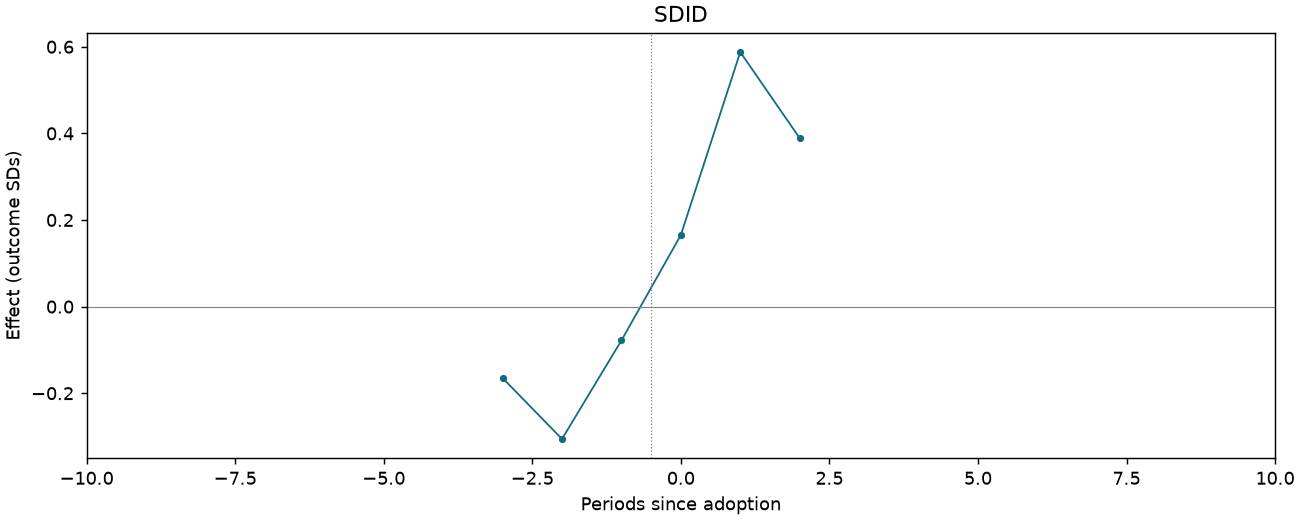
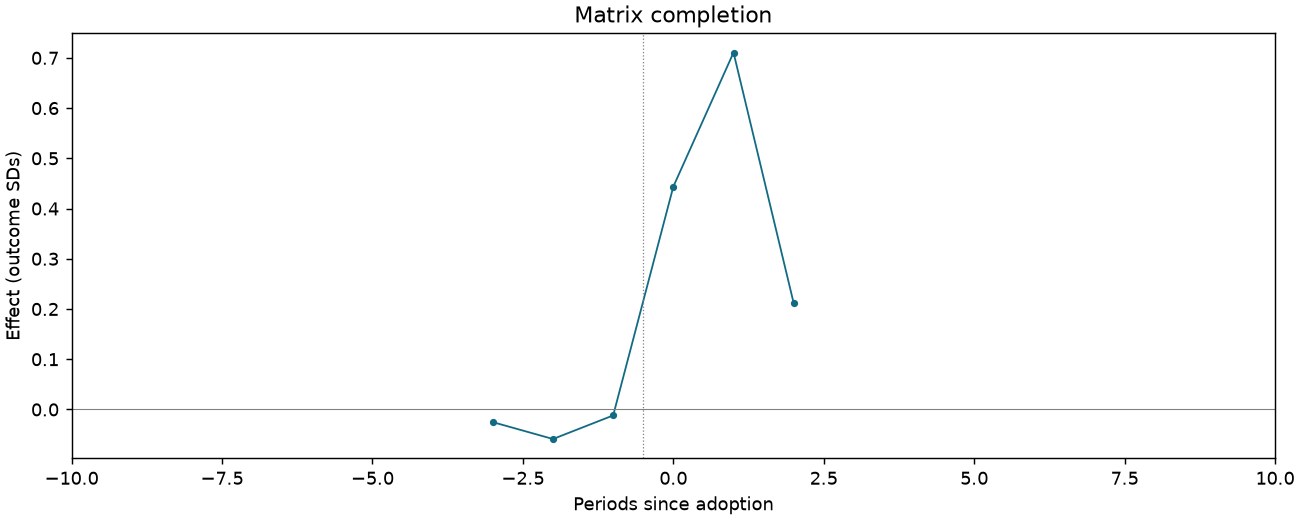
Ethnic identity z-score index [humanities-track students only]
295 observations · 18 units · 18 clusters · 11 treated / 7 control units.
Estimate comparison
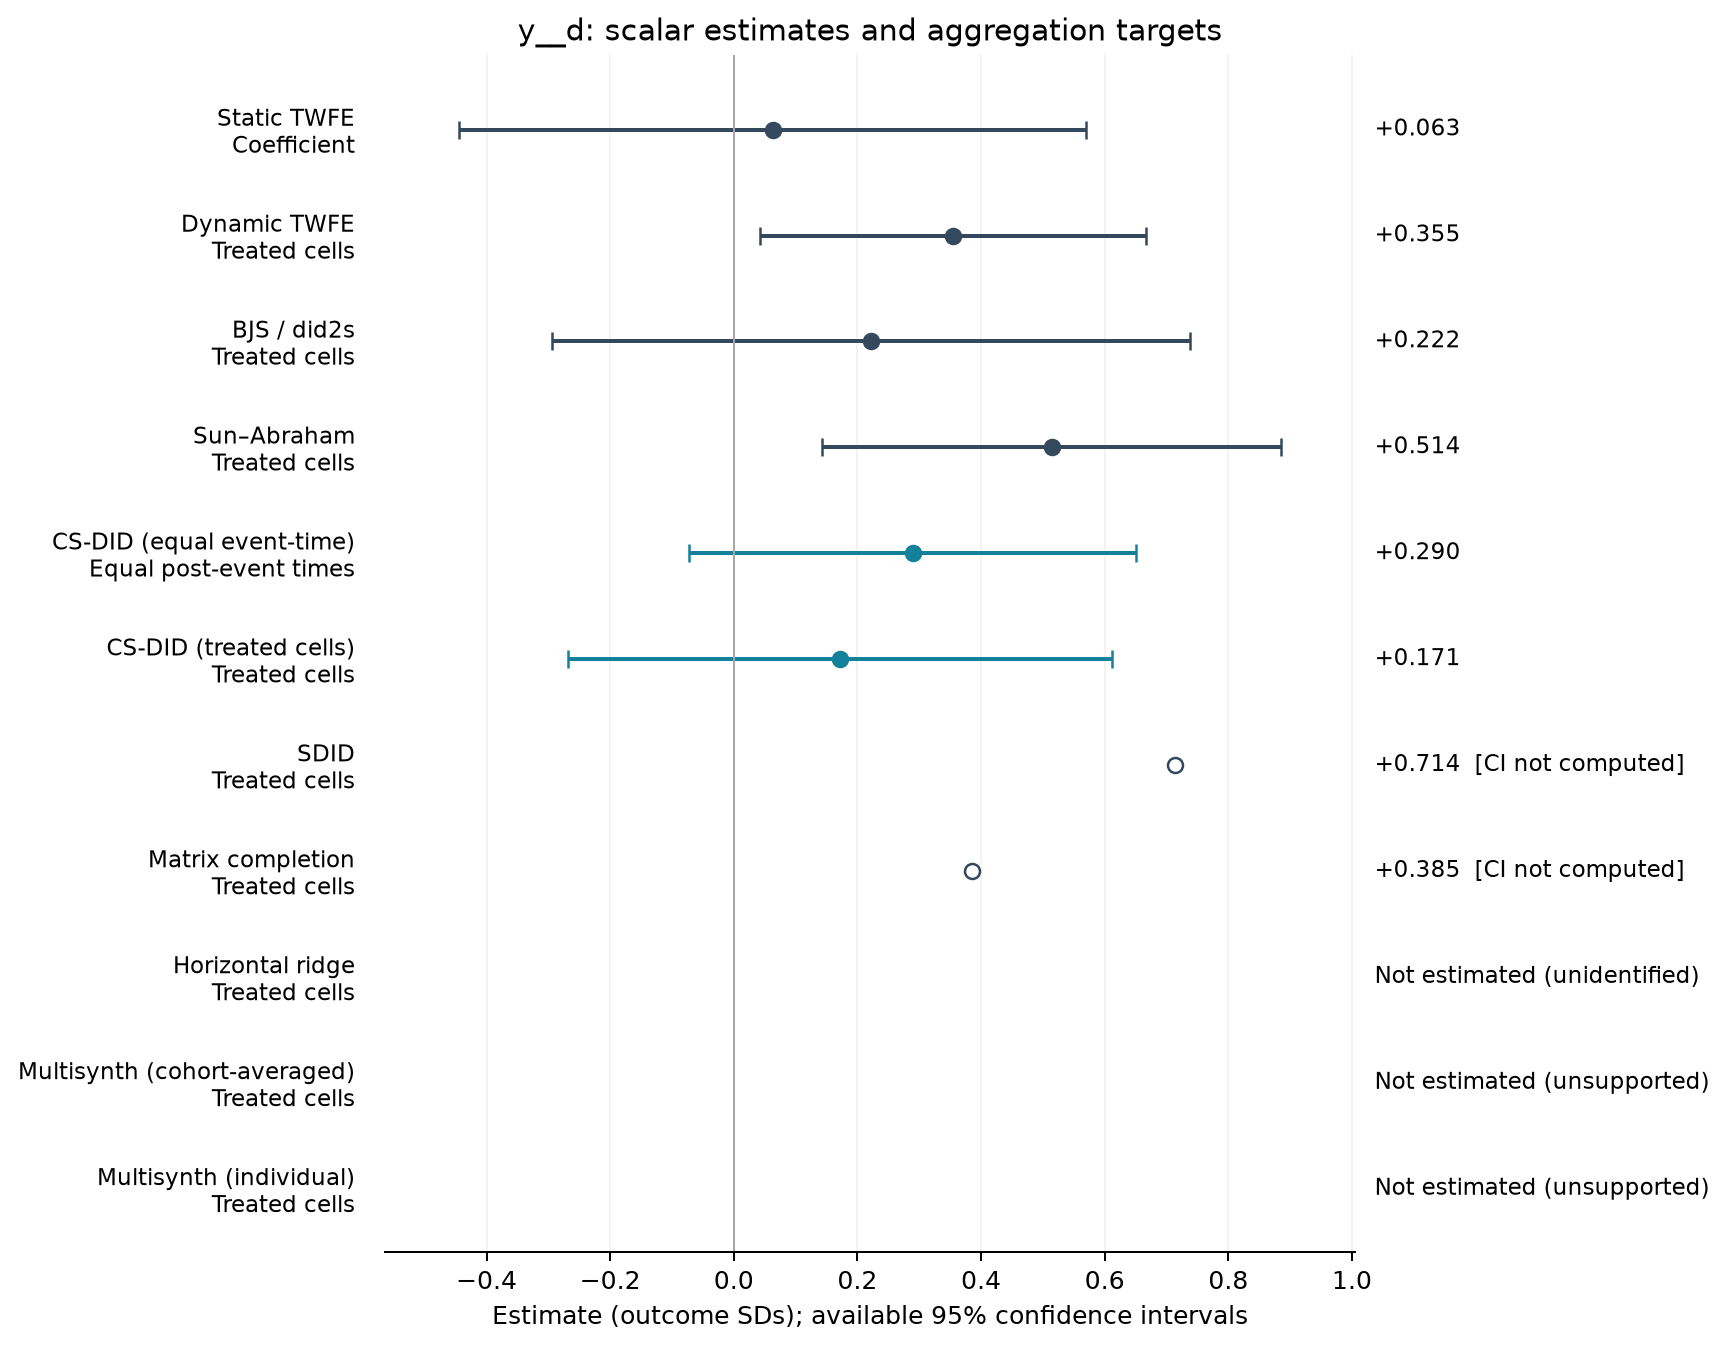
| Estimator | Estimate (SDs) | SE | 95% CI | Averaging |
|---|---|---|---|---|
| Static TWFE | 0.063 | 0.240 | [-0.445, 0.570] | Coefficient |
| Dynamic TWFE | 0.355 | 0.148 | [0.043, 0.666] | Treated cells |
| BJS / did2s | 0.222 | 0.245 | [-0.294, 0.739] | Treated cells |
| Sun–Abraham | 0.514 | 0.176 | [0.143, 0.885] | Treated cells |
| CS-DID (equal event-time) | 0.290 | 0.184 | [-0.072, 0.651] | Equal post-event times |
| CS-DID (treated cells) | 0.171 | 0.225 | [-0.269, 0.611] | Treated cells |
| SDID | 0.714 | — | — | Treated cells |
| Matrix completion | 0.385 | — | — | Treated cells |
Event studies
Periods −10 to +10; pointwise 95% intervals where available.
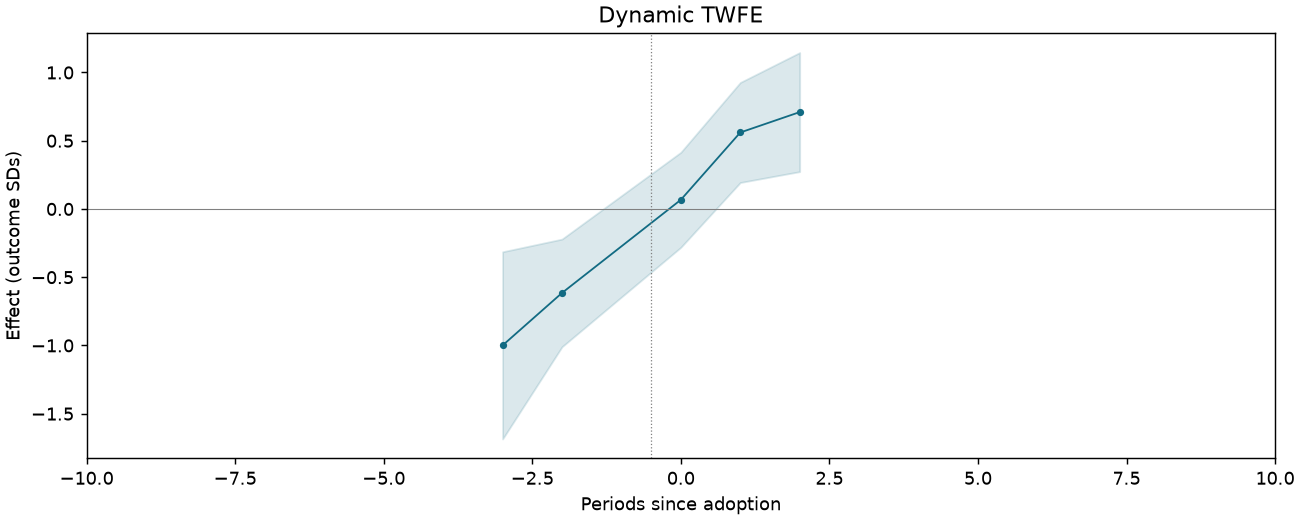
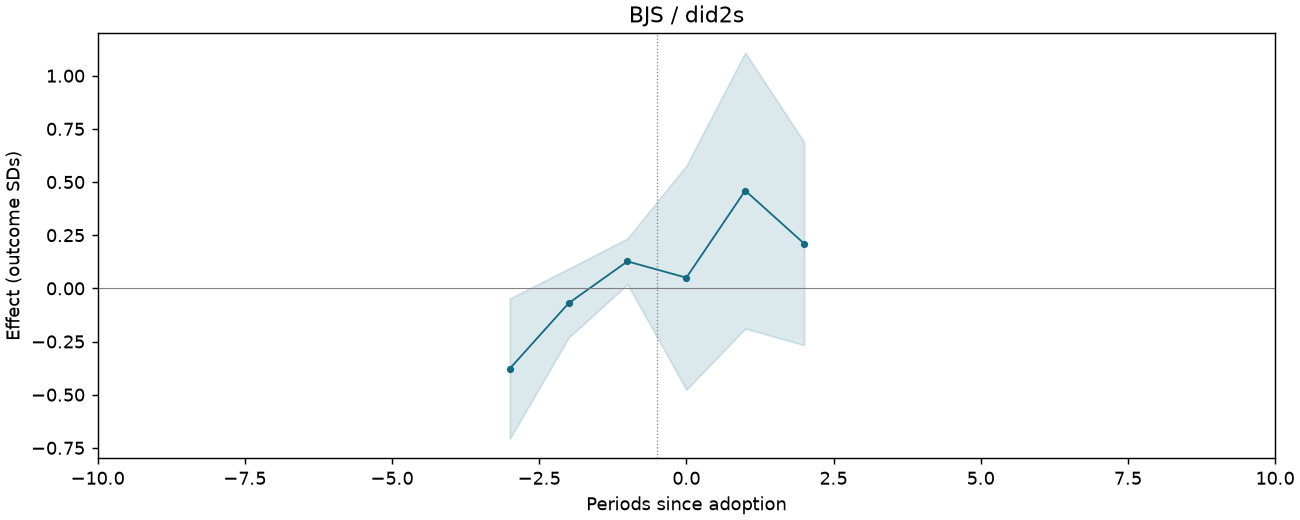
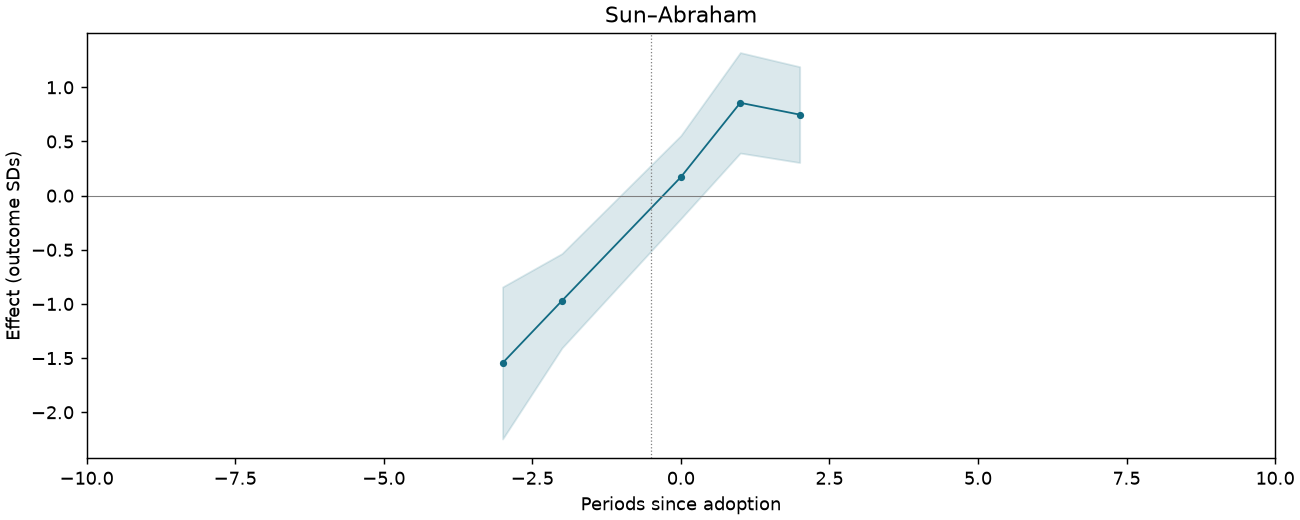
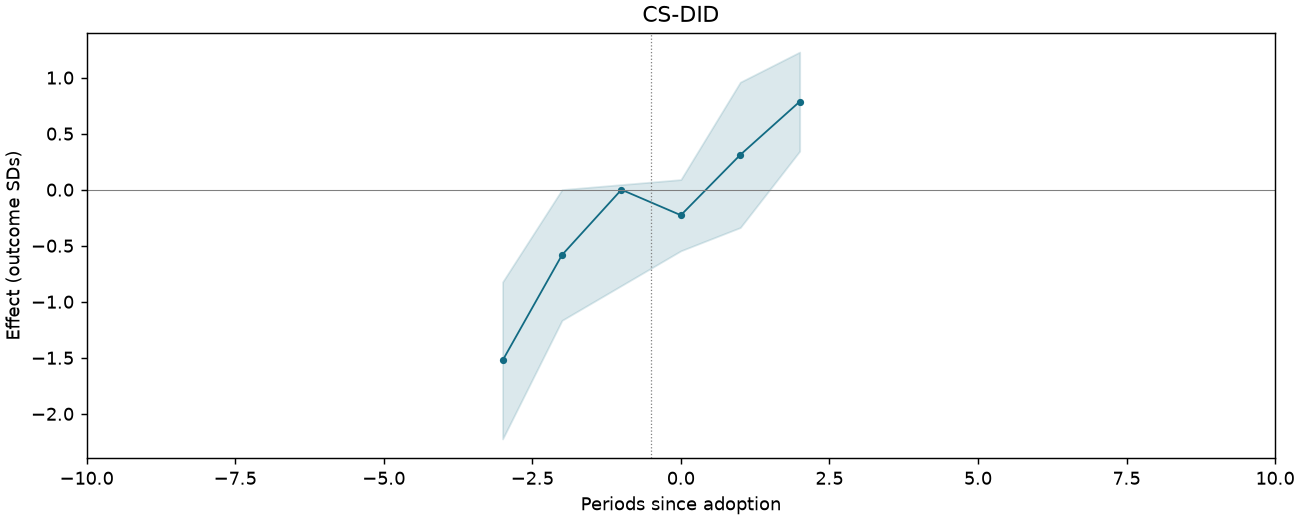
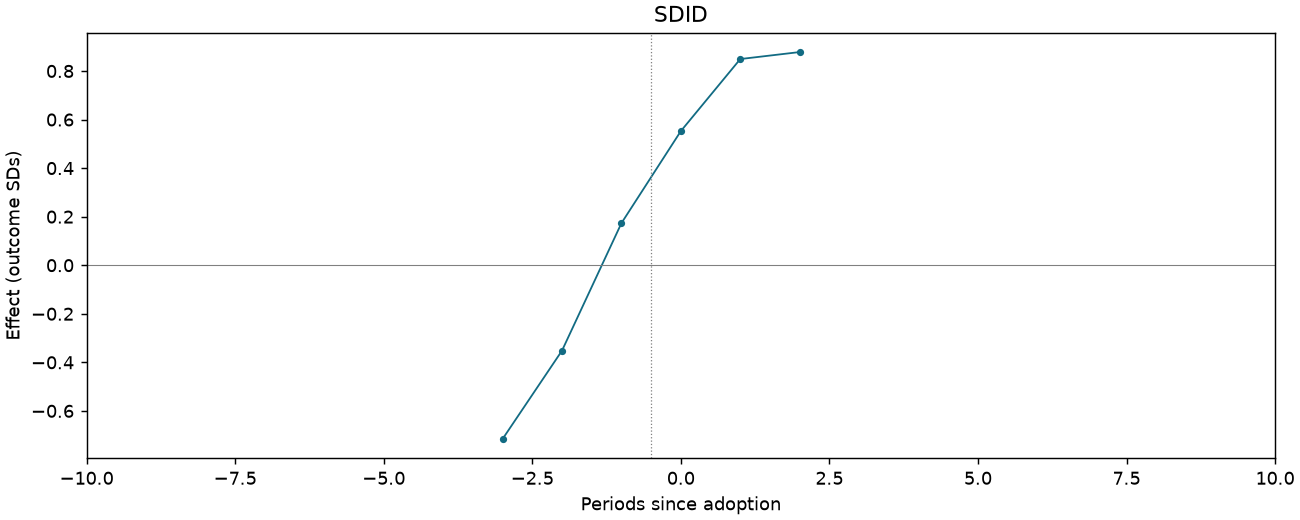
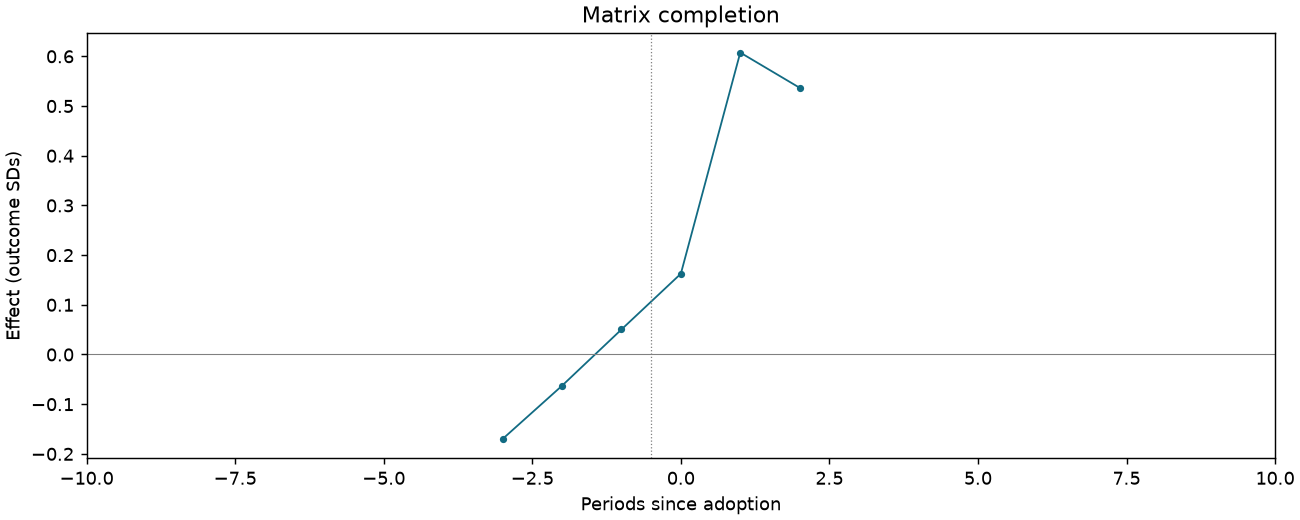
Identity: Chinese [humanities-track students only]
261 observations · 17 units · 17 clusters · 10 treated / 7 control units.
Estimate comparison
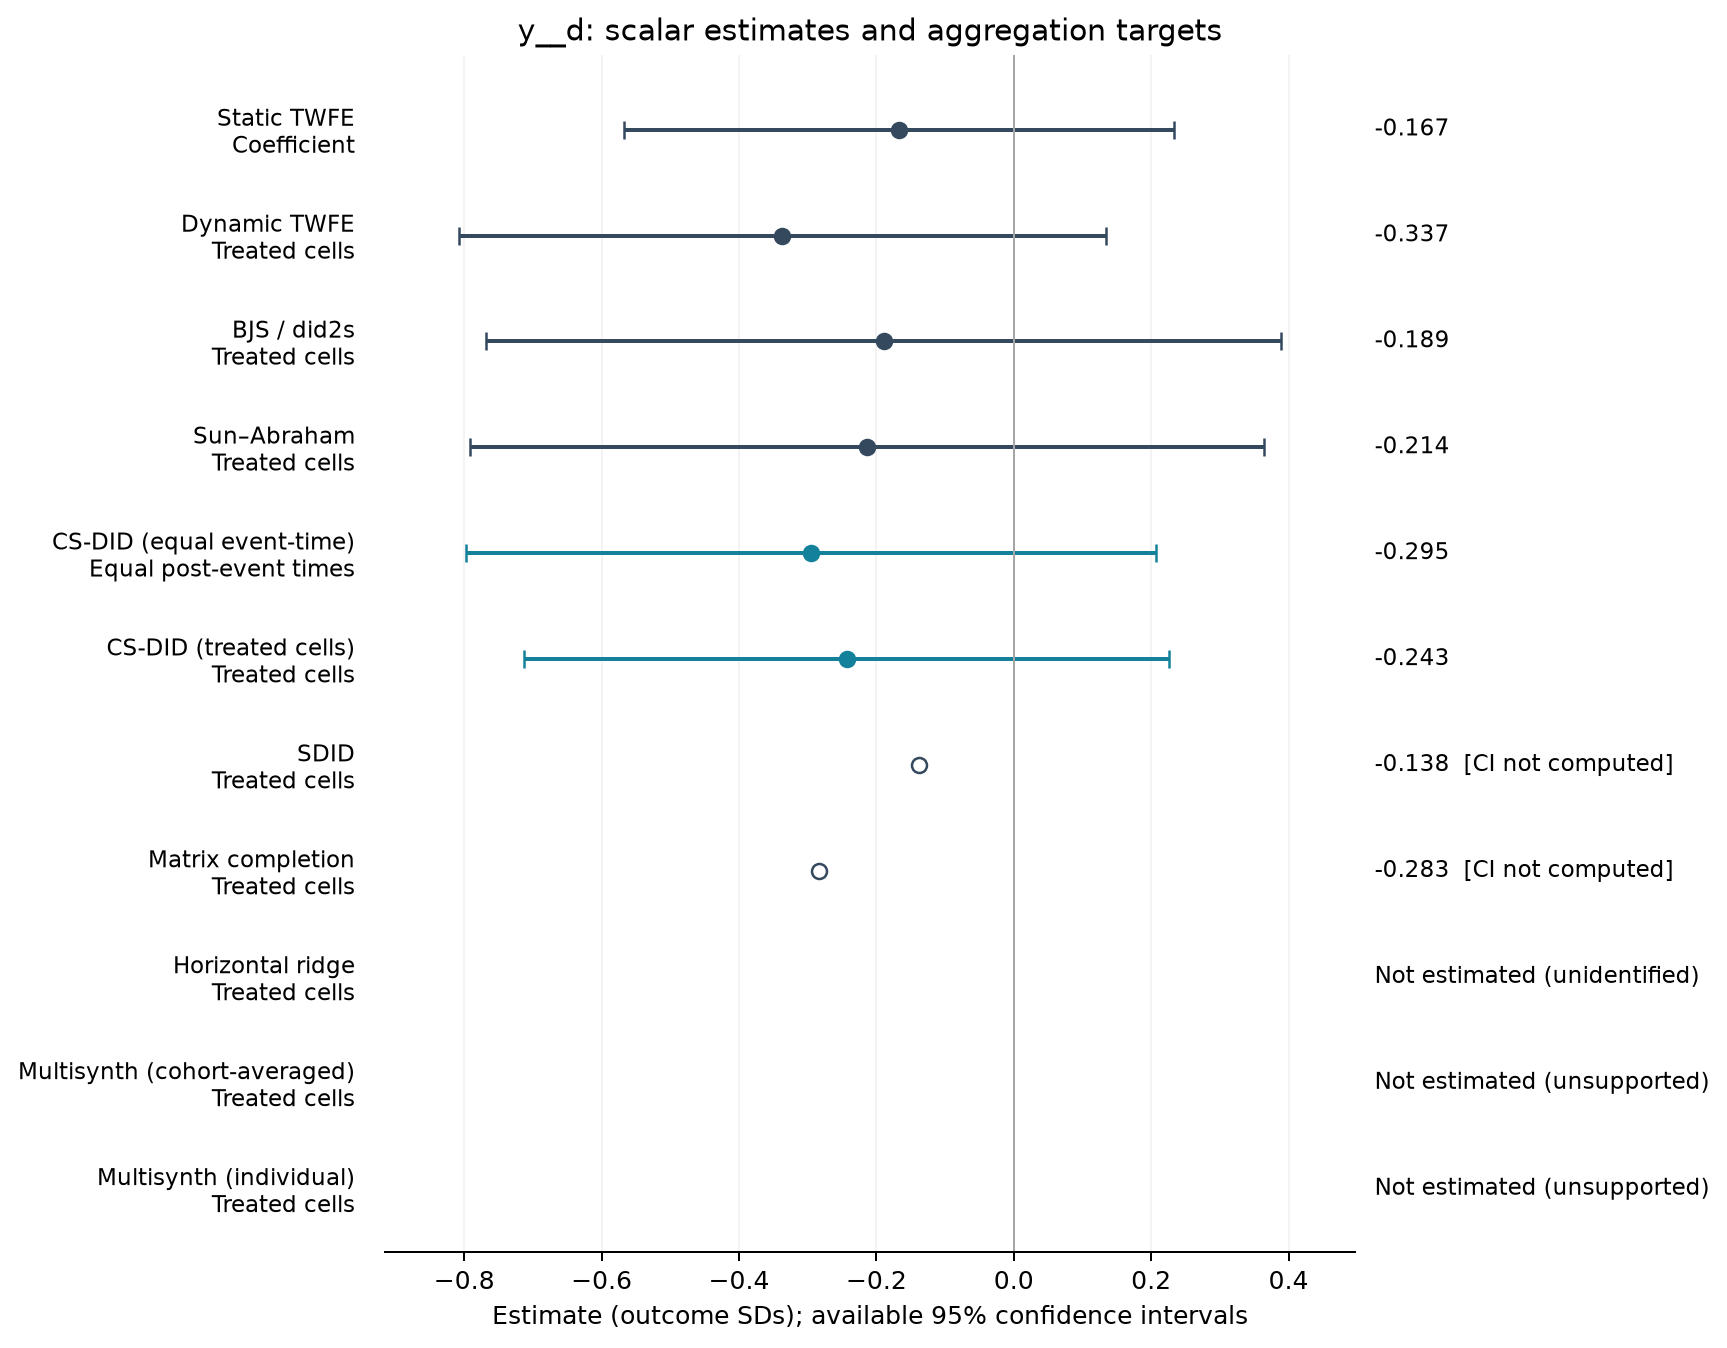
| Estimator | Estimate (SDs) | SE | 95% CI | Averaging |
|---|---|---|---|---|
| Static TWFE | -0.167 | 0.189 | [-0.567, 0.233] | Coefficient |
| Dynamic TWFE | -0.337 | 0.222 | [-0.808, 0.134] | Treated cells |
| BJS / did2s | -0.189 | 0.273 | [-0.768, 0.389] | Treated cells |
| Sun–Abraham | -0.214 | 0.272 | [-0.791, 0.364] | Treated cells |
| CS-DID (equal event-time) | -0.295 | 0.256 | [-0.797, 0.207] | Equal post-event times |
| CS-DID (treated cells) | -0.243 | 0.240 | [-0.713, 0.226] | Treated cells |
| SDID | -0.138 | — | — | Treated cells |
| Matrix completion | -0.283 | — | — | Treated cells |
Event studies
Periods −10 to +10; pointwise 95% intervals where available.
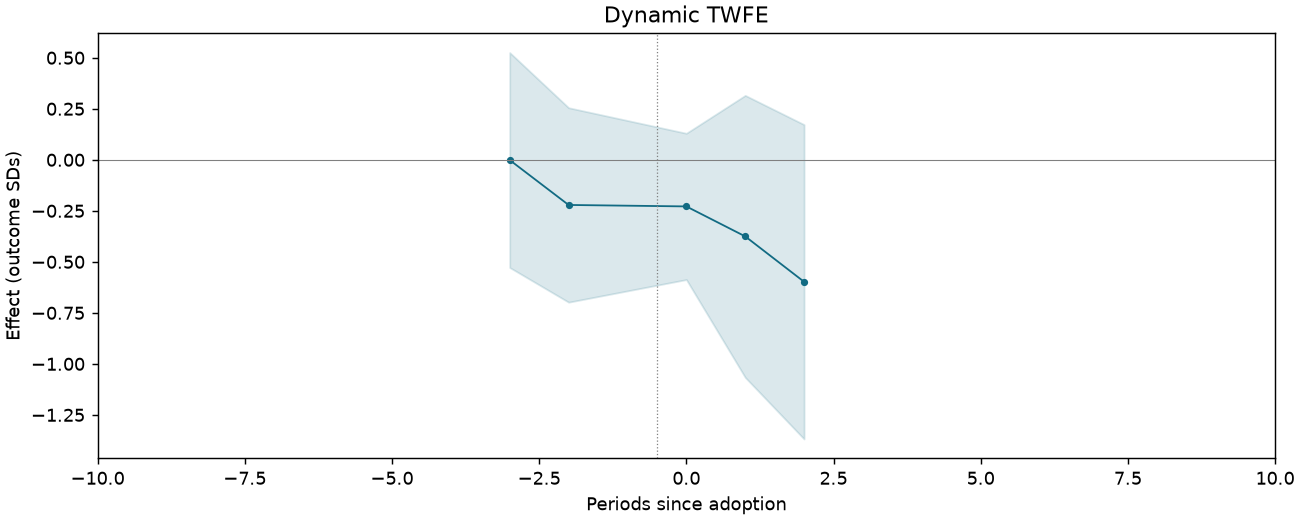
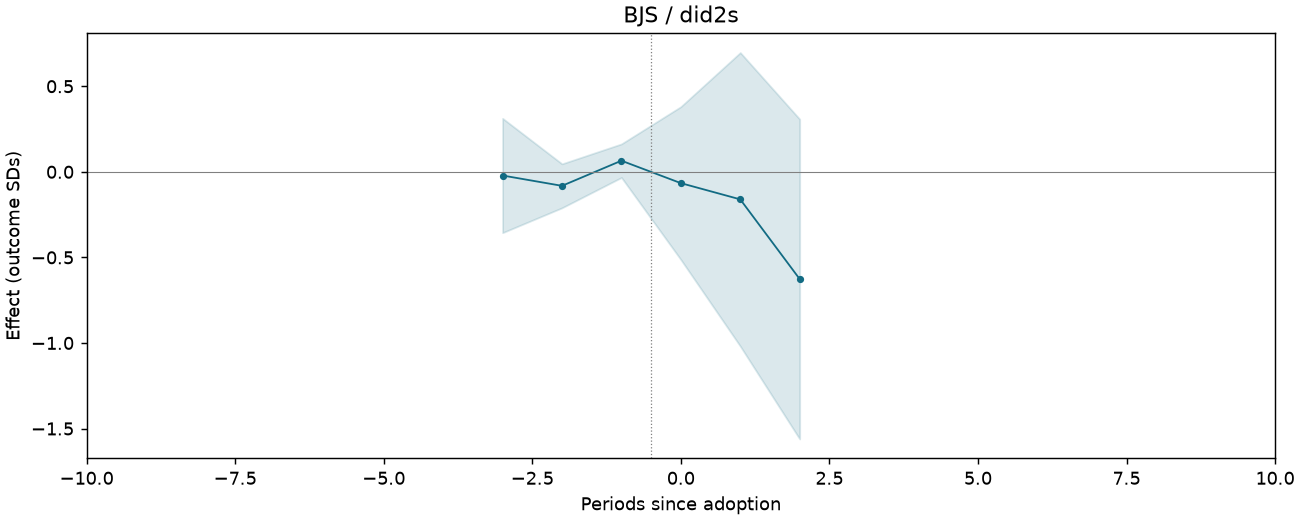
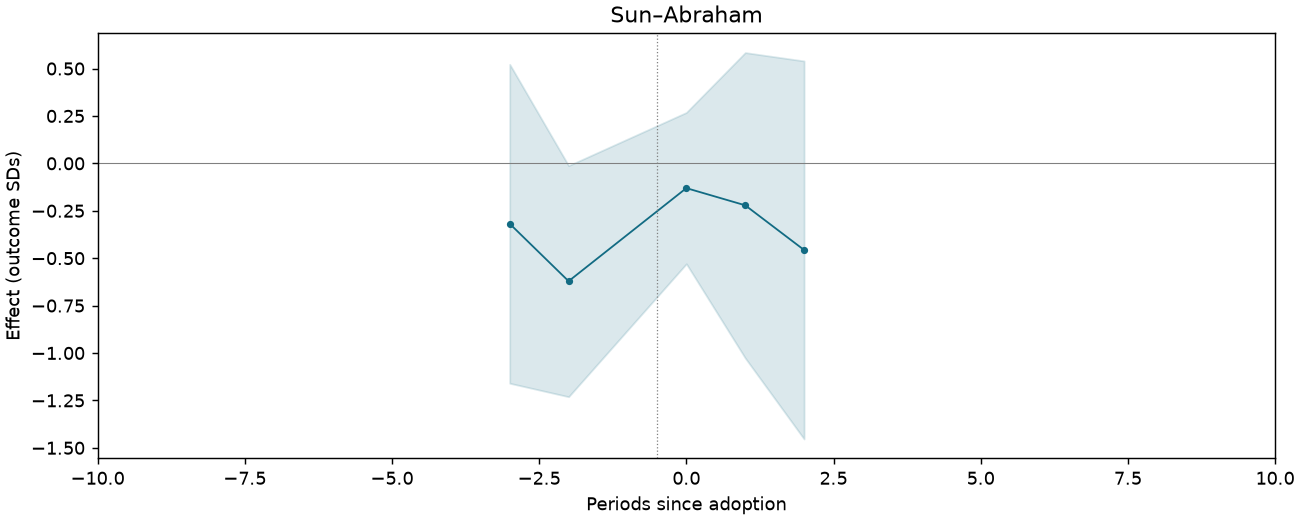
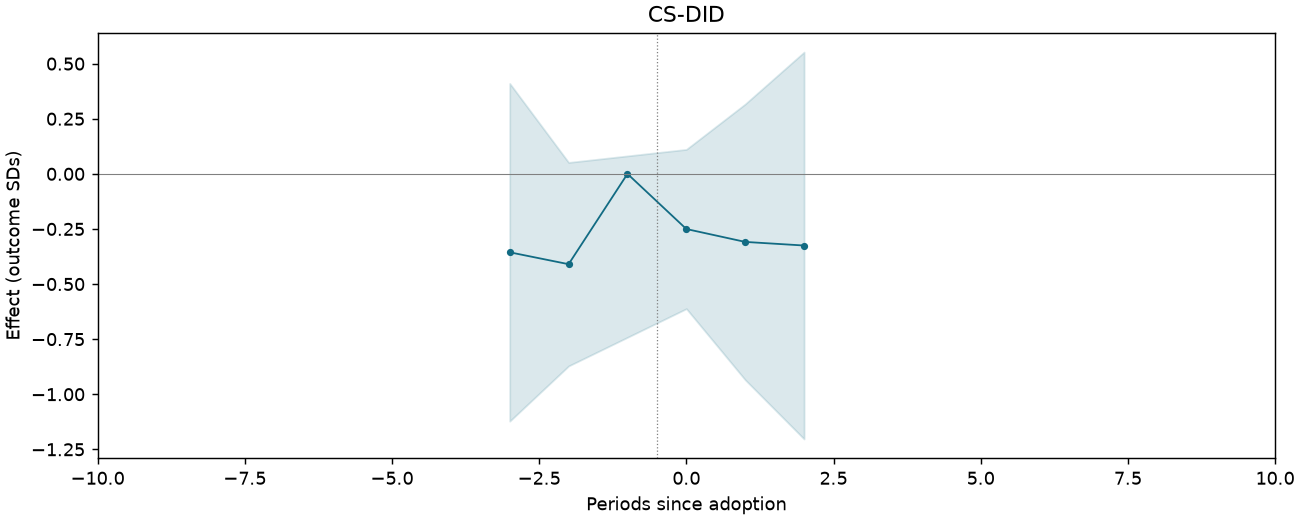
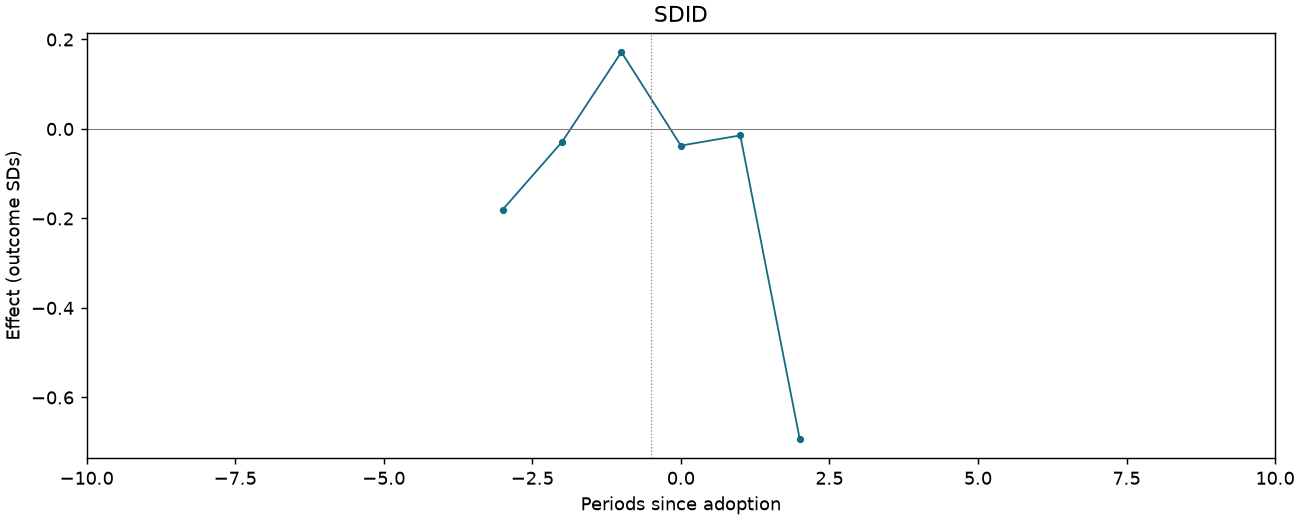
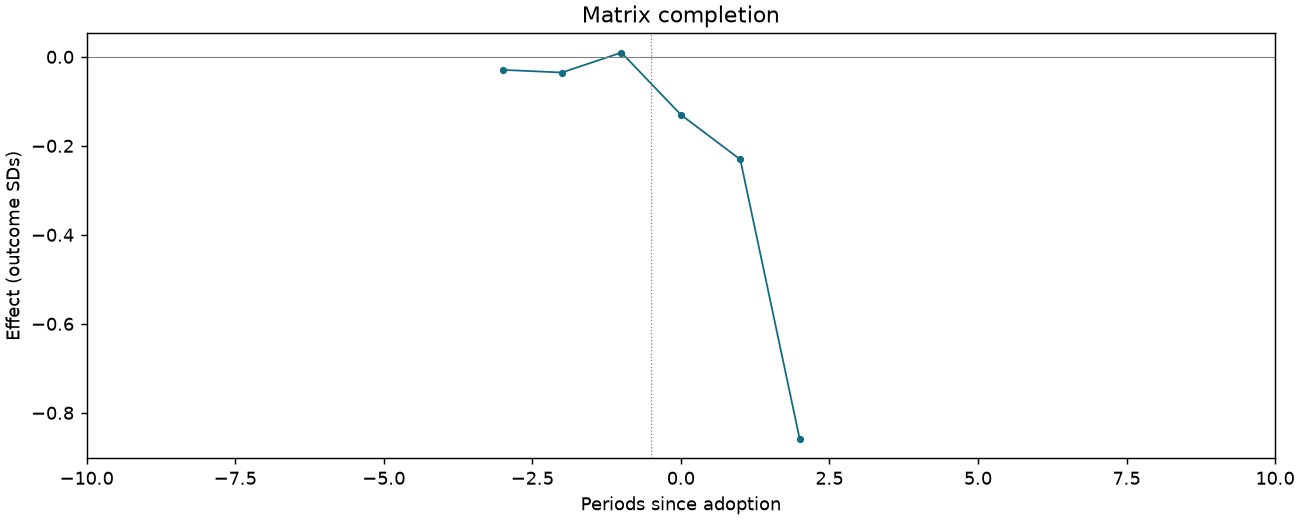
Attitudes about environment z-score index [humanities-track students only]
261 observations · 17 units · 17 clusters · 10 treated / 7 control units.
Estimate comparison
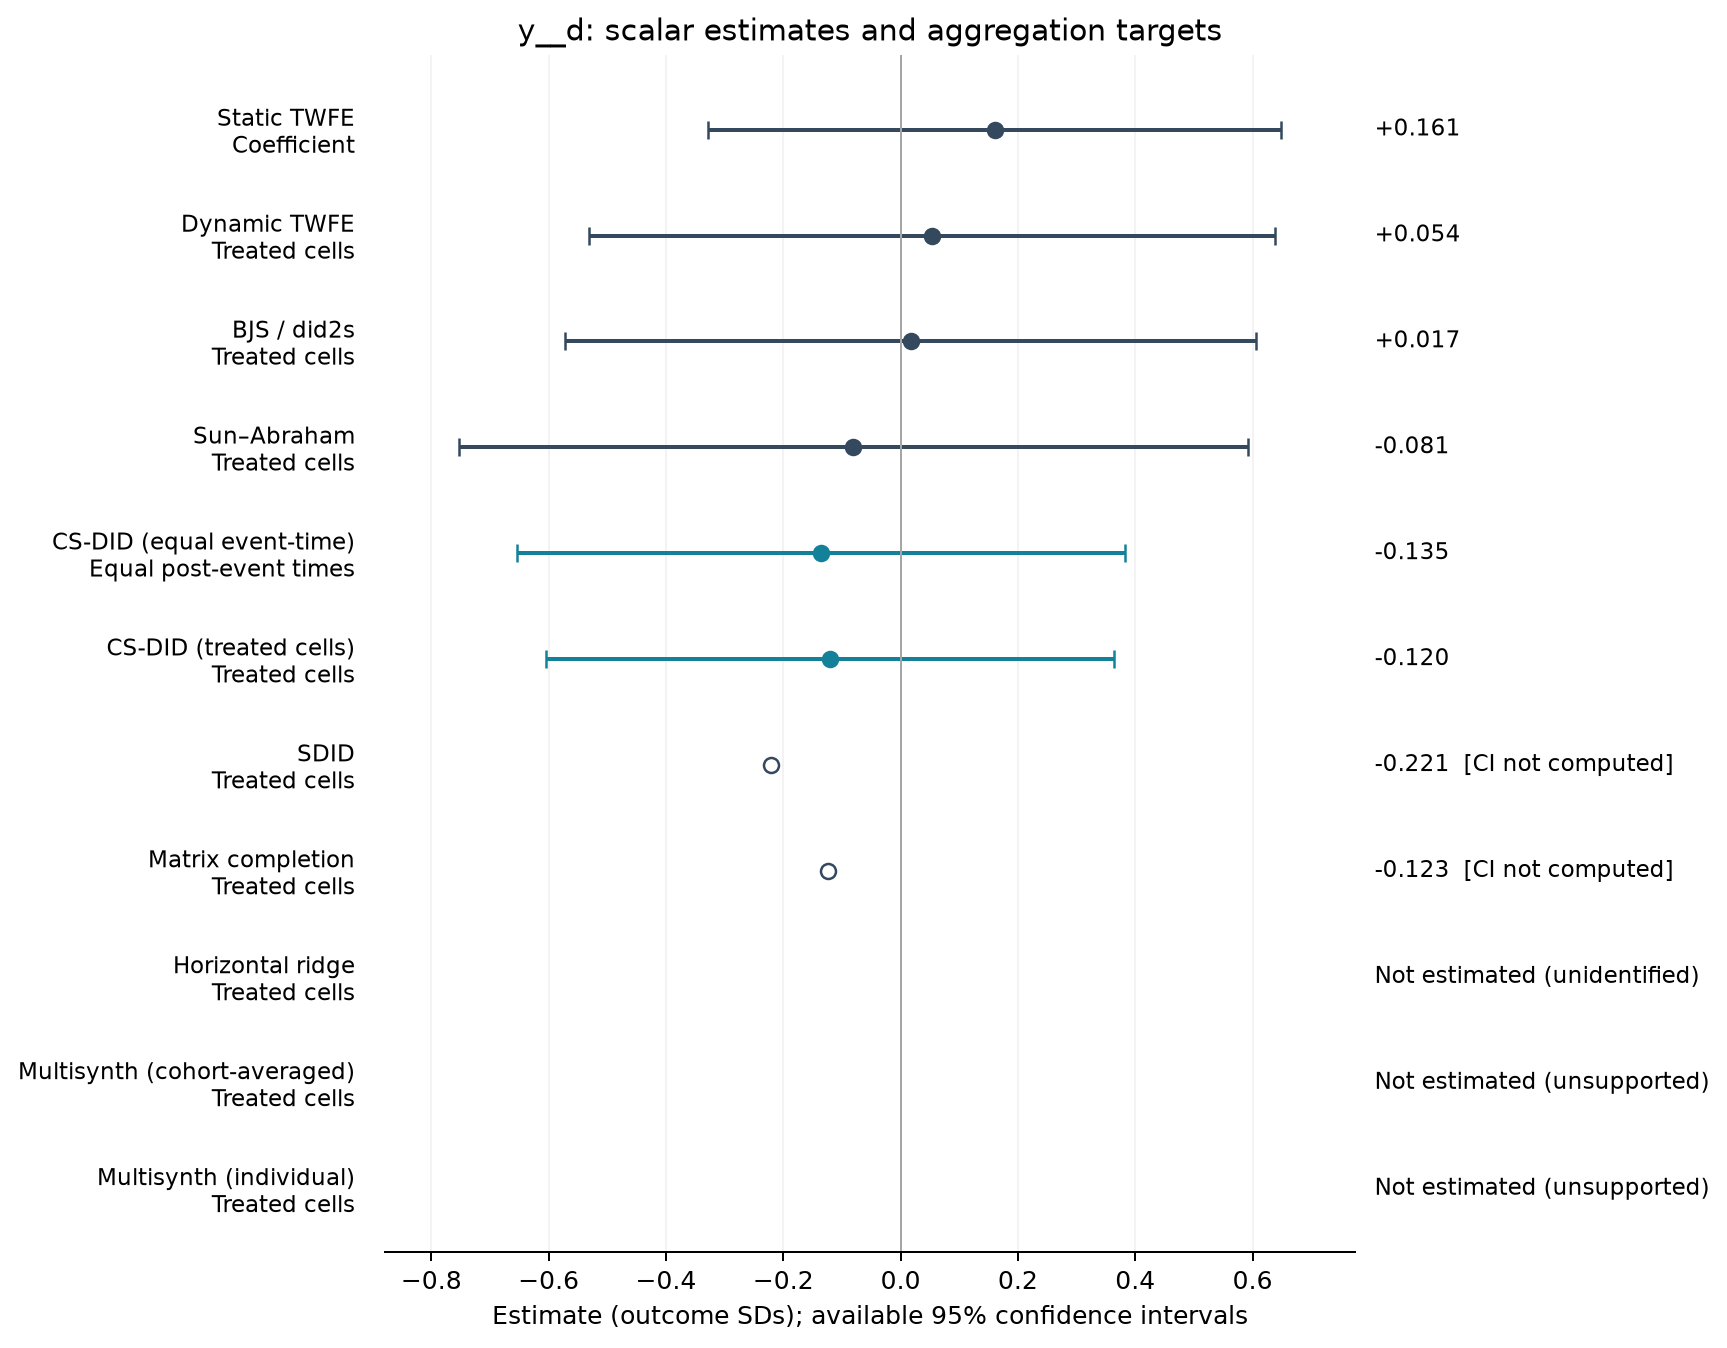
| Estimator | Estimate (SDs) | SE | 95% CI | Averaging |
|---|---|---|---|---|
| Static TWFE | 0.161 | 0.230 | [-0.327, 0.649] | Coefficient |
| Dynamic TWFE | 0.054 | 0.276 | [-0.531, 0.638] | Treated cells |
| BJS / did2s | 0.017 | 0.278 | [-0.572, 0.606] | Treated cells |
| Sun–Abraham | -0.081 | 0.317 | [-0.753, 0.592] | Treated cells |
| CS-DID (equal event-time) | -0.135 | 0.264 | [-0.653, 0.383] | Equal post-event times |
| CS-DID (treated cells) | -0.120 | 0.247 | [-0.604, 0.364] | Treated cells |
| SDID | -0.221 | — | — | Treated cells |
| Matrix completion | -0.123 | — | — | Treated cells |
Event studies
Periods −10 to +10; pointwise 95% intervals where available.
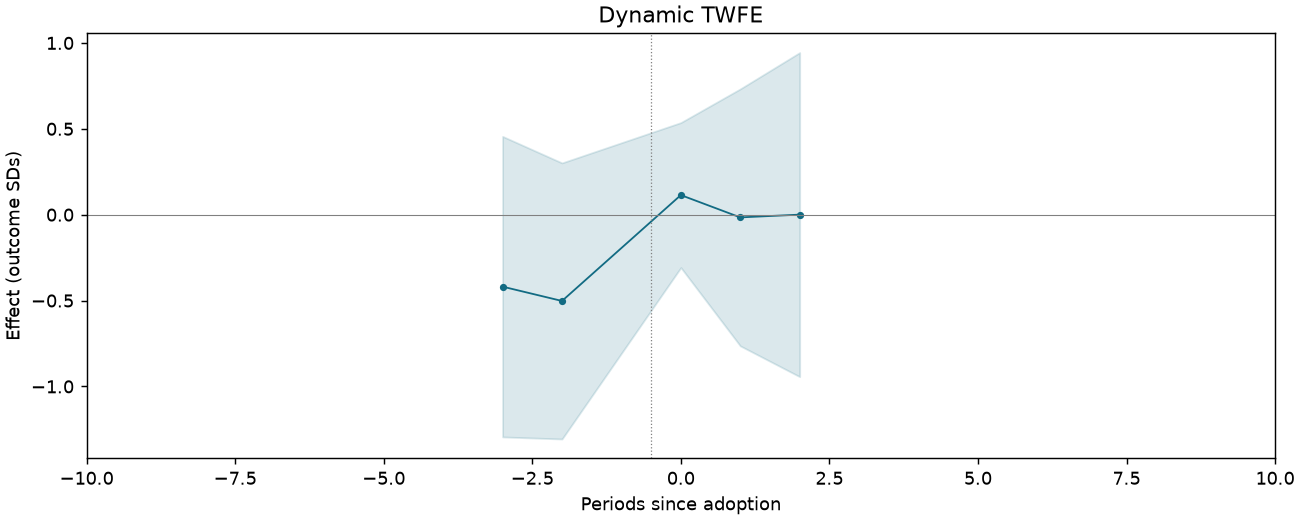
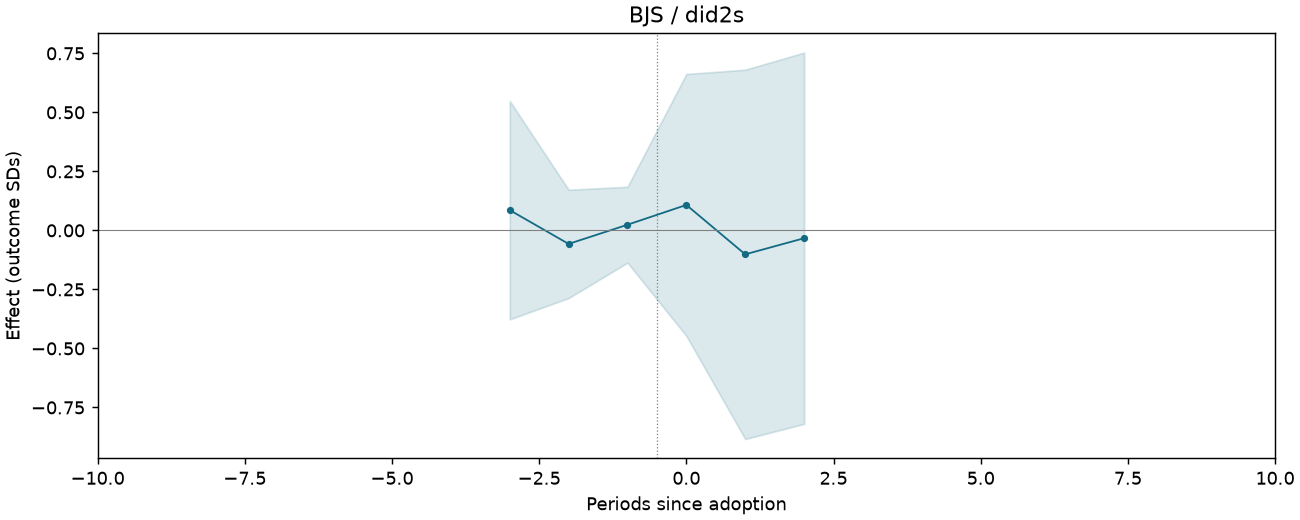
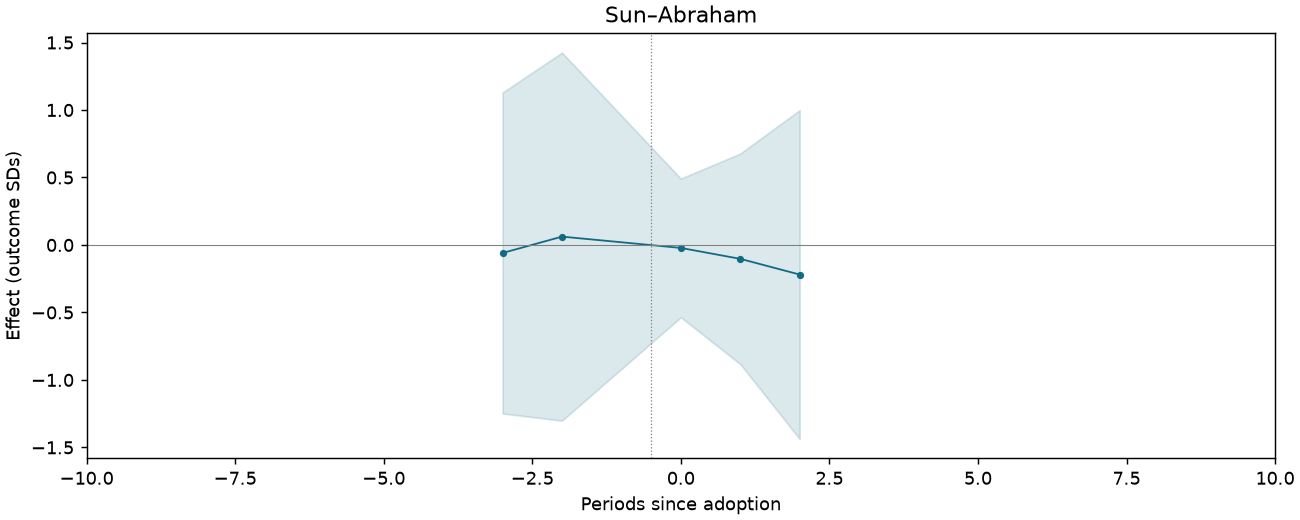
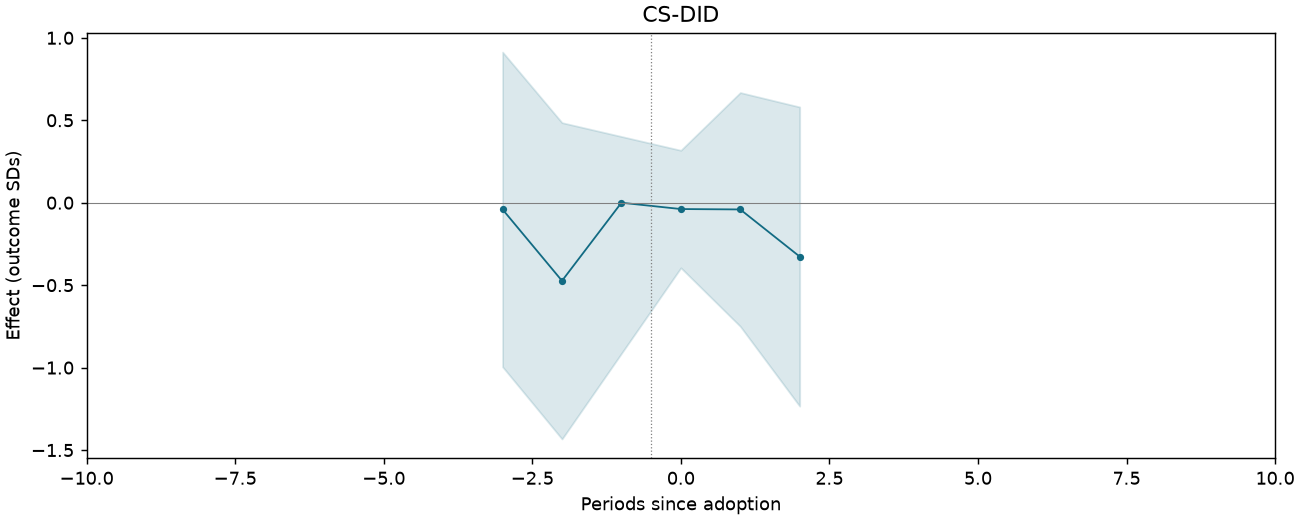
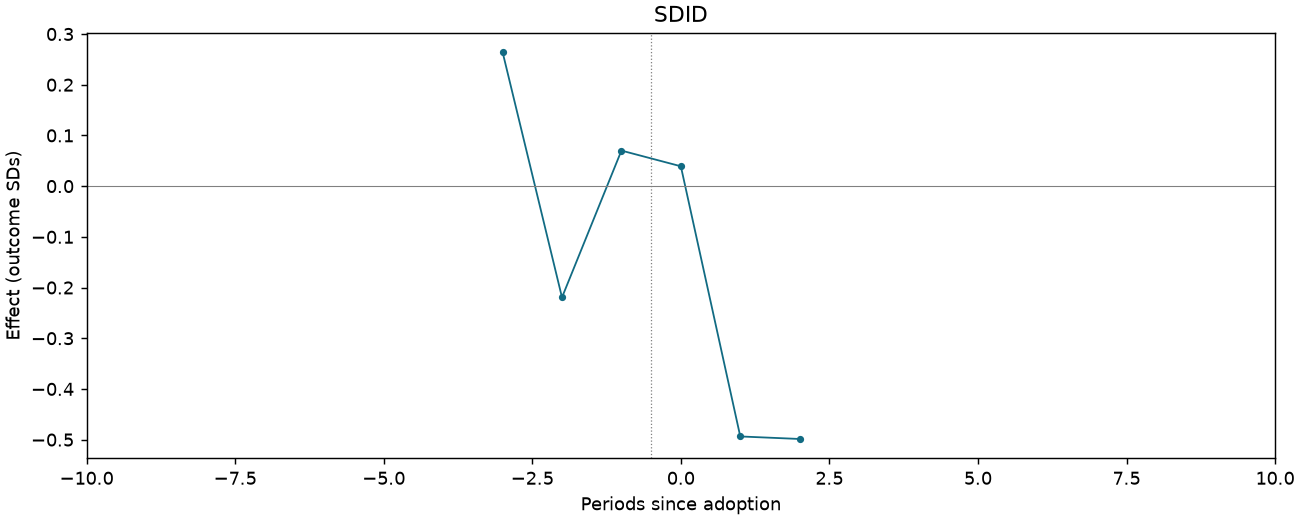
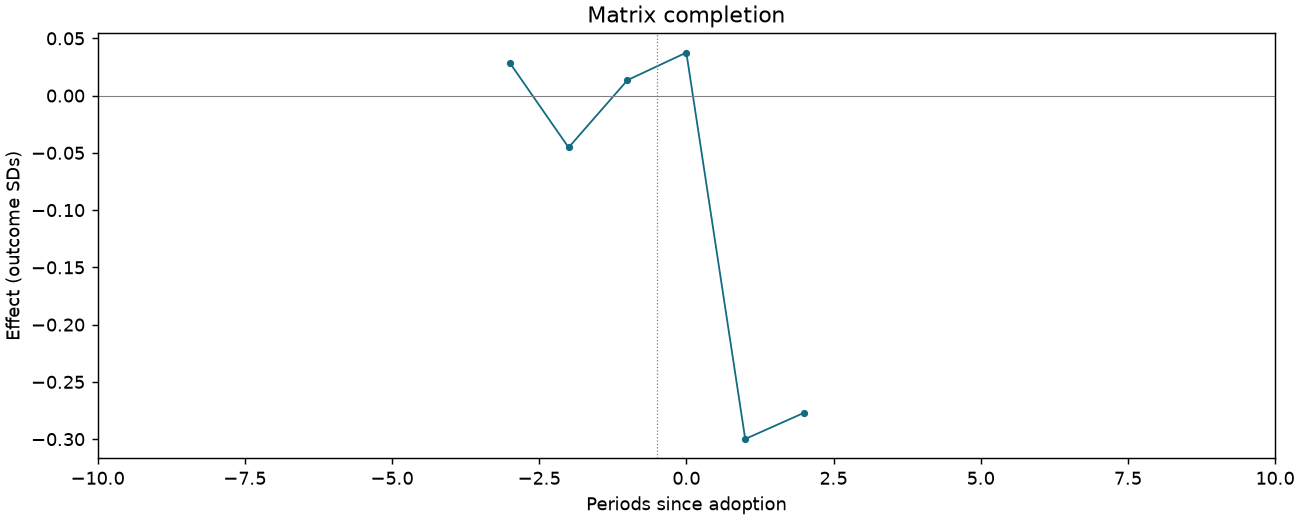
Political behavior z-score index [humanities-track students only]
261 observations · 17 units · 17 clusters · 10 treated / 7 control units.
Estimate comparison
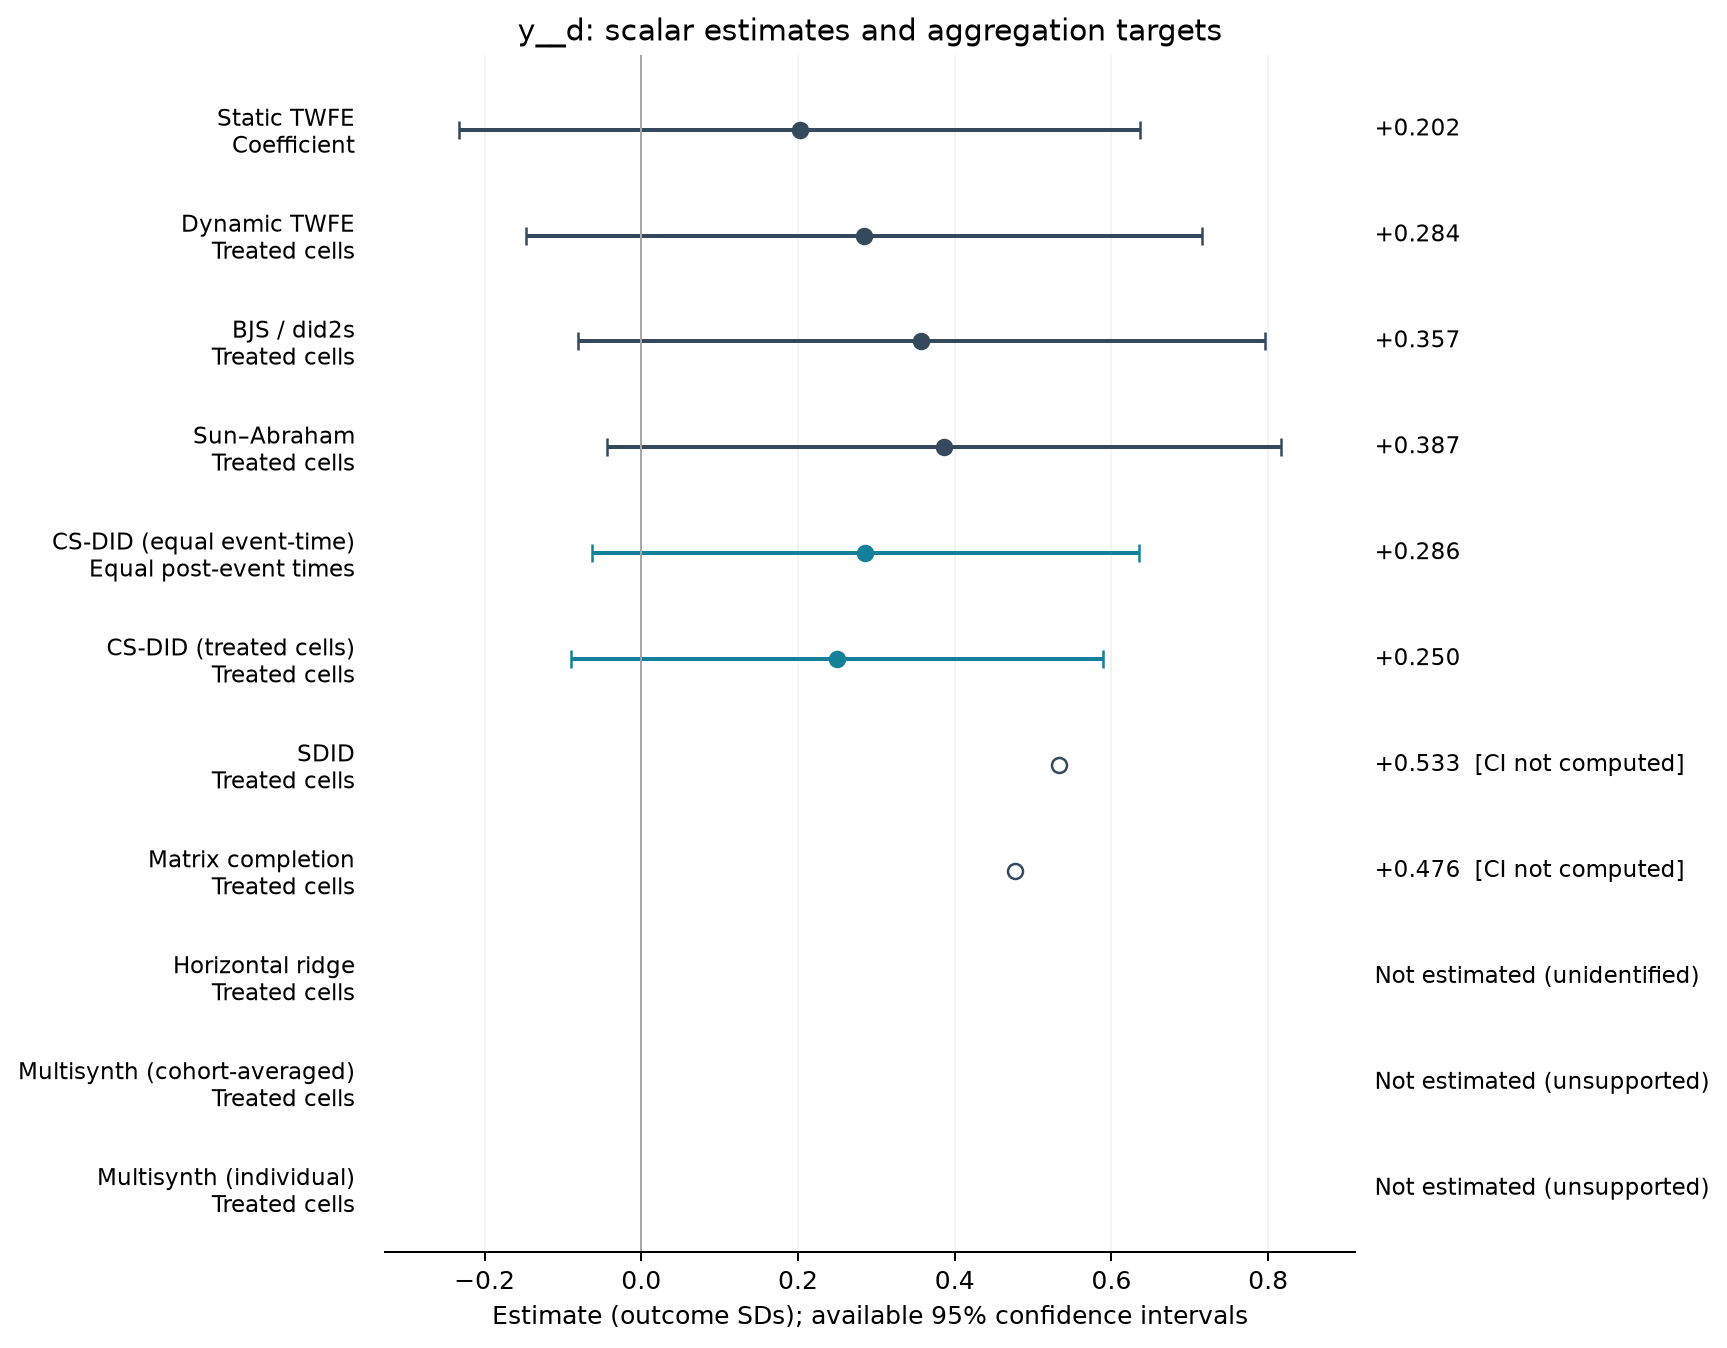
| Estimator | Estimate (SDs) | SE | 95% CI | Averaging |
|---|---|---|---|---|
| Static TWFE | 0.202 | 0.205 | [-0.233, 0.637] | Coefficient |
| Dynamic TWFE | 0.284 | 0.203 | [-0.147, 0.716] | Treated cells |
| BJS / did2s | 0.357 | 0.207 | [-0.081, 0.796] | Treated cells |
| Sun–Abraham | 0.387 | 0.203 | [-0.043, 0.817] | Treated cells |
| CS-DID (equal event-time) | 0.286 | 0.178 | [-0.063, 0.635] | Equal post-event times |
| CS-DID (treated cells) | 0.250 | 0.173 | [-0.090, 0.589] | Treated cells |
| SDID | 0.533 | — | — | Treated cells |
| Matrix completion | 0.476 | — | — | Treated cells |
Event studies
Periods −10 to +10; pointwise 95% intervals where available.
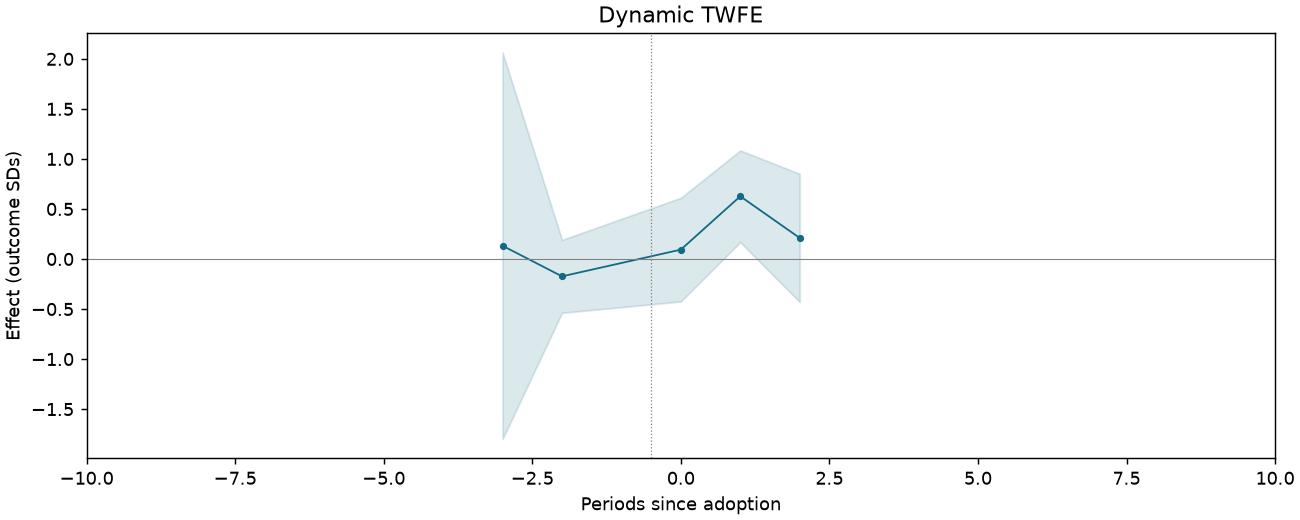
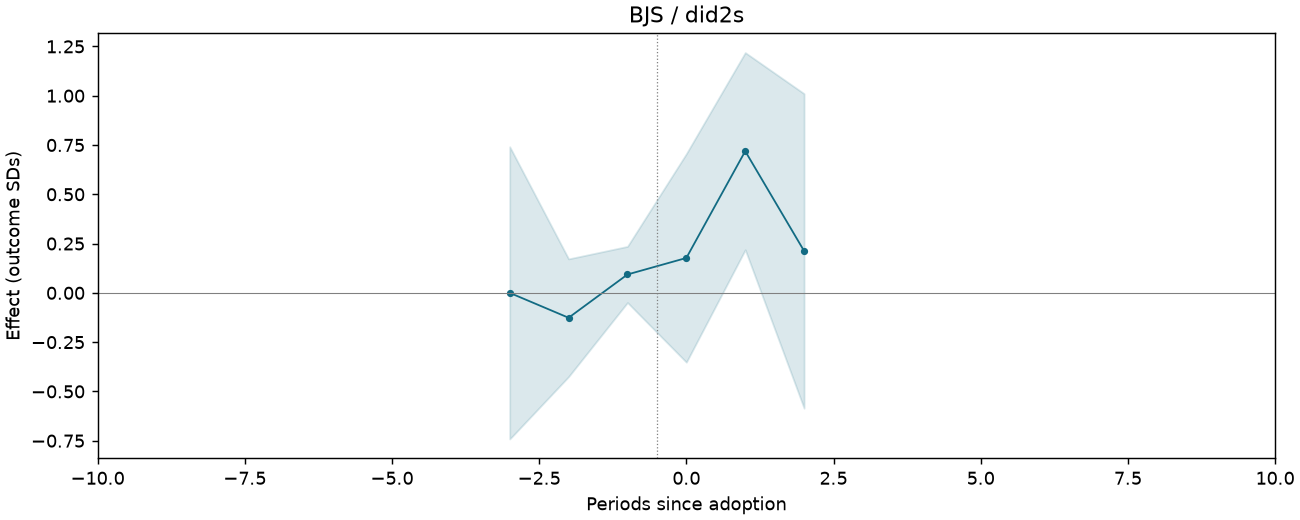
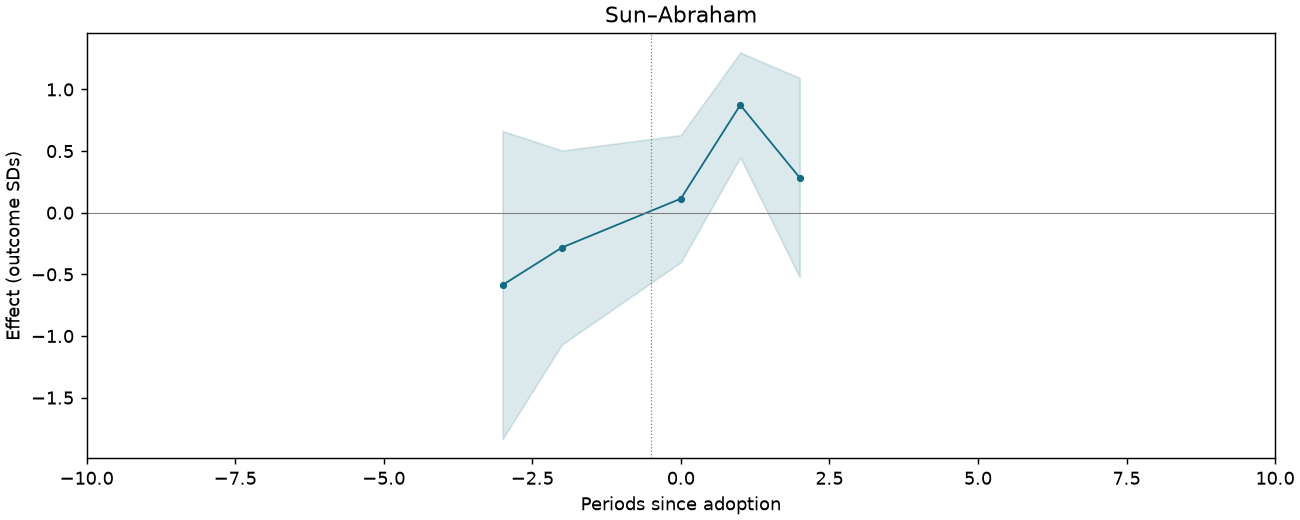
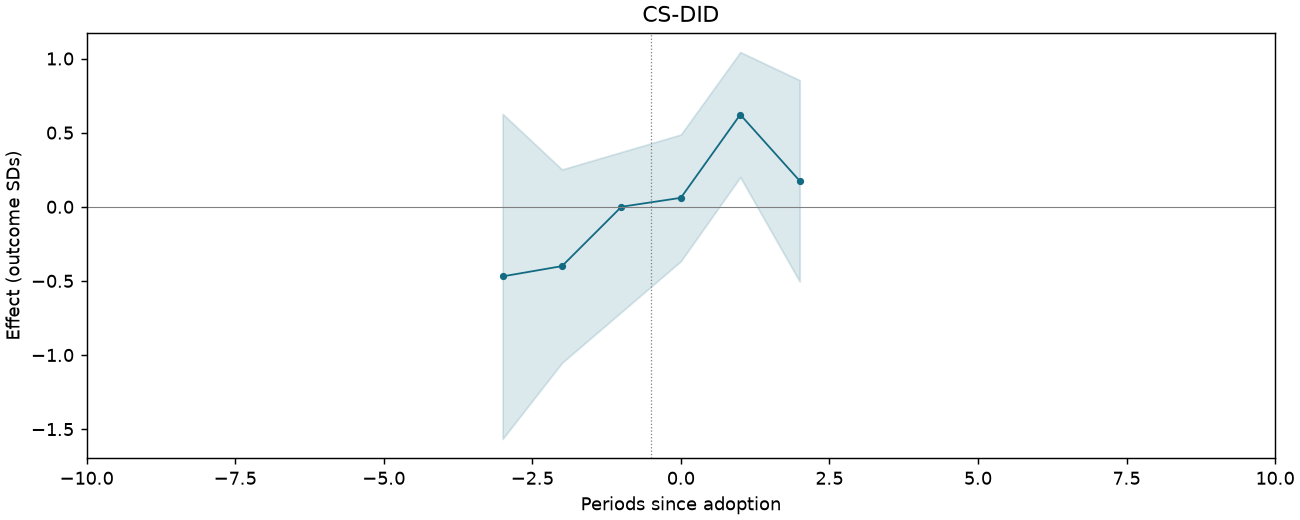
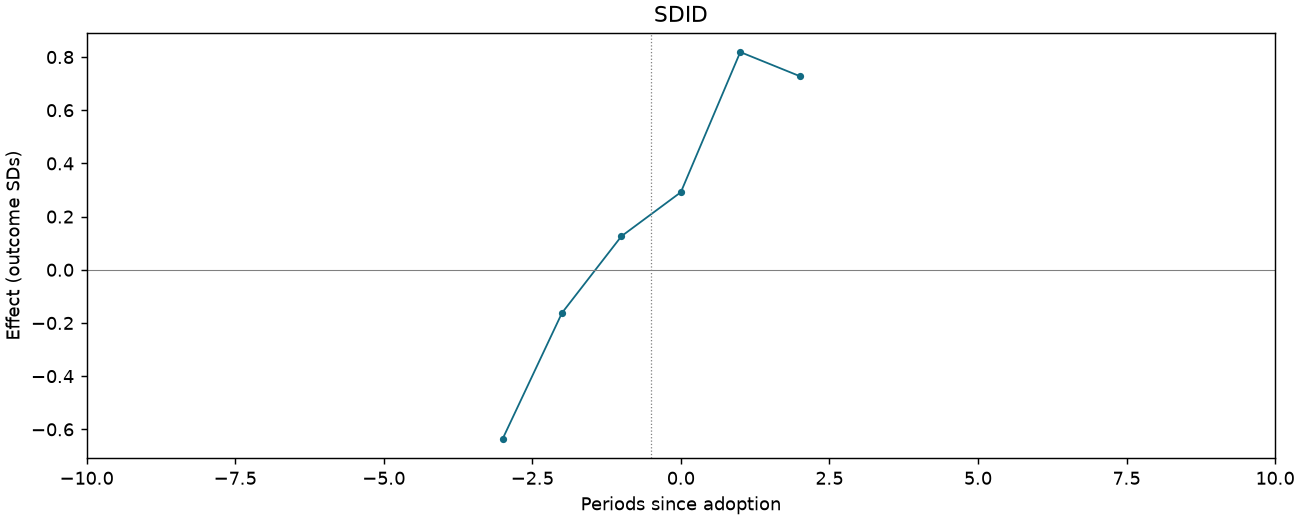
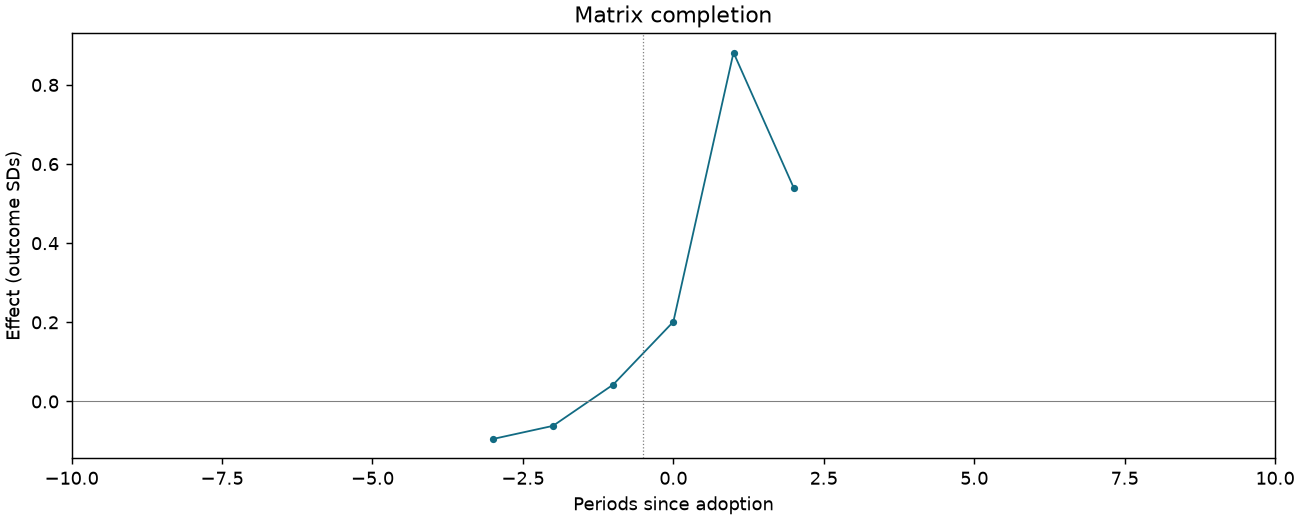
Avoiding risky investment z-score index [humanities-track students only]
261 observations · 17 units · 17 clusters · 10 treated / 7 control units.
Estimate comparison
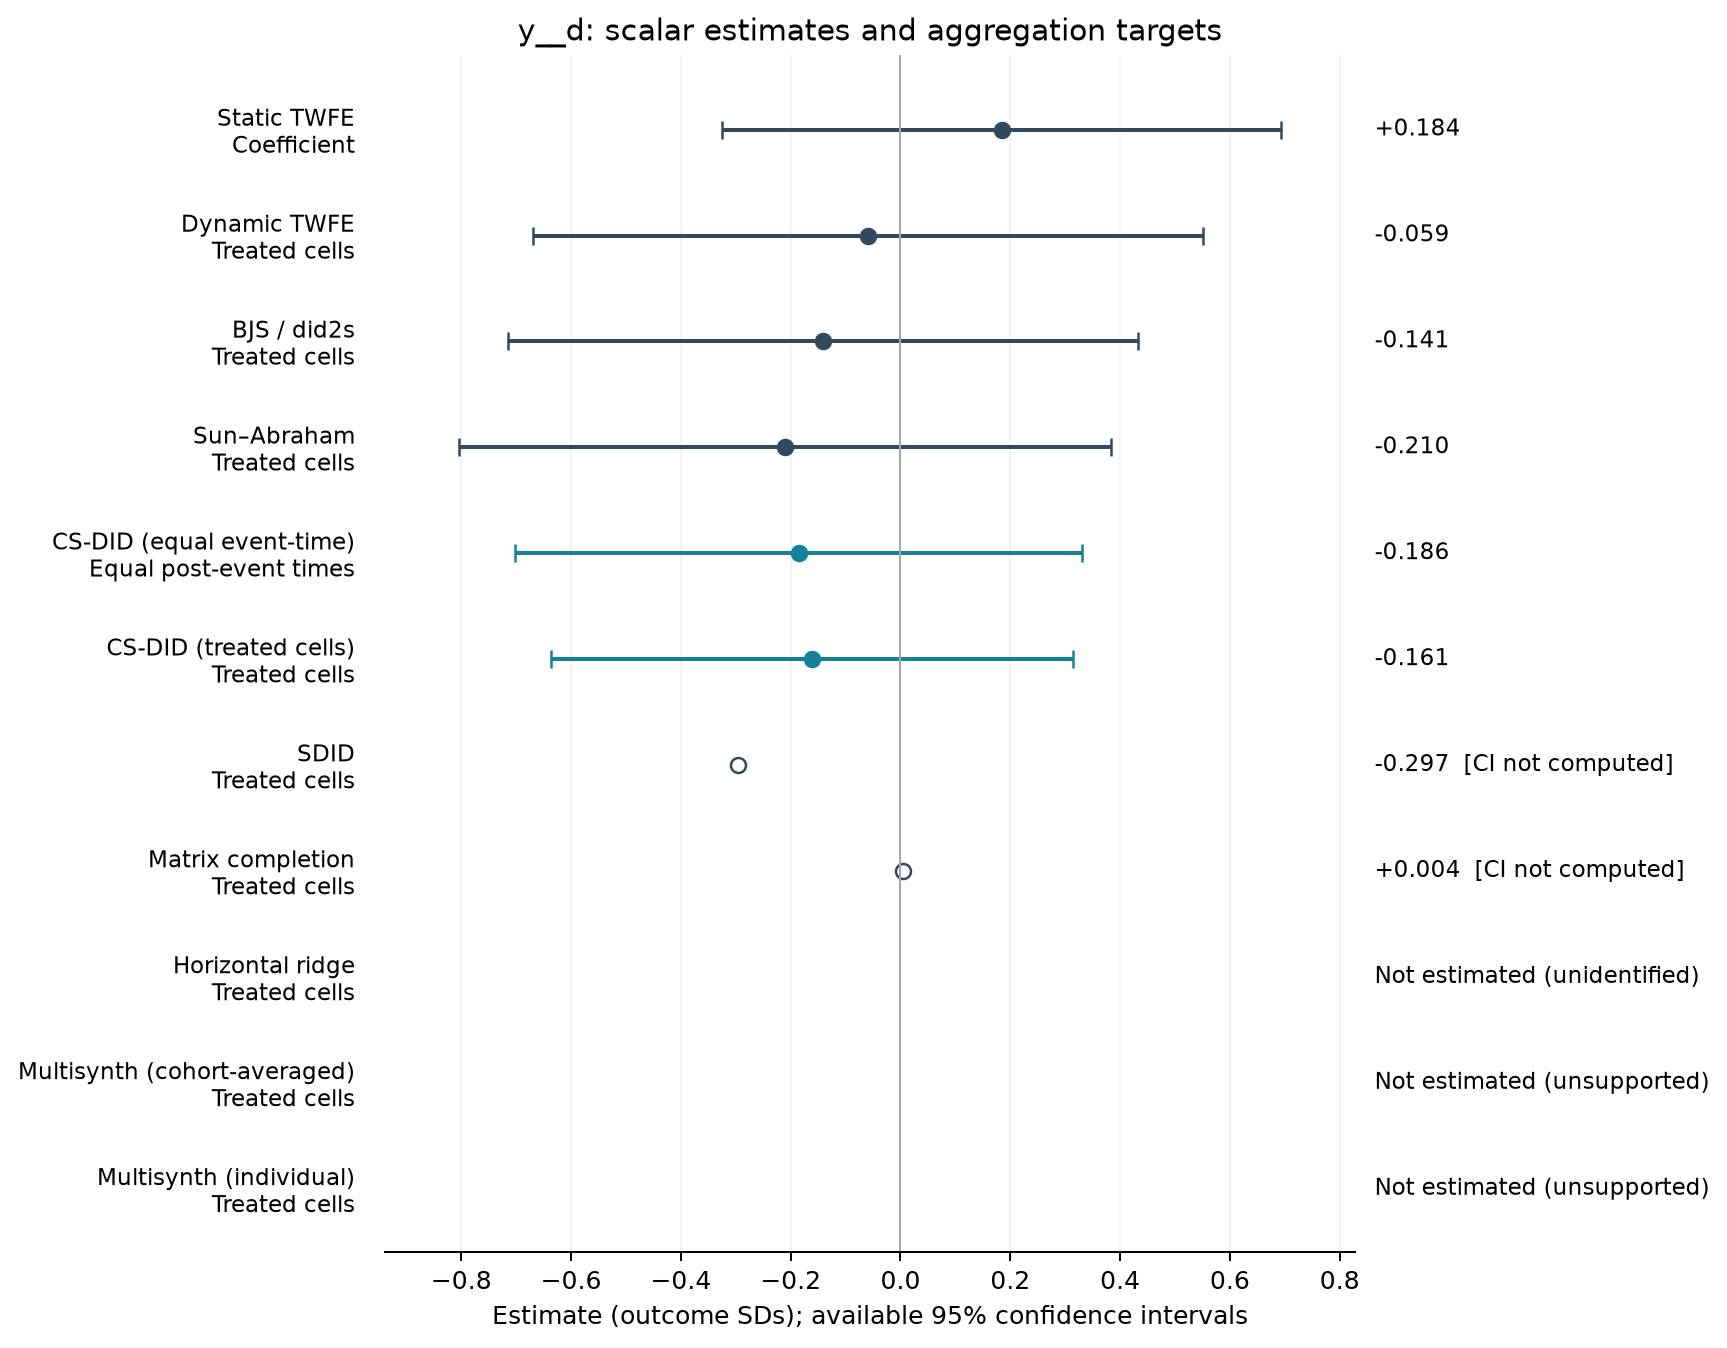
| Estimator | Estimate (SDs) | SE | 95% CI | Averaging |
|---|---|---|---|---|
| Static TWFE | 0.184 | 0.240 | [-0.325, 0.693] | Coefficient |
| Dynamic TWFE | -0.059 | 0.288 | [-0.670, 0.551] | Treated cells |
| BJS / did2s | -0.141 | 0.271 | [-0.715, 0.433] | Treated cells |
| Sun–Abraham | -0.210 | 0.280 | [-0.804, 0.383] | Treated cells |
| CS-DID (equal event-time) | -0.186 | 0.264 | [-0.703, 0.331] | Equal post-event times |
| CS-DID (treated cells) | -0.161 | 0.242 | [-0.636, 0.314] | Treated cells |
| SDID | -0.297 | — | — | Treated cells |
| Matrix completion | 0.004 | — | — | Treated cells |
Event studies
Periods −10 to +10; pointwise 95% intervals where available.
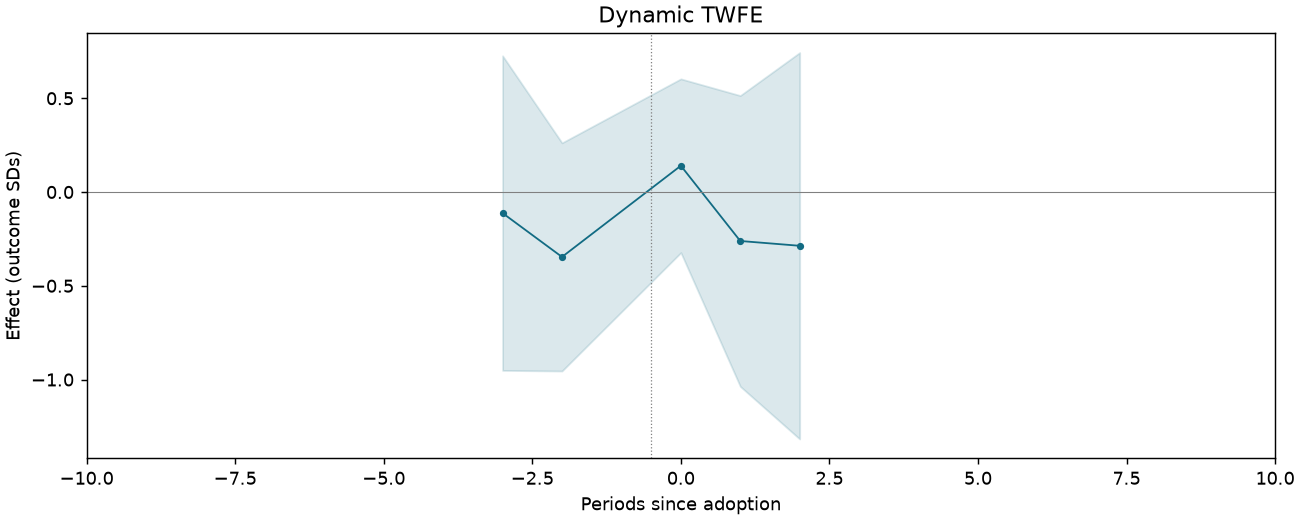
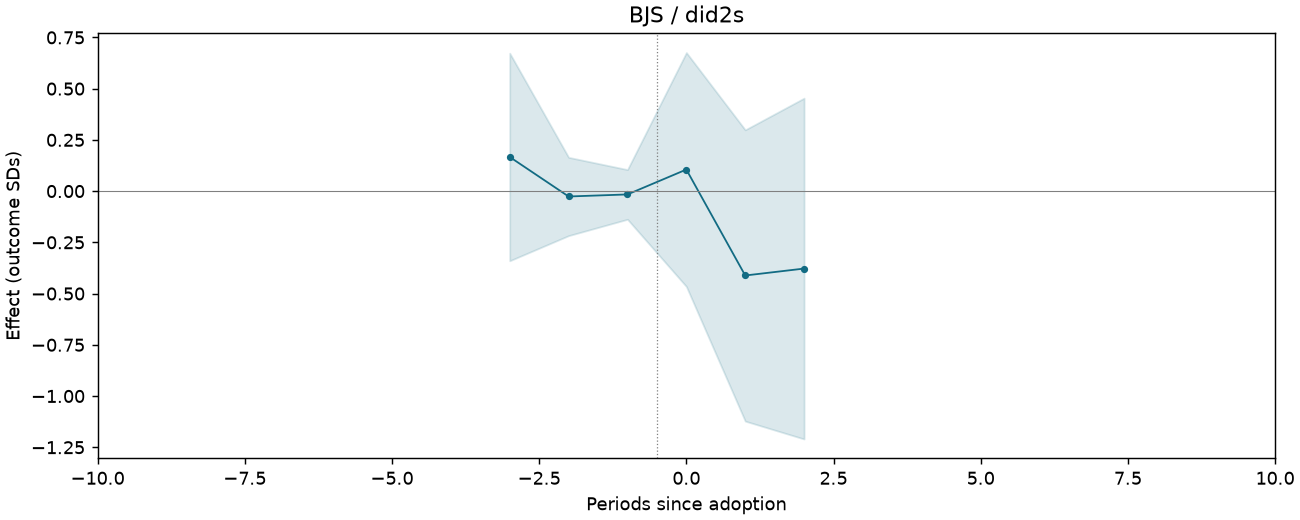
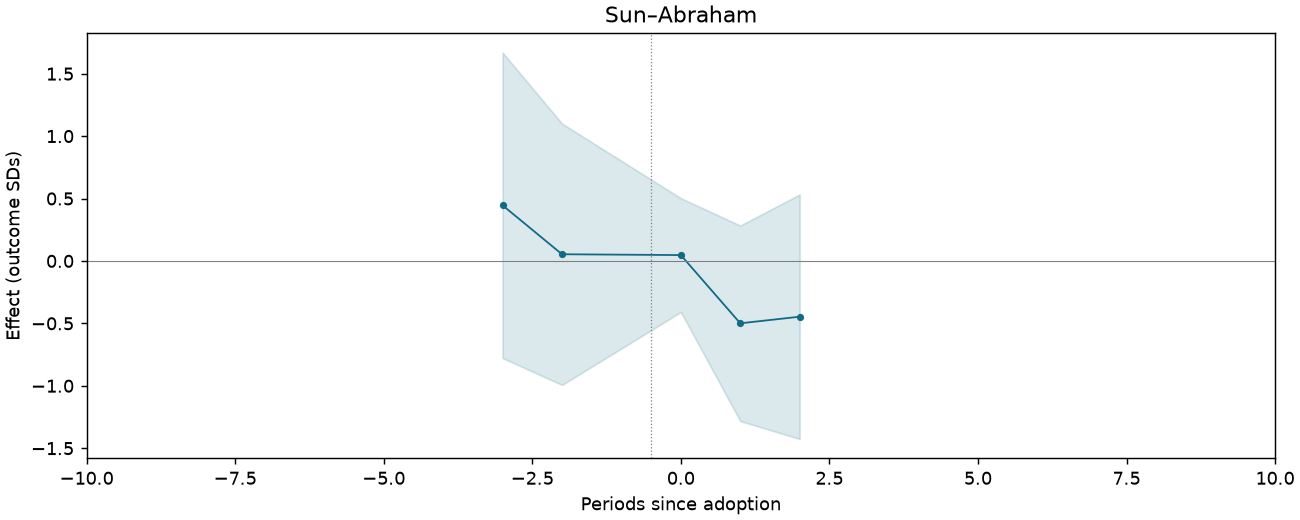
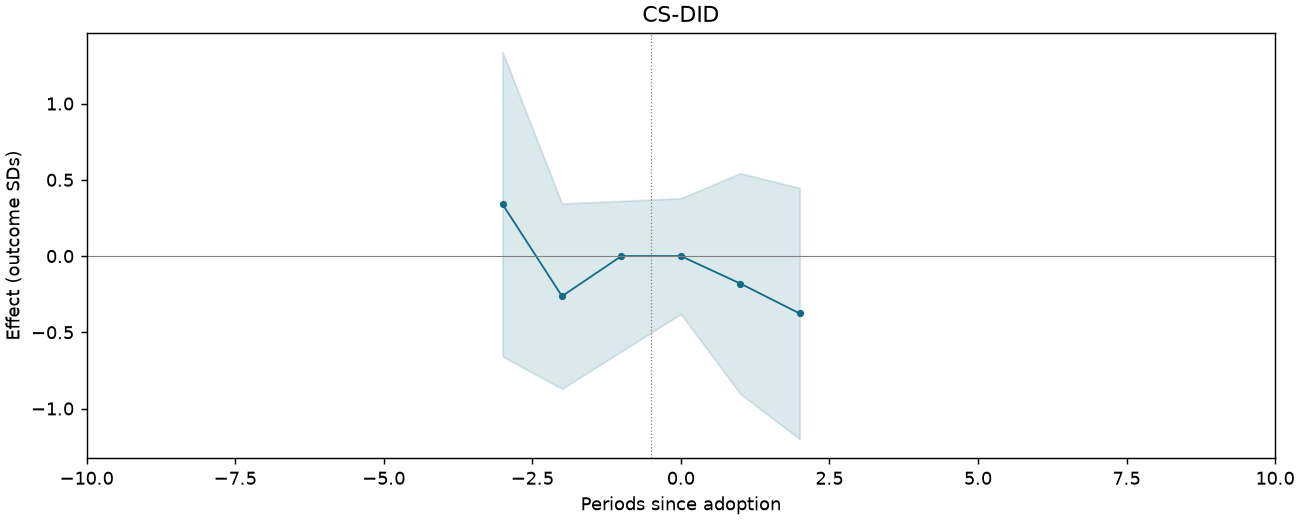
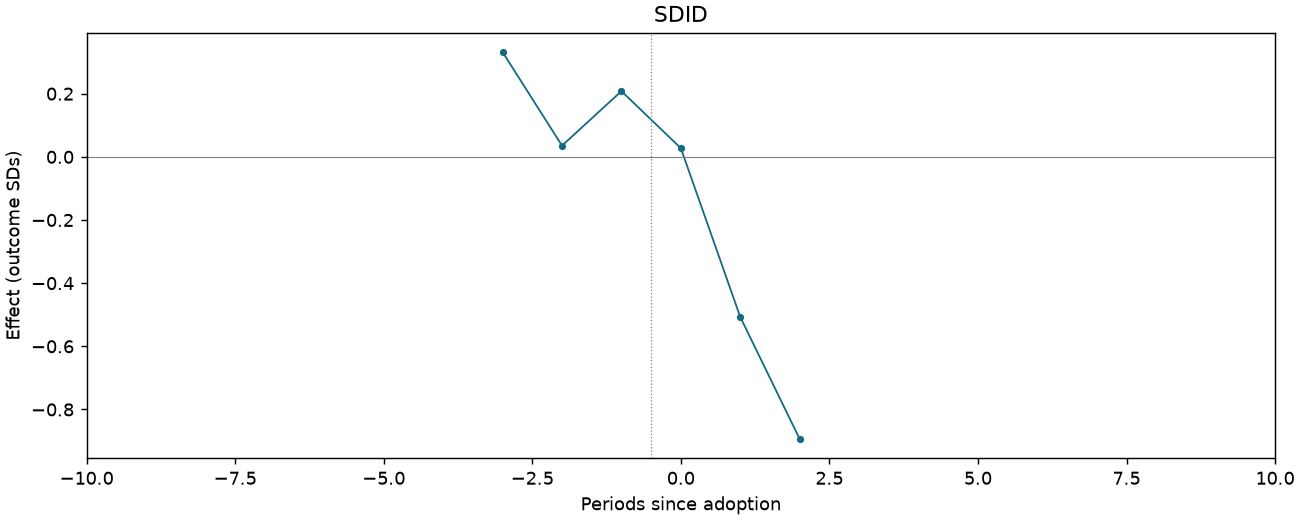
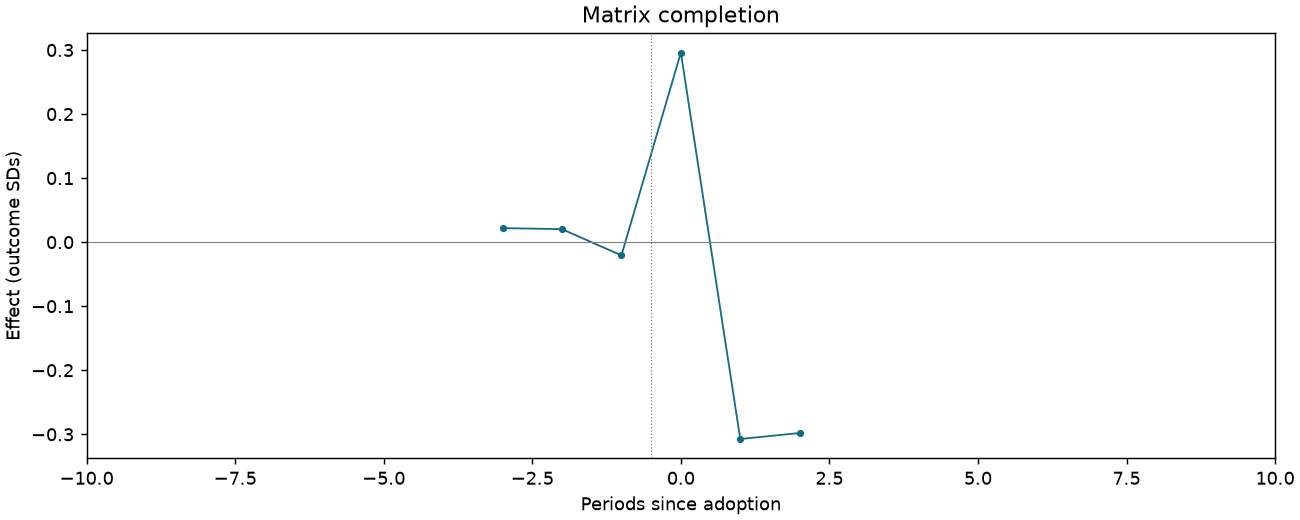
Cooperated with minority [humanities-track students only]
261 observations · 17 units · 17 clusters · 10 treated / 7 control units.
Estimate comparison
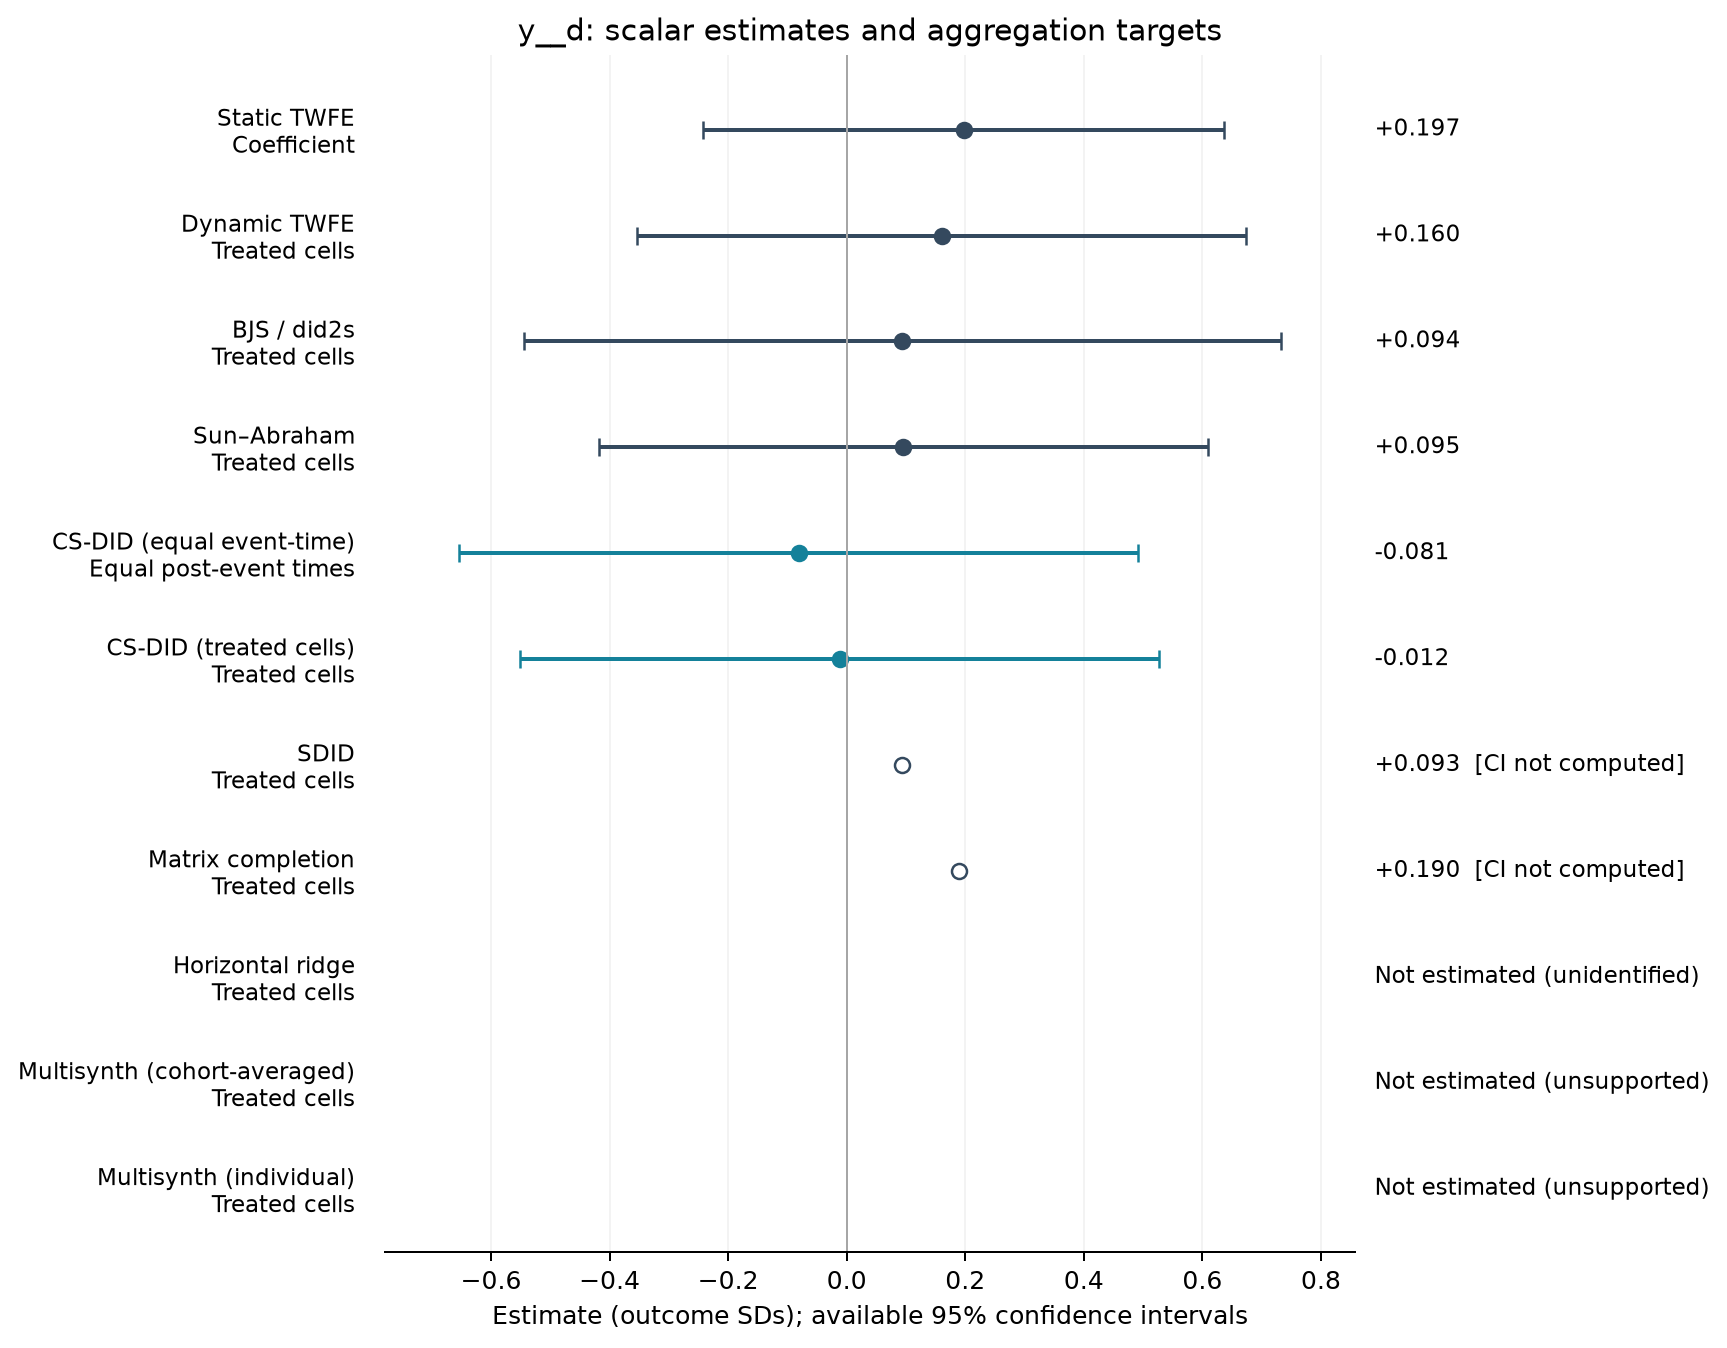
| Estimator | Estimate (SDs) | SE | 95% CI | Averaging |
|---|---|---|---|---|
| Static TWFE | 0.197 | 0.207 | [-0.242, 0.637] | Coefficient |
| Dynamic TWFE | 0.160 | 0.243 | [-0.354, 0.674] | Treated cells |
| BJS / did2s | 0.094 | 0.301 | [-0.545, 0.733] | Treated cells |
| Sun–Abraham | 0.095 | 0.242 | [-0.418, 0.609] | Treated cells |
| CS-DID (equal event-time) | -0.081 | 0.292 | [-0.654, 0.492] | Equal post-event times |
| CS-DID (treated cells) | -0.012 | 0.275 | [-0.551, 0.527] | Treated cells |
| SDID | 0.093 | — | — | Treated cells |
| Matrix completion | 0.190 | — | — | Treated cells |
Event studies
Periods −10 to +10; pointwise 95% intervals where available.
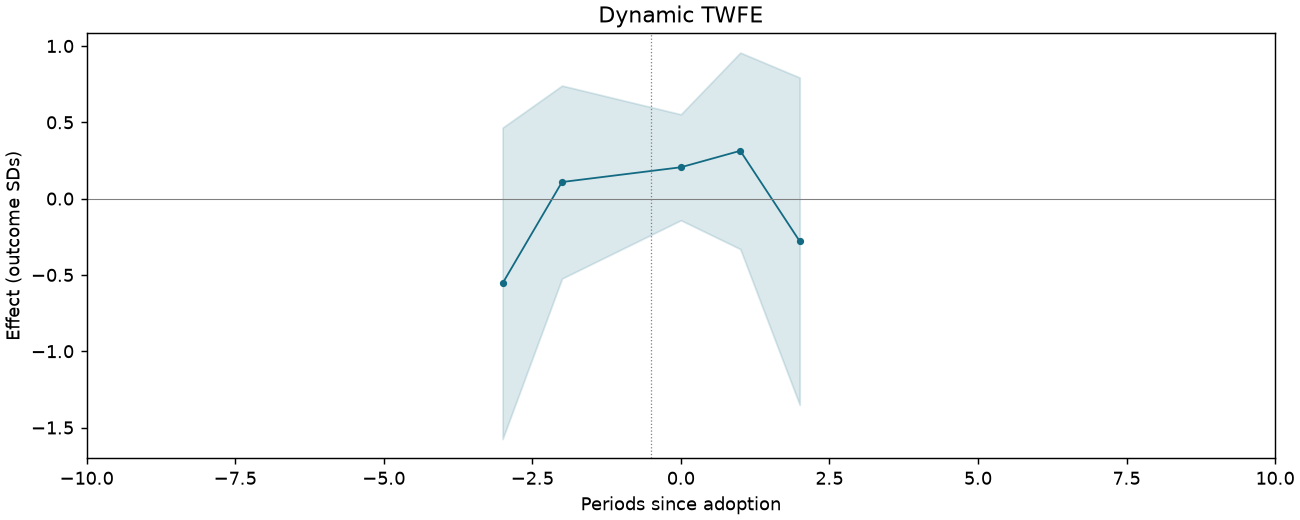
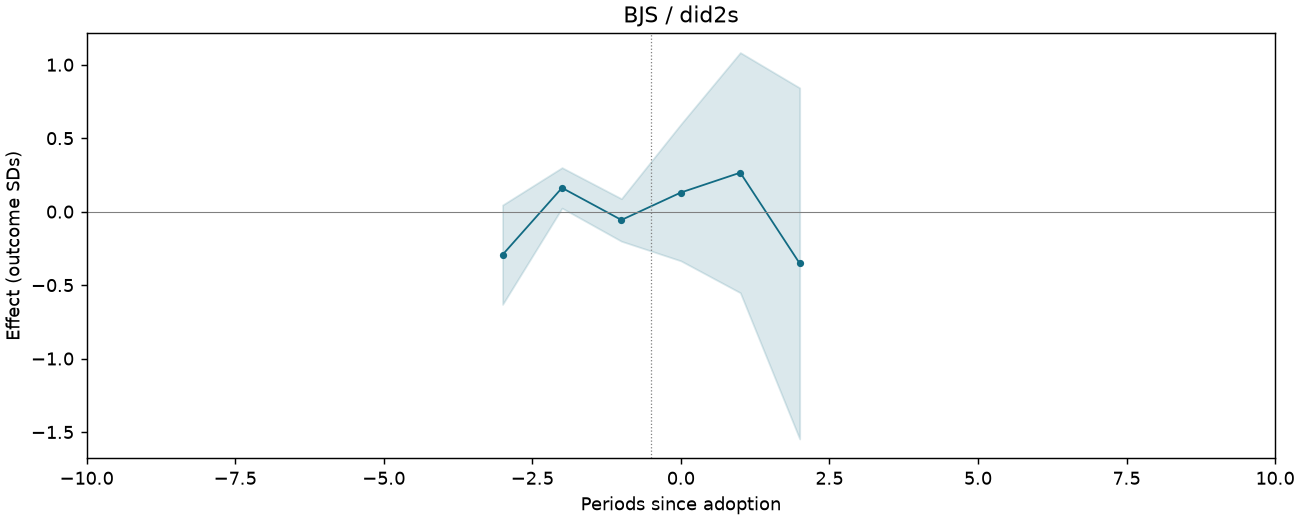
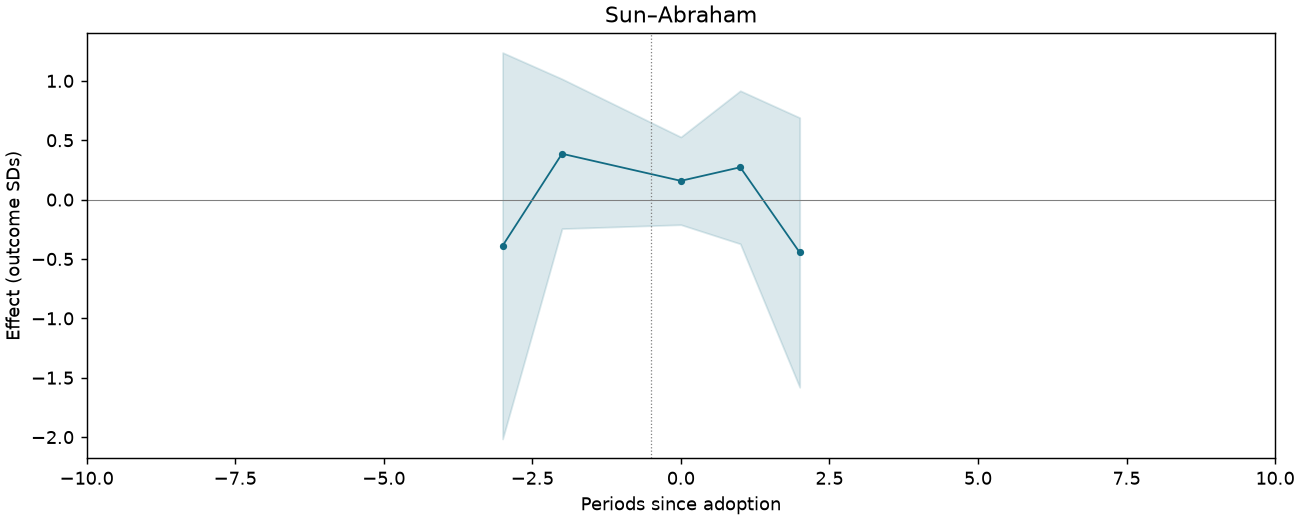
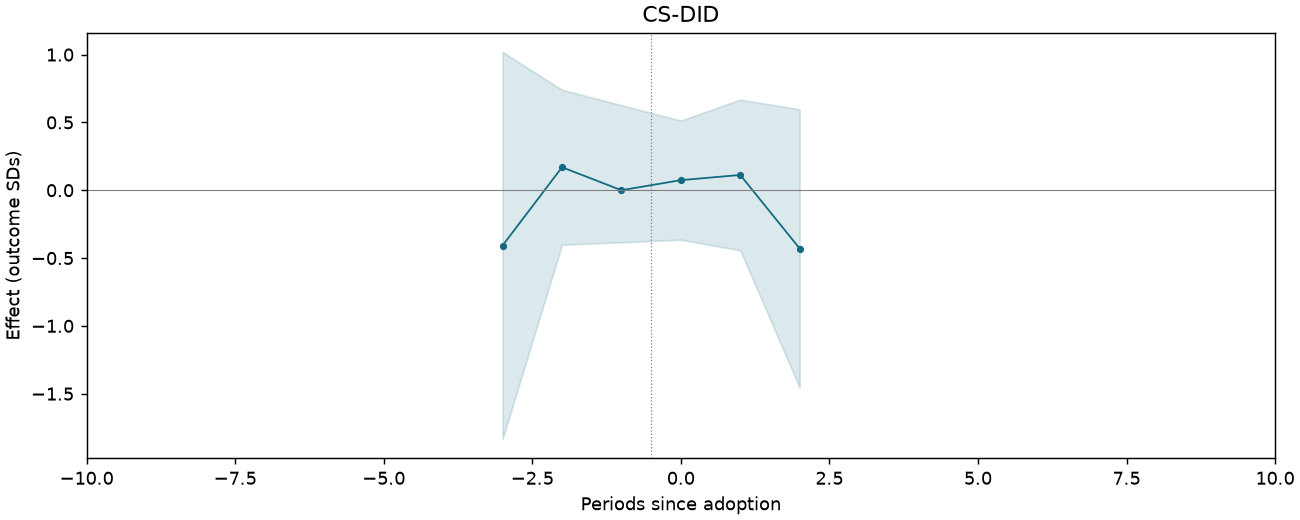
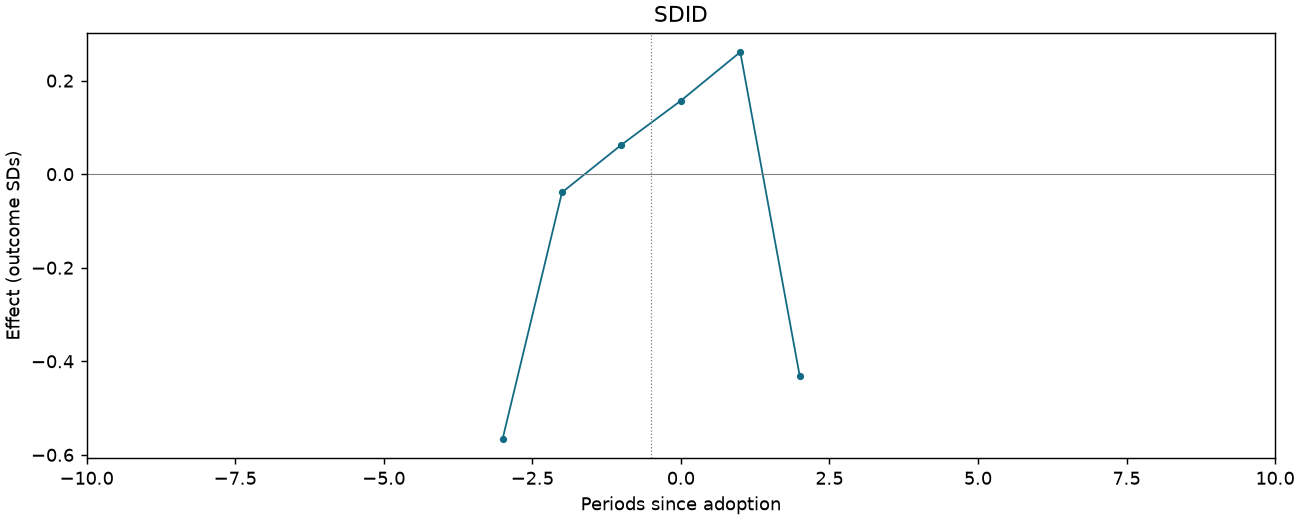
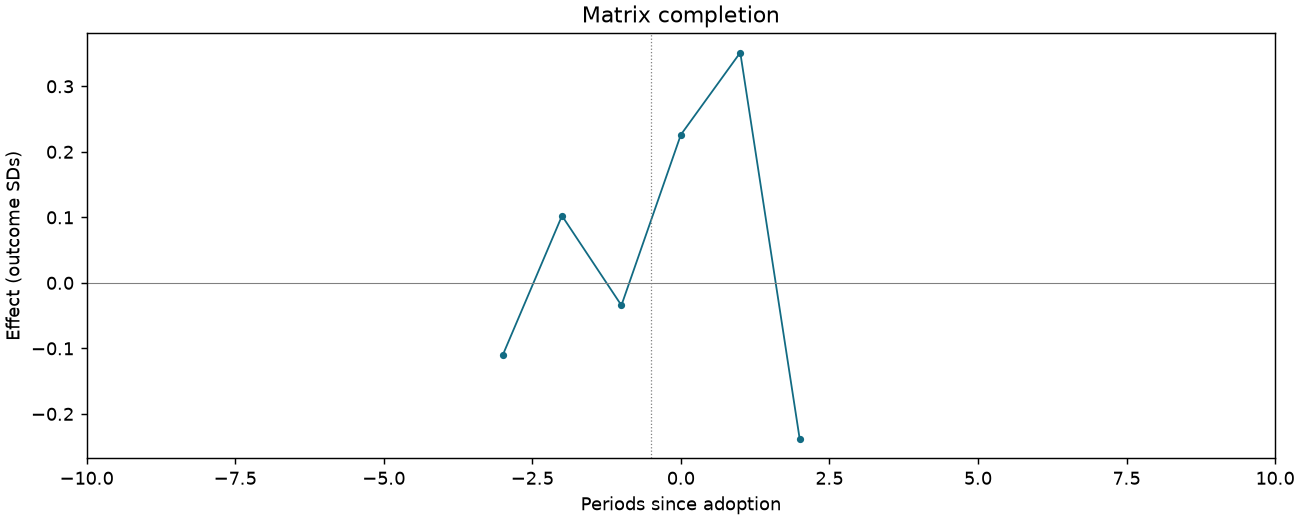
Identified new-curriculum textbook cover
1,061 observations · 19 units · 19 clusters · 13 treated / 6 control units.
Estimate comparison
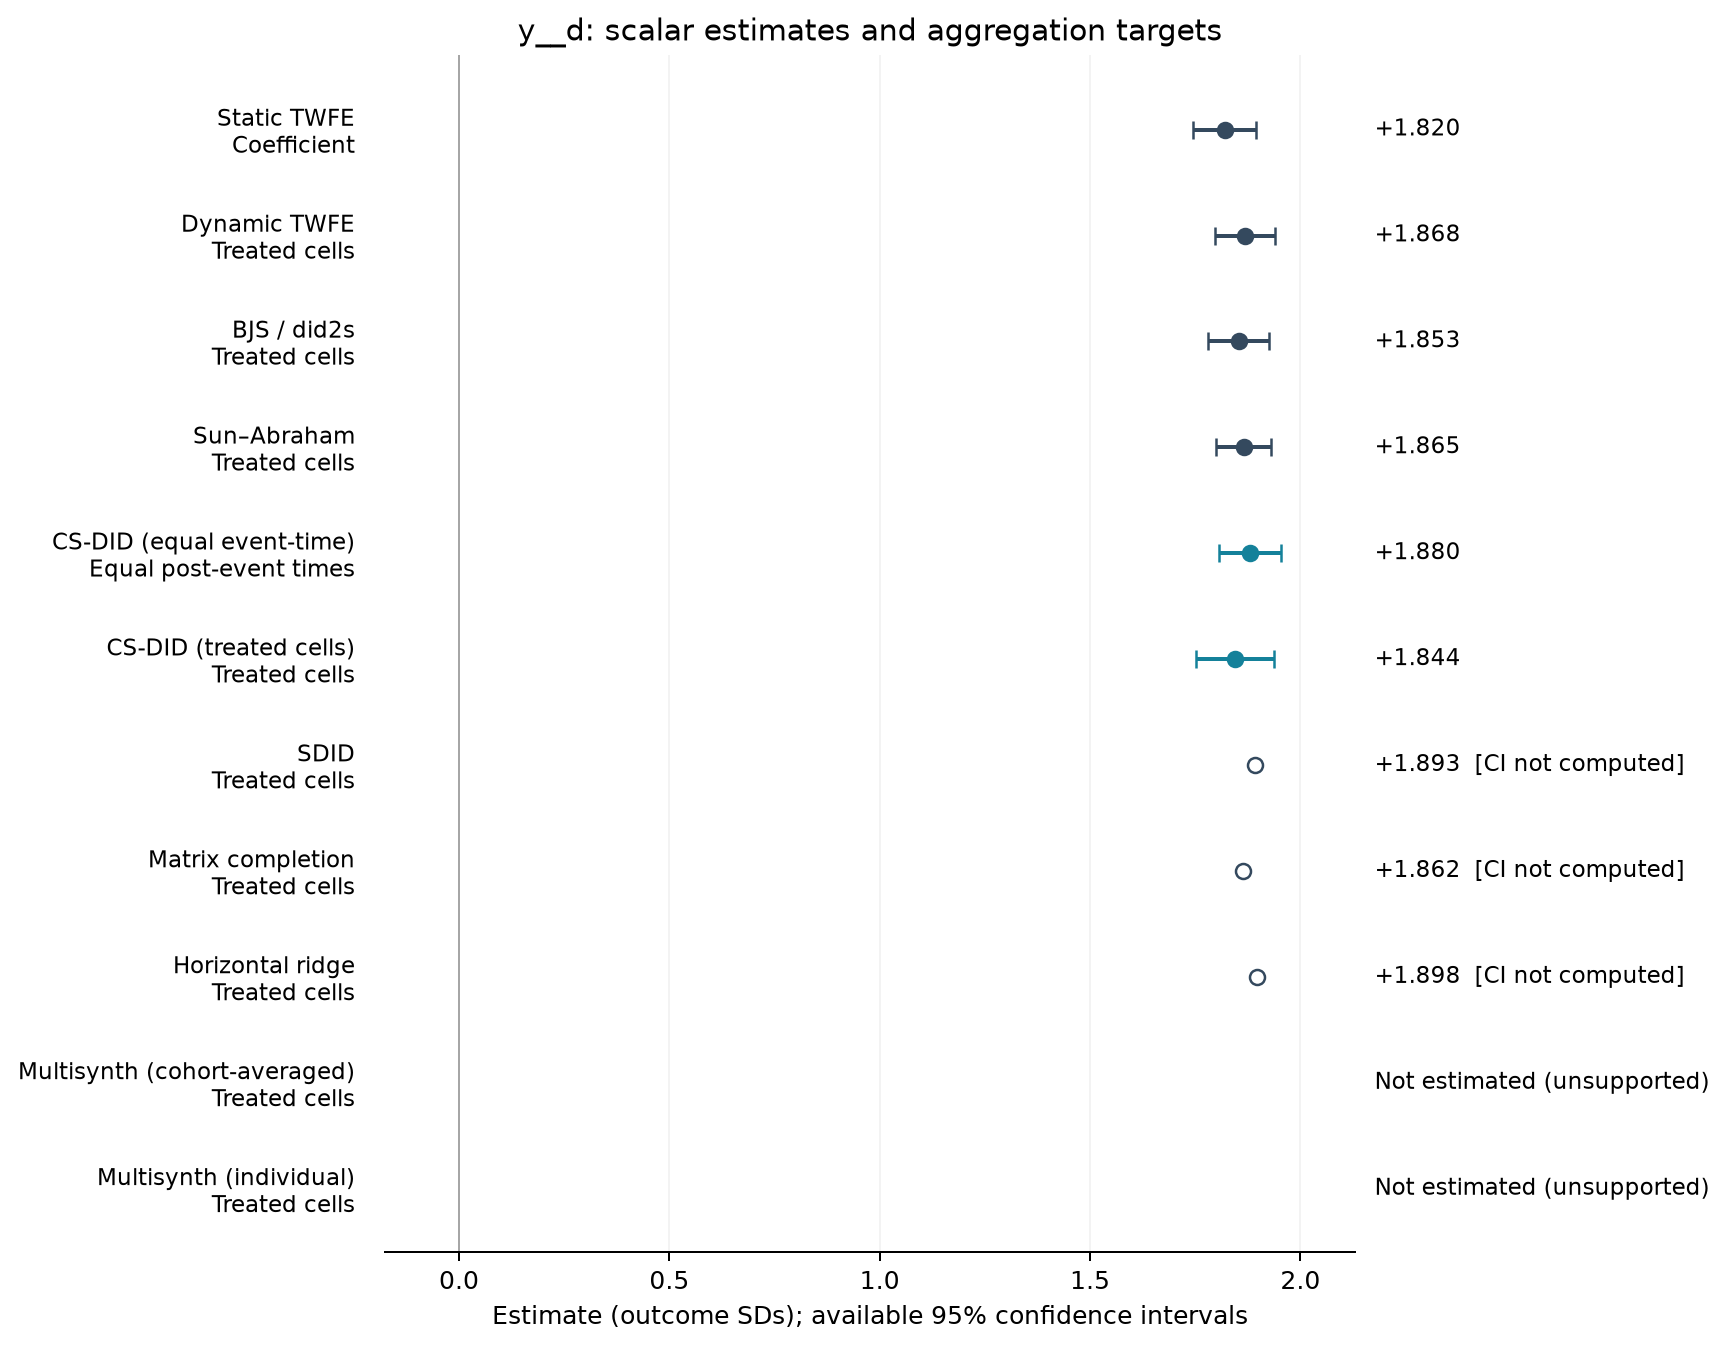
| Estimator | Estimate (SDs) | SE | 95% CI | Averaging |
|---|---|---|---|---|
| Static TWFE | 1.820 | 0.035 | [1.745, 1.894] | Coefficient |
| Dynamic TWFE | 1.868 | 0.034 | [1.797, 1.939] | Treated cells |
| BJS / did2s | 1.853 | 0.034 | [1.781, 1.925] | Treated cells |
| Sun–Abraham | 1.865 | 0.031 | [1.799, 1.931] | Treated cells |
| CS-DID (equal event-time) | 1.880 | 0.038 | [1.806, 1.954] | Equal post-event times |
| CS-DID (treated cells) | 1.844 | 0.047 | [1.751, 1.937] | Treated cells |
| SDID | 1.893 | — | — | Treated cells |
| Matrix completion | 1.862 | — | — | Treated cells |
| Horizontal ridge | 1.898 | — | — | Treated cells |
Event studies
Periods −10 to +10; pointwise 95% intervals where available.
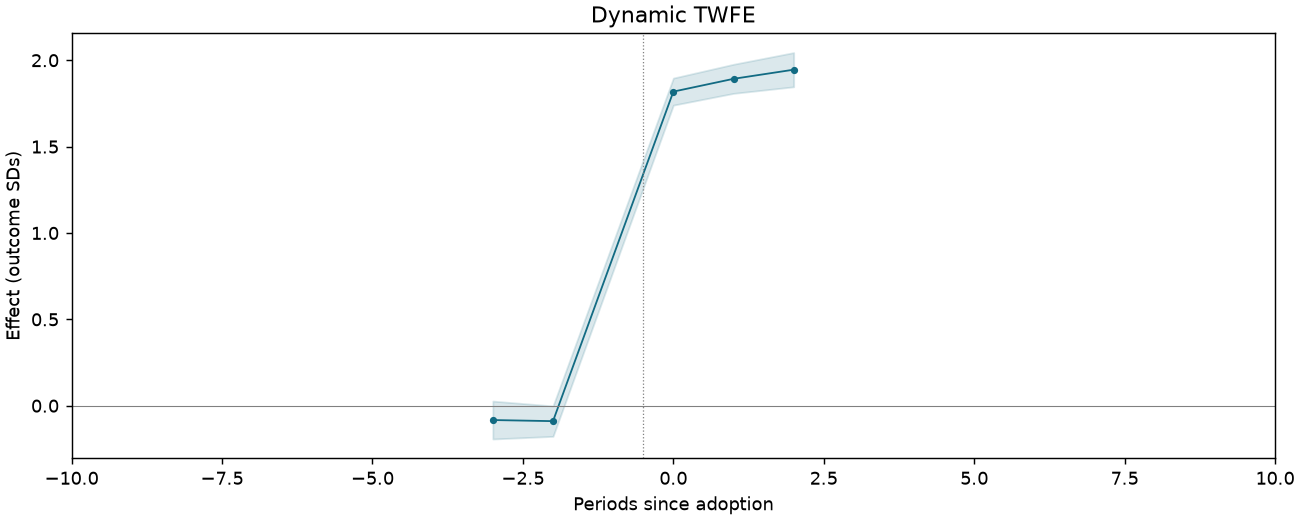
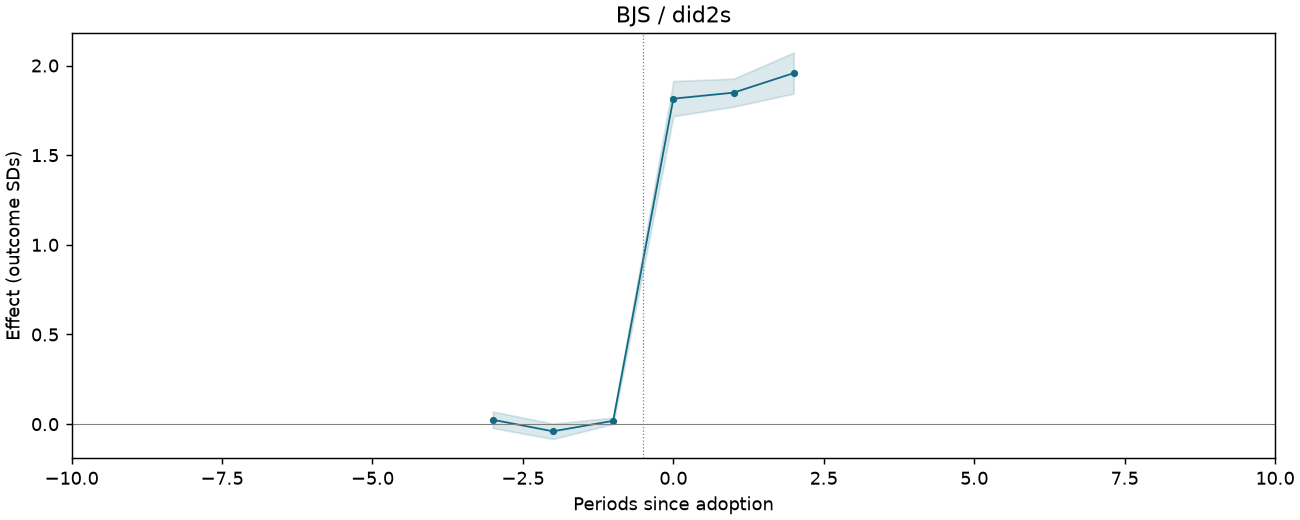
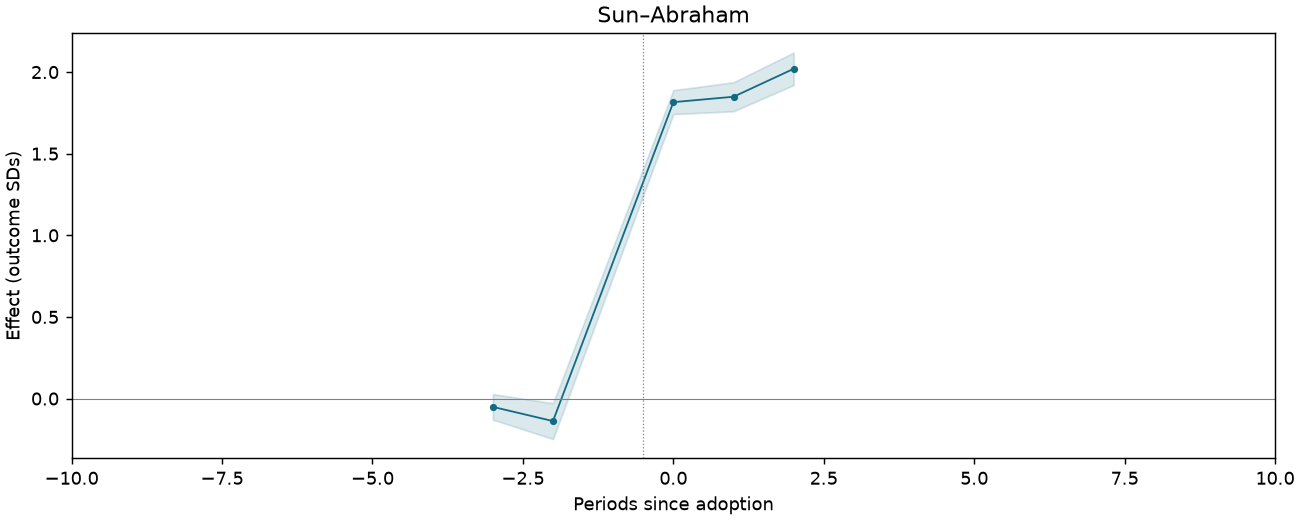
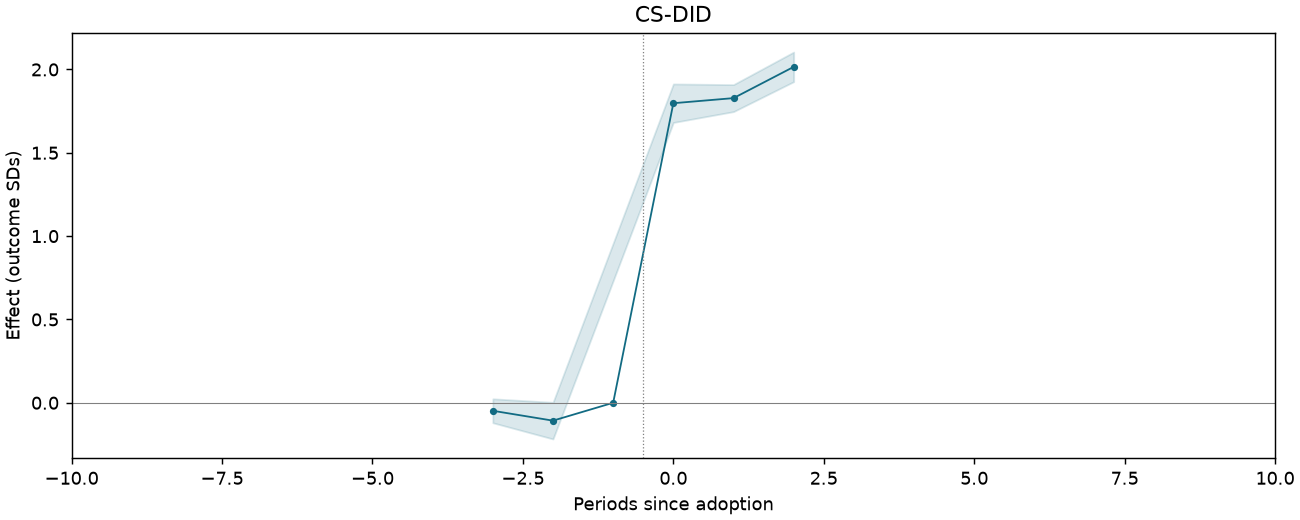
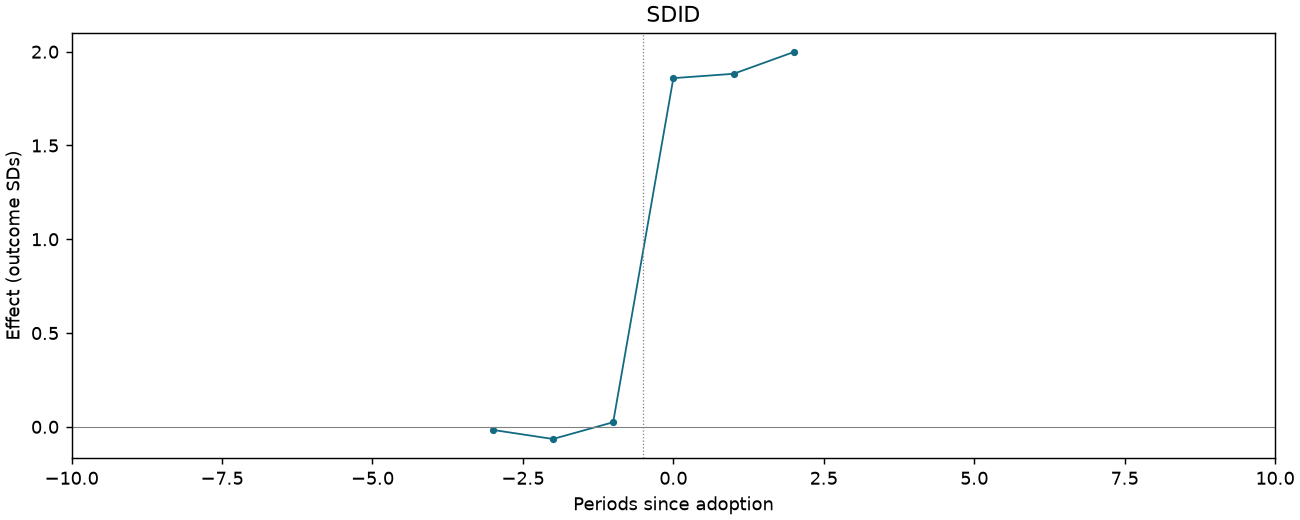
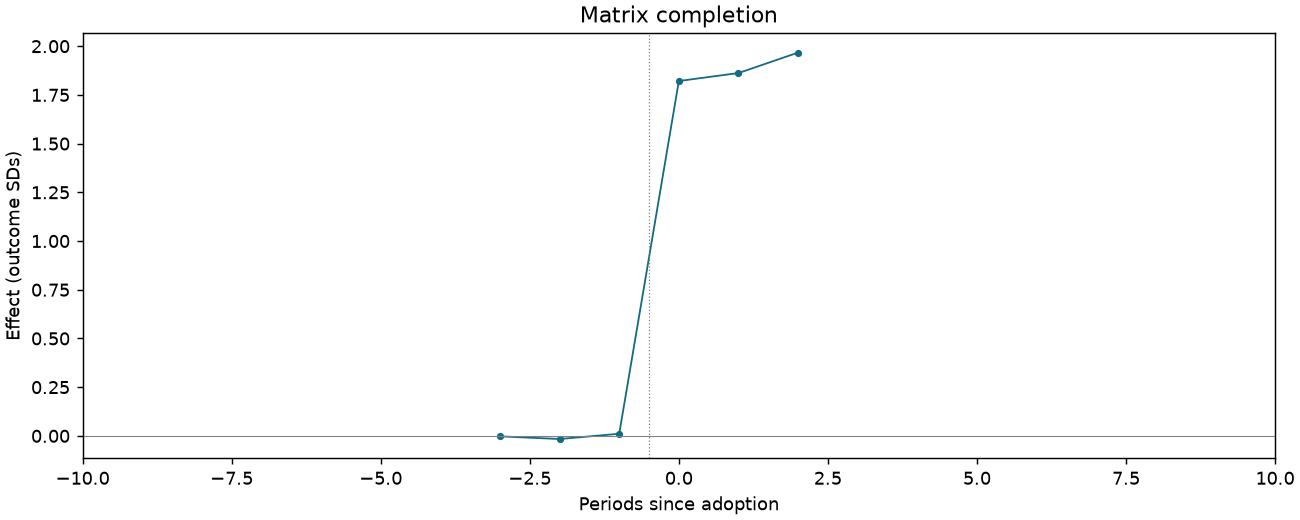
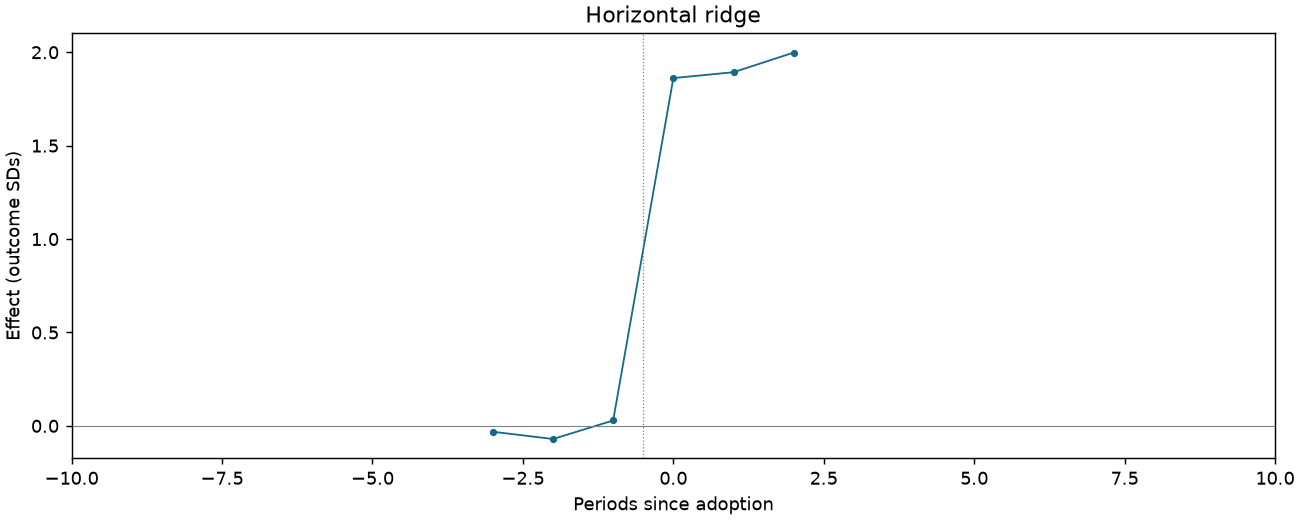
Aware: village head elected
1,102 observations · 19 units · 19 clusters · 13 treated / 6 control units.
Estimate comparison
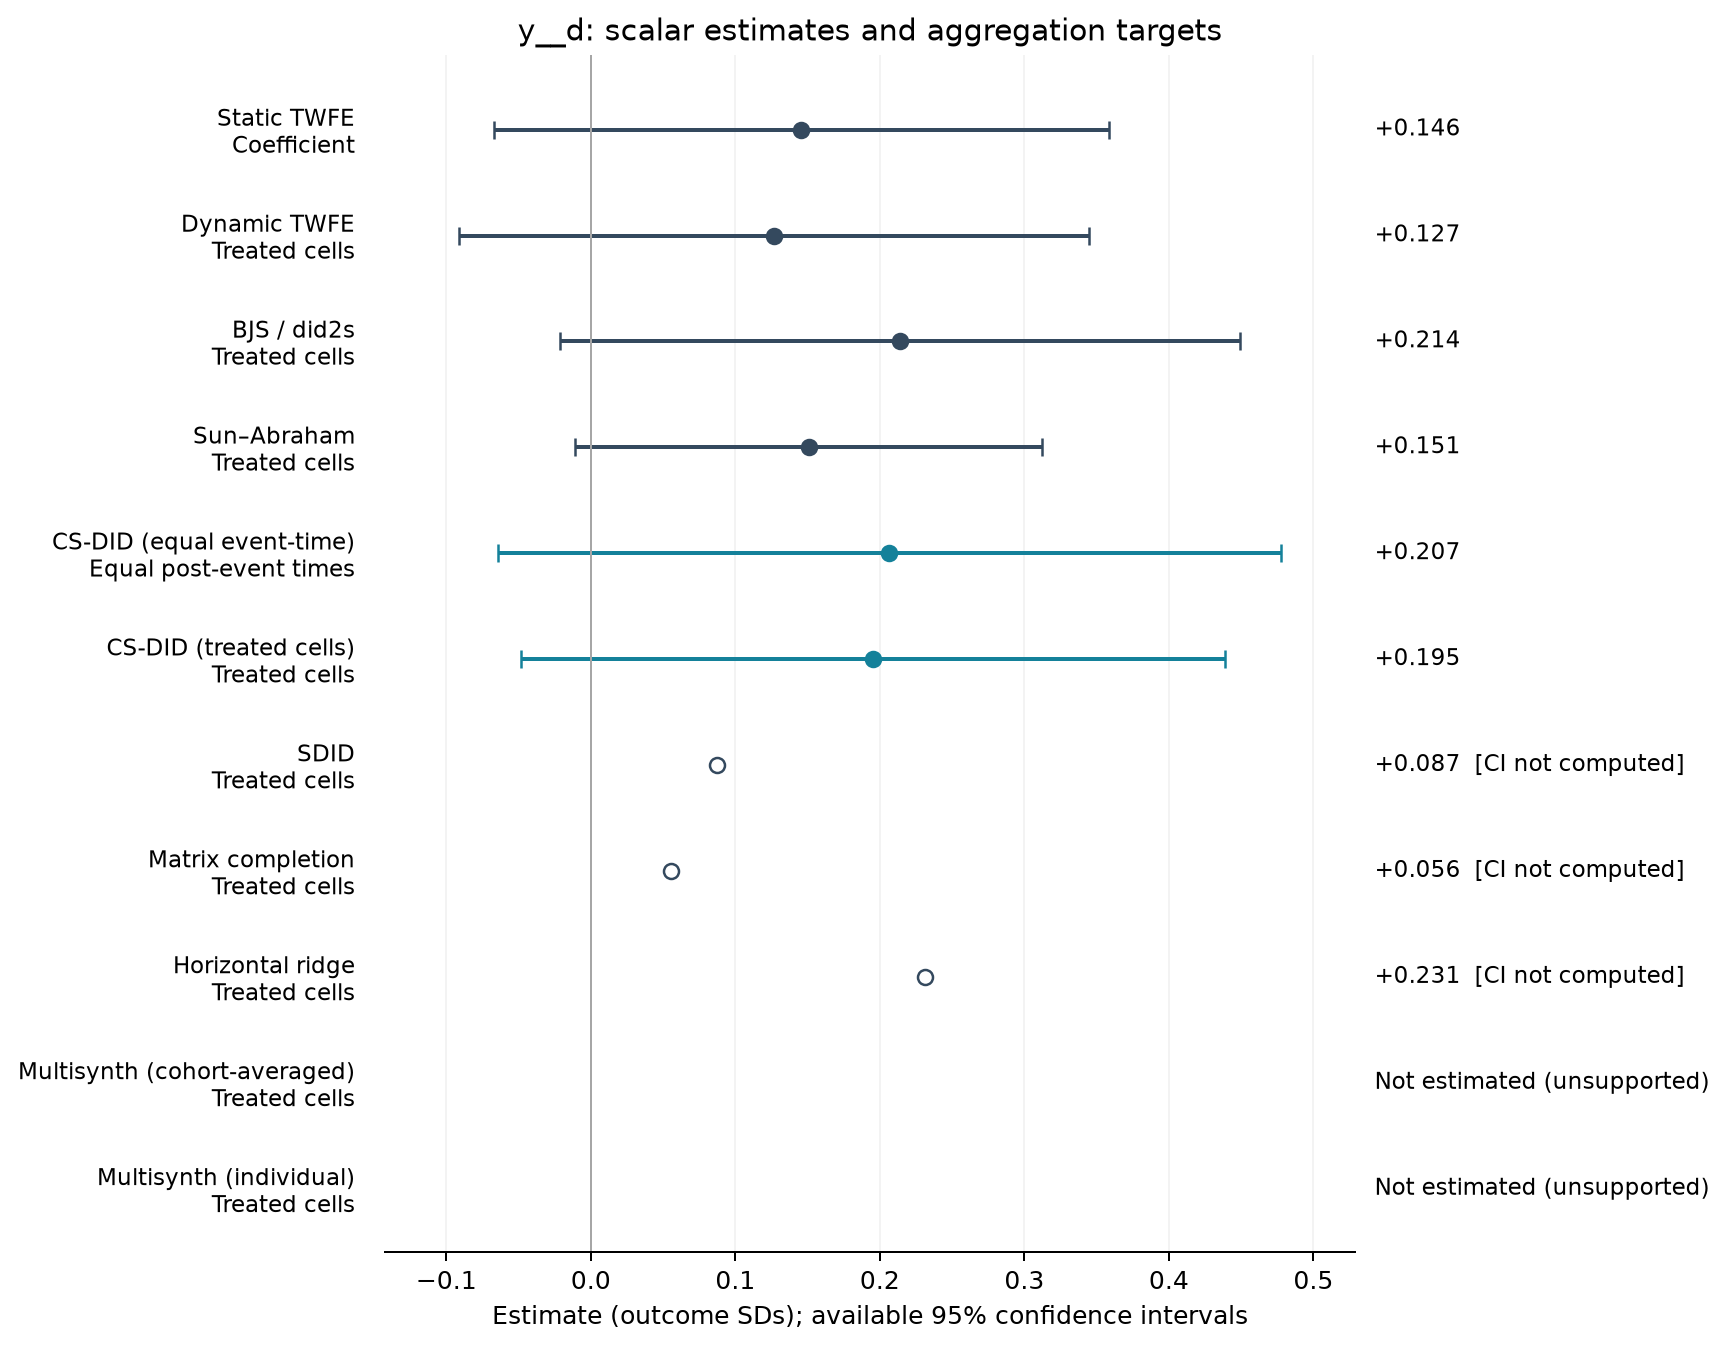
| Estimator | Estimate (SDs) | SE | 95% CI | Averaging |
|---|---|---|---|---|
| Static TWFE | 0.146 | 0.101 | [-0.067, 0.358] | Coefficient |
| Dynamic TWFE | 0.127 | 0.104 | [-0.091, 0.345] | Treated cells |
| BJS / did2s | 0.214 | 0.112 | [-0.021, 0.450] | Treated cells |
| Sun–Abraham | 0.151 | 0.077 | [-0.011, 0.312] | Treated cells |
| CS-DID (equal event-time) | 0.207 | 0.138 | [-0.064, 0.478] | Equal post-event times |
| CS-DID (treated cells) | 0.195 | 0.124 | [-0.049, 0.439] | Treated cells |
| SDID | 0.087 | — | — | Treated cells |
| Matrix completion | 0.056 | — | — | Treated cells |
| Horizontal ridge | 0.231 | — | — | Treated cells |
Event studies
Periods −10 to +10; pointwise 95% intervals where available.
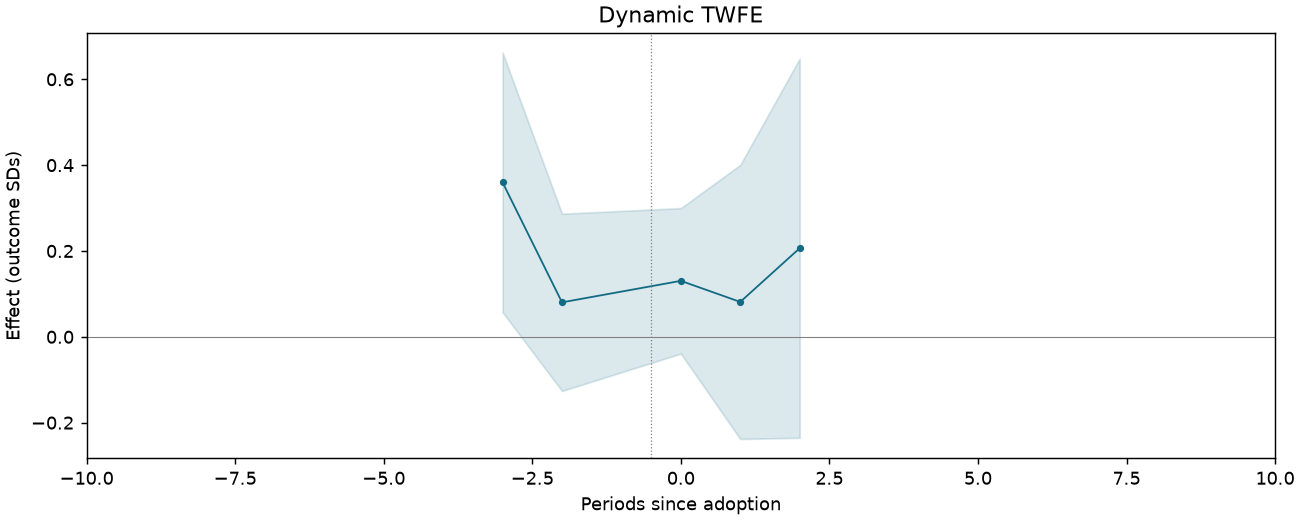
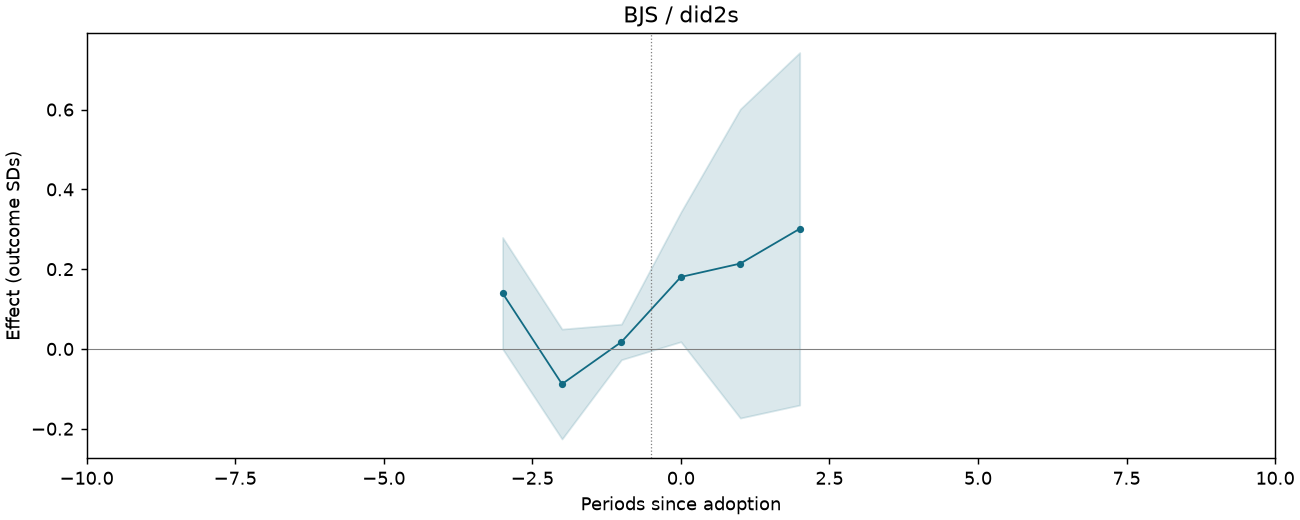
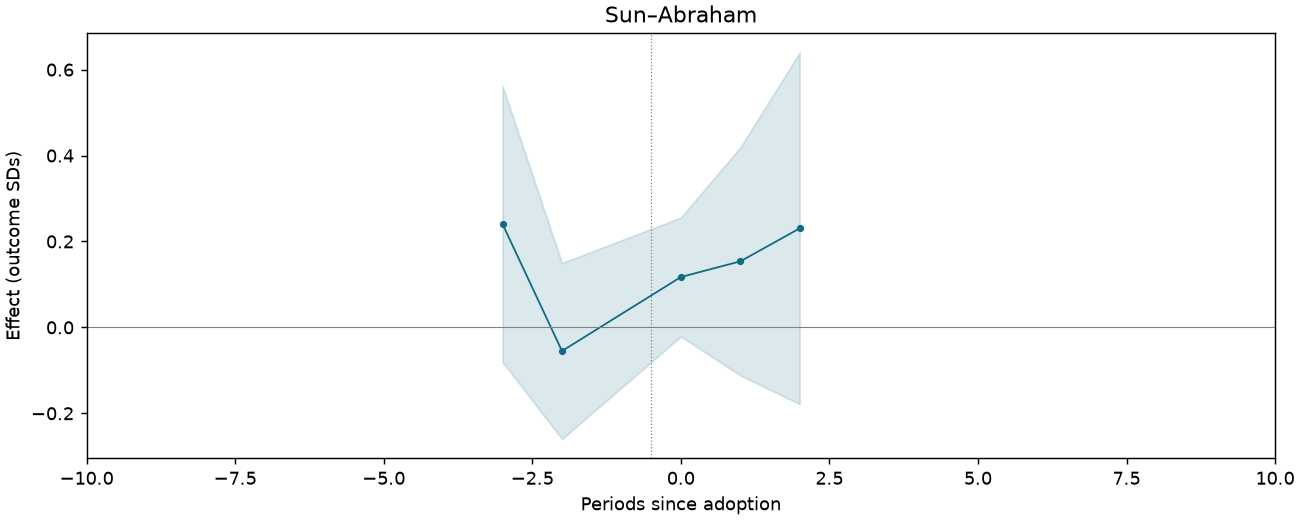
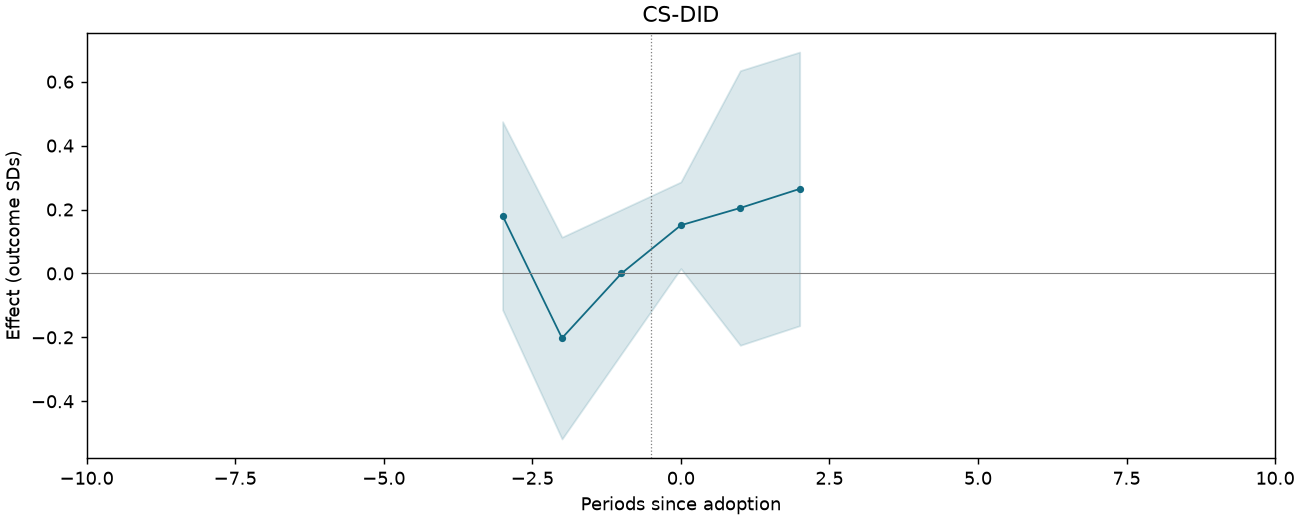
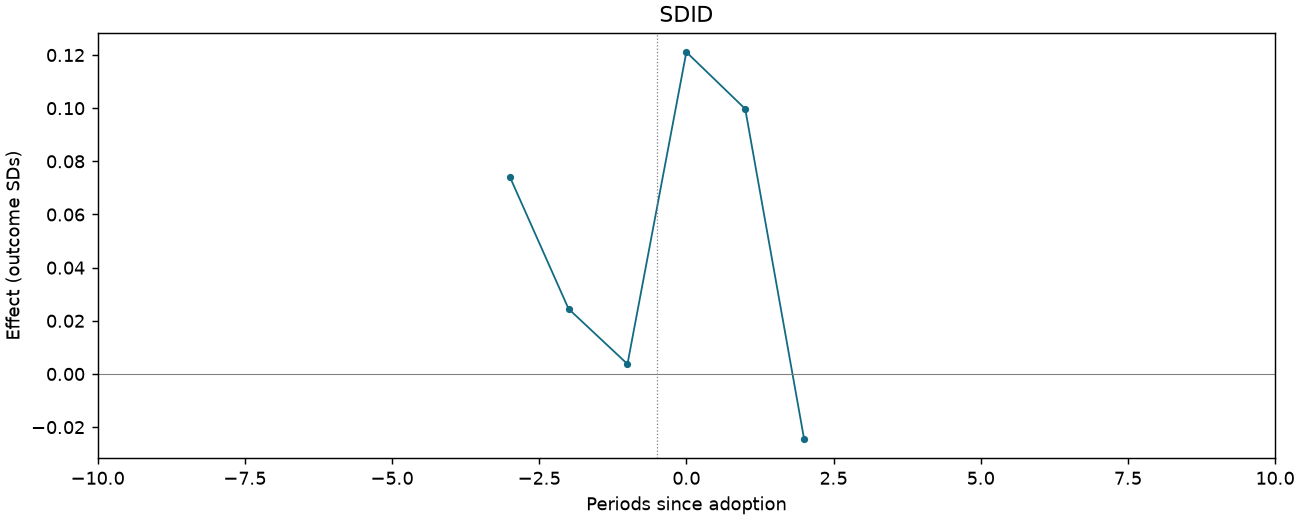
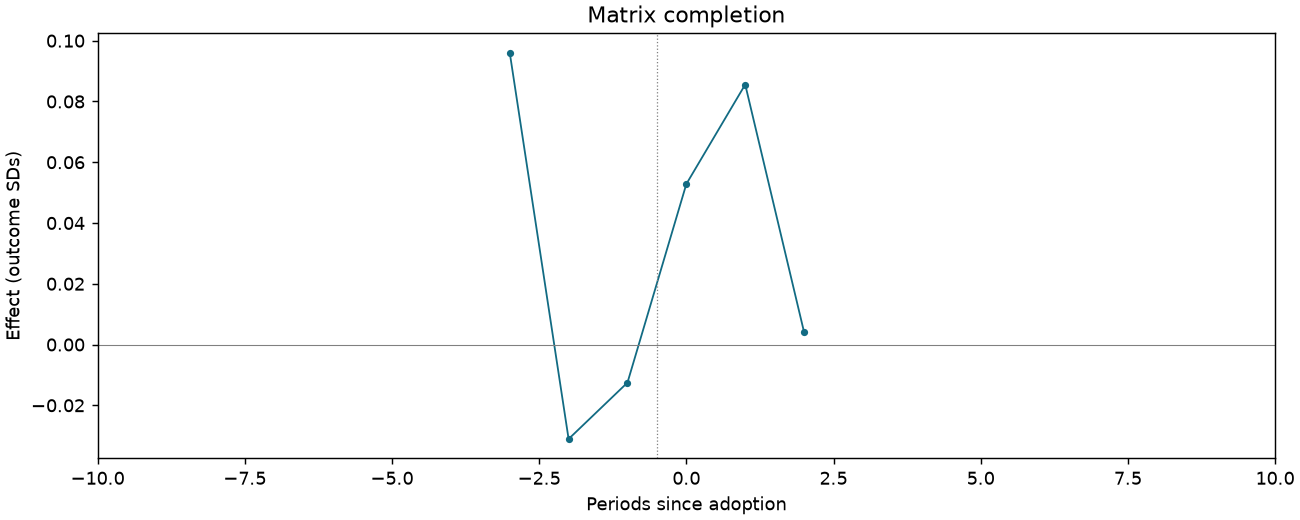
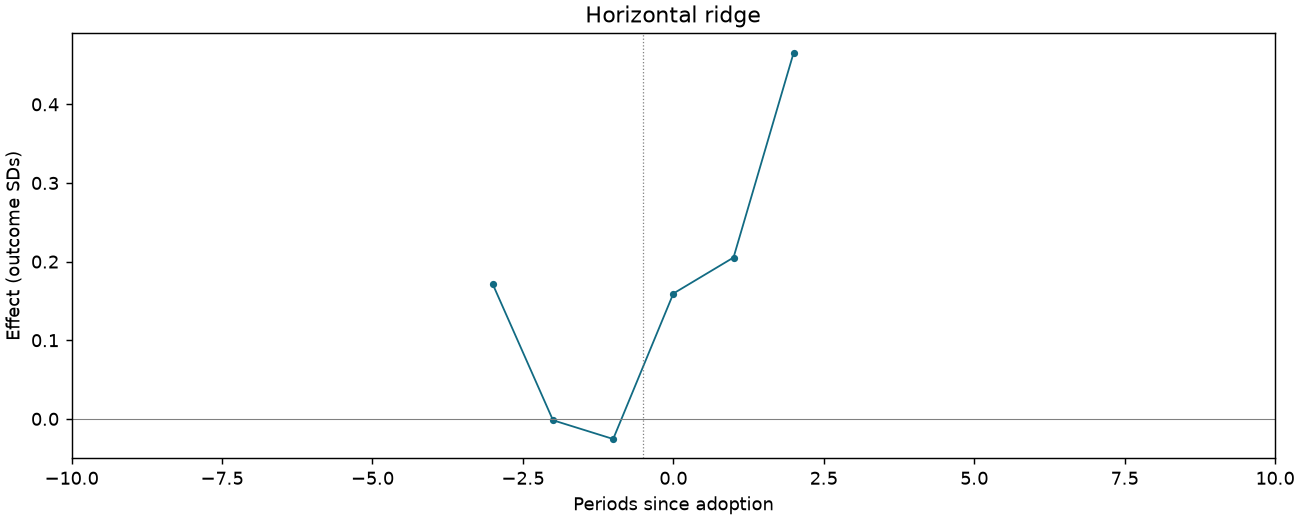
Aware: able to vote for local People's Congress representative
1,102 observations · 19 units · 19 clusters · 13 treated / 6 control units.
Estimate comparison
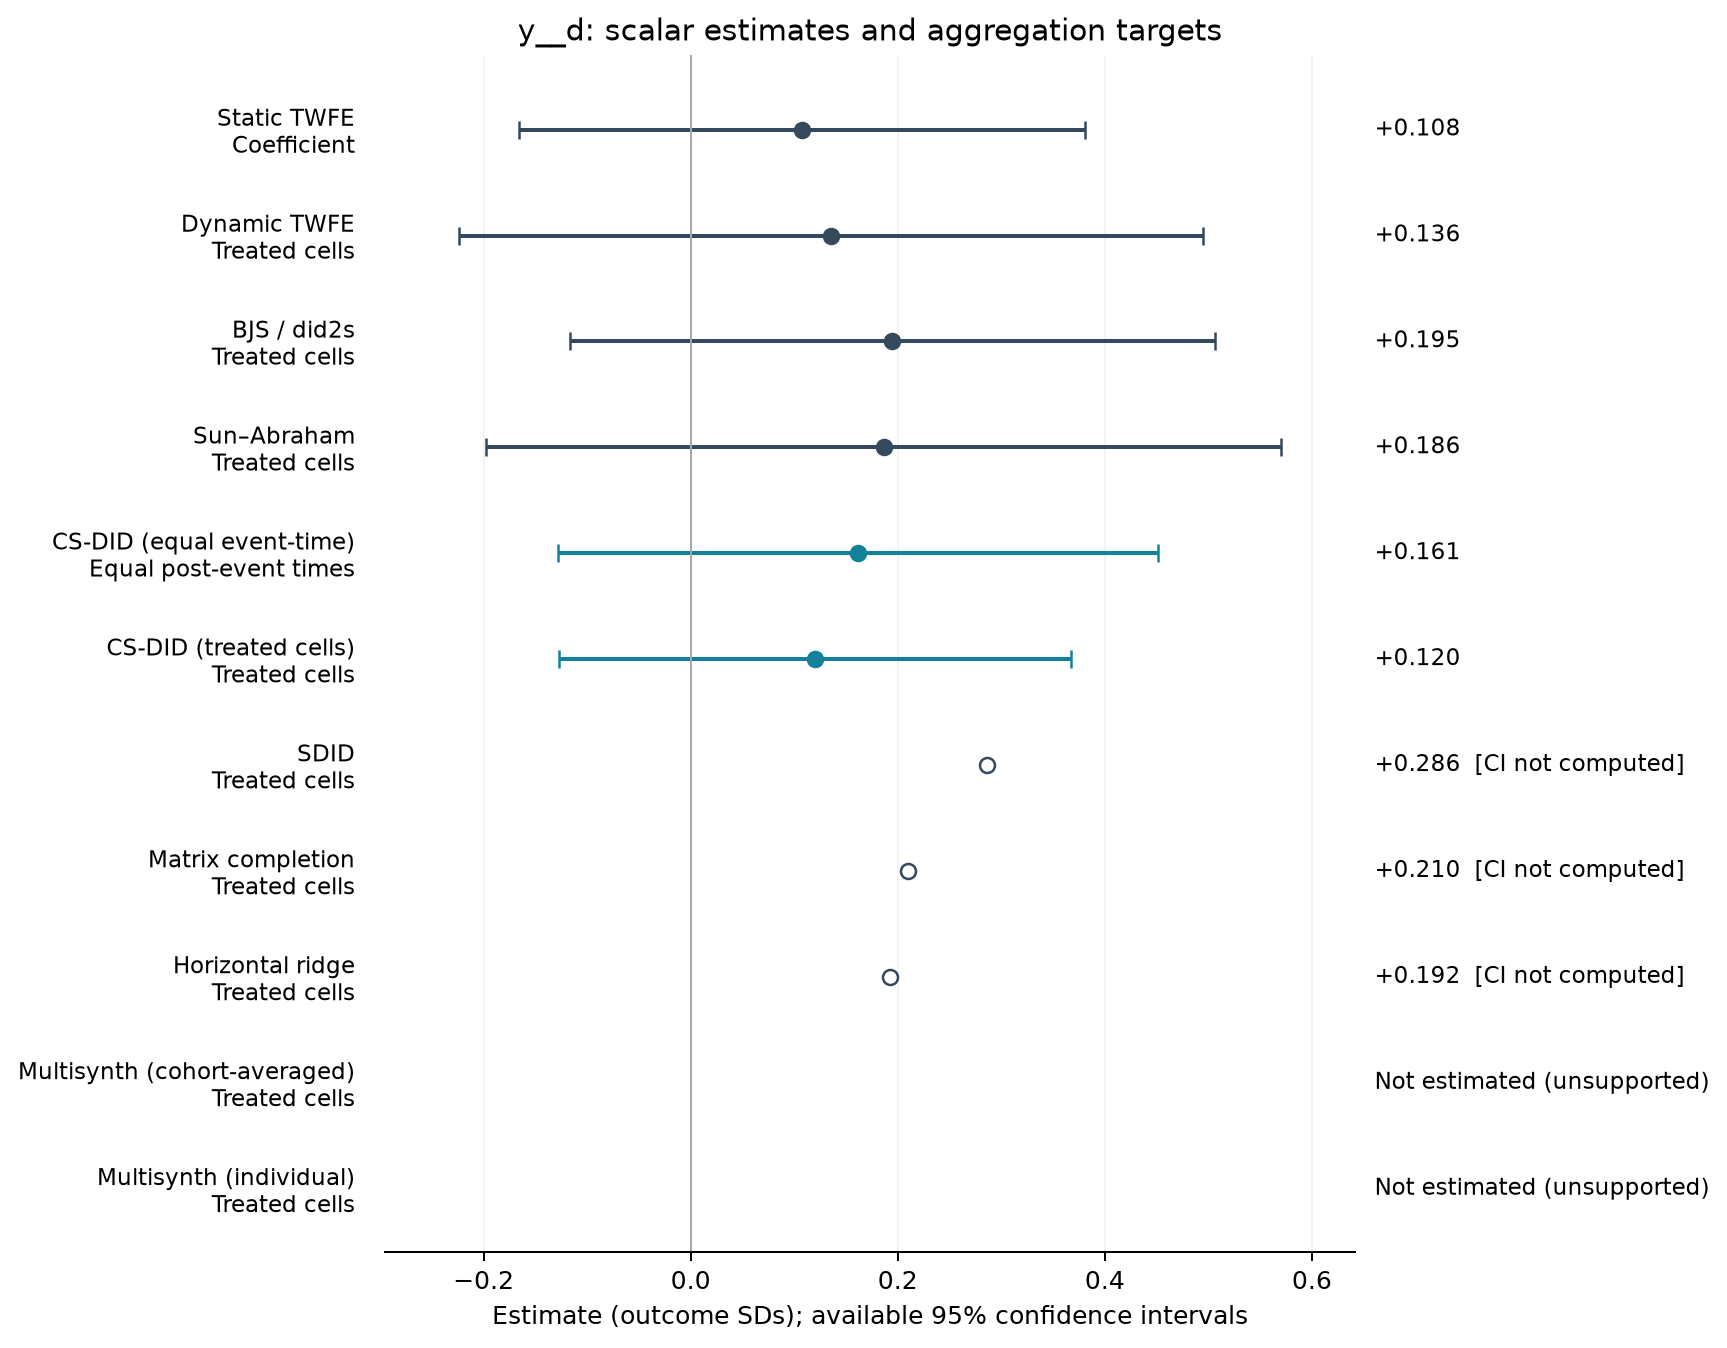
| Estimator | Estimate (SDs) | SE | 95% CI | Averaging |
|---|---|---|---|---|
| Static TWFE | 0.108 | 0.130 | [-0.166, 0.381] | Coefficient |
| Dynamic TWFE | 0.136 | 0.171 | [-0.224, 0.495] | Treated cells |
| BJS / did2s | 0.195 | 0.148 | [-0.117, 0.506] | Treated cells |
| Sun–Abraham | 0.186 | 0.183 | [-0.198, 0.570] | Treated cells |
| CS-DID (equal event-time) | 0.161 | 0.148 | [-0.128, 0.451] | Equal post-event times |
| CS-DID (treated cells) | 0.120 | 0.126 | [-0.127, 0.367] | Treated cells |
| SDID | 0.286 | — | — | Treated cells |
| Matrix completion | 0.210 | — | — | Treated cells |
| Horizontal ridge | 0.192 | — | — | Treated cells |
Event studies
Periods −10 to +10; pointwise 95% intervals where available.
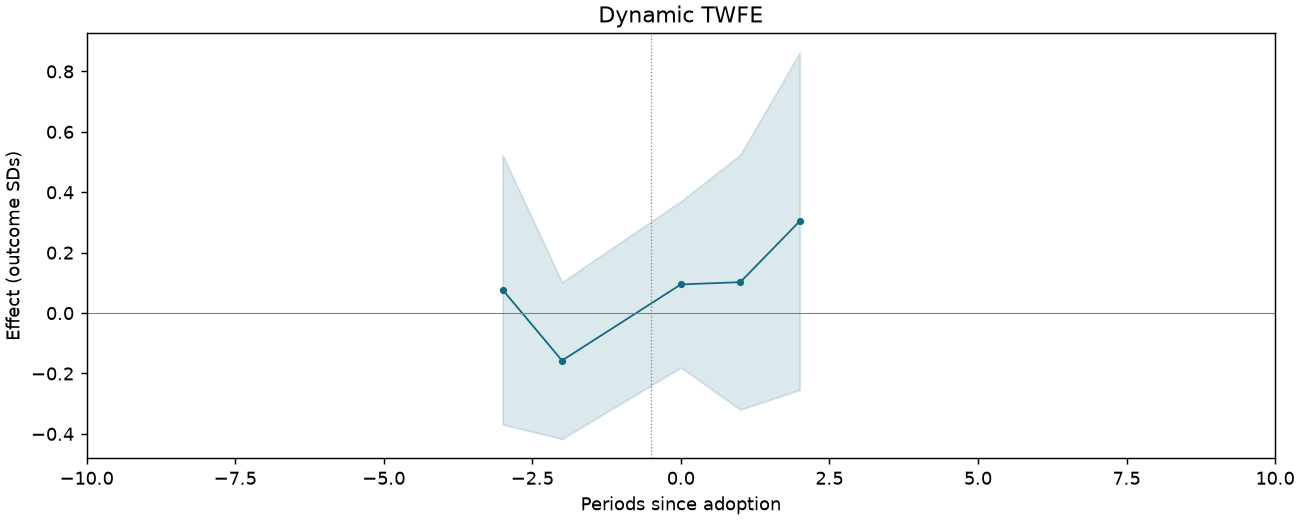
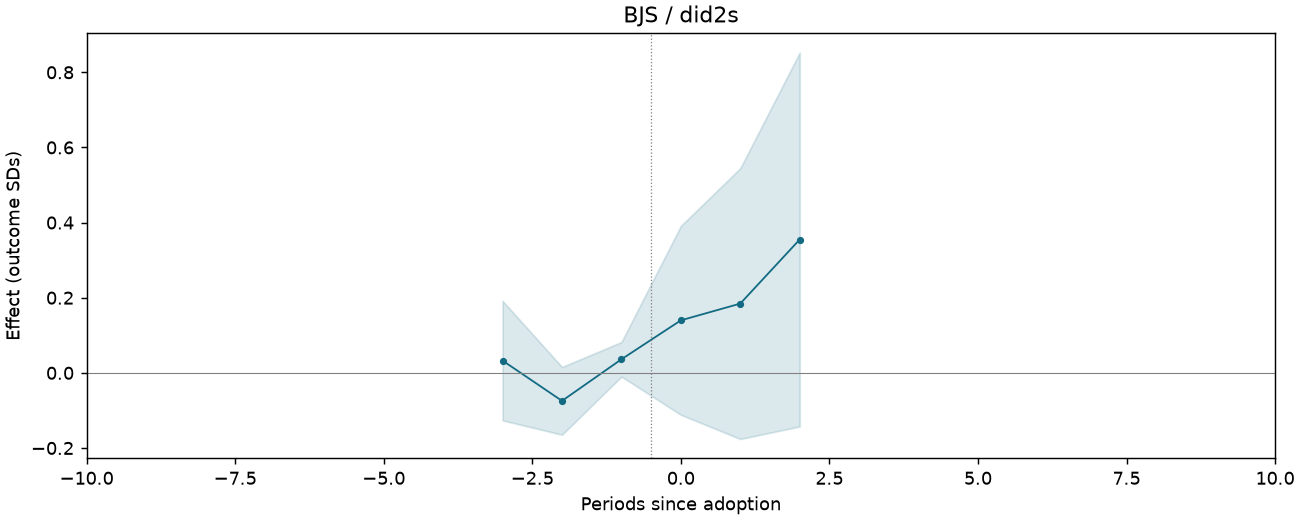
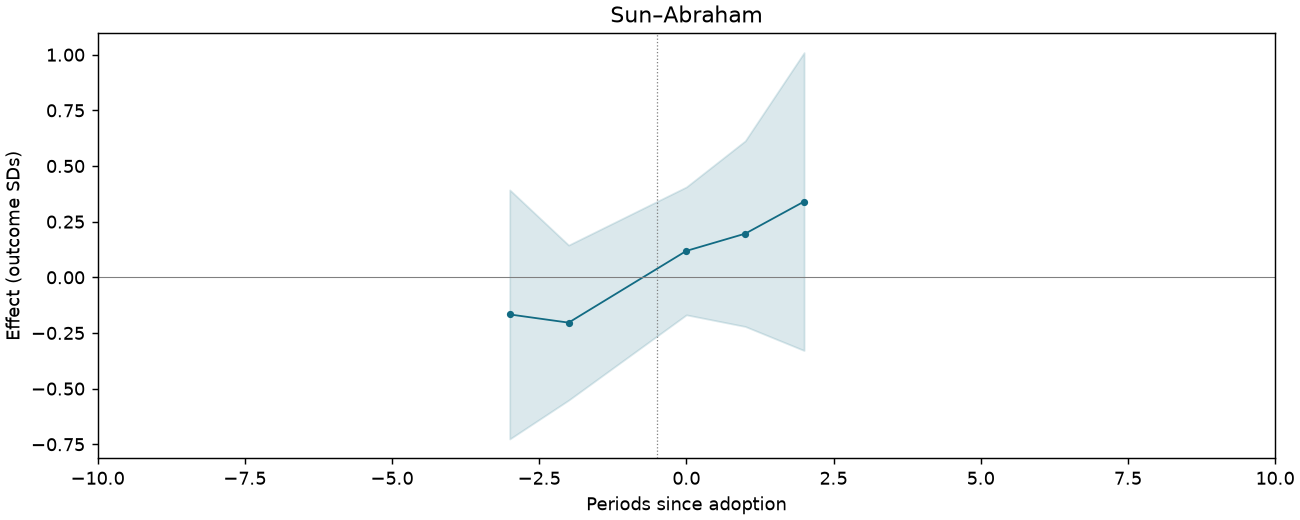
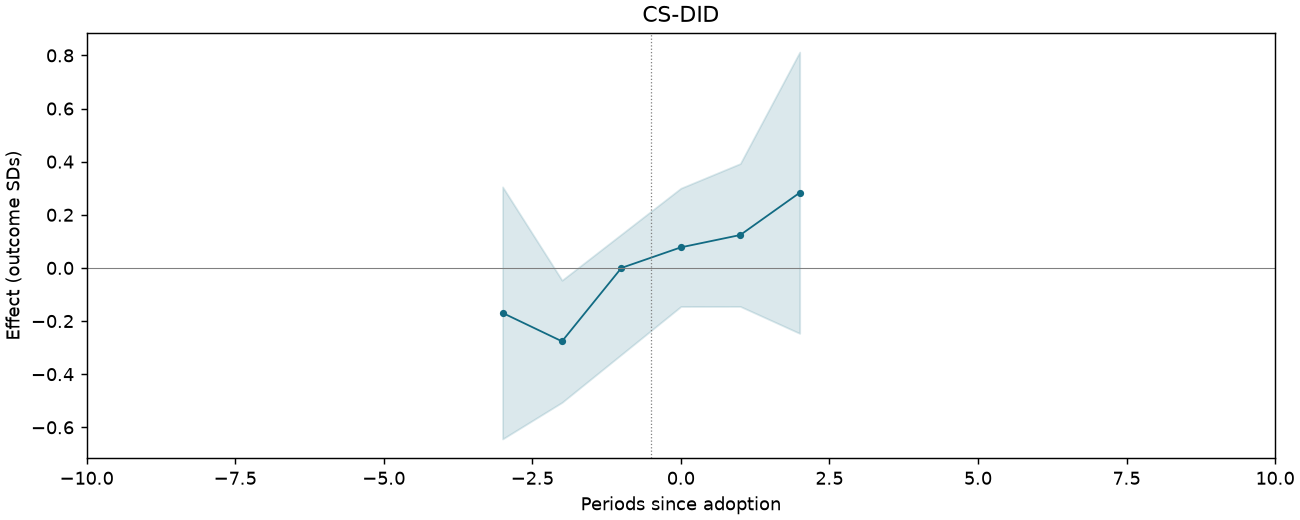
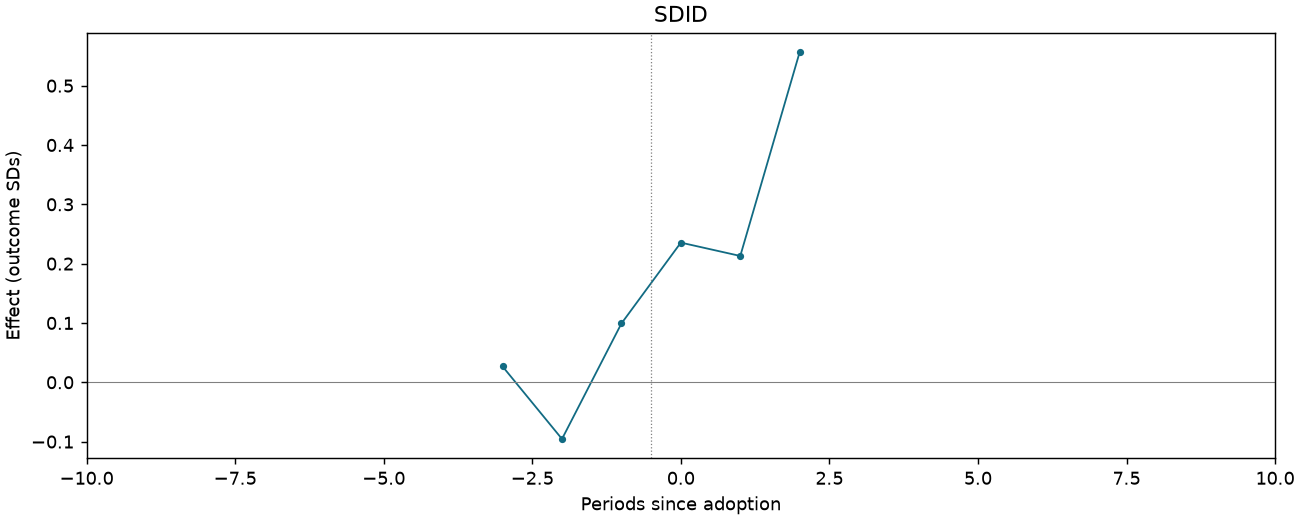
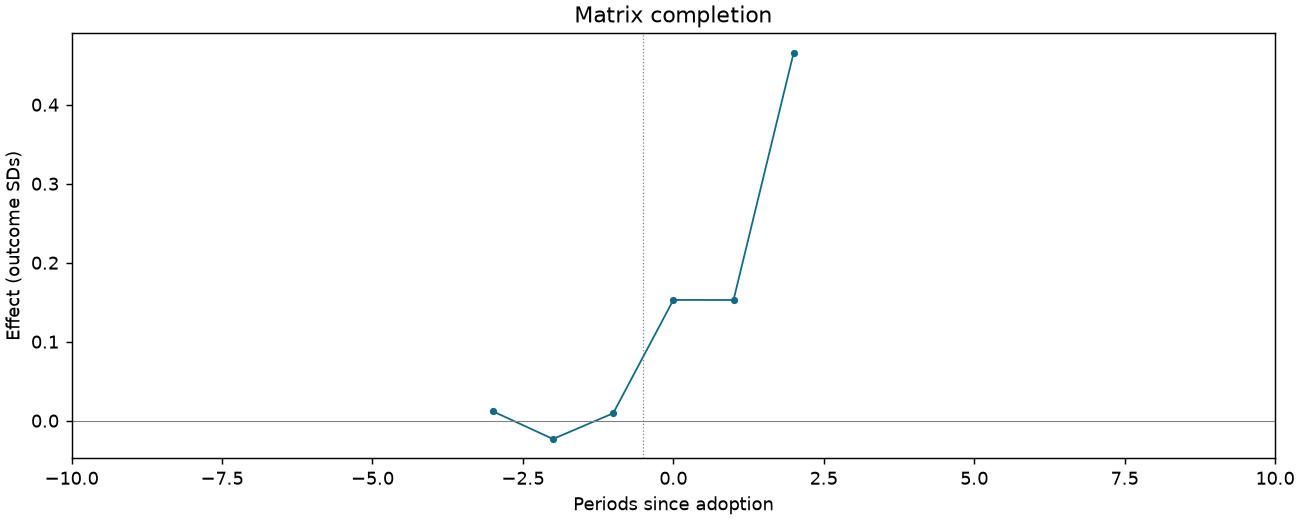
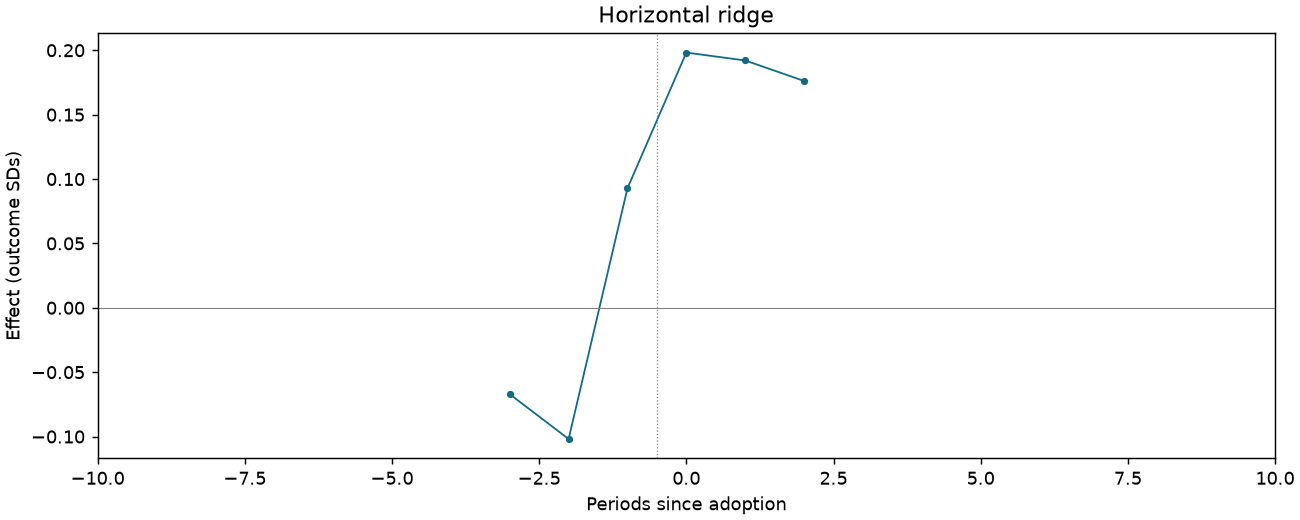
Factual political knowledge z-score index
1,102 observations · 19 units · 19 clusters · 13 treated / 6 control units.
Estimate comparison
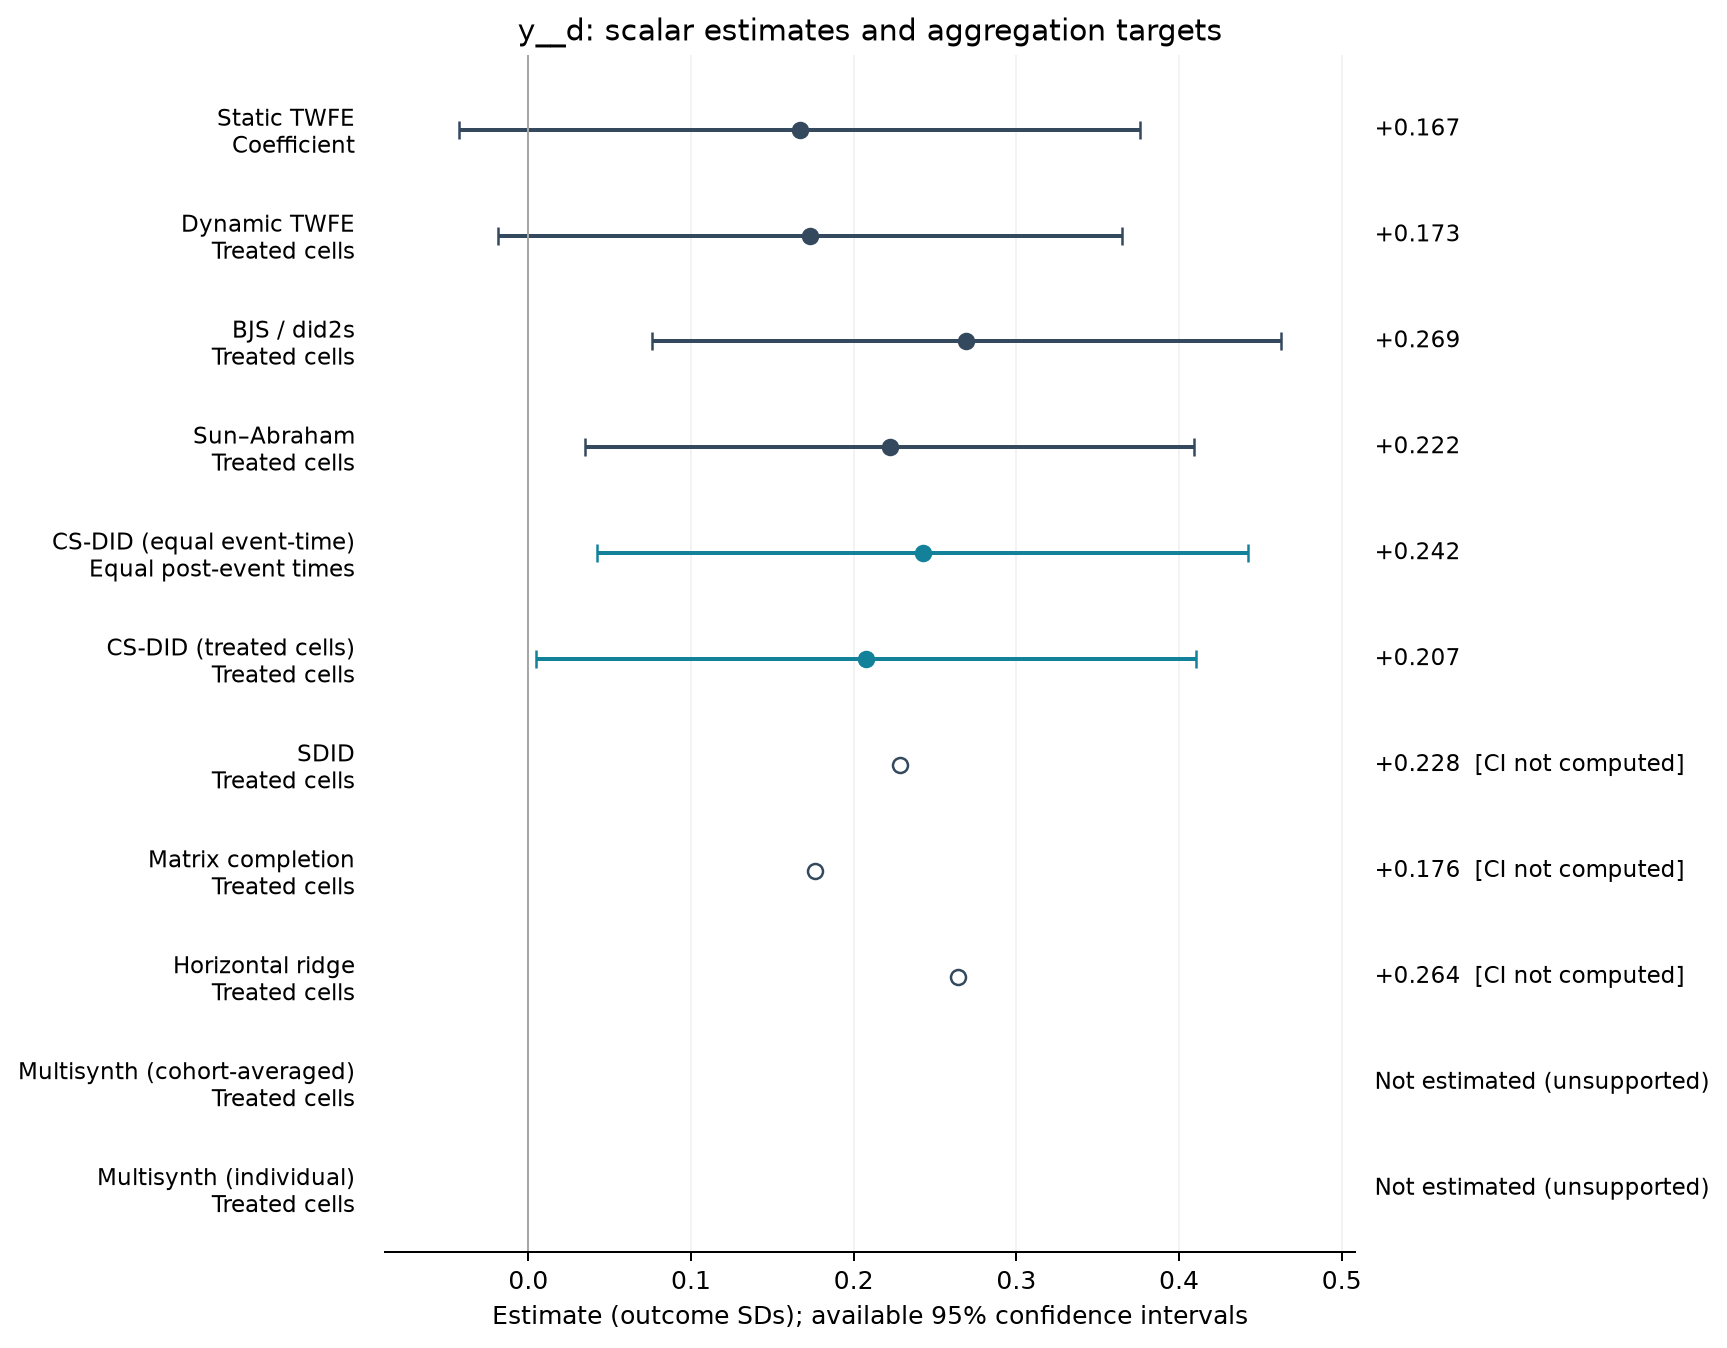
| Estimator | Estimate (SDs) | SE | 95% CI | Averaging |
|---|---|---|---|---|
| Static TWFE | 0.167 | 0.100 | [-0.043, 0.376] | Coefficient |
| Dynamic TWFE | 0.173 | 0.091 | [-0.019, 0.365] | Treated cells |
| BJS / did2s | 0.269 | 0.092 | [0.076, 0.463] | Treated cells |
| Sun–Abraham | 0.222 | 0.089 | [0.035, 0.409] | Treated cells |
| CS-DID (equal event-time) | 0.242 | 0.102 | [0.042, 0.442] | Equal post-event times |
| CS-DID (treated cells) | 0.207 | 0.103 | [0.005, 0.410] | Treated cells |
| SDID | 0.228 | — | — | Treated cells |
| Matrix completion | 0.176 | — | — | Treated cells |
| Horizontal ridge | 0.264 | — | — | Treated cells |
Event studies
Periods −10 to +10; pointwise 95% intervals where available.
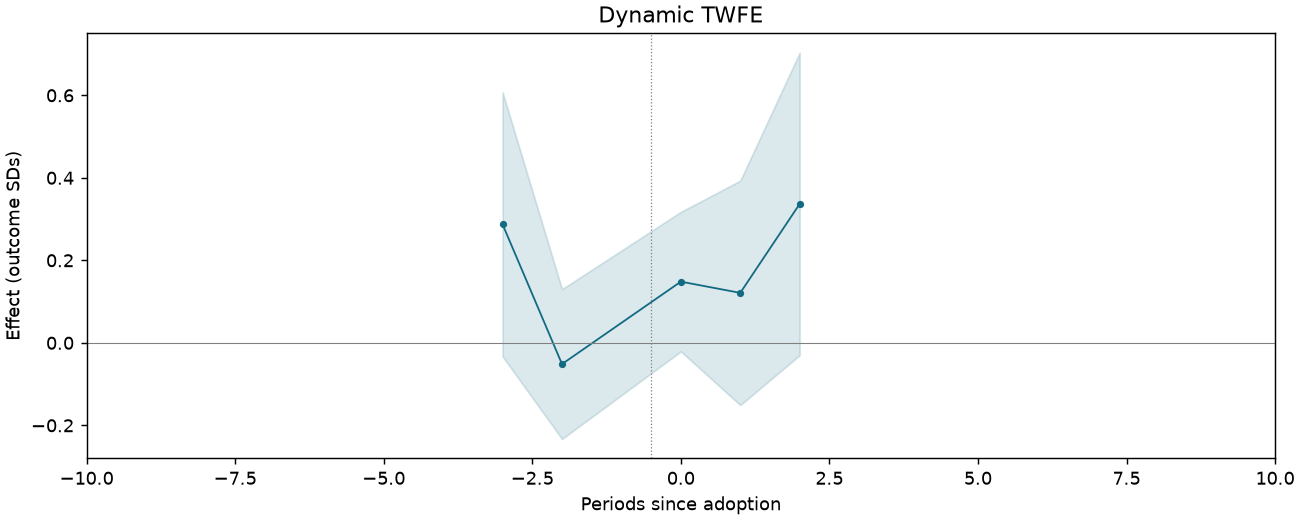
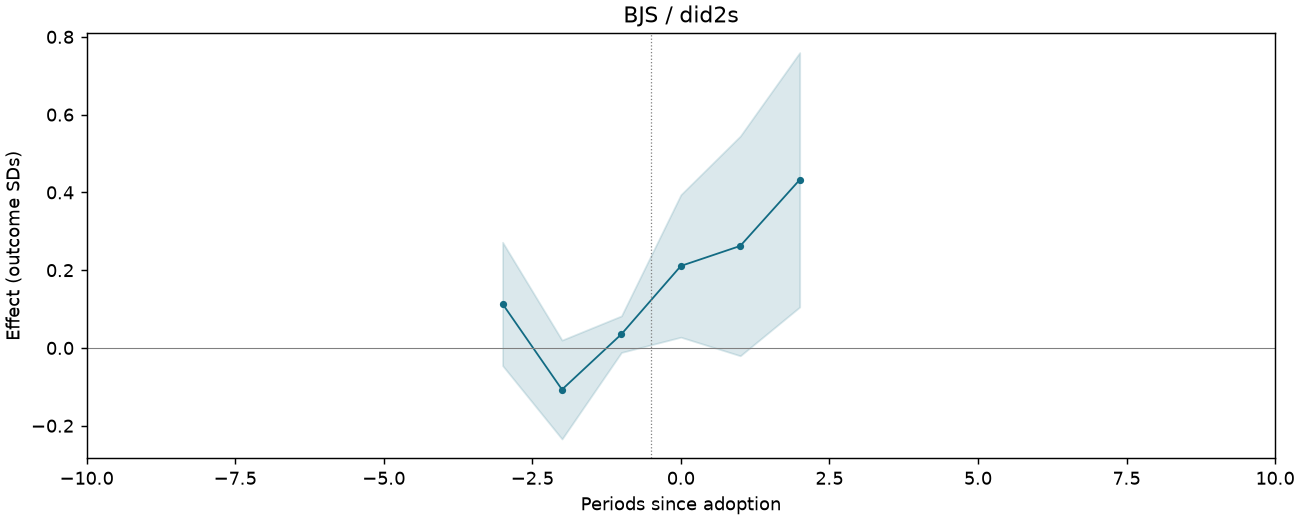
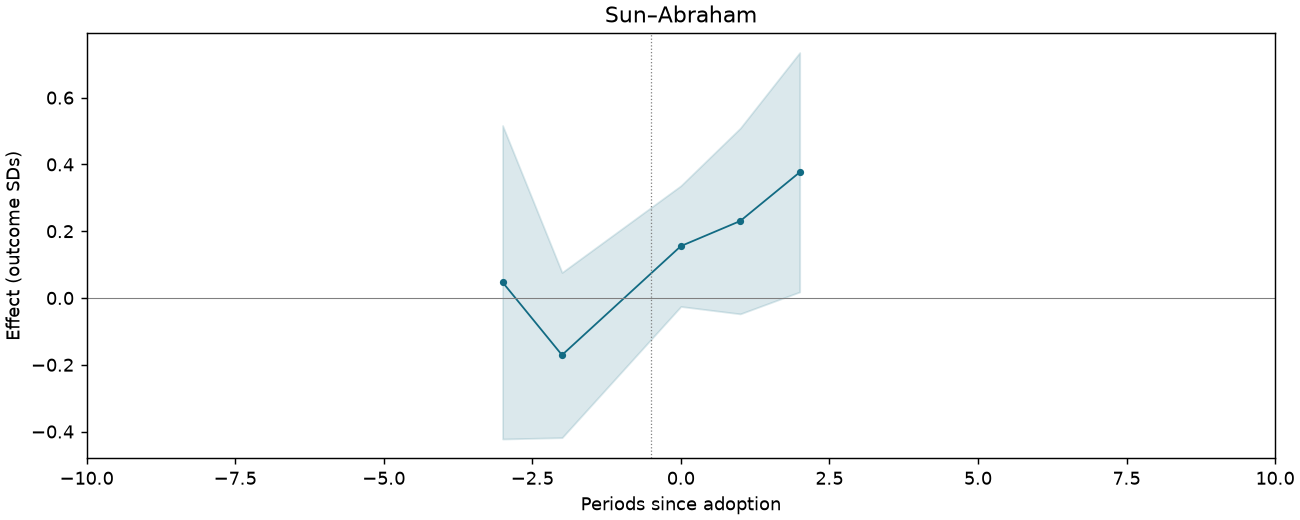
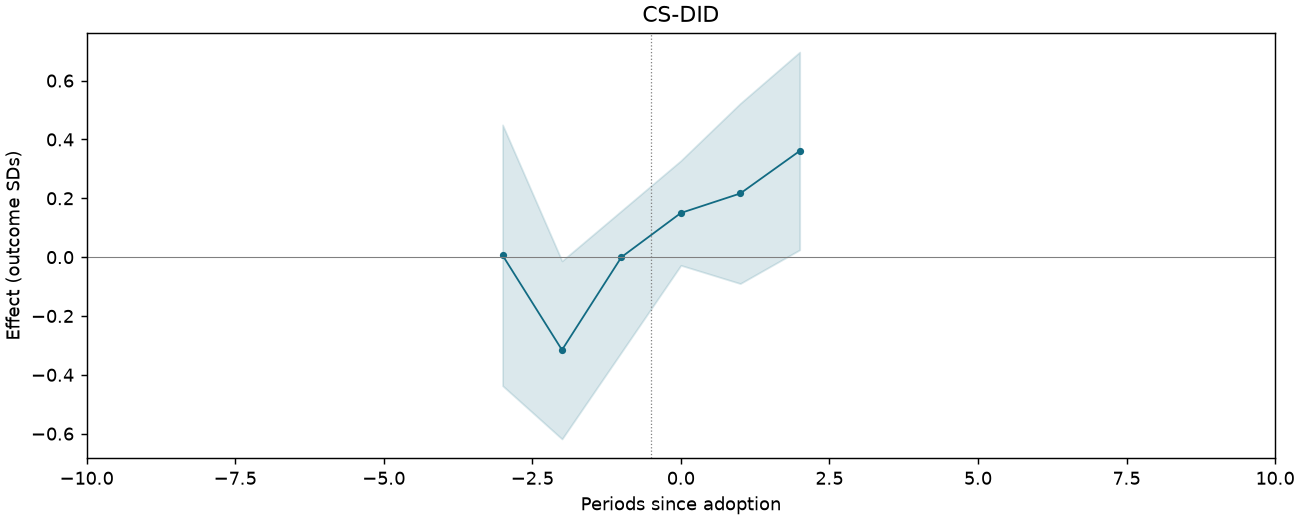
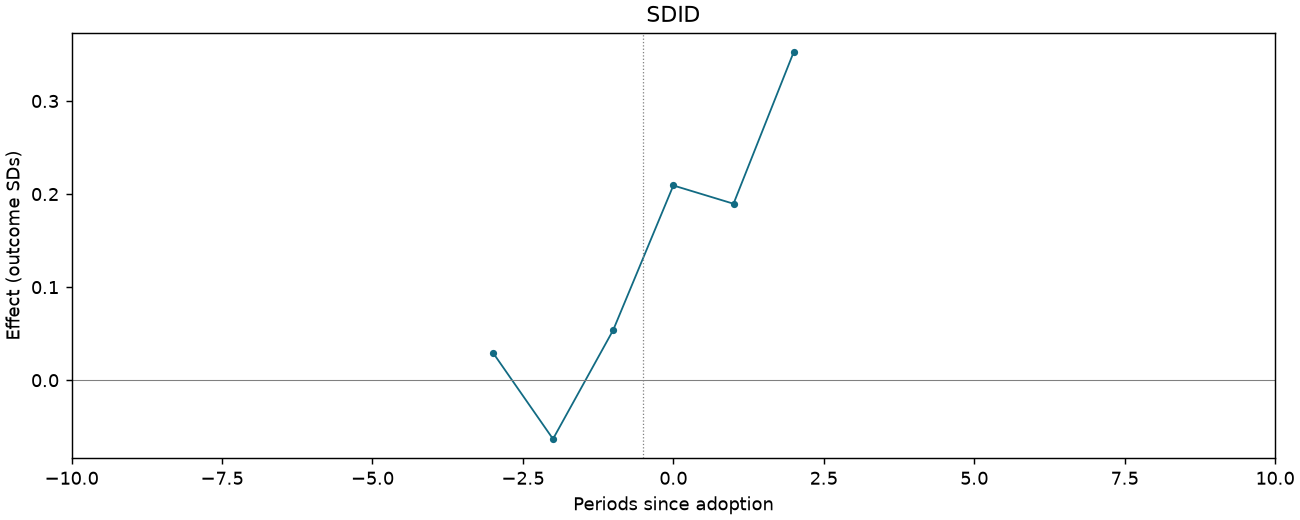
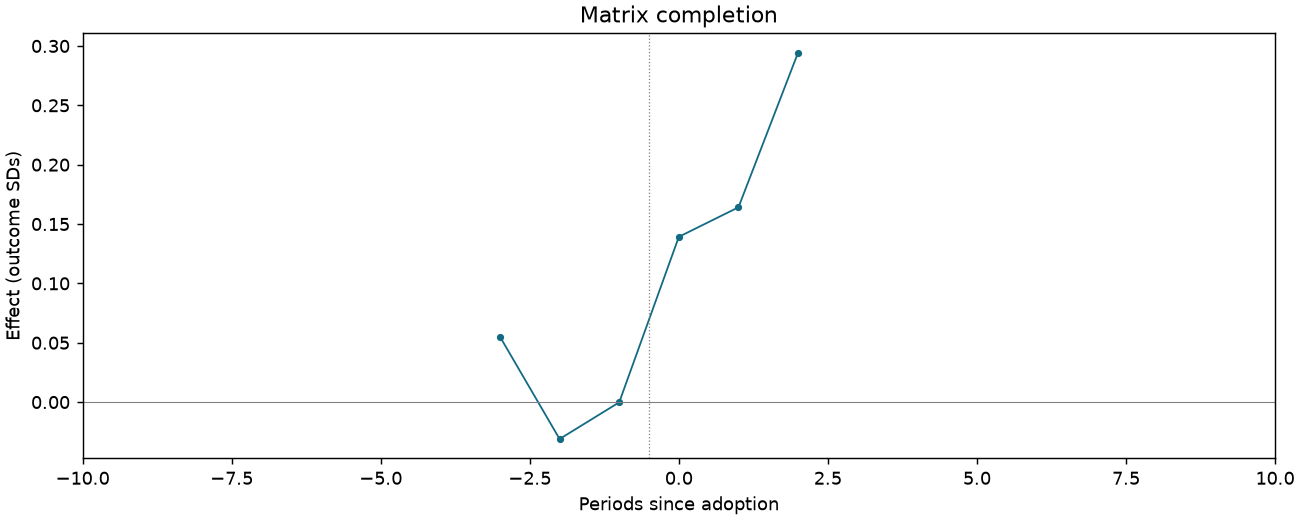
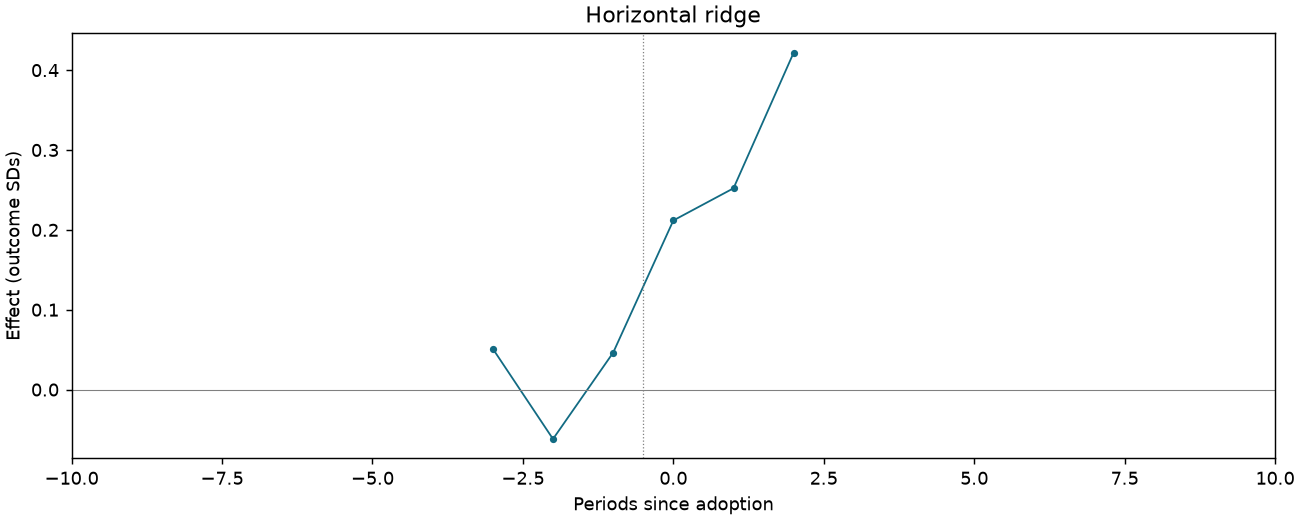
Teaching style z-score index
1,061 observations · 19 units · 19 clusters · 13 treated / 6 control units.
Estimate comparison
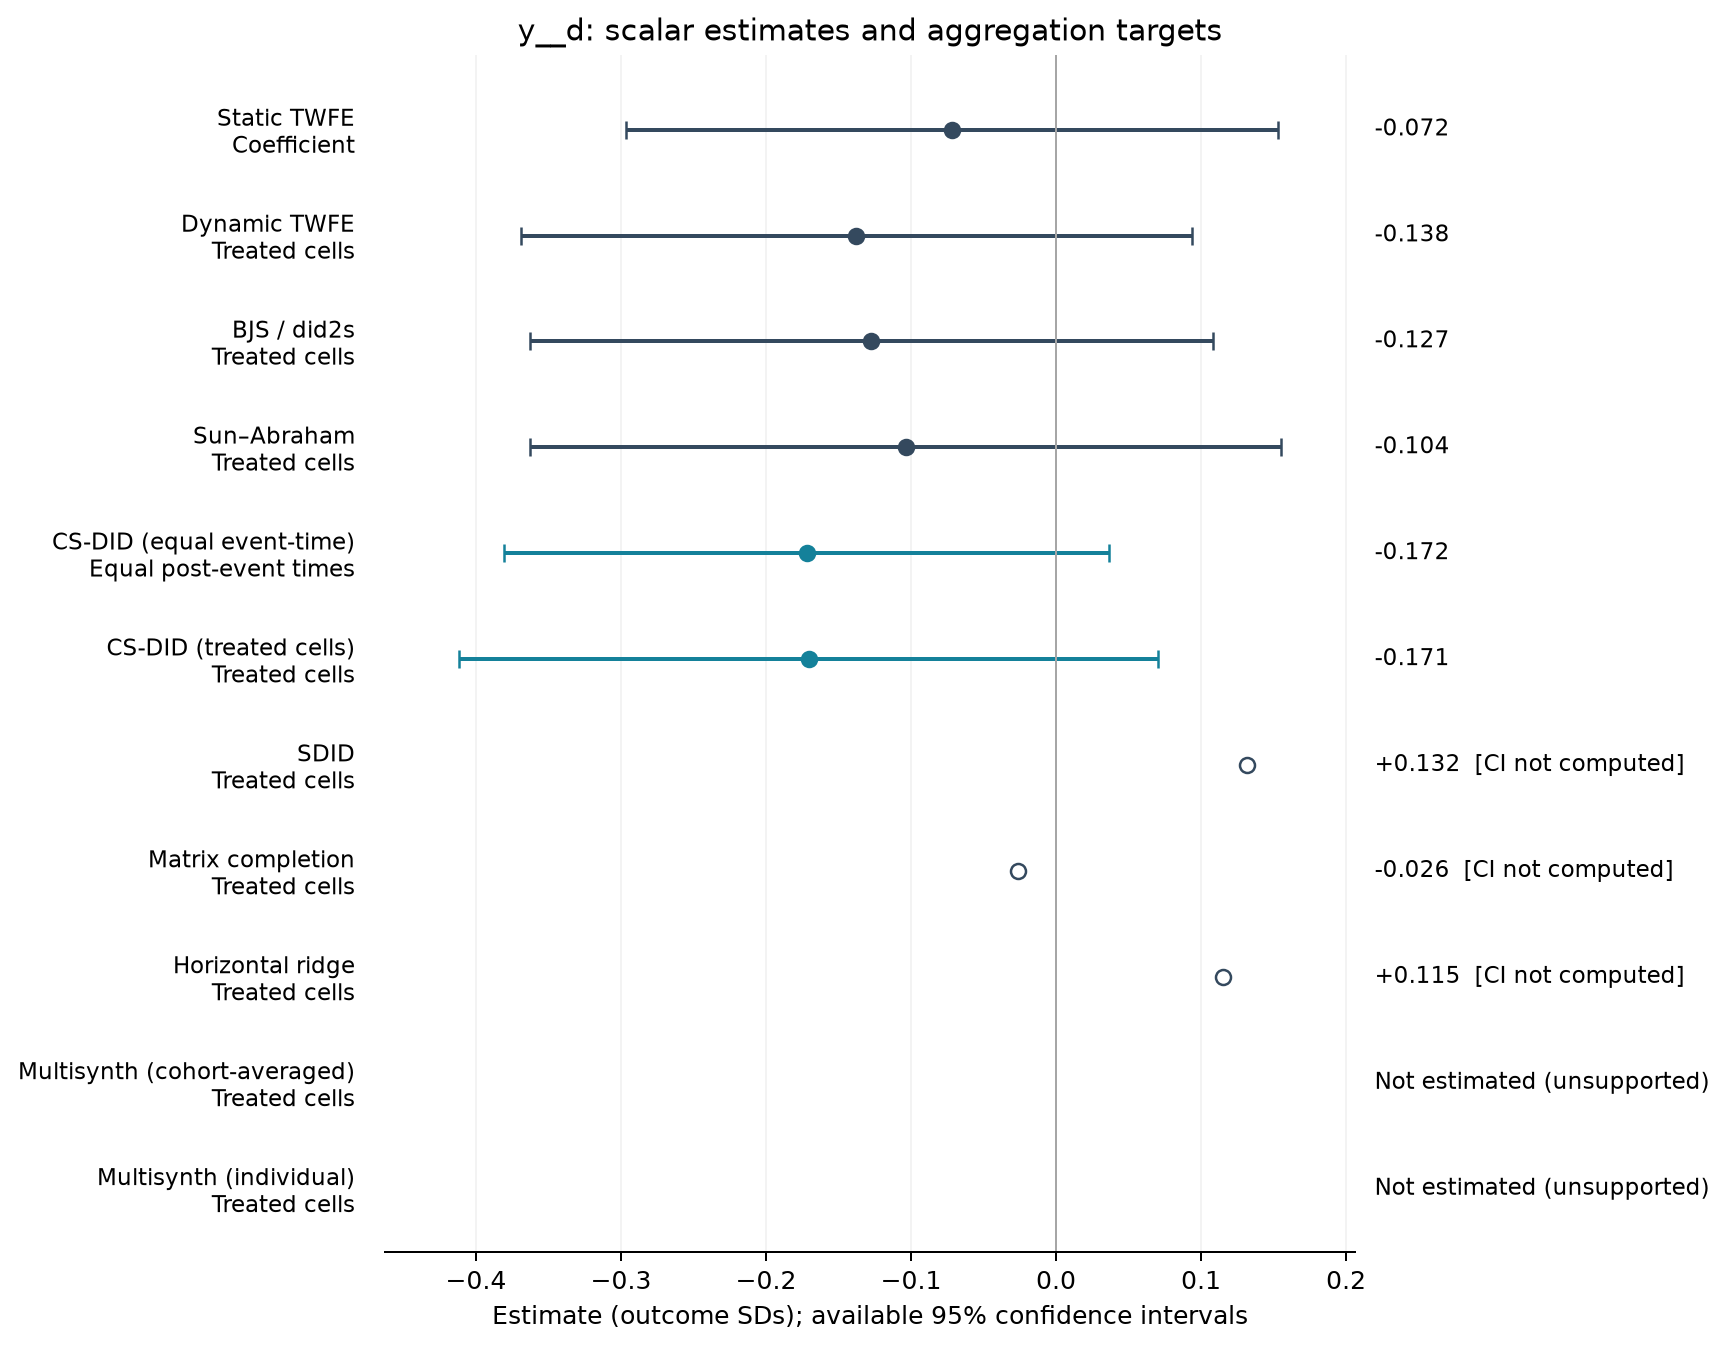
| Estimator | Estimate (SDs) | SE | 95% CI | Averaging |
|---|---|---|---|---|
| Static TWFE | -0.072 | 0.107 | [-0.296, 0.153] | Coefficient |
| Dynamic TWFE | -0.138 | 0.110 | [-0.369, 0.094] | Treated cells |
| BJS / did2s | -0.127 | 0.112 | [-0.363, 0.108] | Treated cells |
| Sun–Abraham | -0.104 | 0.123 | [-0.363, 0.155] | Treated cells |
| CS-DID (equal event-time) | -0.172 | 0.106 | [-0.380, 0.037] | Equal post-event times |
| CS-DID (treated cells) | -0.171 | 0.123 | [-0.412, 0.071] | Treated cells |
| SDID | 0.132 | — | — | Treated cells |
| Matrix completion | -0.026 | — | — | Treated cells |
| Horizontal ridge | 0.115 | — | — | Treated cells |
Event studies
Periods −10 to +10; pointwise 95% intervals where available.
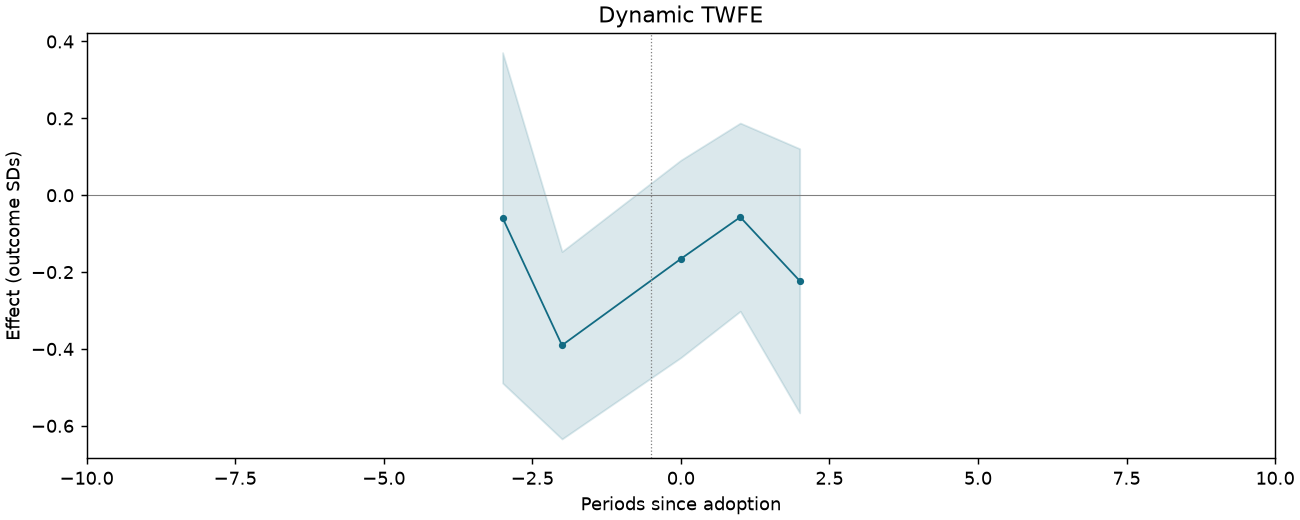
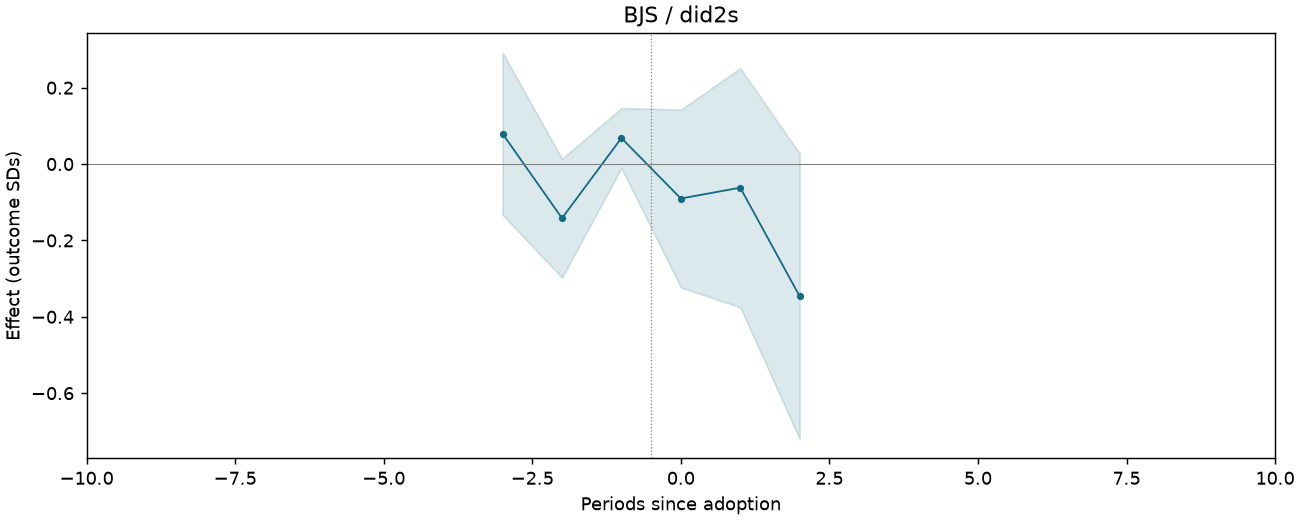
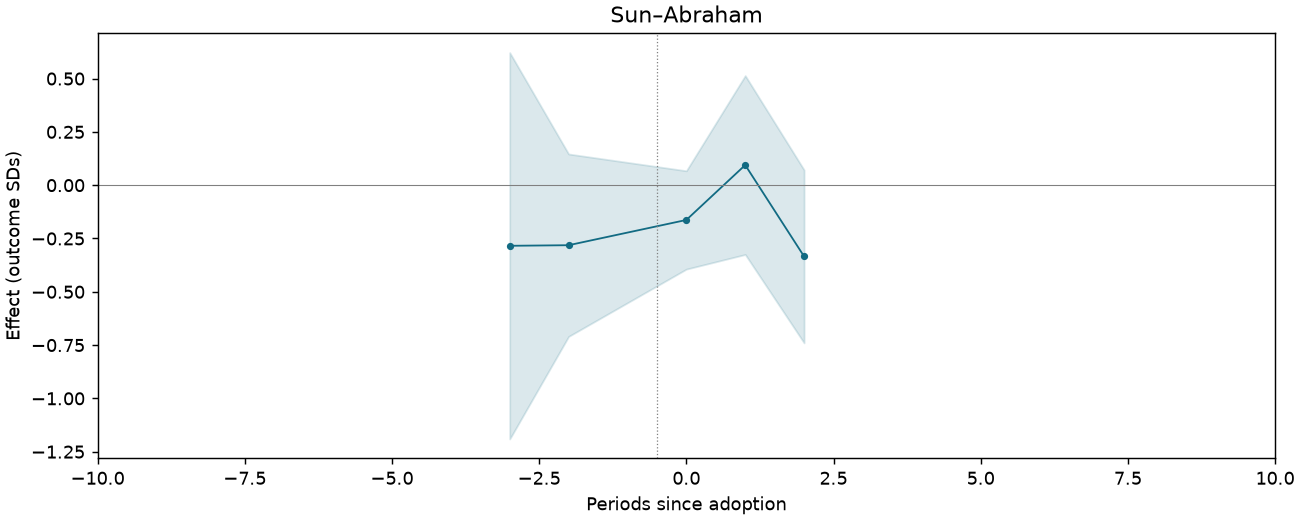
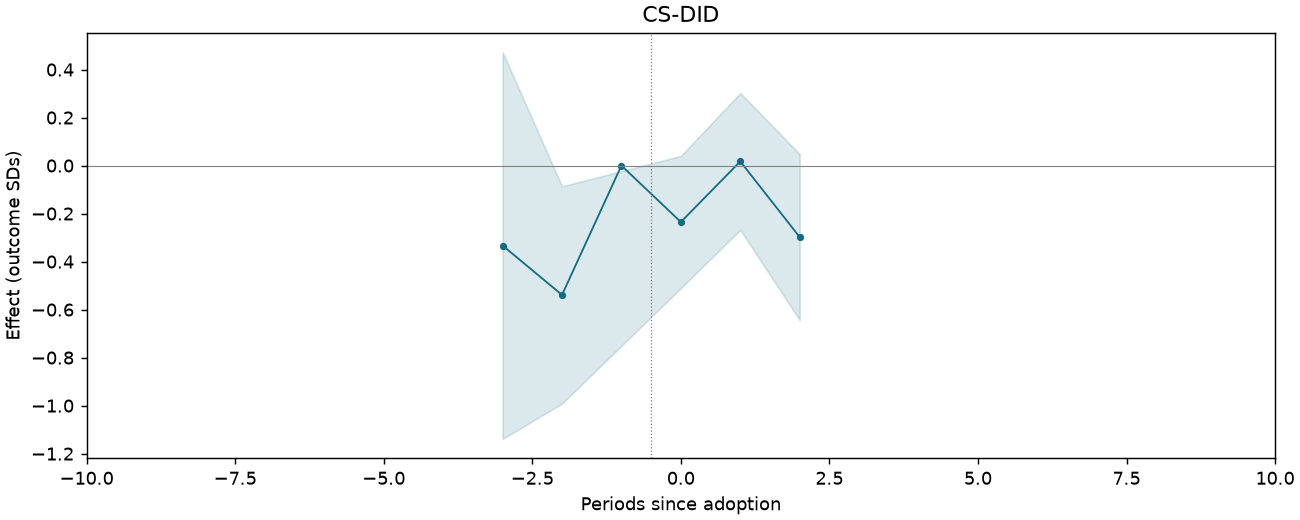
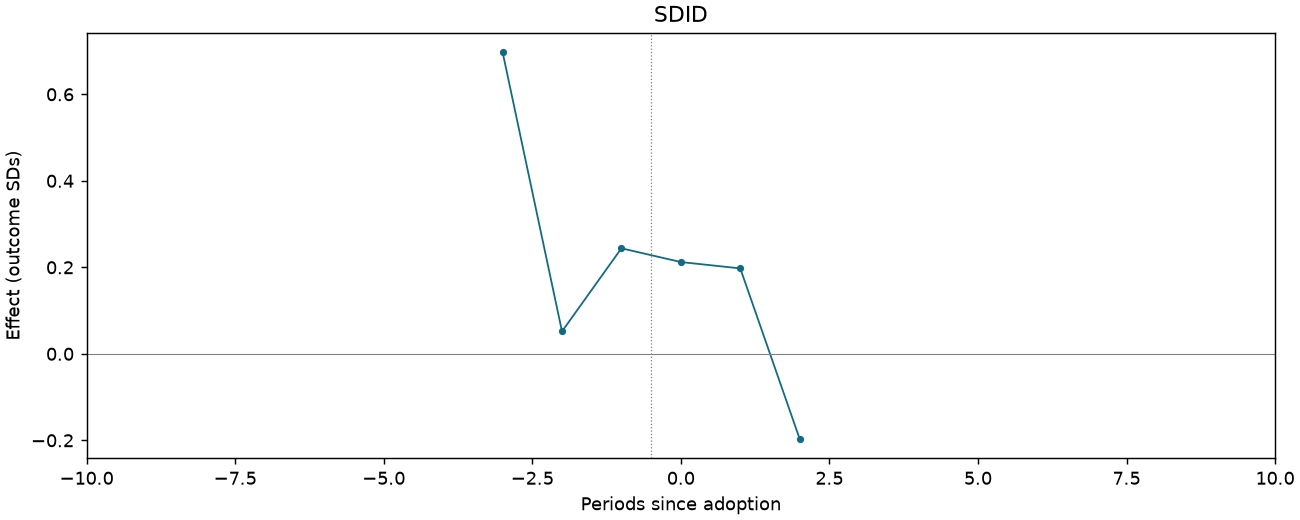
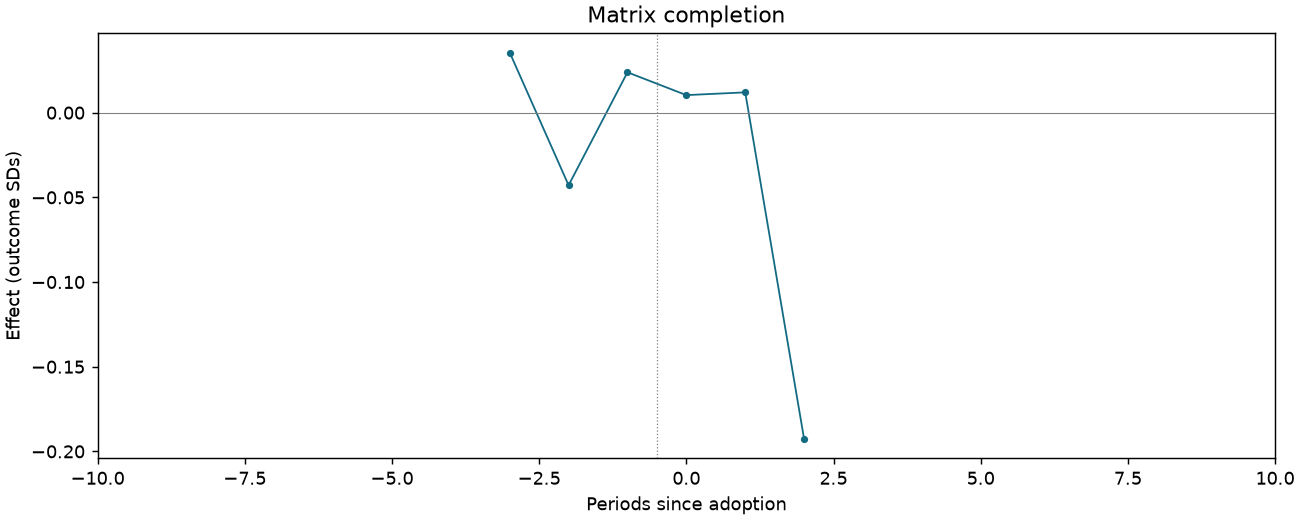
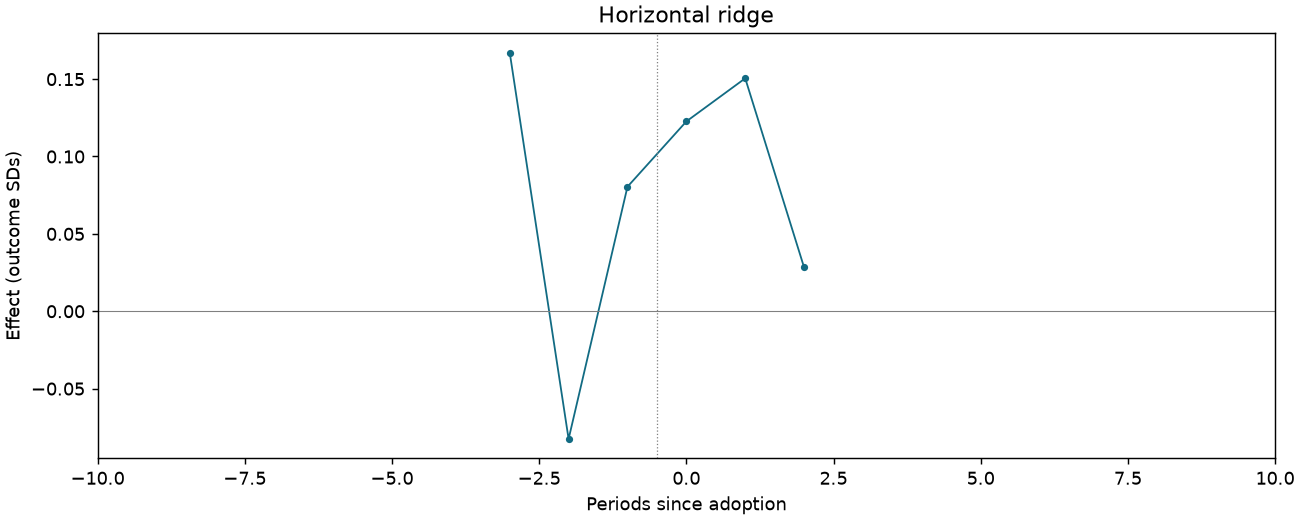
Teaching focused on gaokao
1,061 observations · 19 units · 19 clusters · 13 treated / 6 control units.
Estimate comparison
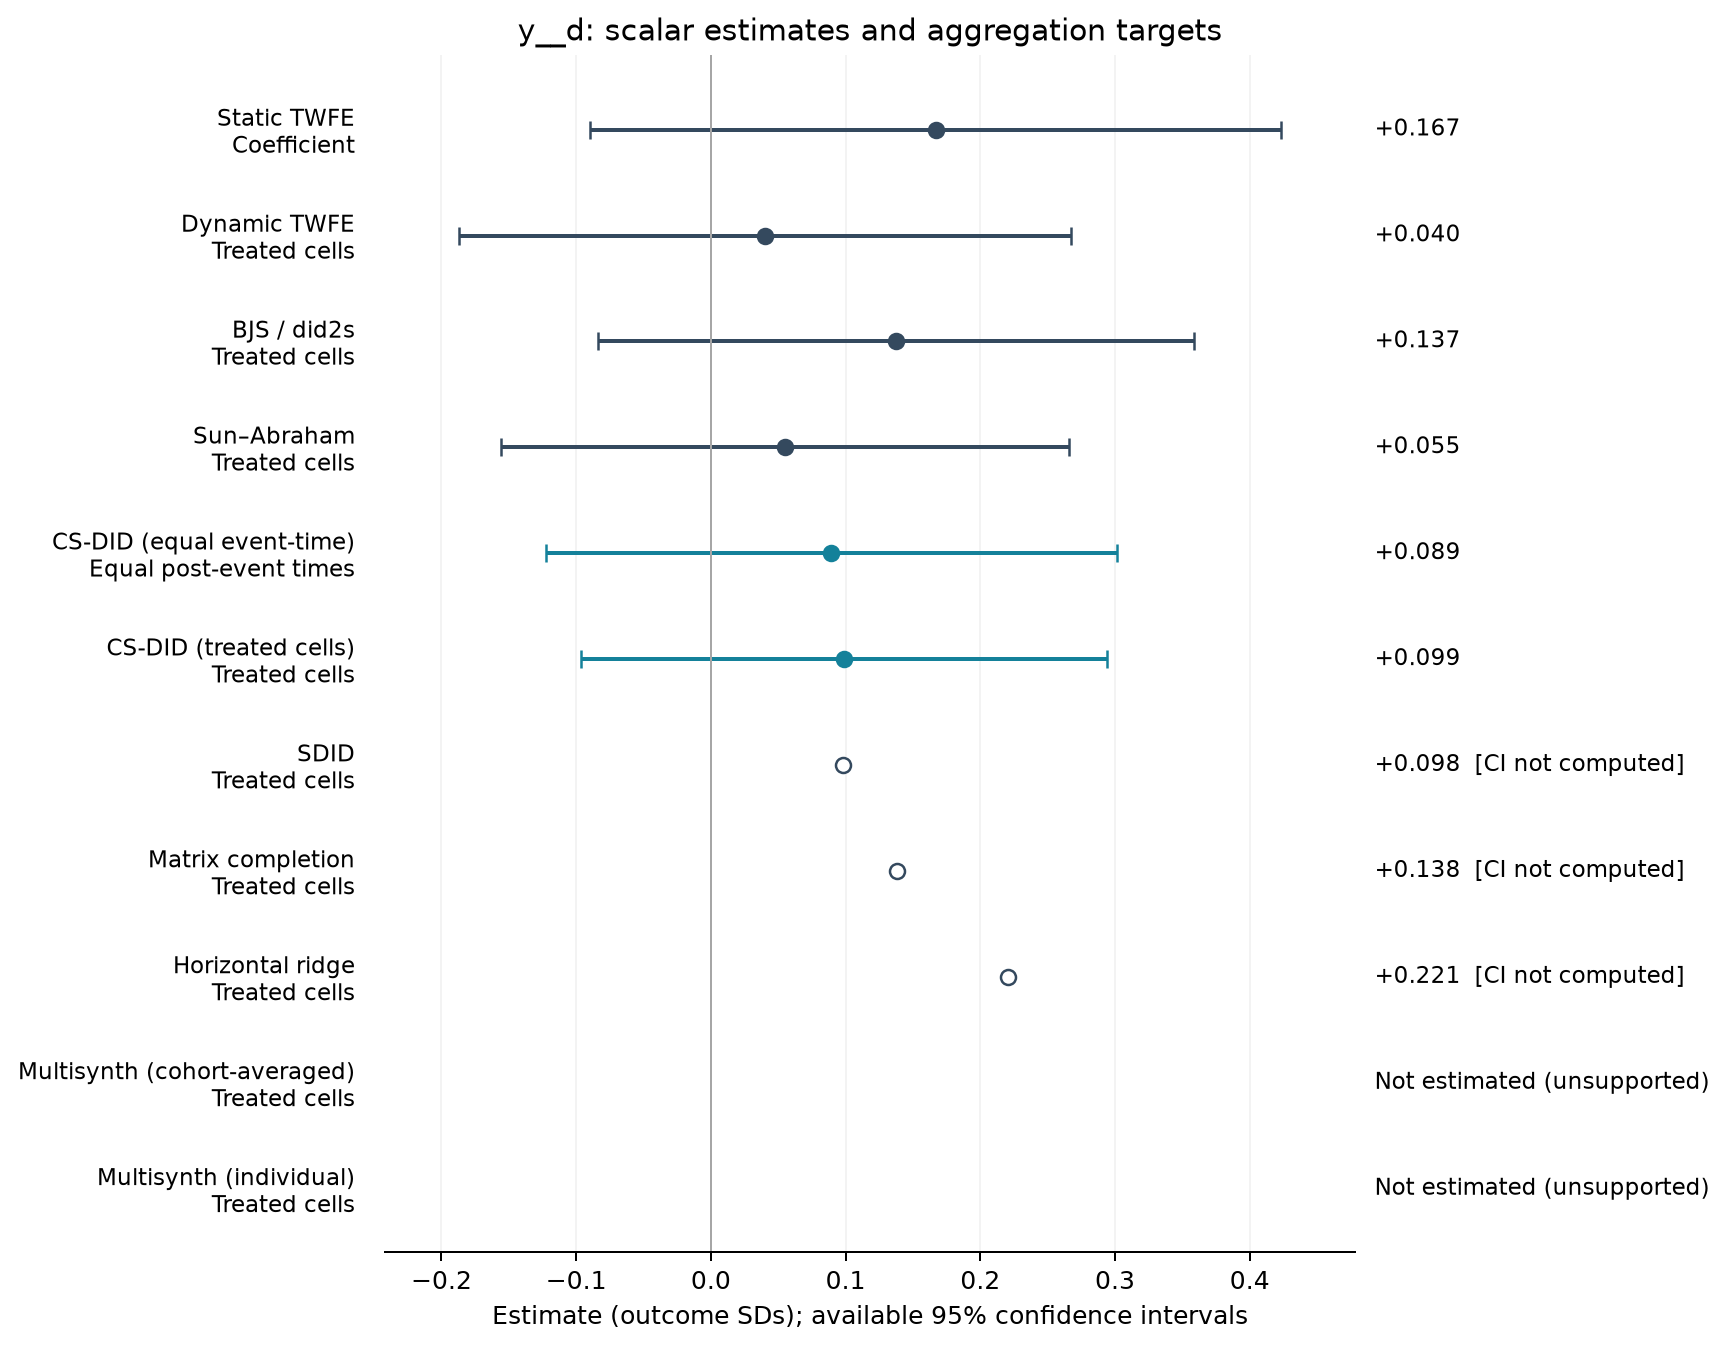
| Estimator | Estimate (SDs) | SE | 95% CI | Averaging |
|---|---|---|---|---|
| Static TWFE | 0.167 | 0.122 | [-0.089, 0.423] | Coefficient |
| Dynamic TWFE | 0.040 | 0.108 | [-0.187, 0.267] | Treated cells |
| BJS / did2s | 0.137 | 0.105 | [-0.084, 0.359] | Treated cells |
| Sun–Abraham | 0.055 | 0.100 | [-0.156, 0.266] | Treated cells |
| CS-DID (equal event-time) | 0.089 | 0.108 | [-0.123, 0.301] | Equal post-event times |
| CS-DID (treated cells) | 0.099 | 0.100 | [-0.096, 0.294] | Treated cells |
| SDID | 0.098 | — | — | Treated cells |
| Matrix completion | 0.138 | — | — | Treated cells |
| Horizontal ridge | 0.221 | — | — | Treated cells |
Event studies
Periods −10 to +10; pointwise 95% intervals where available.