The Rise of Fiscal Capacity — expanded estimators
Archive index · Regression tests · Results & settings (JSON) · Methods & code
Cantoni et al. (2024), ECMA. https://doi.org/10.3982/ECTA20612
14 specifications. Effects are in outcome standard deviations; intervals are 95%.
Treatment adoption

S18-P003: seeded sample of 10 of 10 eligible units. Purple untreated; yellow treated; white unobserved.
FISCAL-F1B-SIZE
101,998 observations · 618 units · 618 clusters · 30 treated / 588 control units.
Estimate comparison
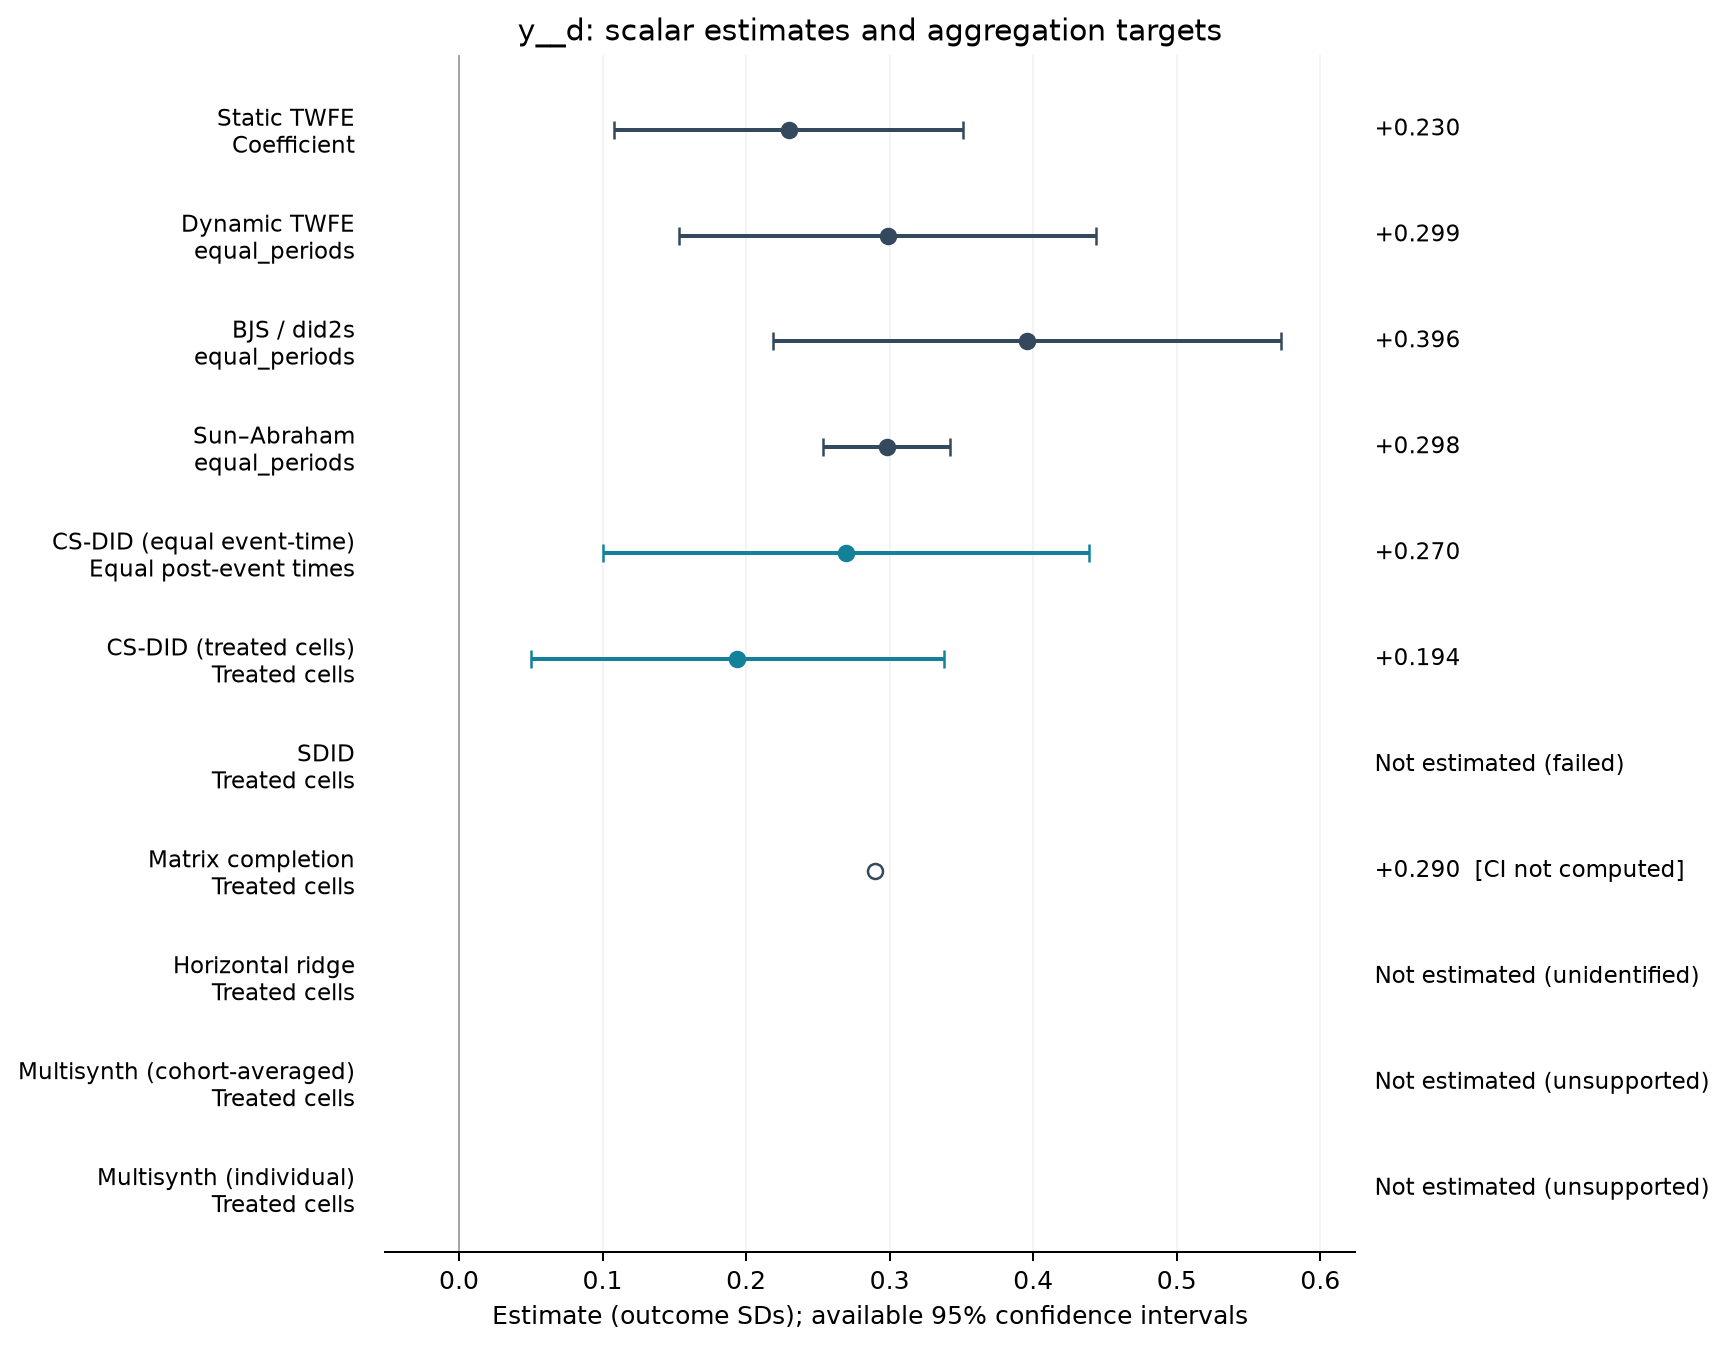
| Estimator | Estimate (SDs) | SE | 95% CI | Averaging |
|---|---|---|---|---|
| Static TWFE | 0.230 | 0.062 | [0.108, 0.351] | Coefficient |
| Dynamic TWFE | 0.299 | 0.074 | [0.153, 0.444] | equal_periods |
| BJS / did2s | 0.396 | 0.090 | [0.219, 0.573] | equal_periods |
| Sun–Abraham | 0.298 | 0.022 | [0.254, 0.342] | equal_periods |
| CS-DID (equal event-time) | 0.270 | 0.086 | [0.100, 0.439] | Equal post-event times |
| CS-DID (treated cells) | 0.194 | 0.073 | [0.050, 0.338] | Treated cells |
| Matrix completion | 0.290 | — | — | Treated cells |
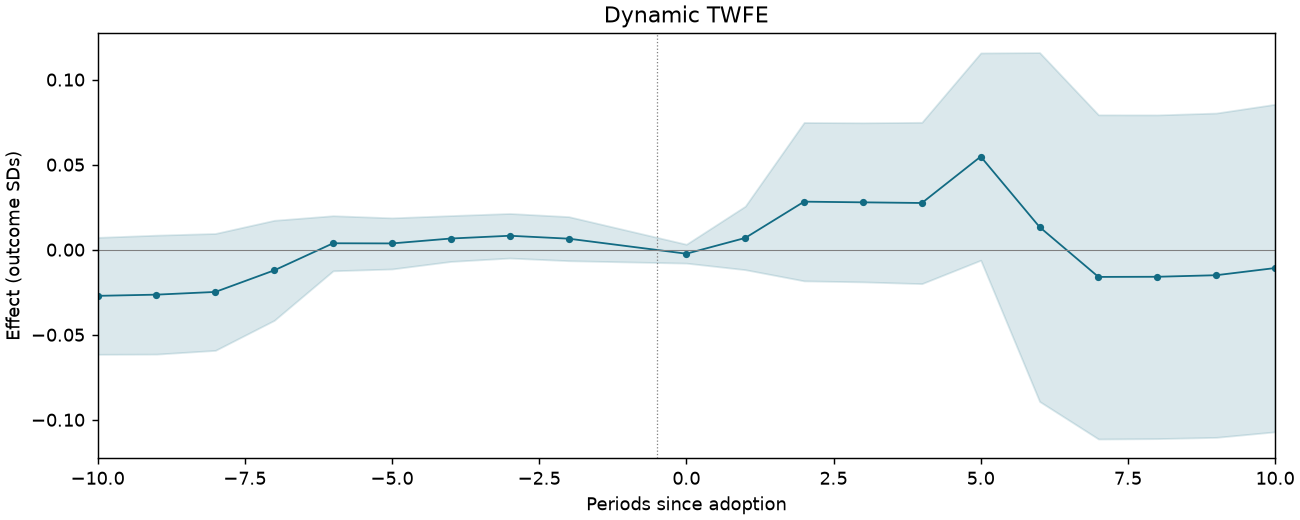
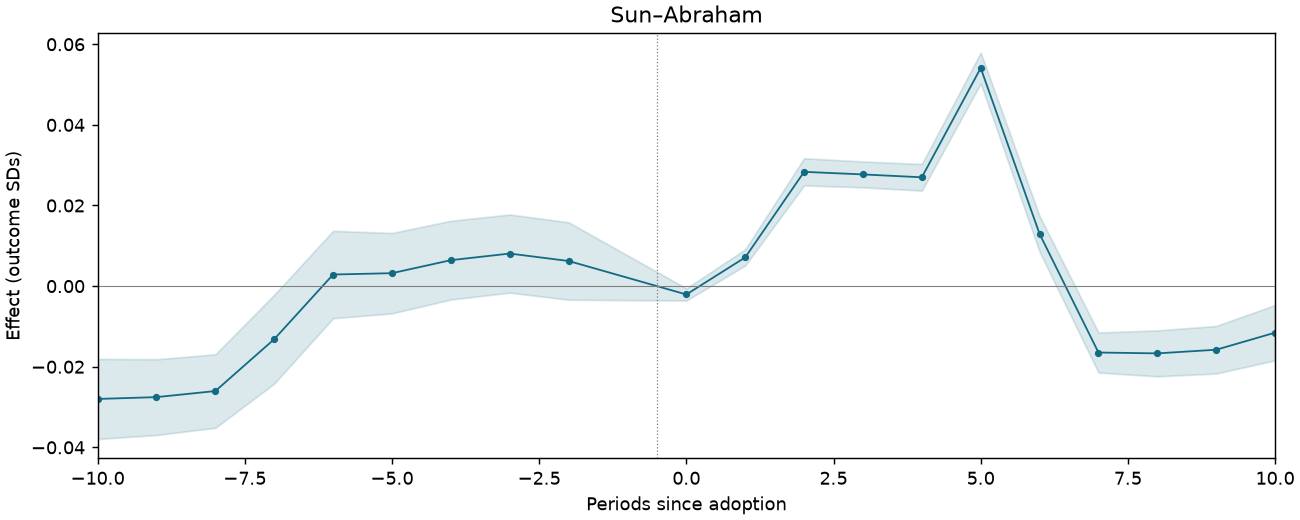
Event studies
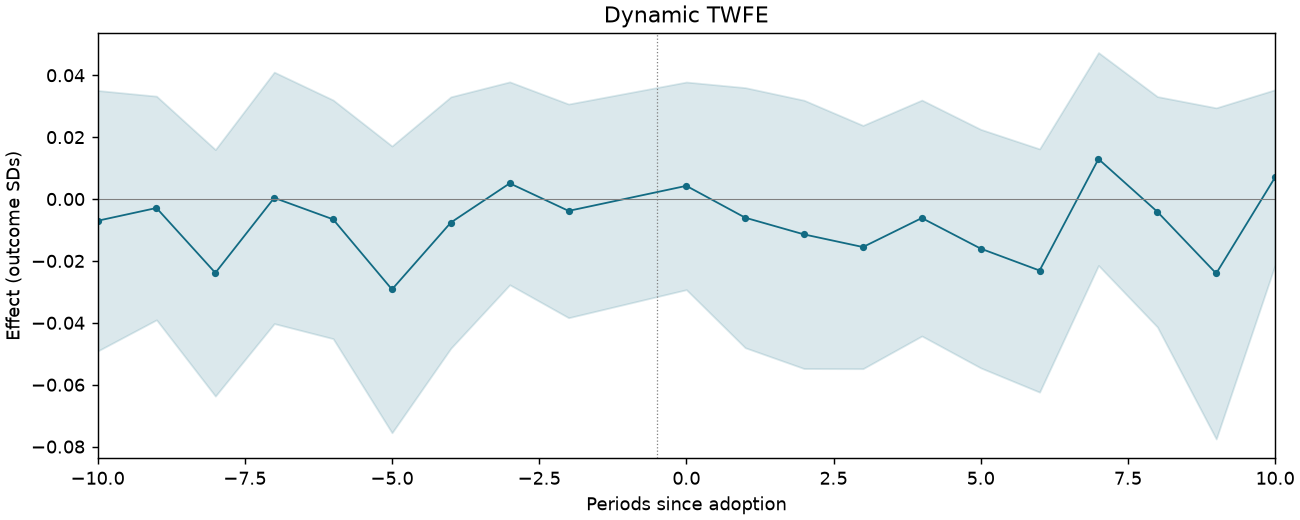
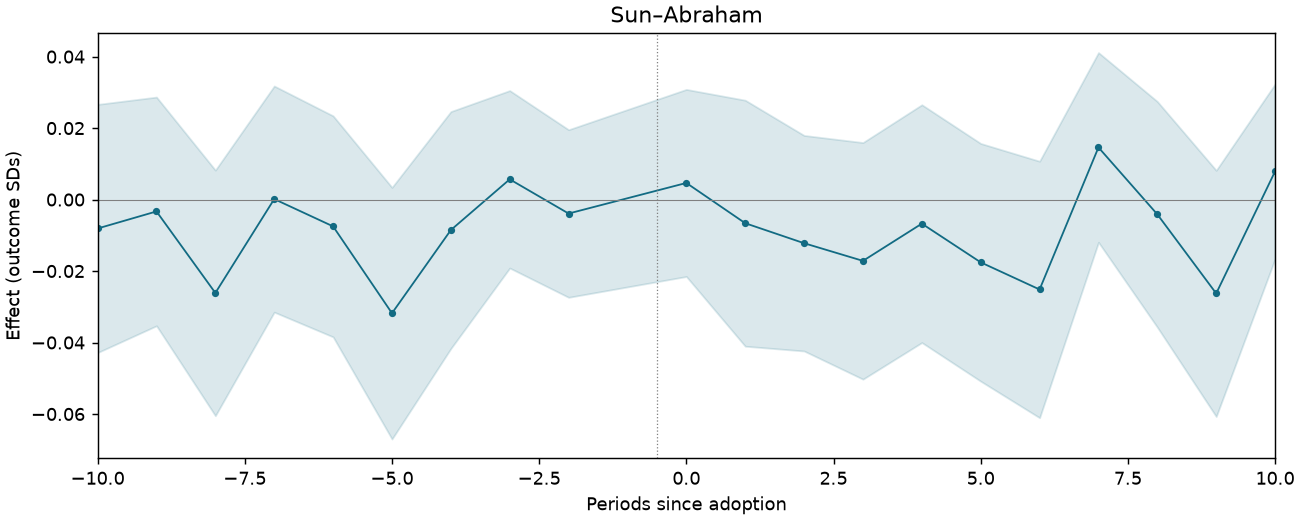
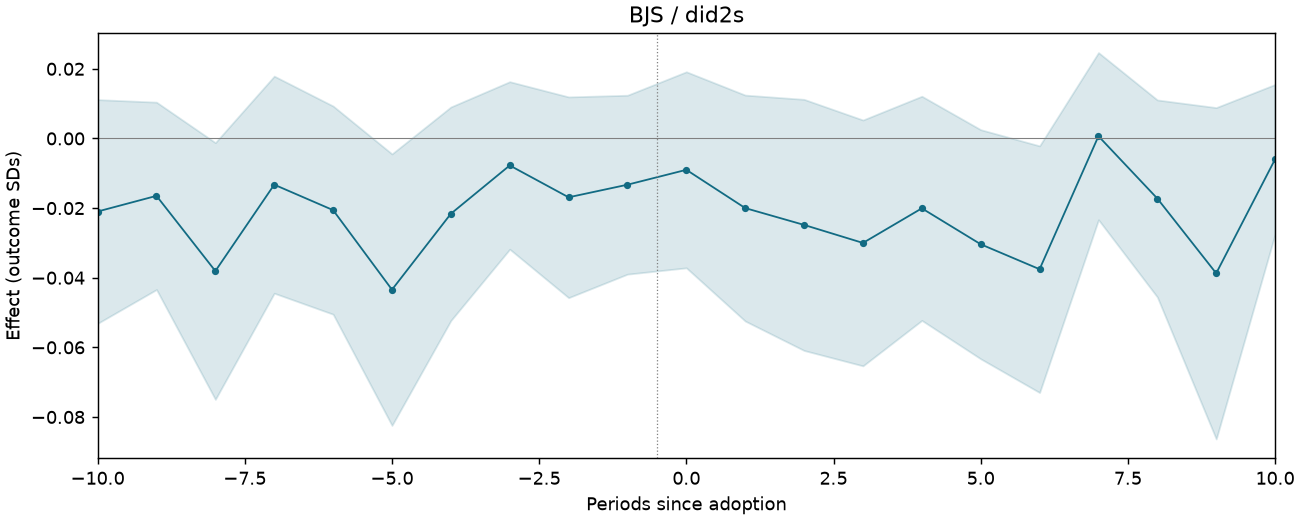
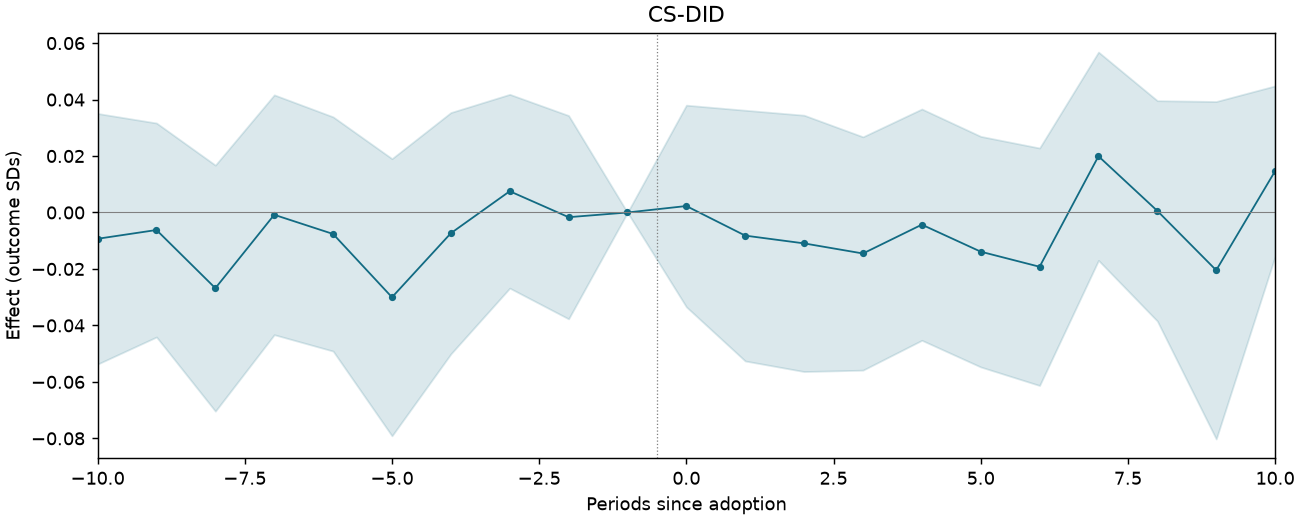
Periods −10 to +10; pointwise 95% intervals where available.
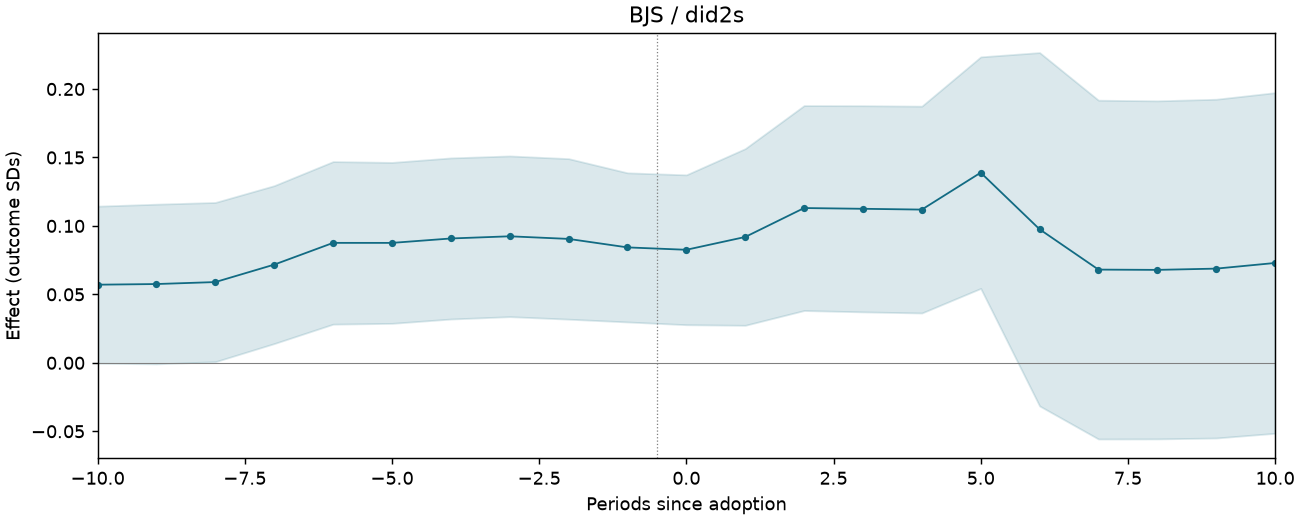
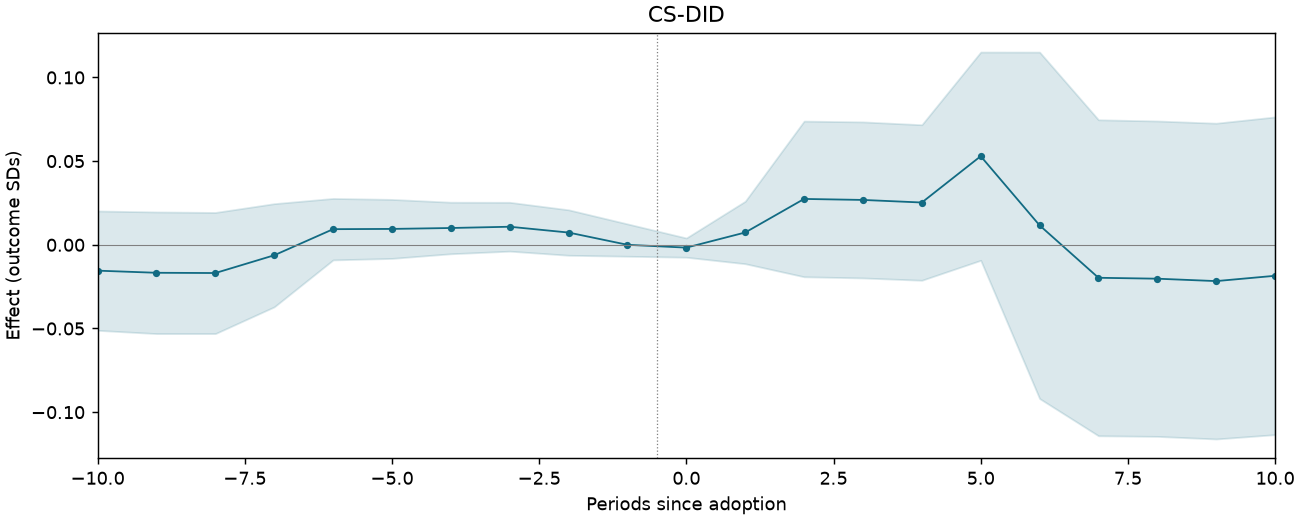
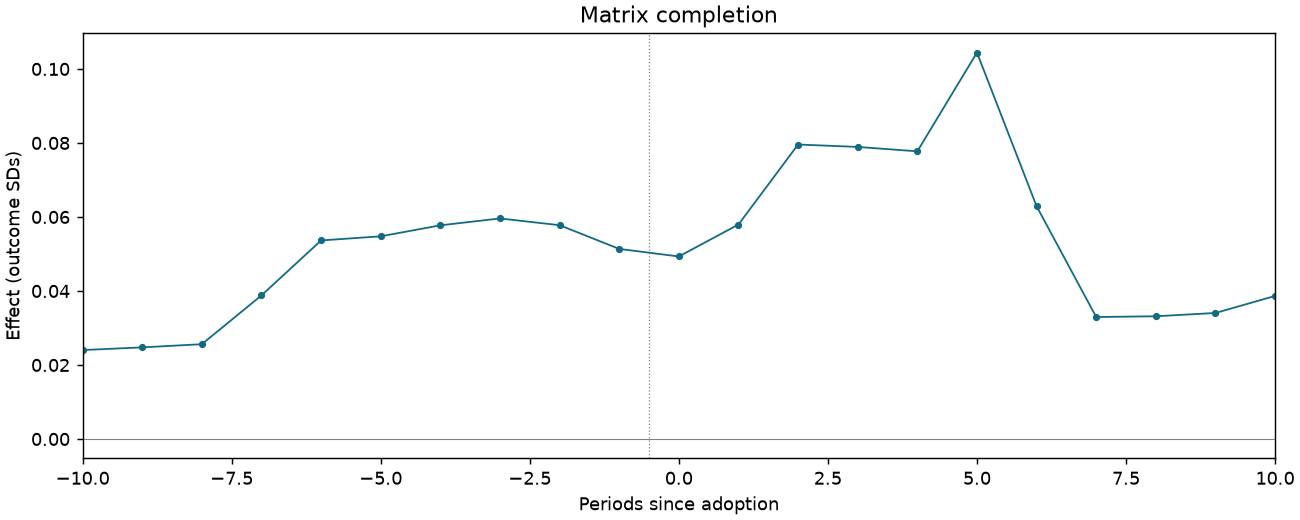
FISCAL-F2A-COMPACT-TERRITORY
101,998 observations · 618 units · 618 clusters · 30 treated / 588 control units.
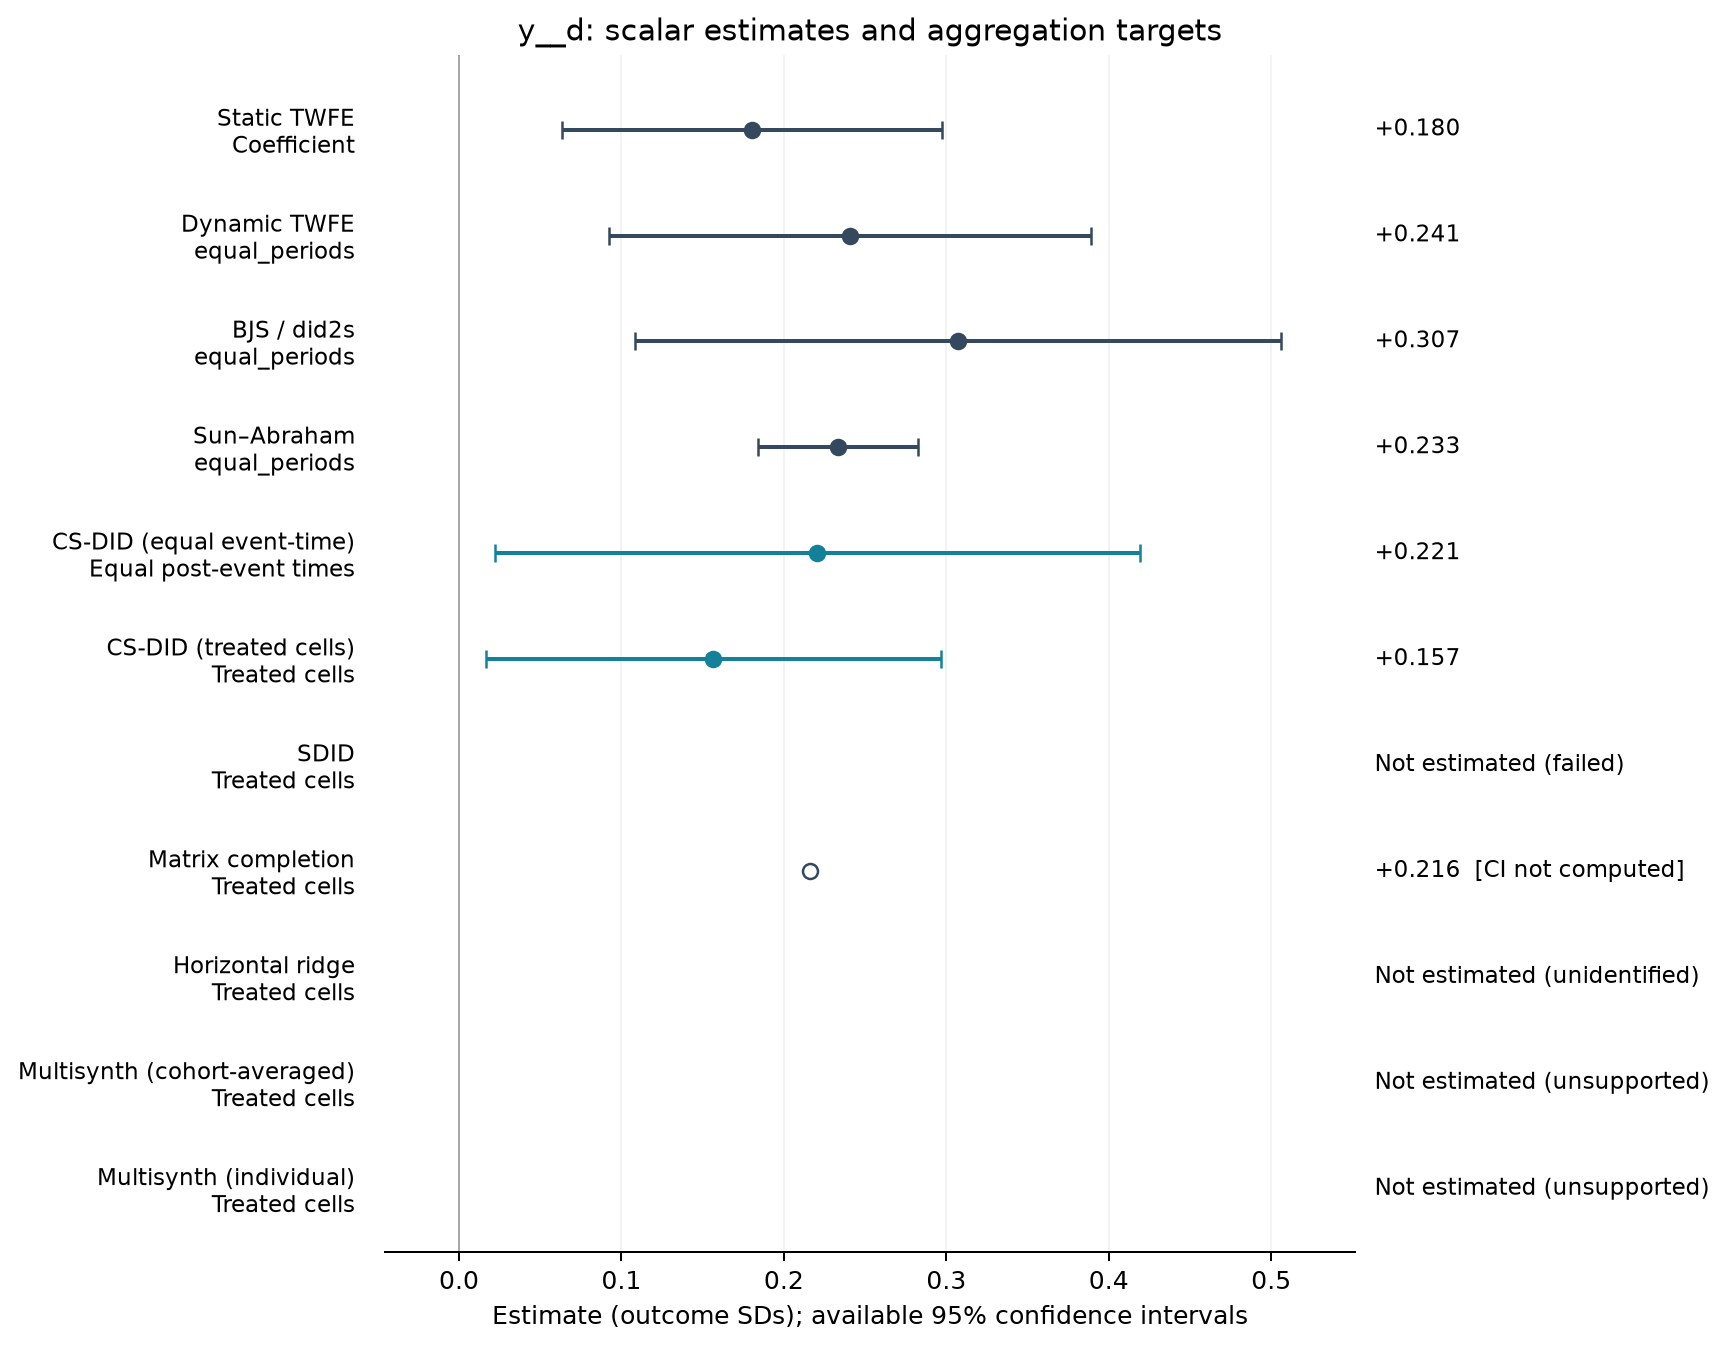
Estimate comparison
| Estimator | Estimate (SDs) | SE | 95% CI | Averaging |
|---|---|---|---|---|
| Static TWFE | 0.180 | 0.059 | [0.063, 0.297] | Coefficient |
| Dynamic TWFE | 0.241 | 0.076 | [0.092, 0.389] | equal_periods |
| BJS / did2s | 0.307 | 0.101 | [0.108, 0.506] | equal_periods |
| Sun–Abraham | 0.233 | 0.025 | [0.184, 0.283] | equal_periods |
| CS-DID (equal event-time) | 0.221 | 0.101 | [0.022, 0.419] | Equal post-event times |
| CS-DID (treated cells) | 0.157 | 0.072 | [0.016, 0.297] | Treated cells |
| Matrix completion | 0.216 | — | — | Treated cells |
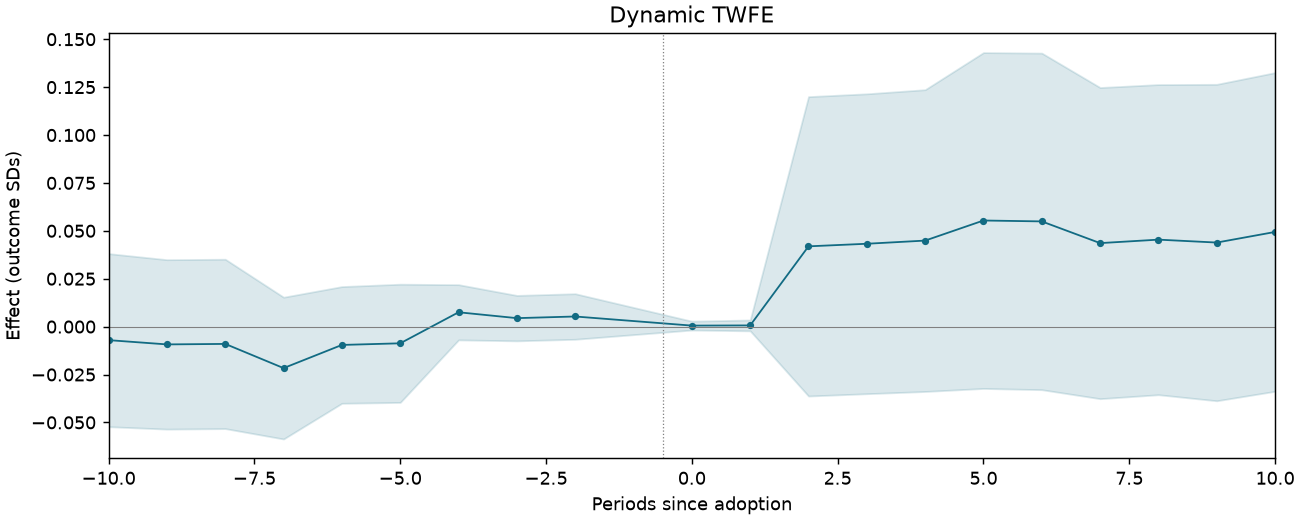
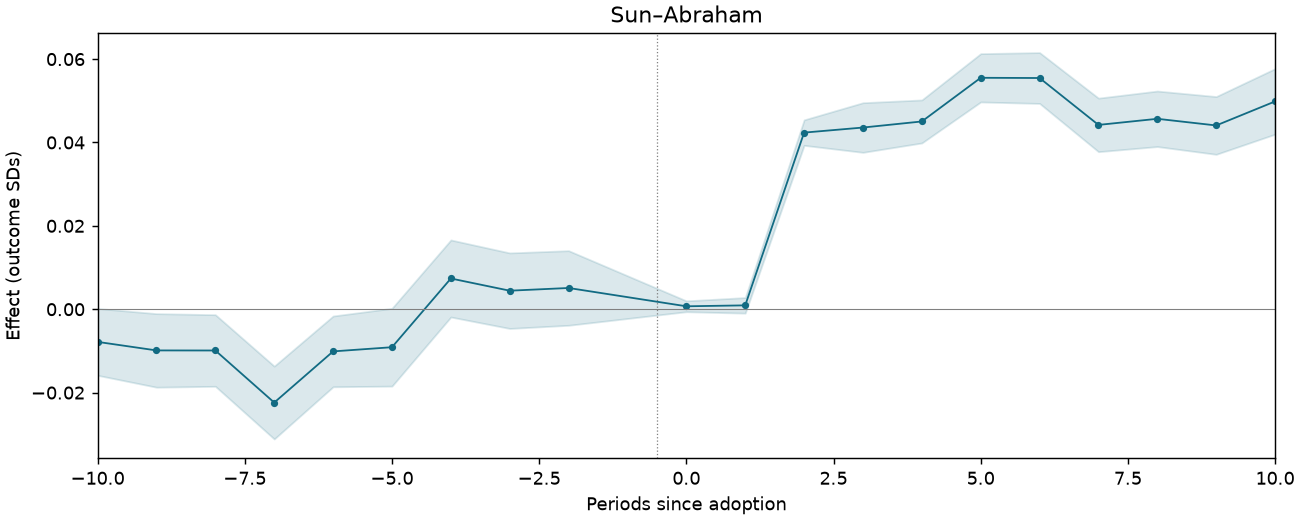
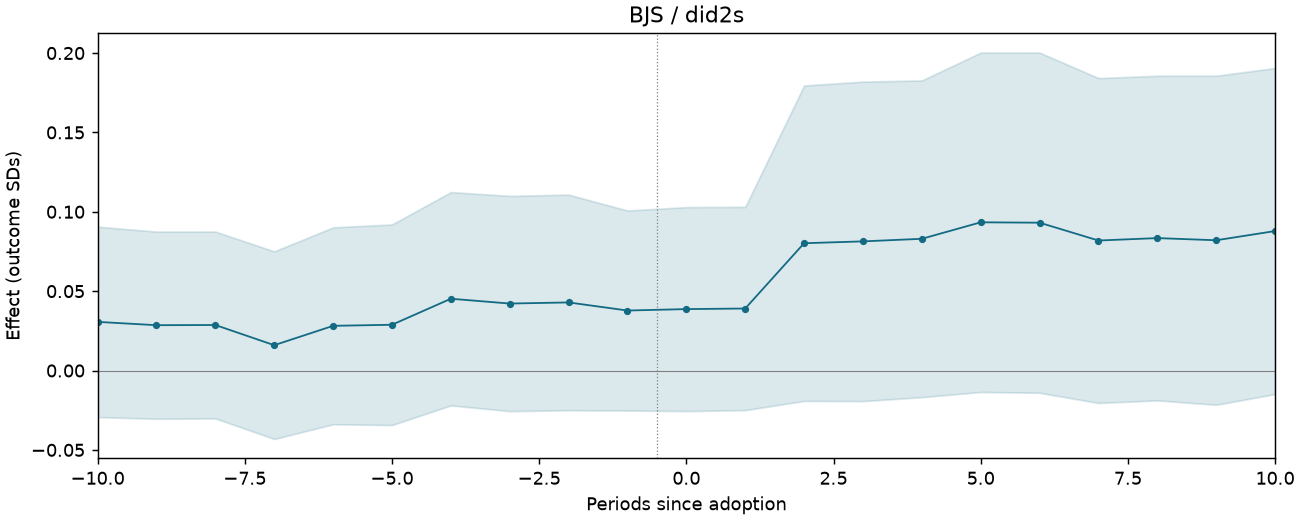
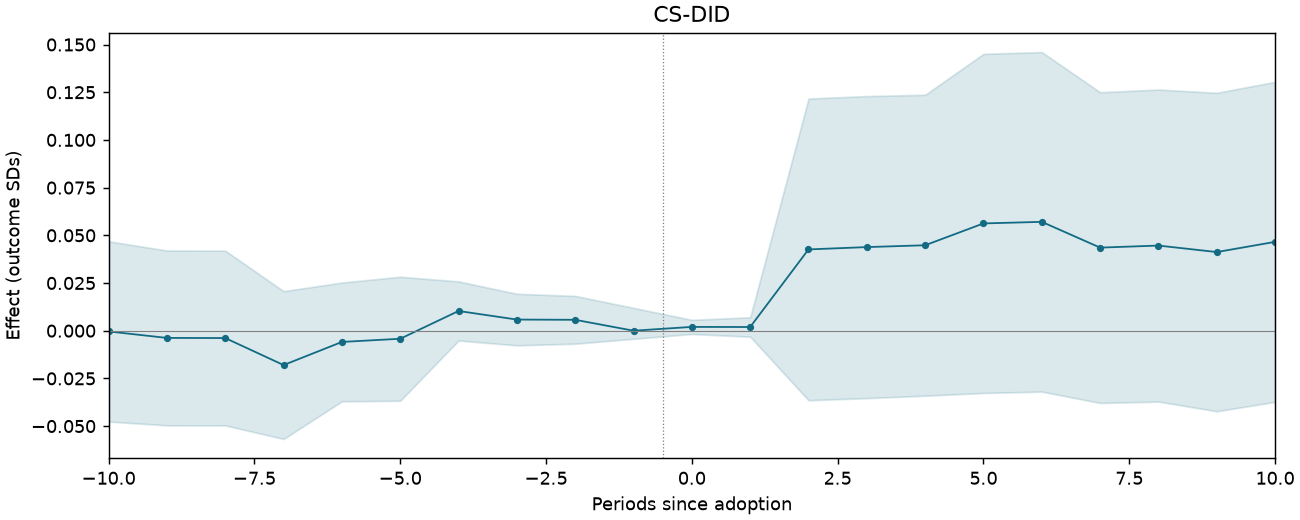
Event studies
Periods −10 to +10; pointwise 95% intervals where available.
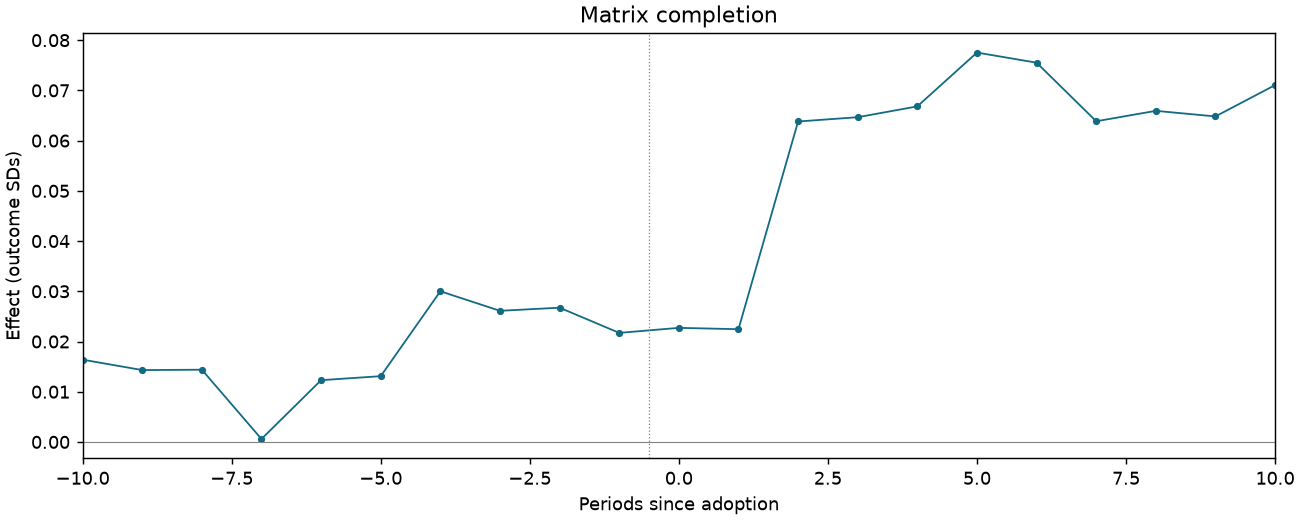
FISCAL-F5A-MARRIAGE-RULERS
1,198 observations · 10 units · 10 clusters · 6 treated / 4 control units.
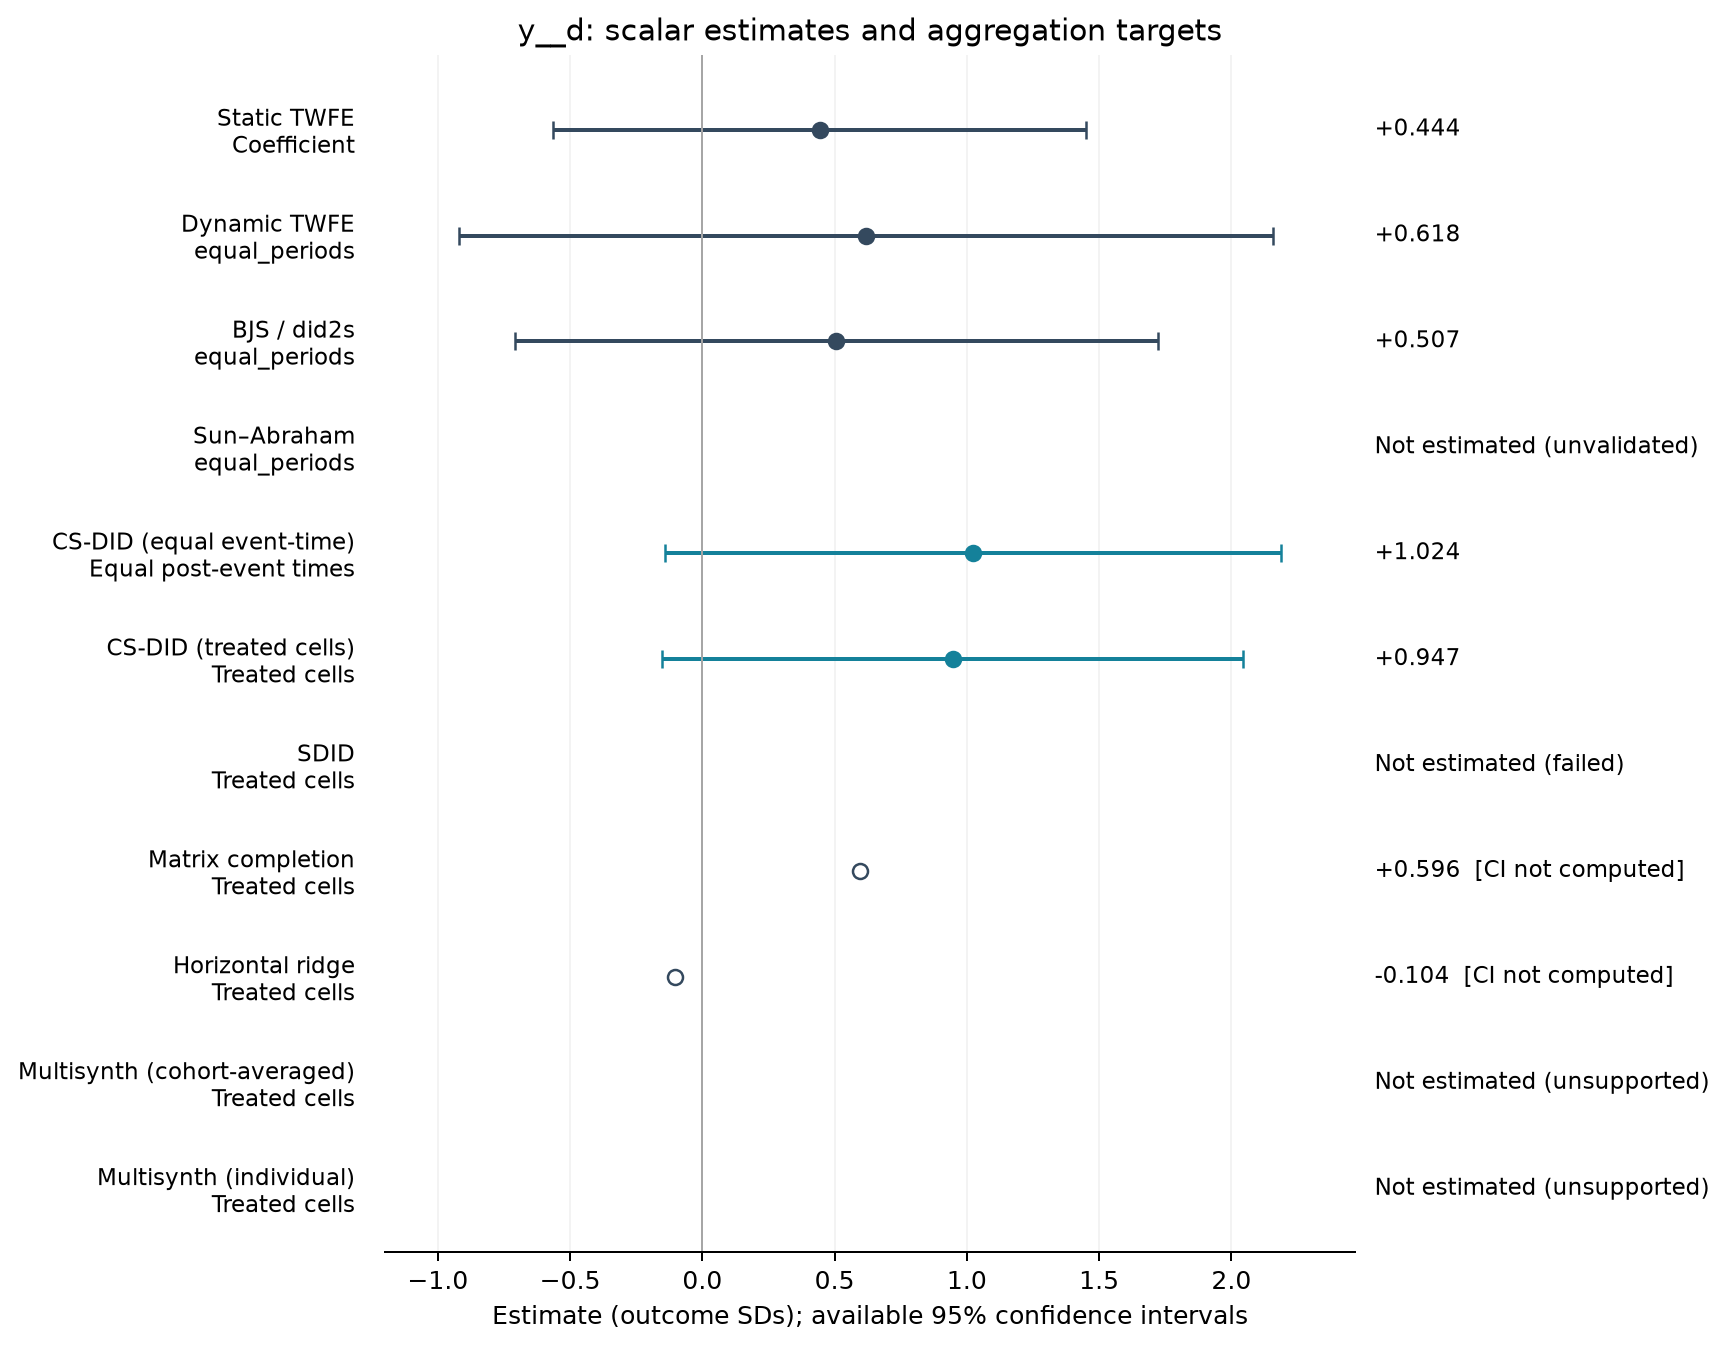
Estimate comparison
| Estimator | Estimate (SDs) | SE | 95% CI | Averaging |
|---|---|---|---|---|
| Static TWFE | 0.444 | 0.446 | [-0.564, 1.452] | Coefficient |
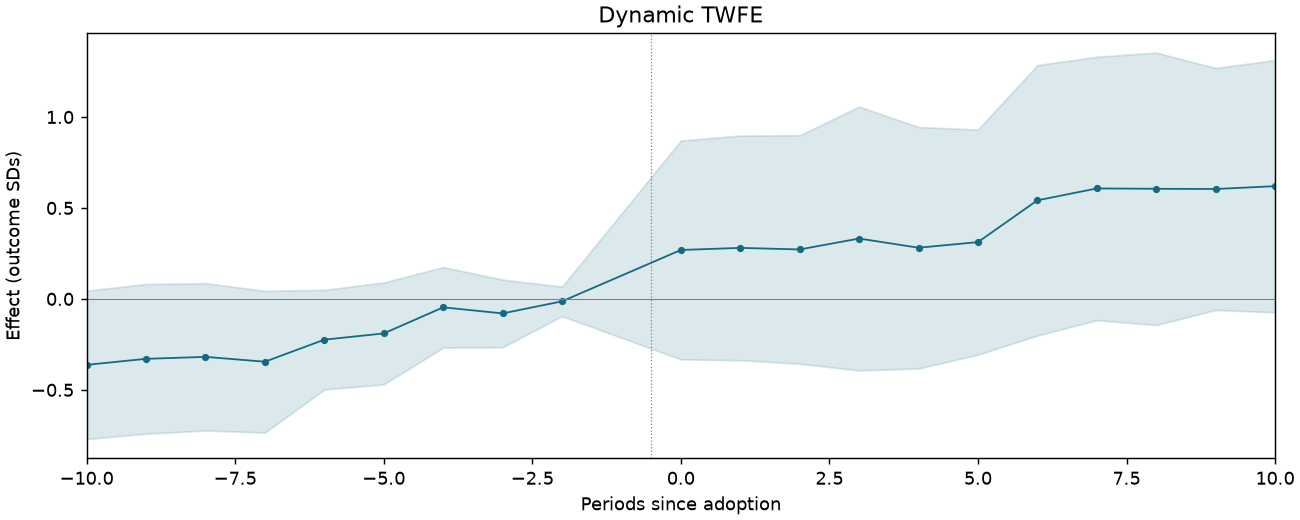
| Dynamic TWFE | 0.618 | 0.680 | [-0.920, 2.156] | equal_periods |
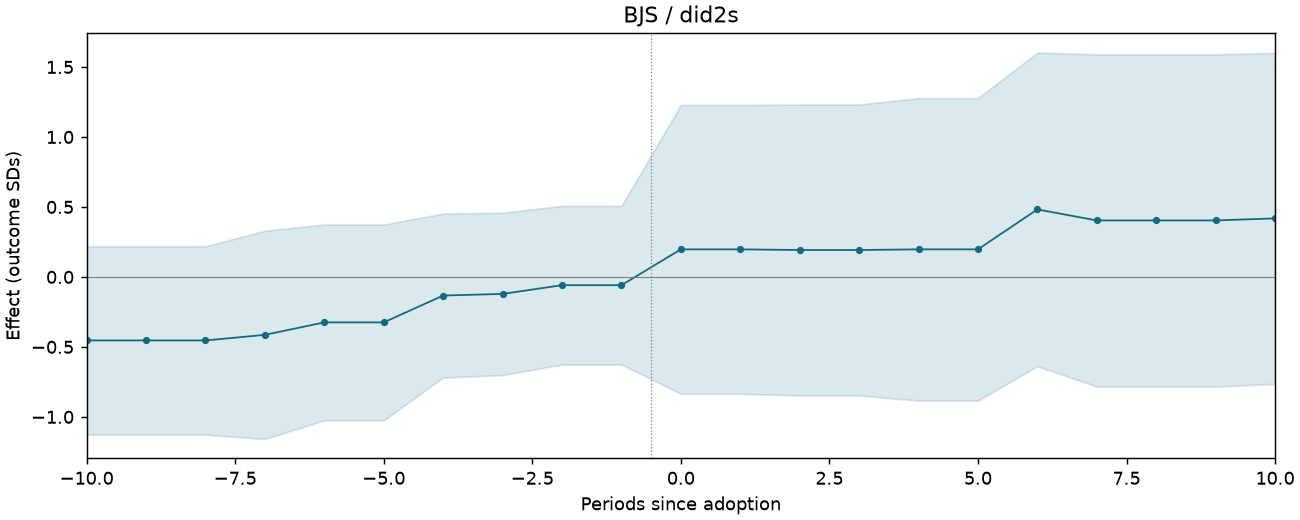
| BJS / did2s | 0.507 | 0.537 | [-0.709, 1.723] | equal_periods |
| CS-DID (equal event-time) | 1.024 | 0.594 | [-0.141, 2.188] | Equal post-event times |
| CS-DID (treated cells) | 0.947 | 0.560 | [-0.151, 2.046] | Treated cells |
| Matrix completion | 0.596 | — | — | Treated cells |
| Horizontal ridge | -0.104 | — | — | Treated cells |
Event studies
Periods −10 to +10; pointwise 95% intervals where available.
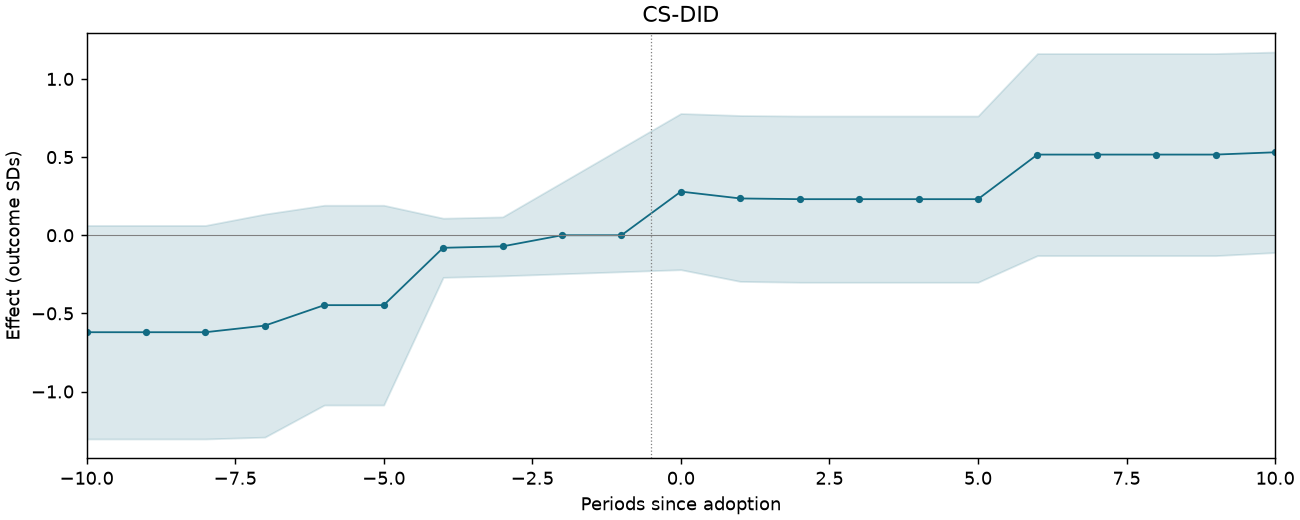
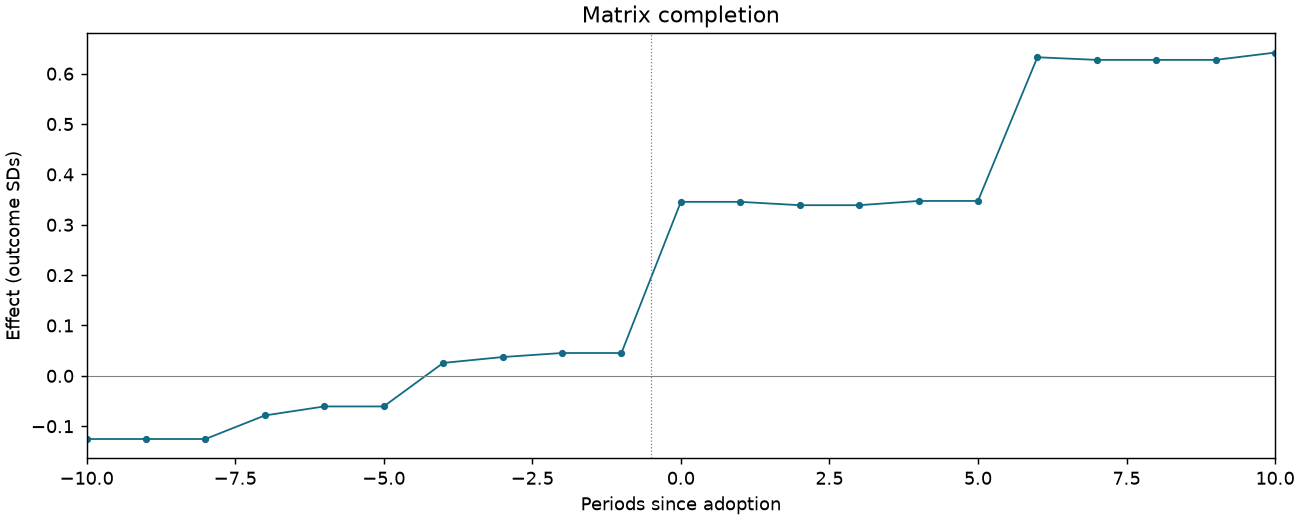
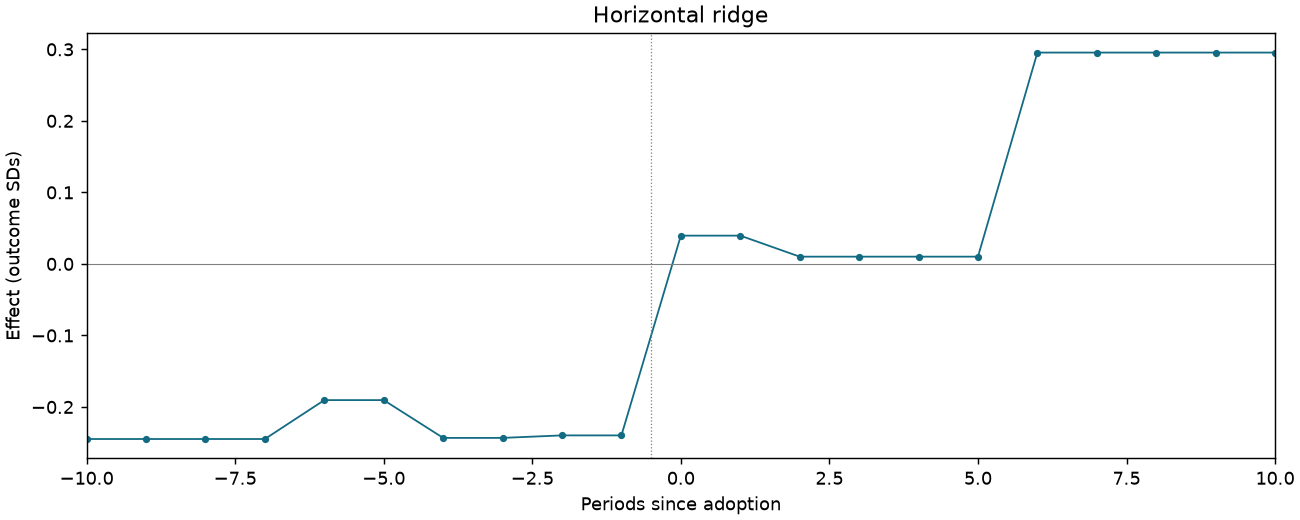
FISCAL-F5B-MARRIAGE-LAND
1,198 observations · 10 units · 10 clusters · 6 treated / 4 control units.
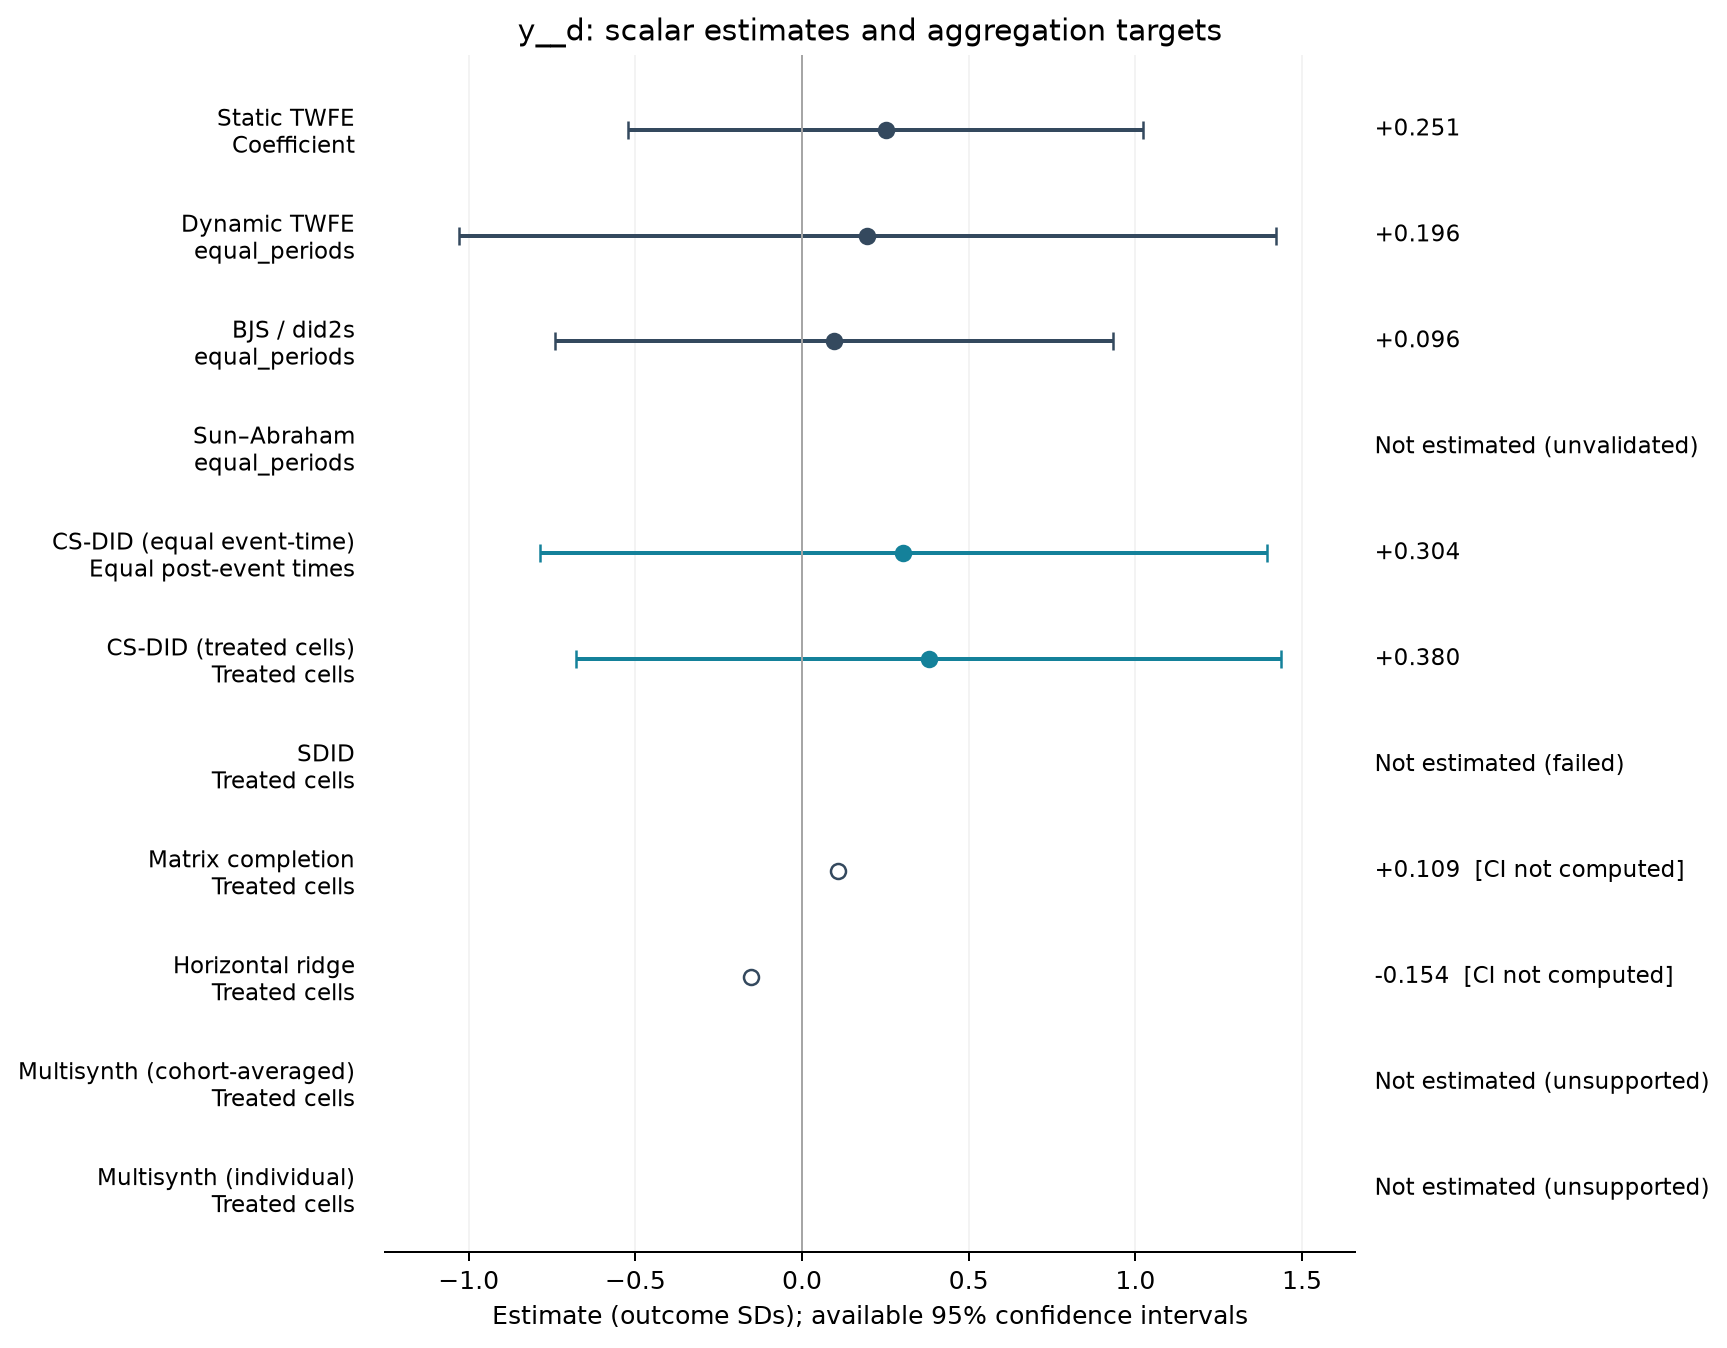
Estimate comparison
| Estimator | Estimate (SDs) | SE | 95% CI | Averaging |
|---|---|---|---|---|
| Static TWFE | 0.251 | 0.341 | [-0.521, 1.022] | Coefficient |
| Dynamic TWFE | 0.196 | 0.542 | [-1.029, 1.421] | equal_periods |
| BJS / did2s | 0.096 | 0.370 | [-0.741, 0.933] | equal_periods |
| CS-DID (equal event-time) | 0.304 | 0.557 | [-0.787, 1.395] | Equal post-event times |
| CS-DID (treated cells) | 0.380 | 0.539 | [-0.677, 1.437] | Treated cells |
| Matrix completion | 0.109 | — | — | Treated cells |
| Horizontal ridge | -0.154 | — | — | Treated cells |
Event studies
Periods −10 to +10; pointwise 95% intervals where available.
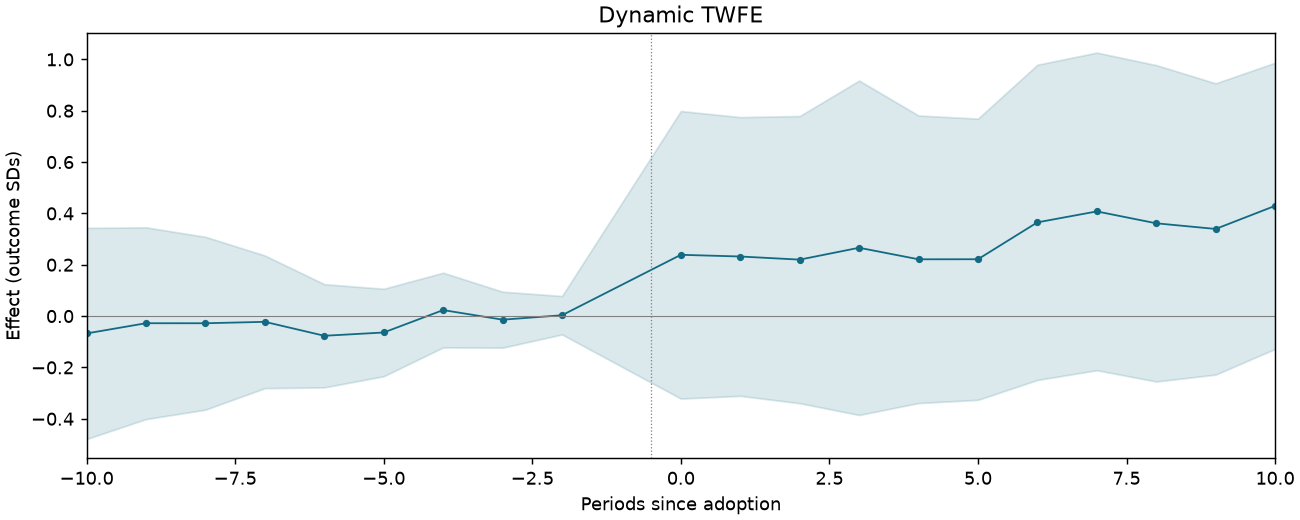
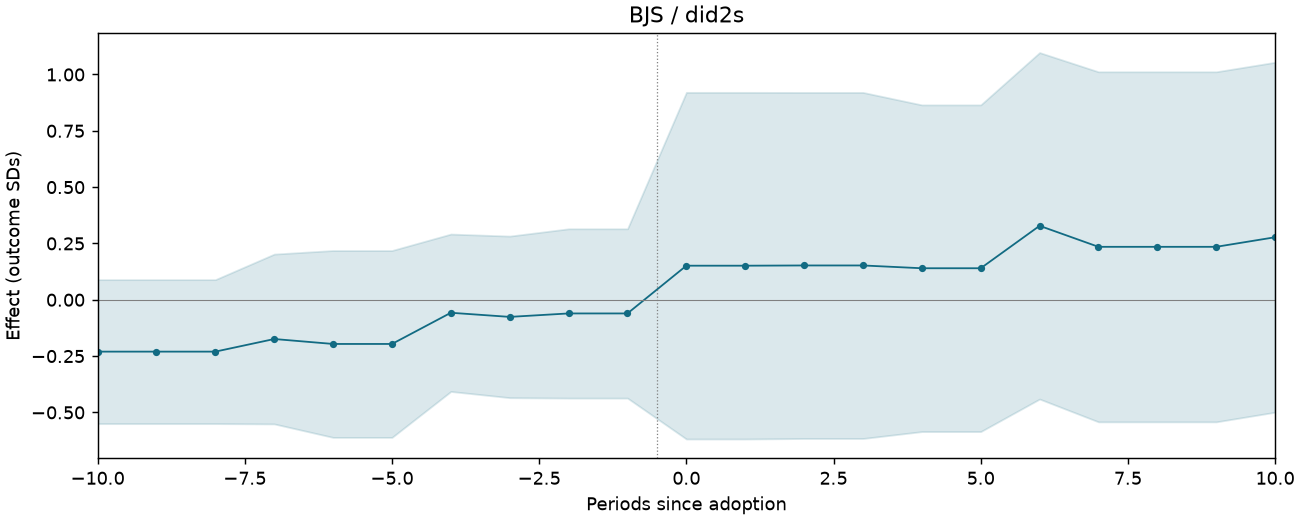
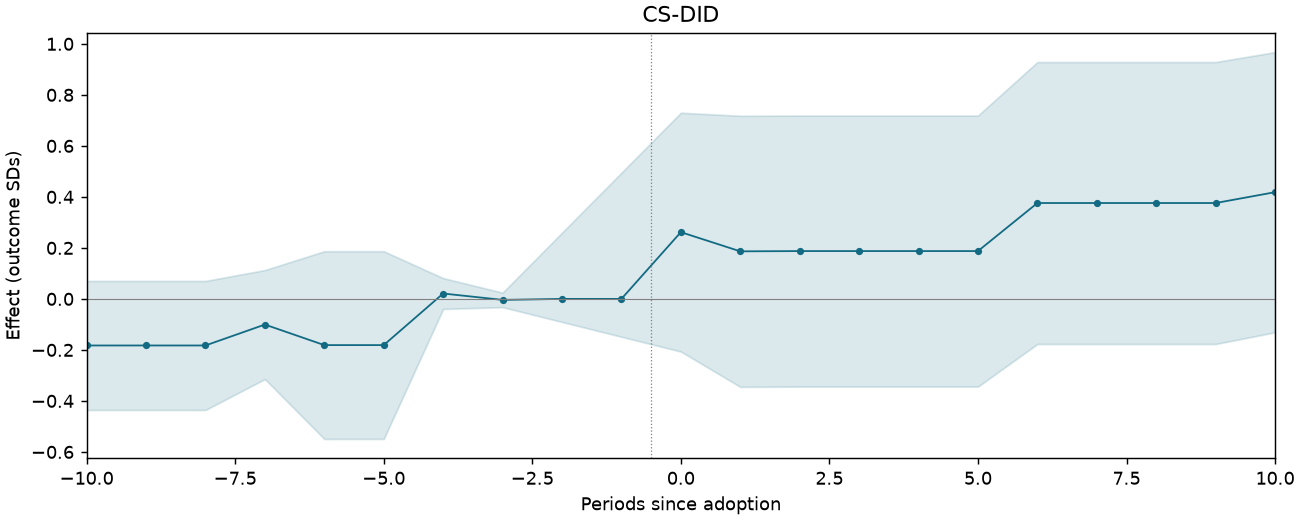
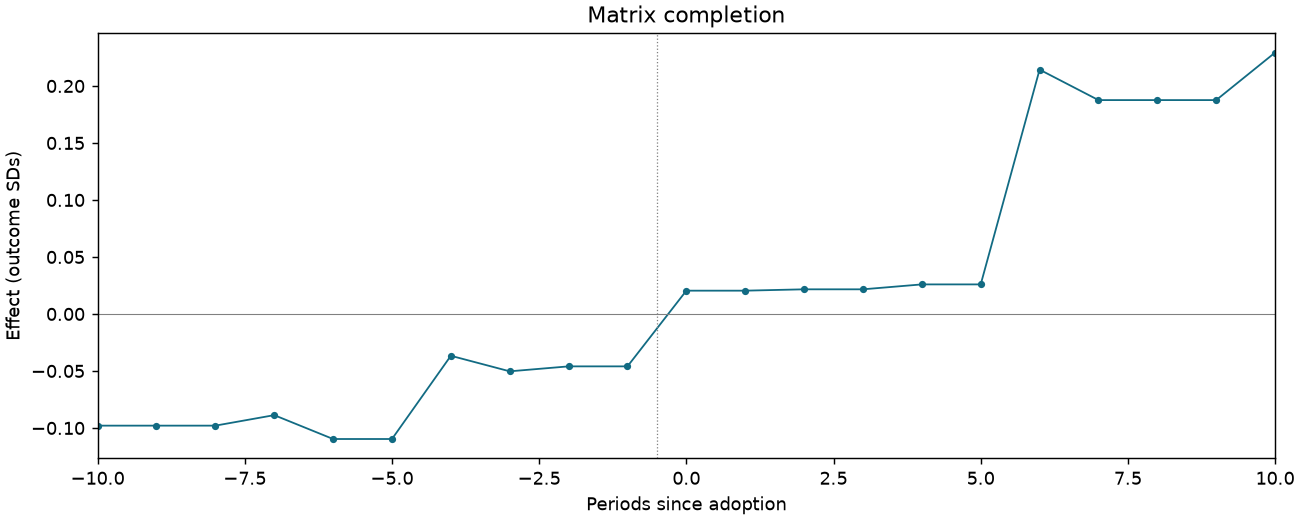
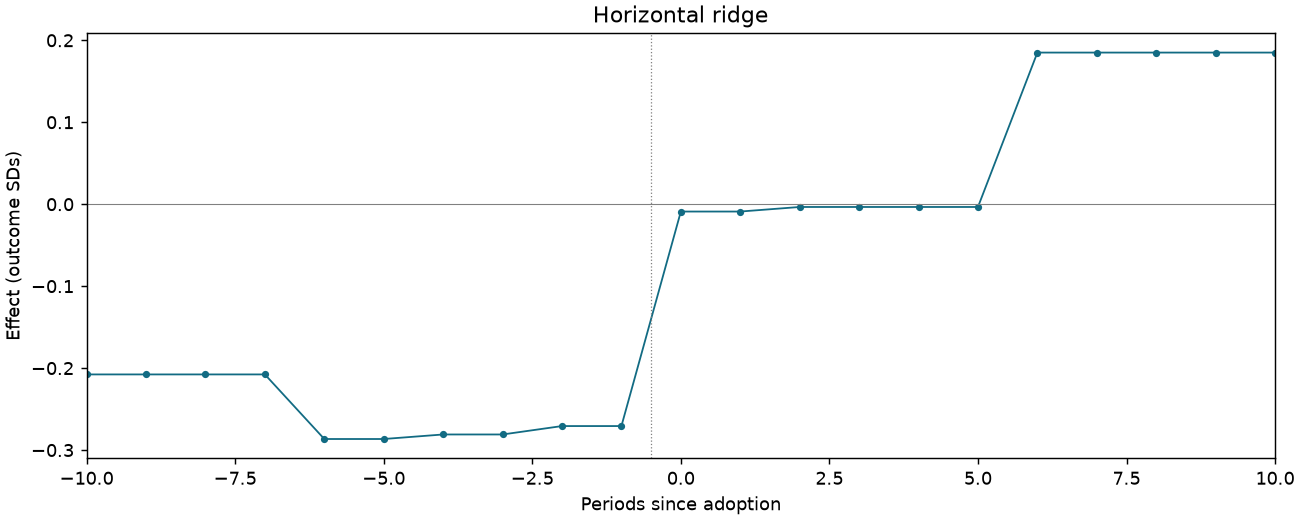
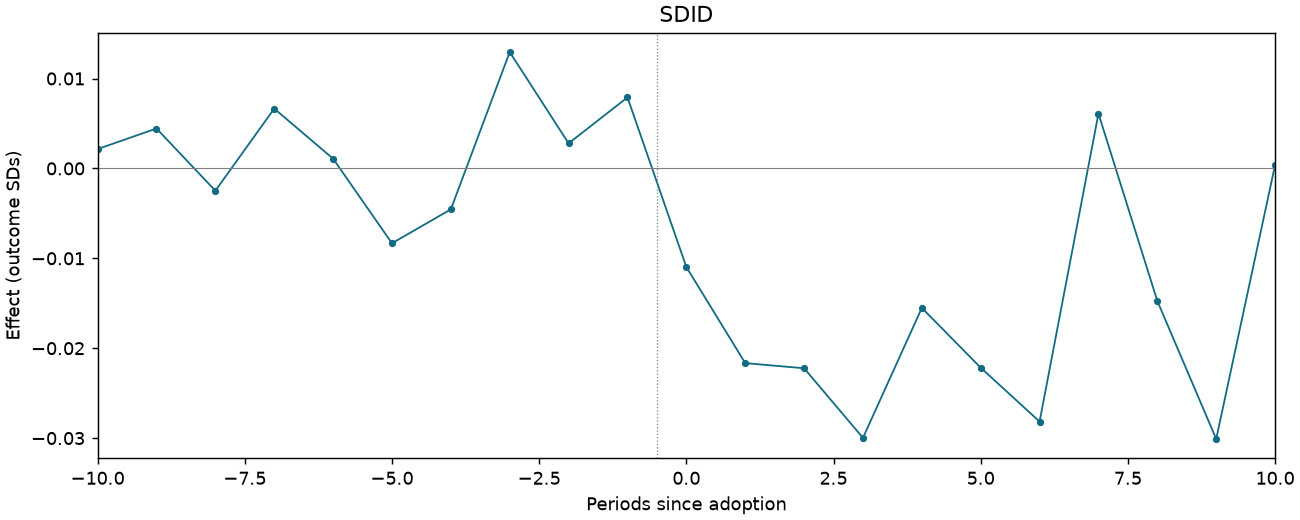
FISCAL-T2-C1-VANISH-CONFLICT
101,998 observations · 618 units · 618 clusters · 30 treated / 588 control units.
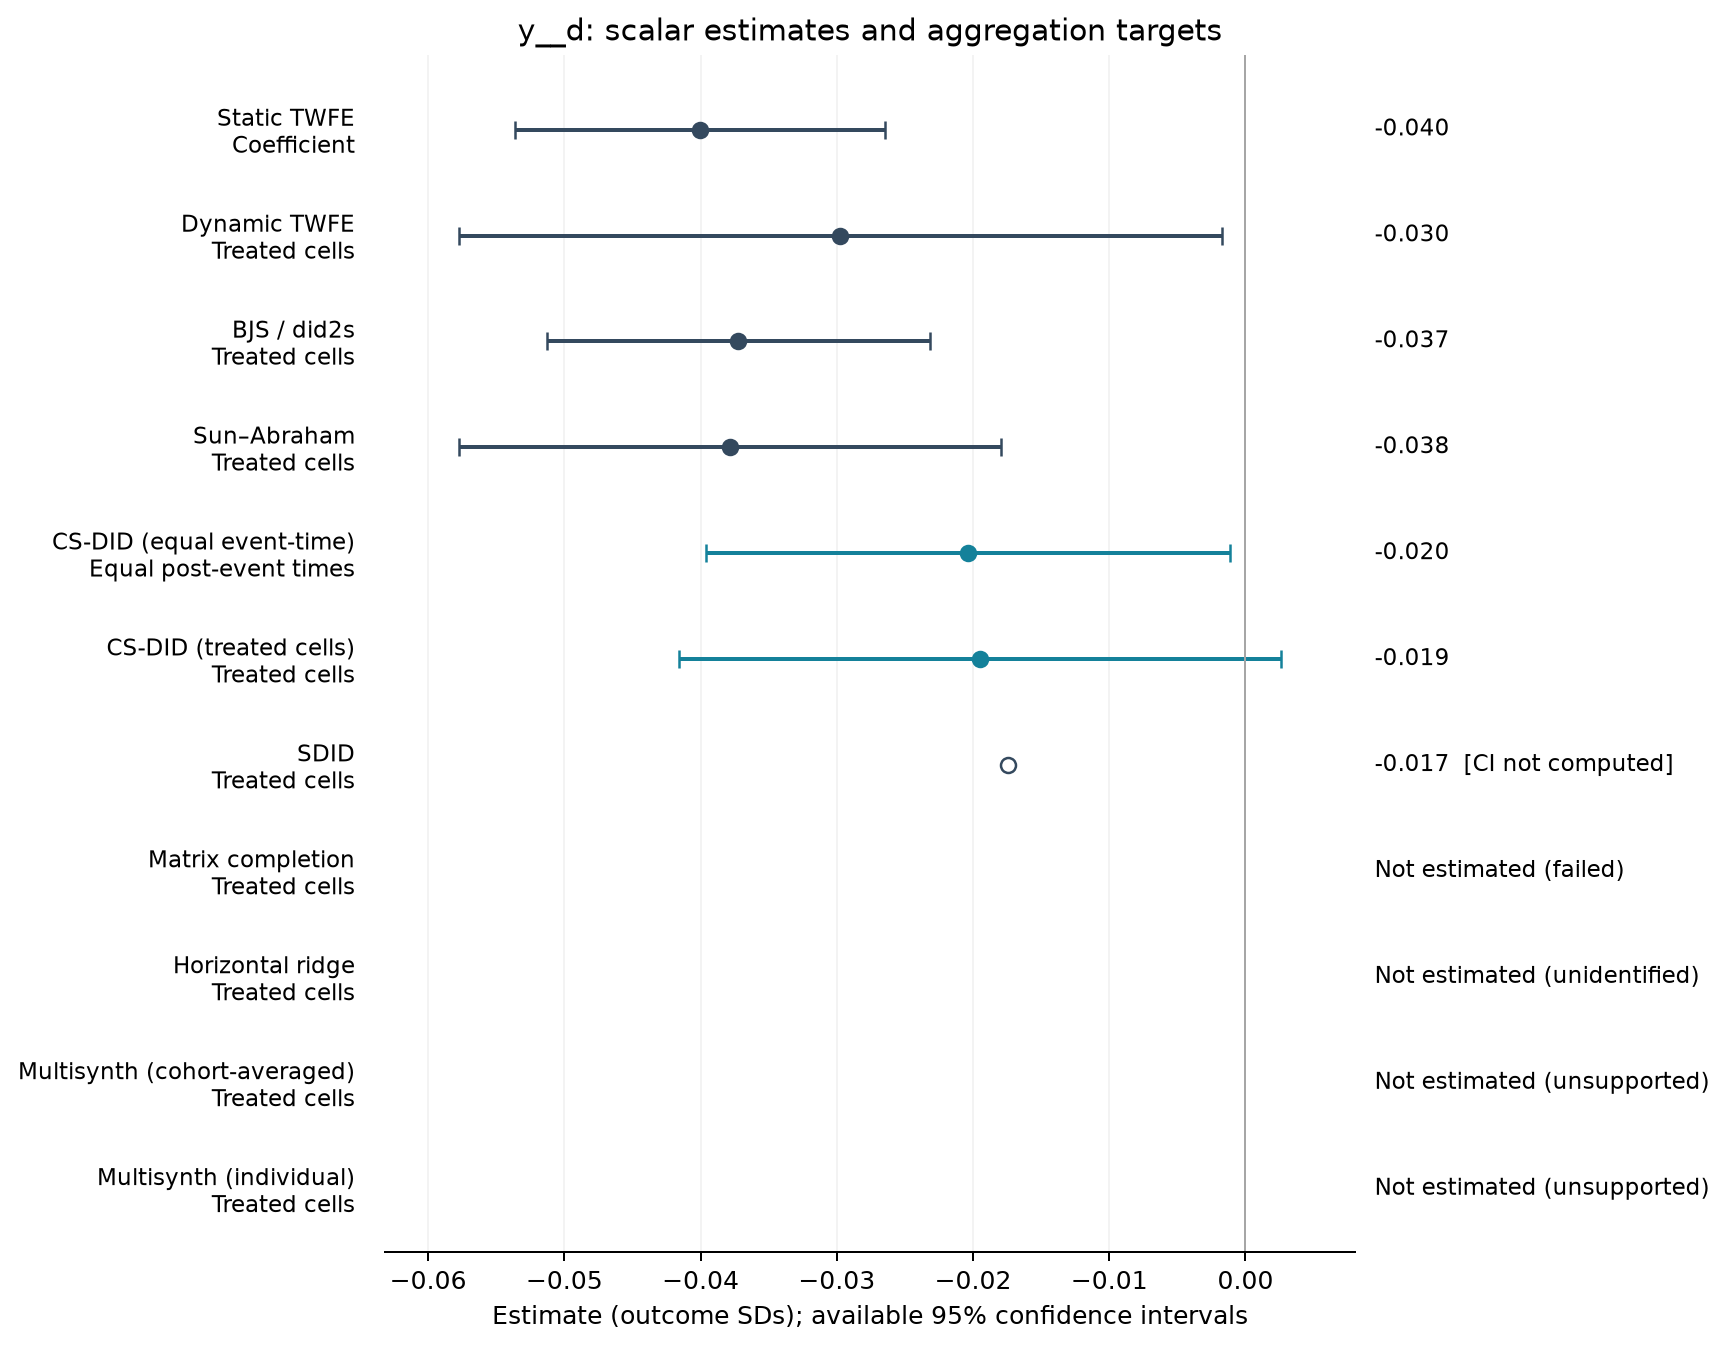
Estimate comparison
| Estimator | Estimate (SDs) | SE | 95% CI | Averaging |
|---|---|---|---|---|
| Static TWFE | -0.040 | 0.007 | [-0.054, -0.026] | Coefficient |
| Dynamic TWFE | -0.030 | 0.014 | [-0.058, -0.002] | Treated cells |
| BJS / did2s | -0.037 | 0.007 | [-0.051, -0.023] | Treated cells |
| Sun–Abraham | -0.038 | 0.010 | [-0.058, -0.018] | Treated cells |
| CS-DID (equal event-time) | -0.020 | 0.010 | [-0.040, -0.001] | Equal post-event times |
| CS-DID (treated cells) | -0.019 | 0.011 | [-0.042, 0.003] | Treated cells |
| SDID | -0.017 | — | — | Treated cells |
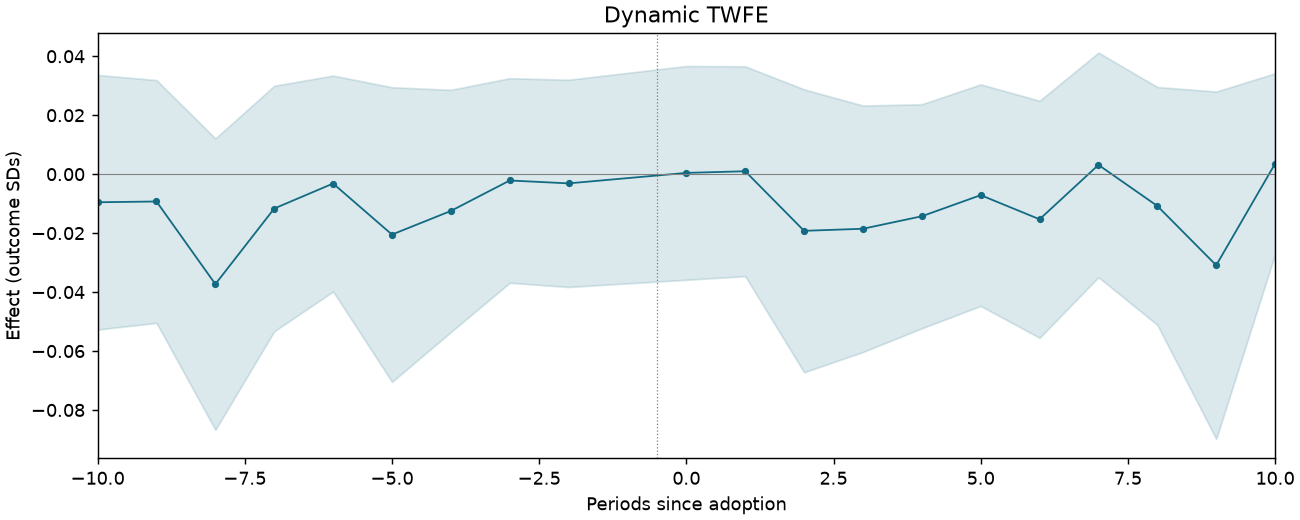
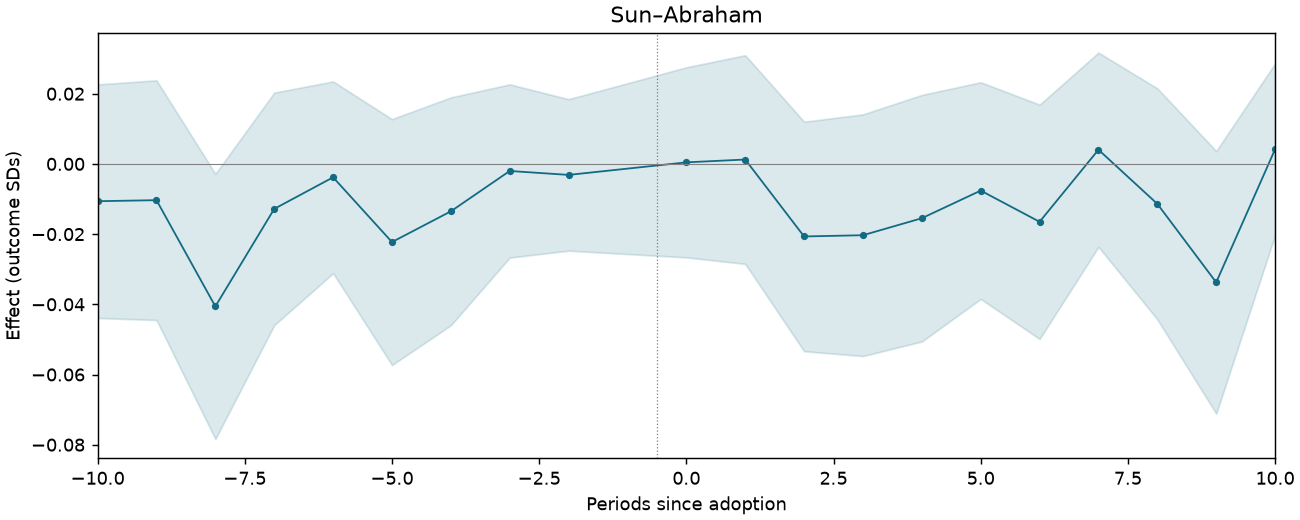
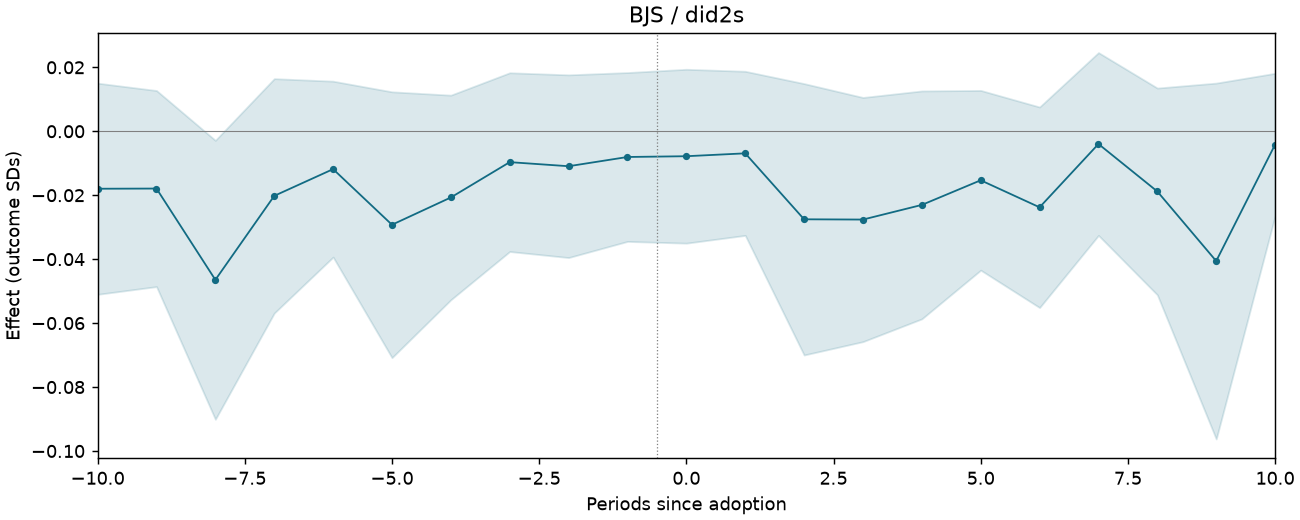
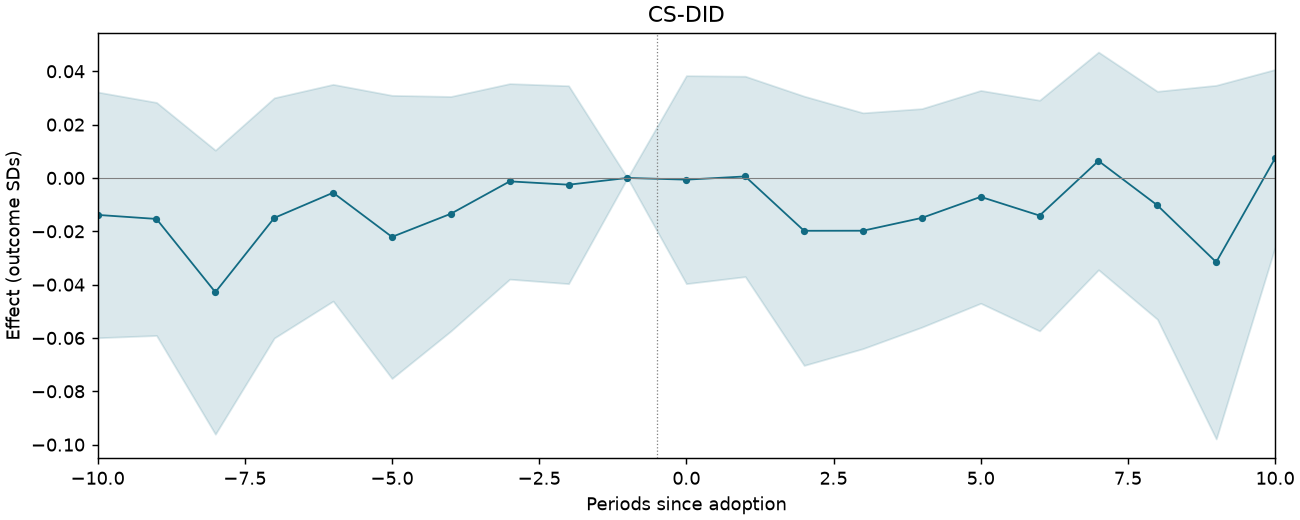
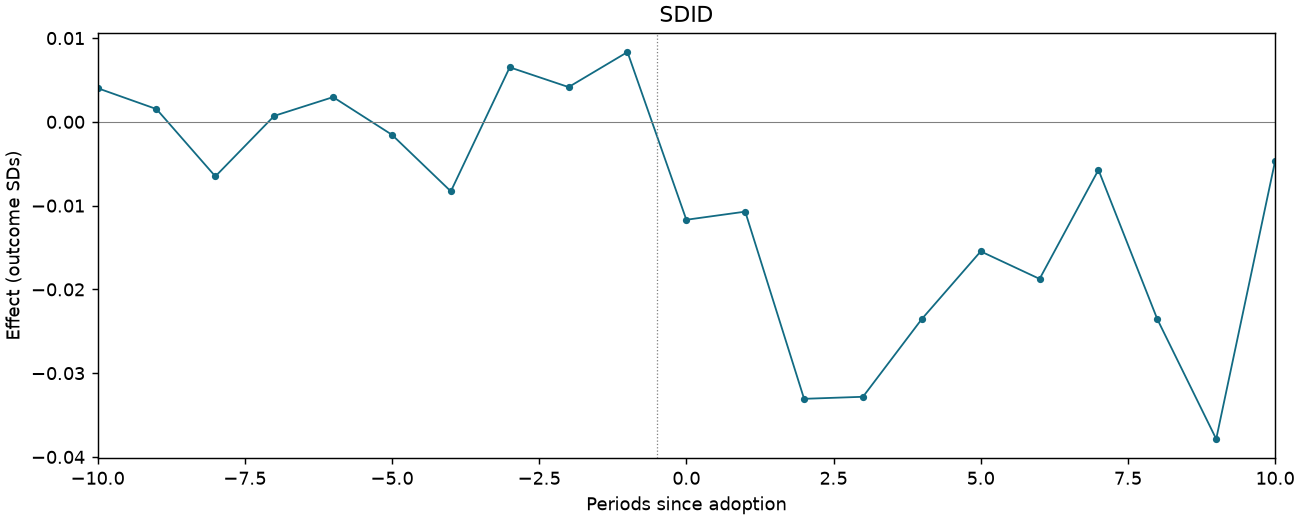
Event studies
Periods −10 to +10; pointwise 95% intervals where available.
FISCAL-T2-C3-VANISH-PURCHASE
101,998 observations · 618 units · 618 clusters · 30 treated / 588 control units.
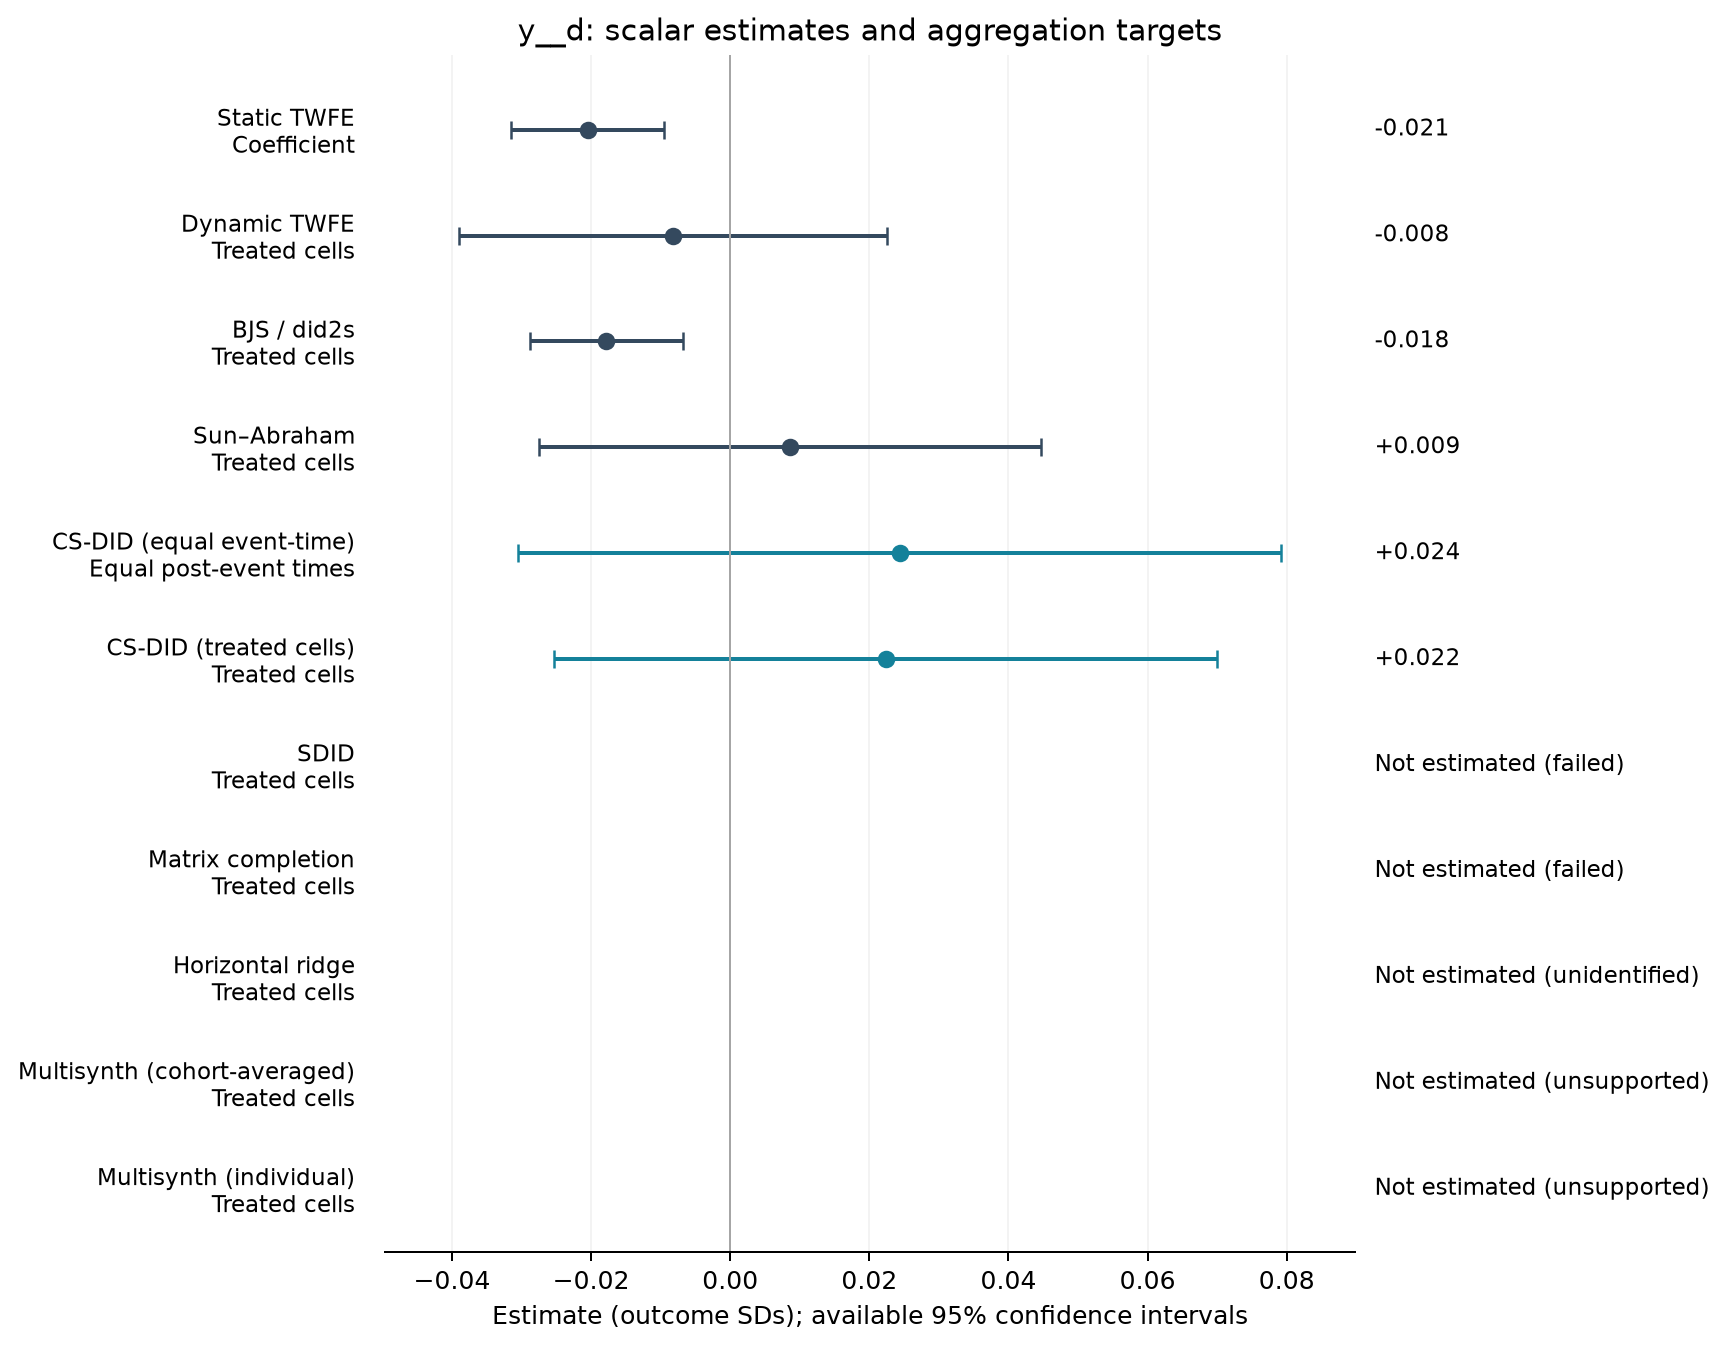
Estimate comparison
| Estimator | Estimate (SDs) | SE | 95% CI | Averaging |
|---|---|---|---|---|
| Static TWFE | -0.021 | 0.006 | [-0.031, -0.010] | Coefficient |
| Dynamic TWFE | -0.008 | 0.016 | [-0.039, 0.023] | Treated cells |
| BJS / did2s | -0.018 | 0.006 | [-0.029, -0.007] | Treated cells |
| Sun–Abraham | 0.009 | 0.018 | [-0.027, 0.045] | Treated cells |
| CS-DID (equal event-time) | 0.024 | 0.028 | [-0.030, 0.079] | Equal post-event times |
| CS-DID (treated cells) | 0.022 | 0.024 | [-0.025, 0.070] | Treated cells |
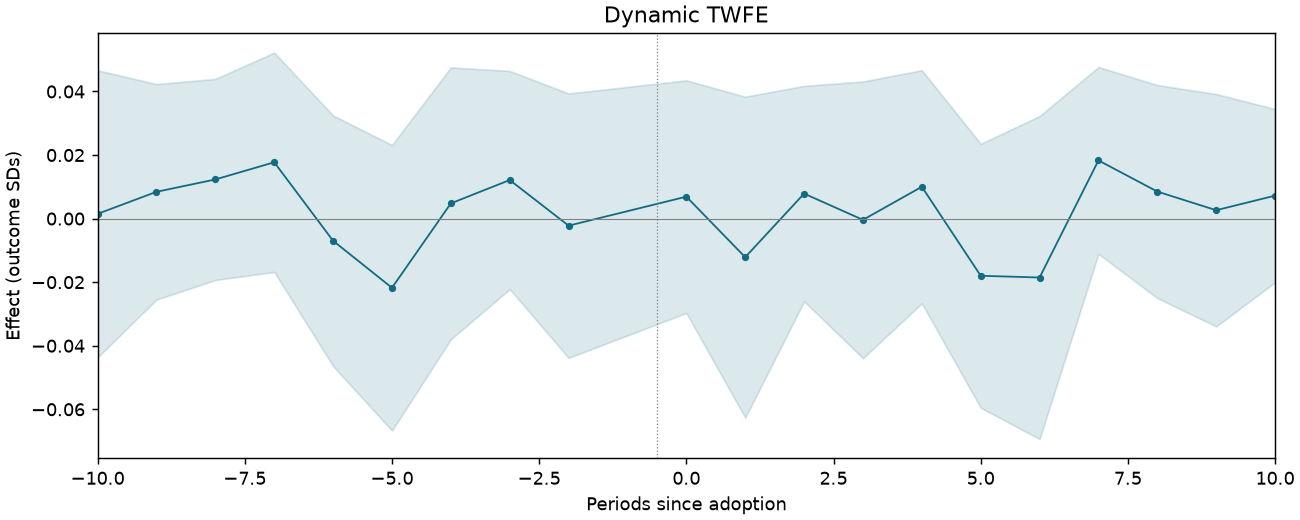
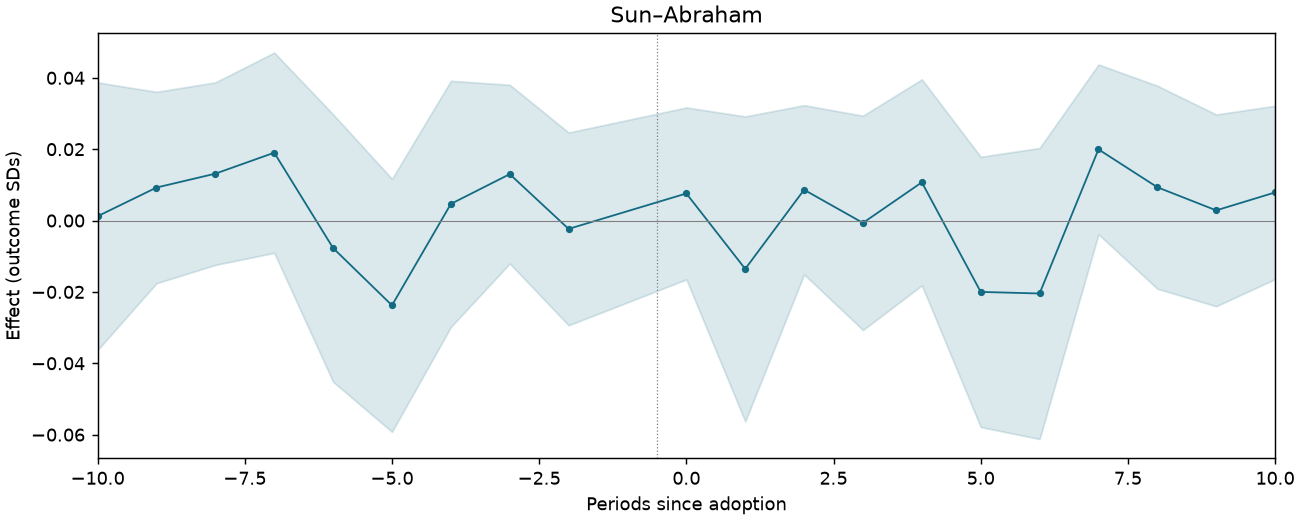
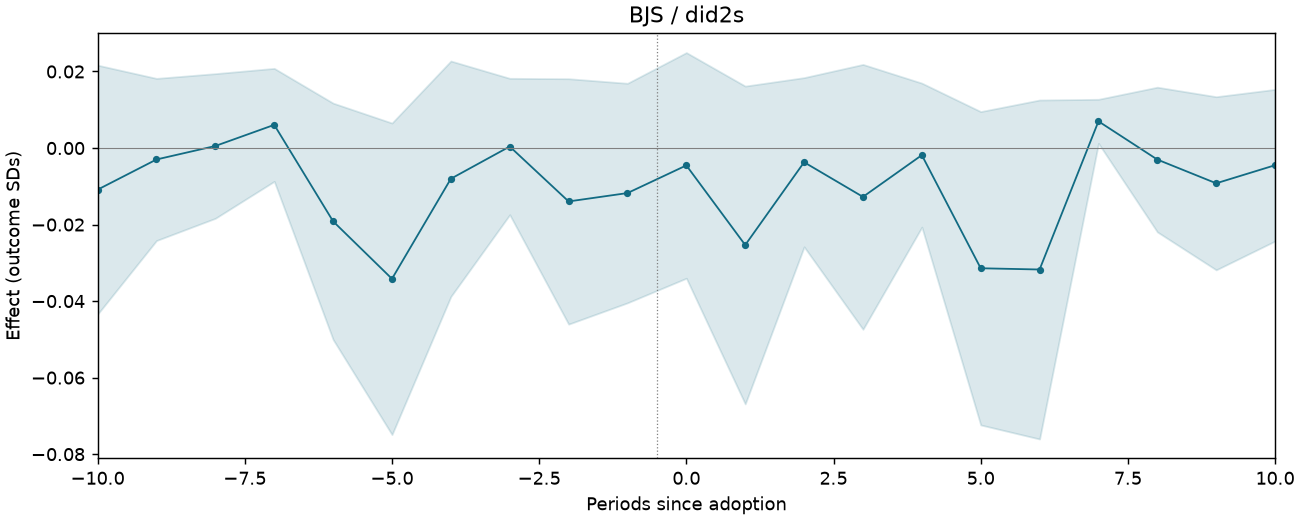
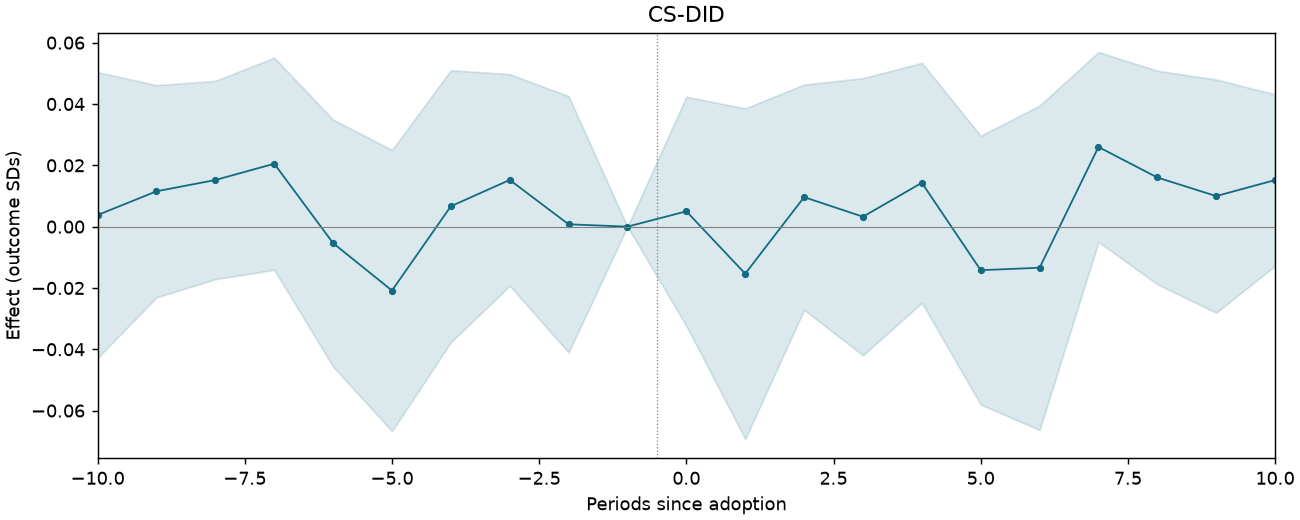
Event studies
Periods −10 to +10; pointwise 95% intervals where available.
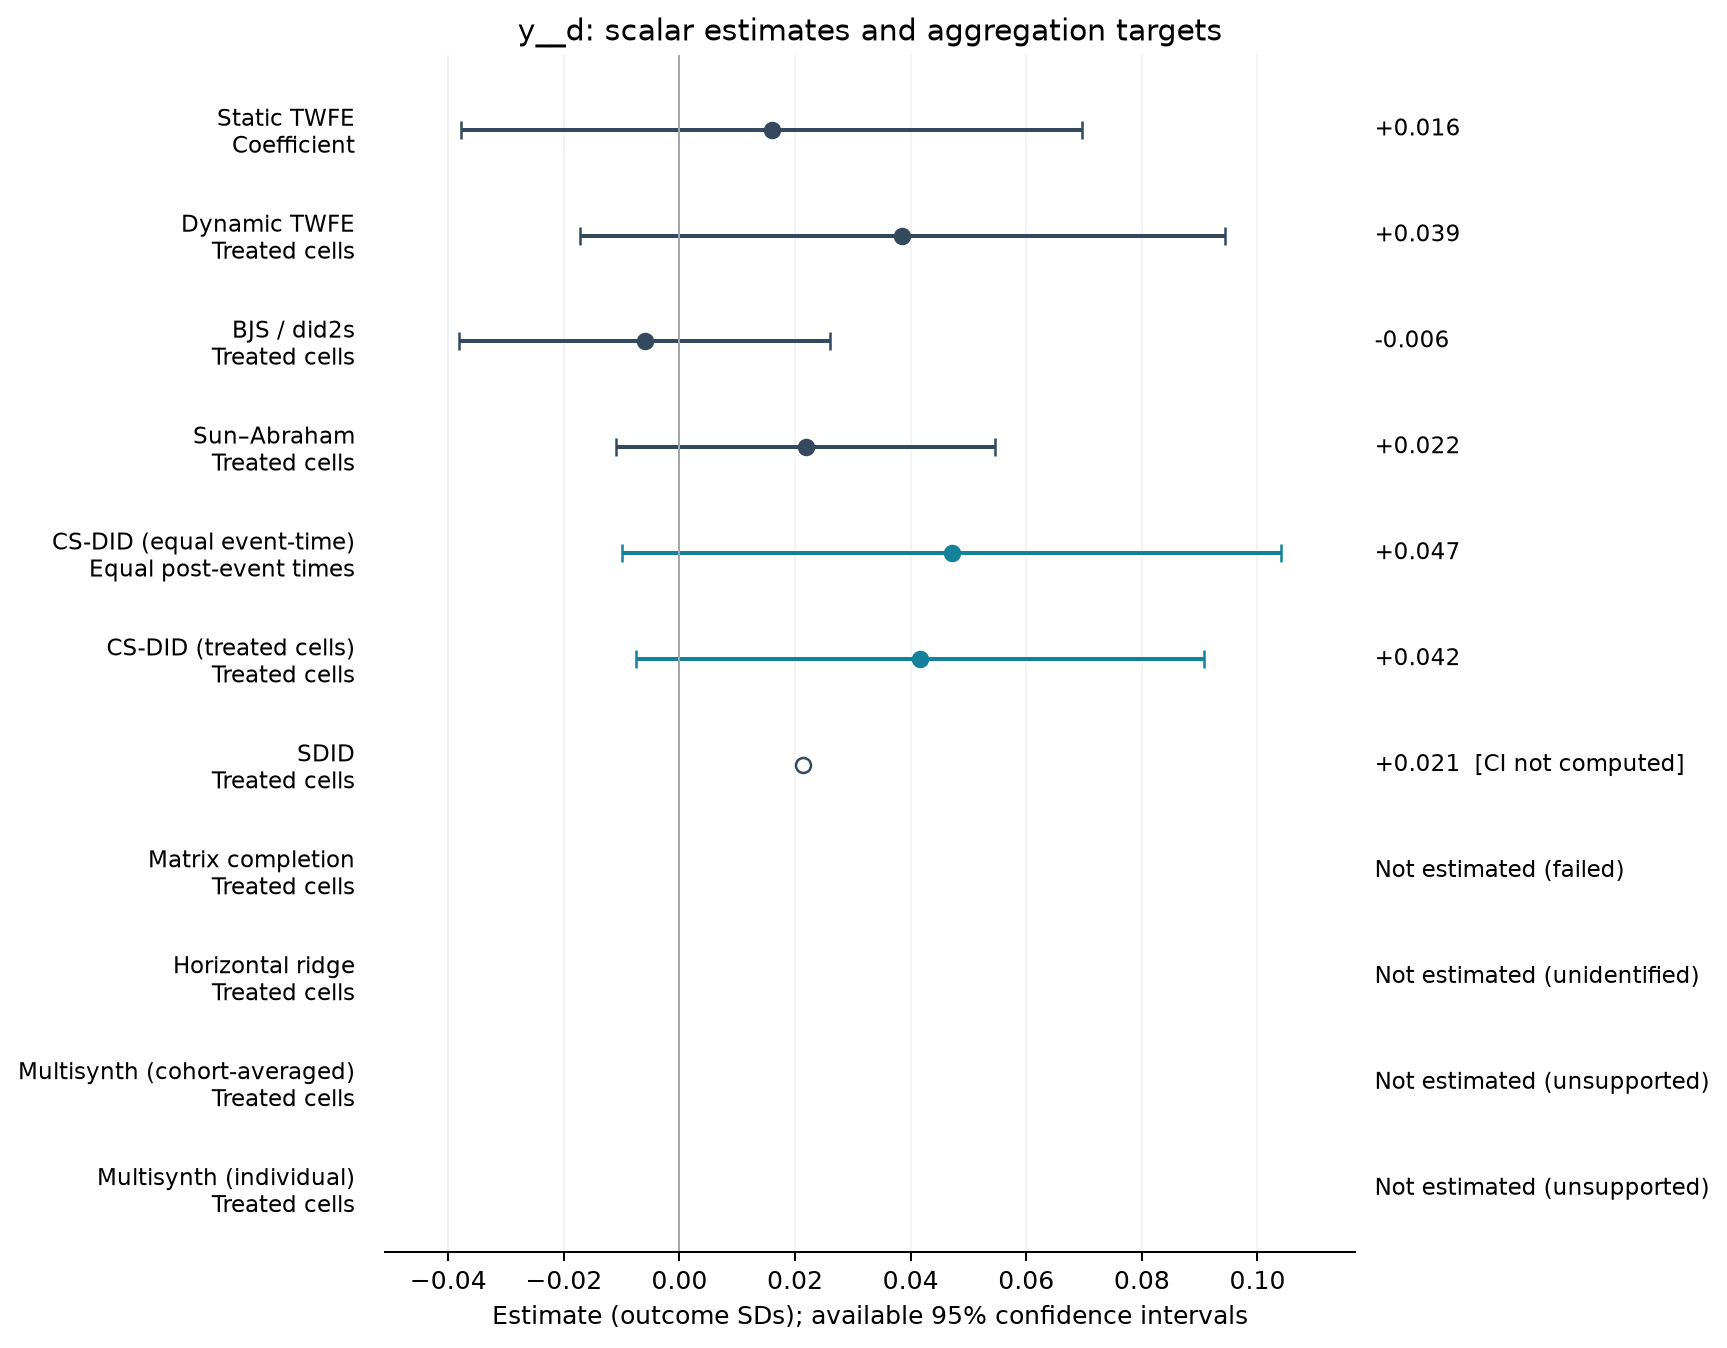
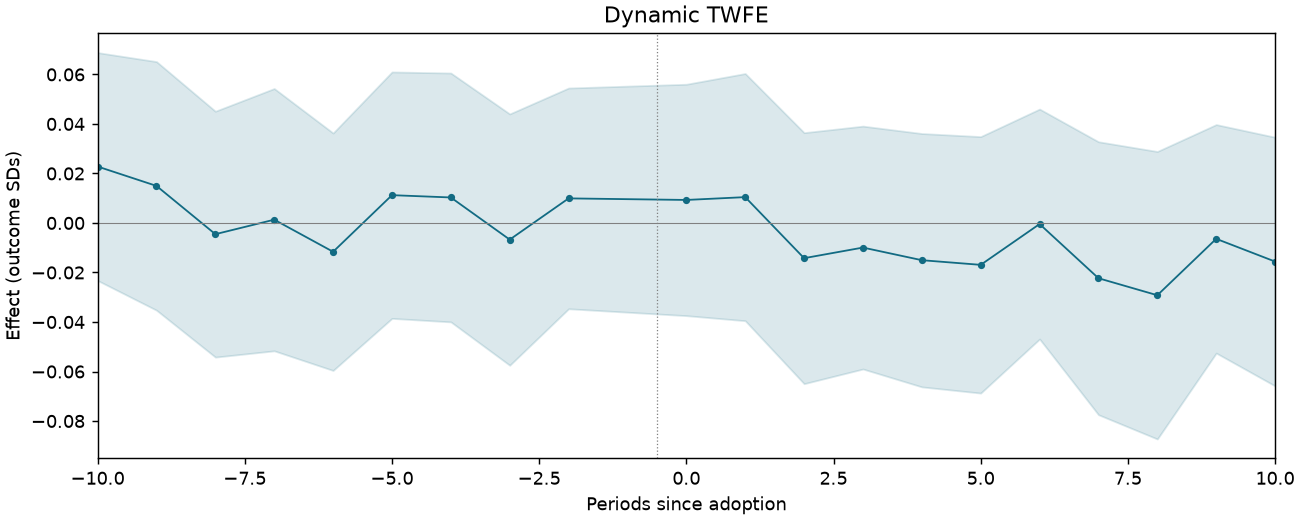
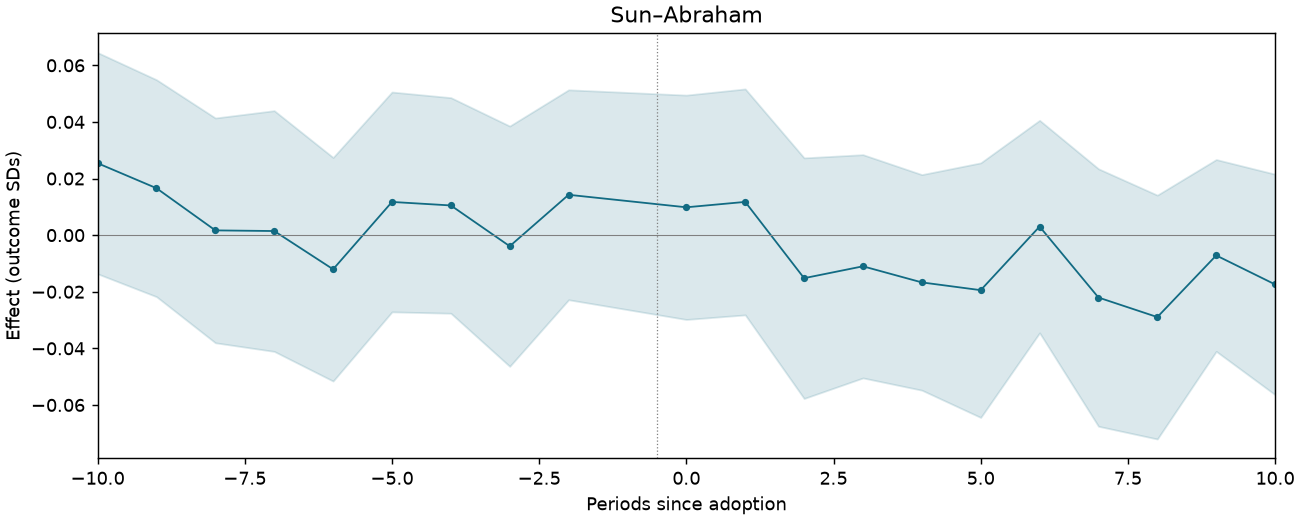
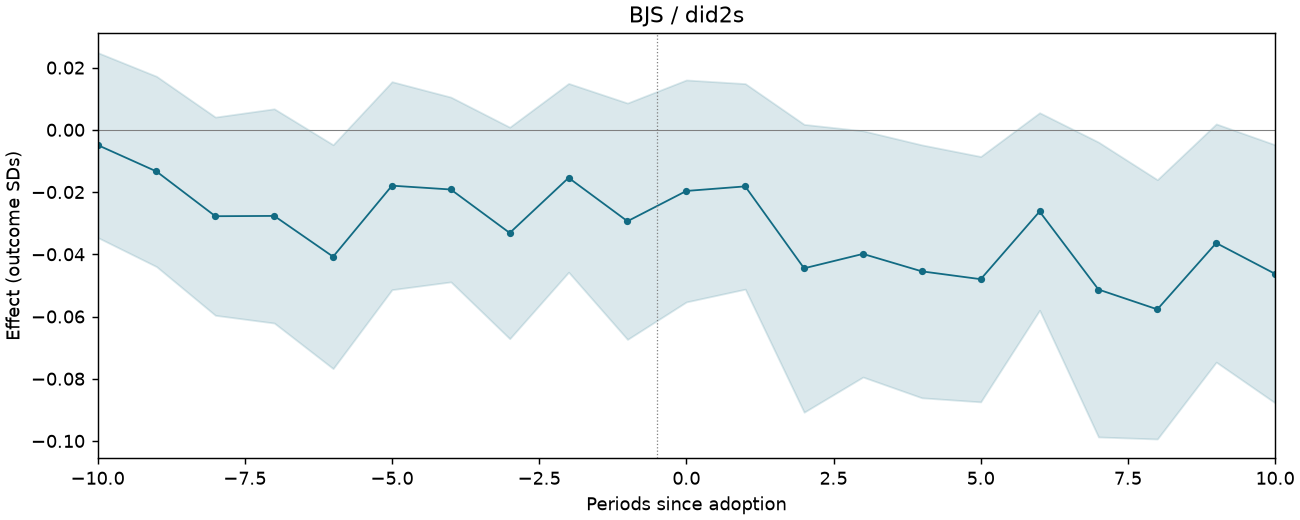
FISCAL-T2-C5-VANISH-EXTINCTION
101,998 observations · 618 units · 618 clusters · 30 treated / 588 control units.
Estimate comparison
| Estimator | Estimate (SDs) | SE | 95% CI | Averaging |
|---|---|---|---|---|
| Static TWFE | 0.016 | 0.027 | [-0.038, 0.070] | Coefficient |
| Dynamic TWFE | 0.039 | 0.028 | [-0.017, 0.094] | Treated cells |
| BJS / did2s | -0.006 | 0.016 | [-0.038, 0.026] | Treated cells |
| Sun–Abraham | 0.022 | 0.017 | [-0.011, 0.055] | Treated cells |
| CS-DID (equal event-time) | 0.047 | 0.029 | [-0.010, 0.104] | Equal post-event times |
| CS-DID (treated cells) | 0.042 | 0.025 | [-0.007, 0.091] | Treated cells |
| SDID | 0.021 | — | — | Treated cells |
Event studies
Periods −10 to +10; pointwise 95% intervals where available.
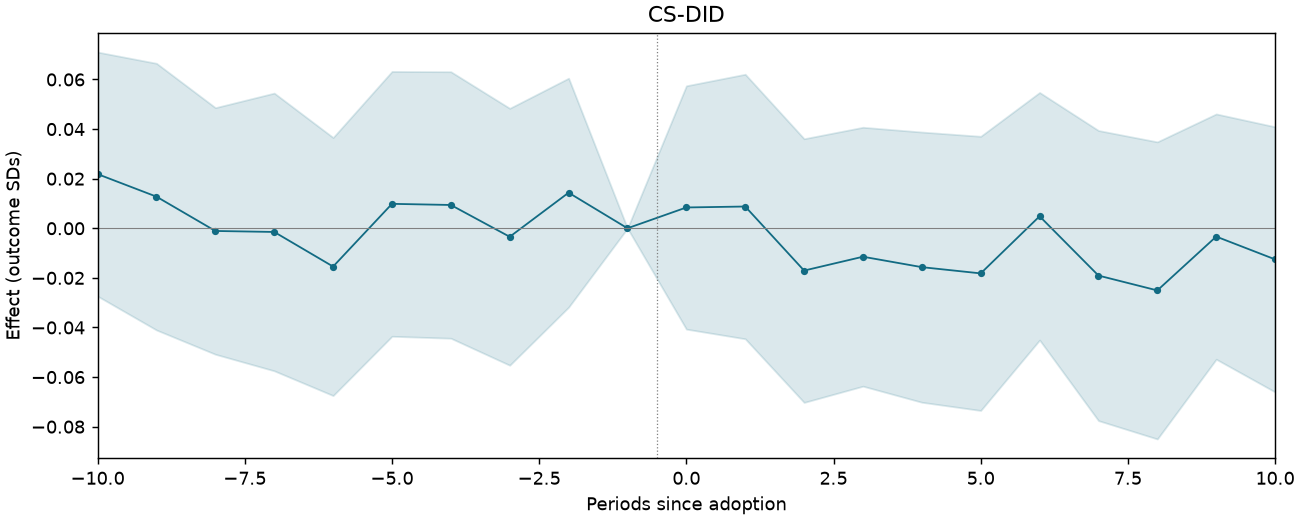
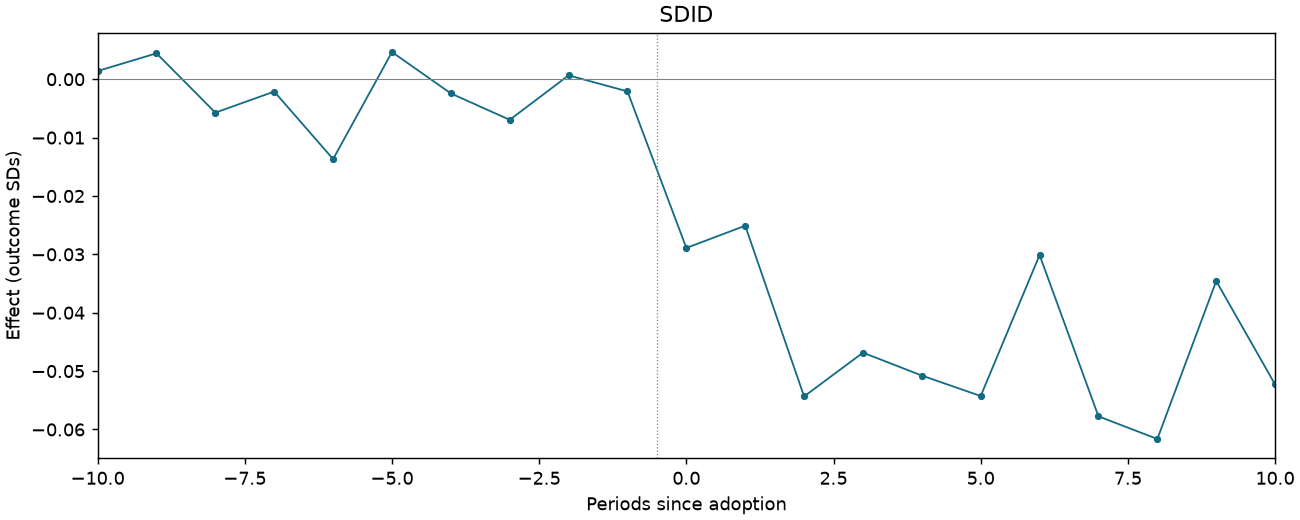
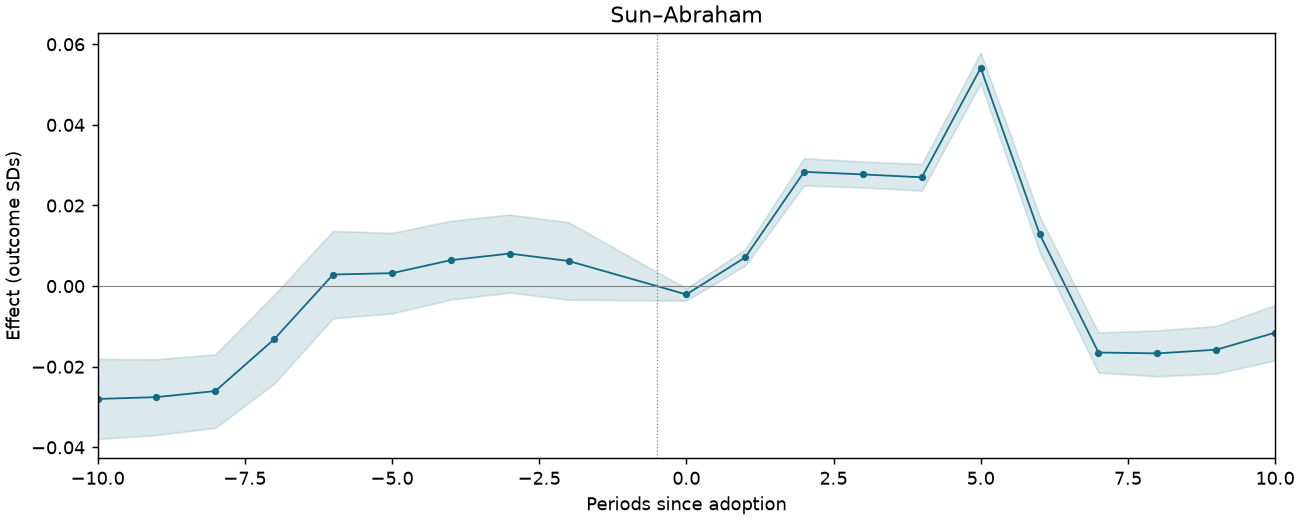
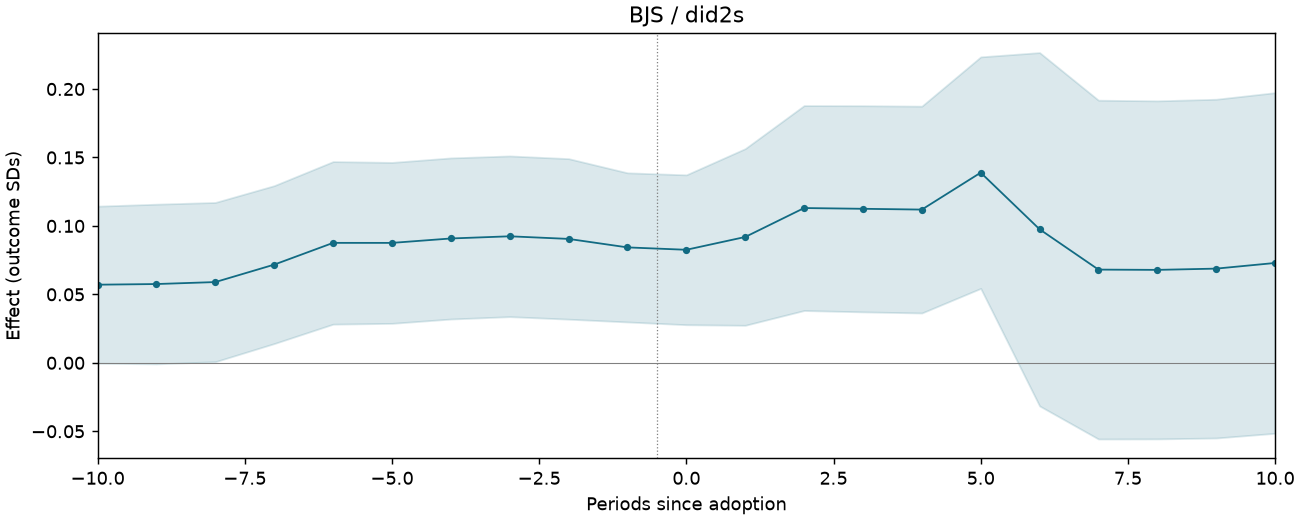
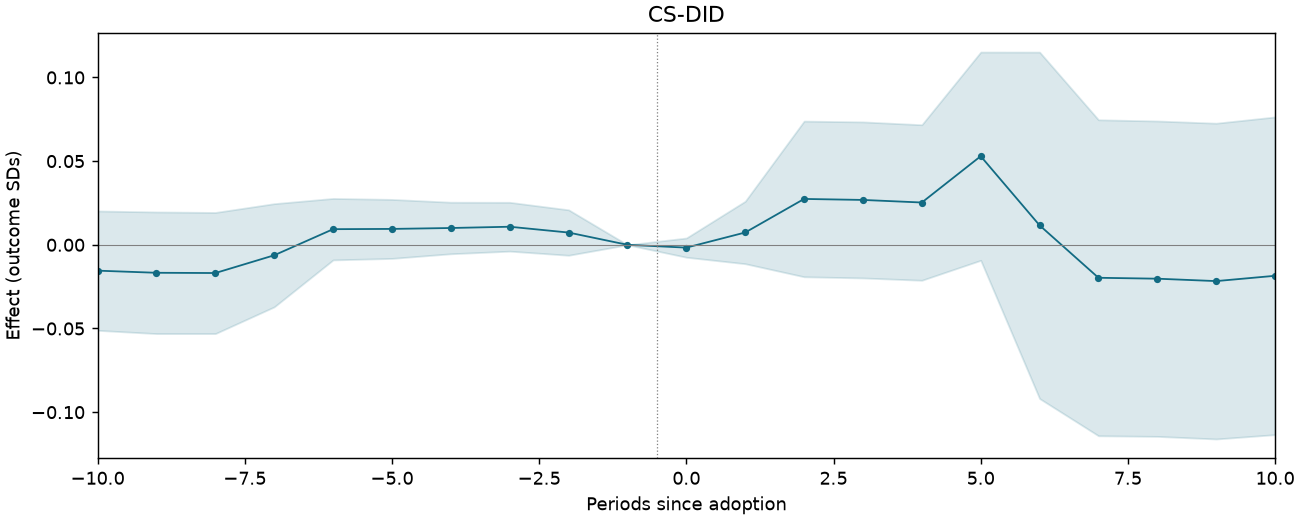
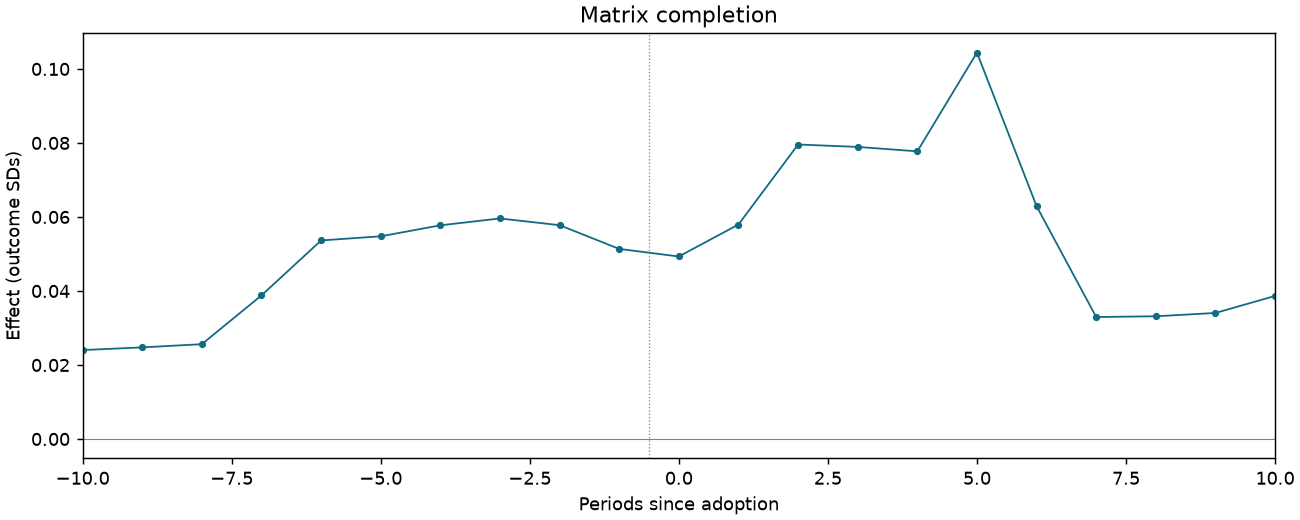
FISCAL-T3-C1-SIZE-SINGLE
101,998 observations · 618 units · 618 clusters · 30 treated / 588 control units.
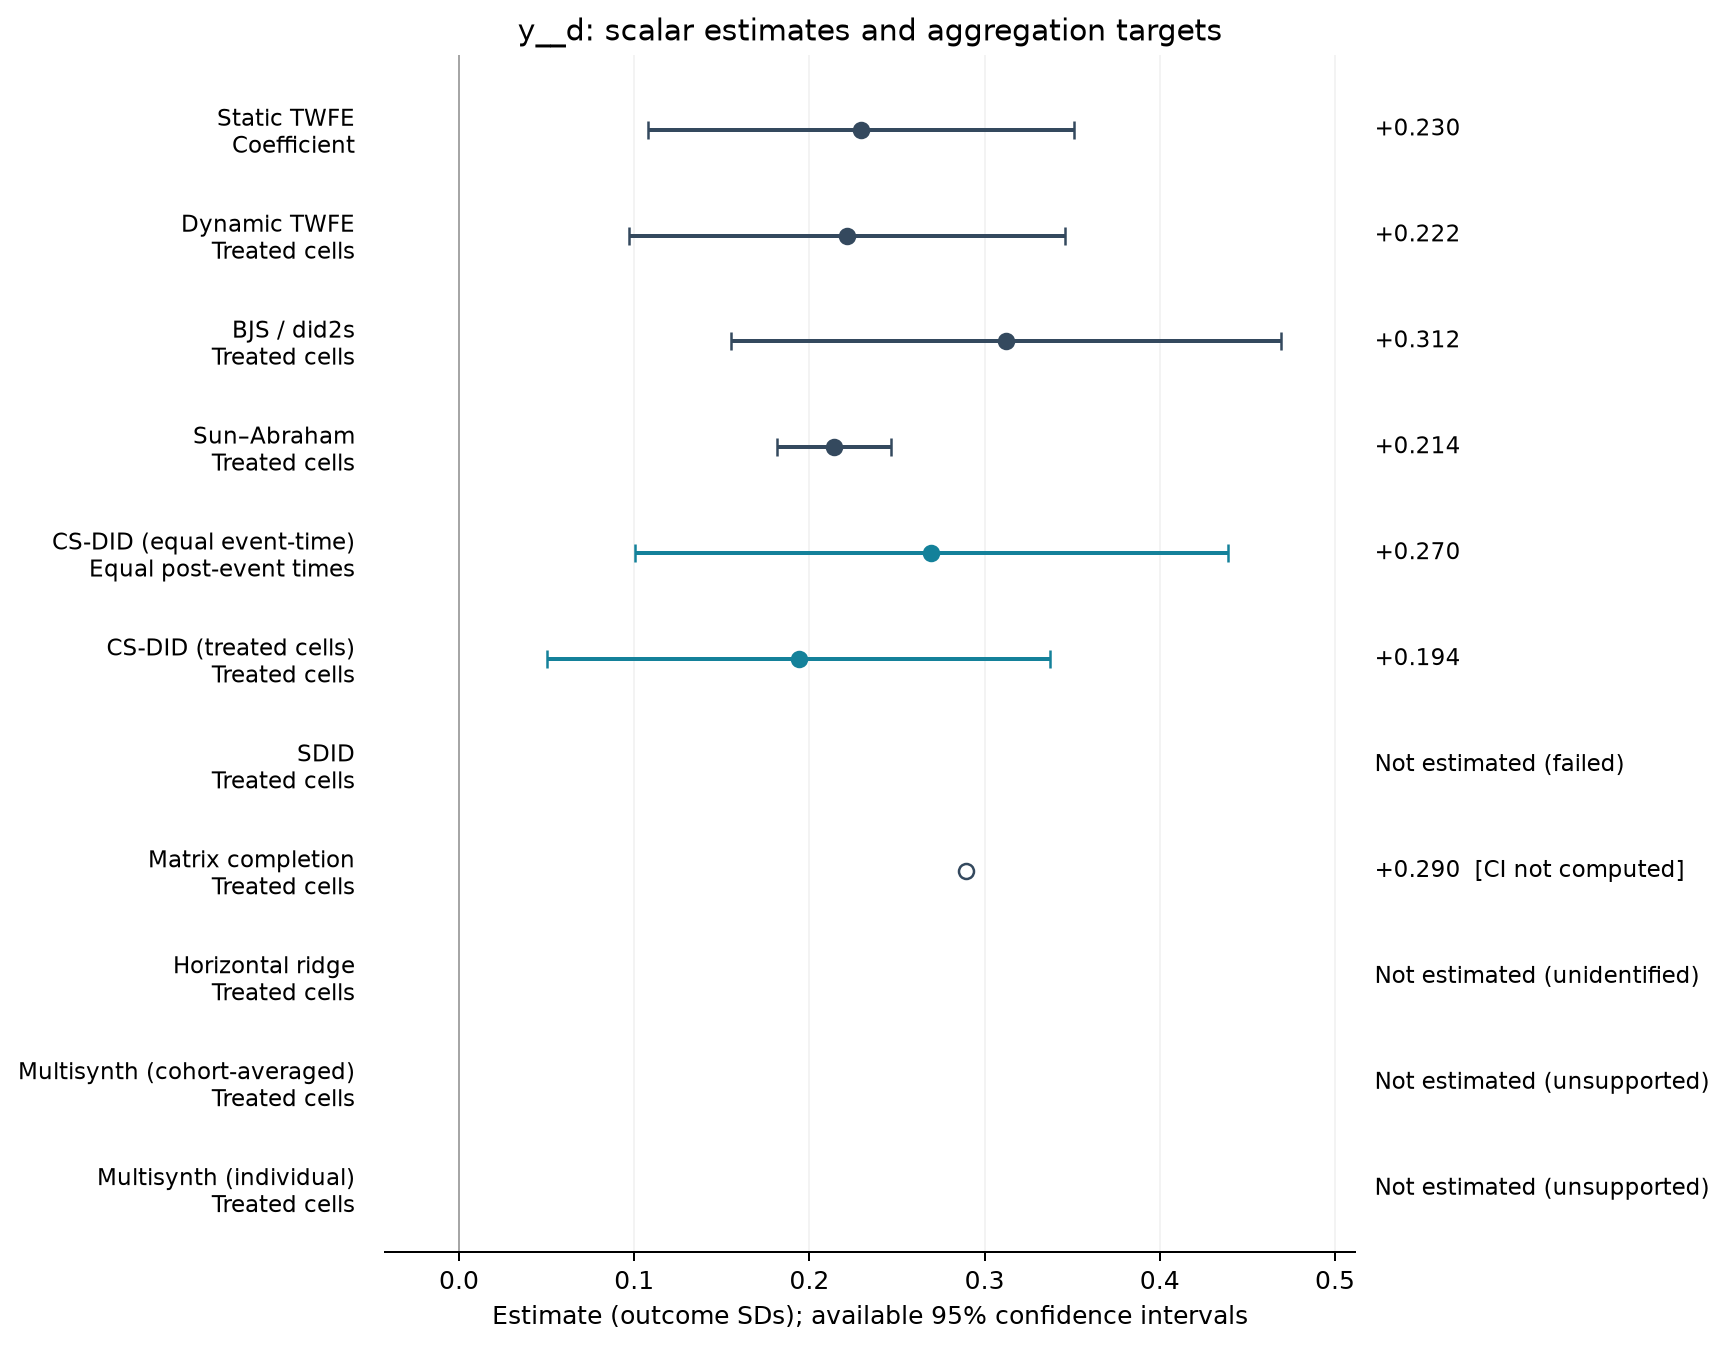
Estimate comparison
| Estimator | Estimate (SDs) | SE | 95% CI | Averaging |
|---|---|---|---|---|
| Static TWFE | 0.230 | 0.062 | [0.108, 0.351] | Coefficient |
| Dynamic TWFE | 0.222 | 0.063 | [0.097, 0.346] | Treated cells |
| BJS / did2s | 0.312 | 0.080 | [0.155, 0.469] | Treated cells |
| Sun–Abraham | 0.214 | 0.016 | [0.182, 0.246] | Treated cells |
| CS-DID (equal event-time) | 0.270 | 0.086 | [0.100, 0.439] | Equal post-event times |
| CS-DID (treated cells) | 0.194 | 0.073 | [0.050, 0.338] | Treated cells |
| Matrix completion | 0.290 | — | — | Treated cells |
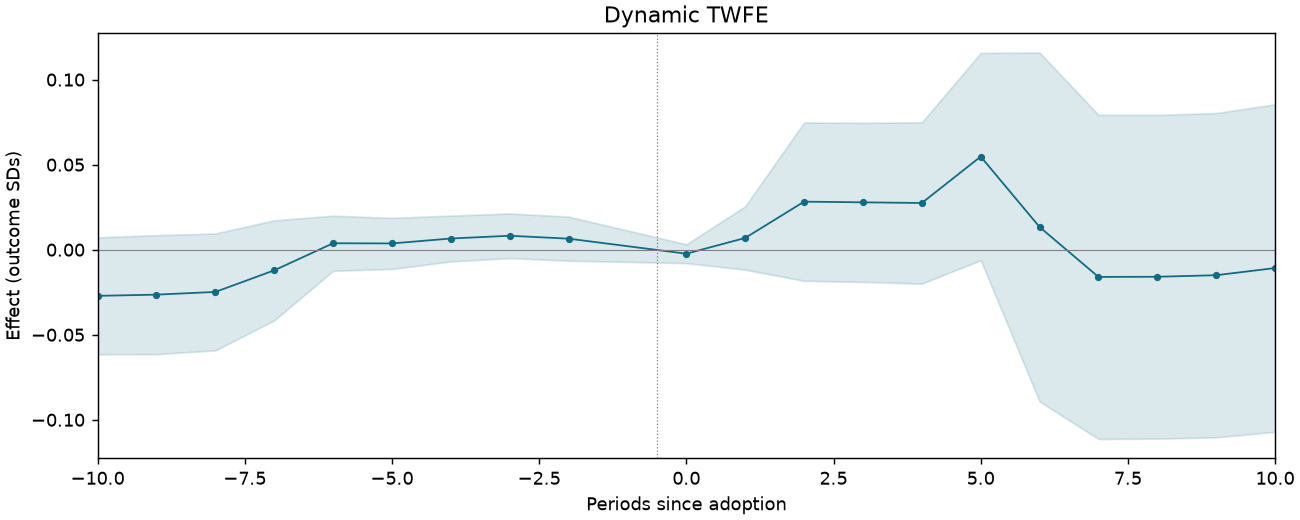
Event studies
Periods −10 to +10; pointwise 95% intervals where available.
FISCAL-T3-C3-SIZE-UNCONTESTED
101,998 observations · 618 units · 618 clusters · 30 treated / 588 control units.
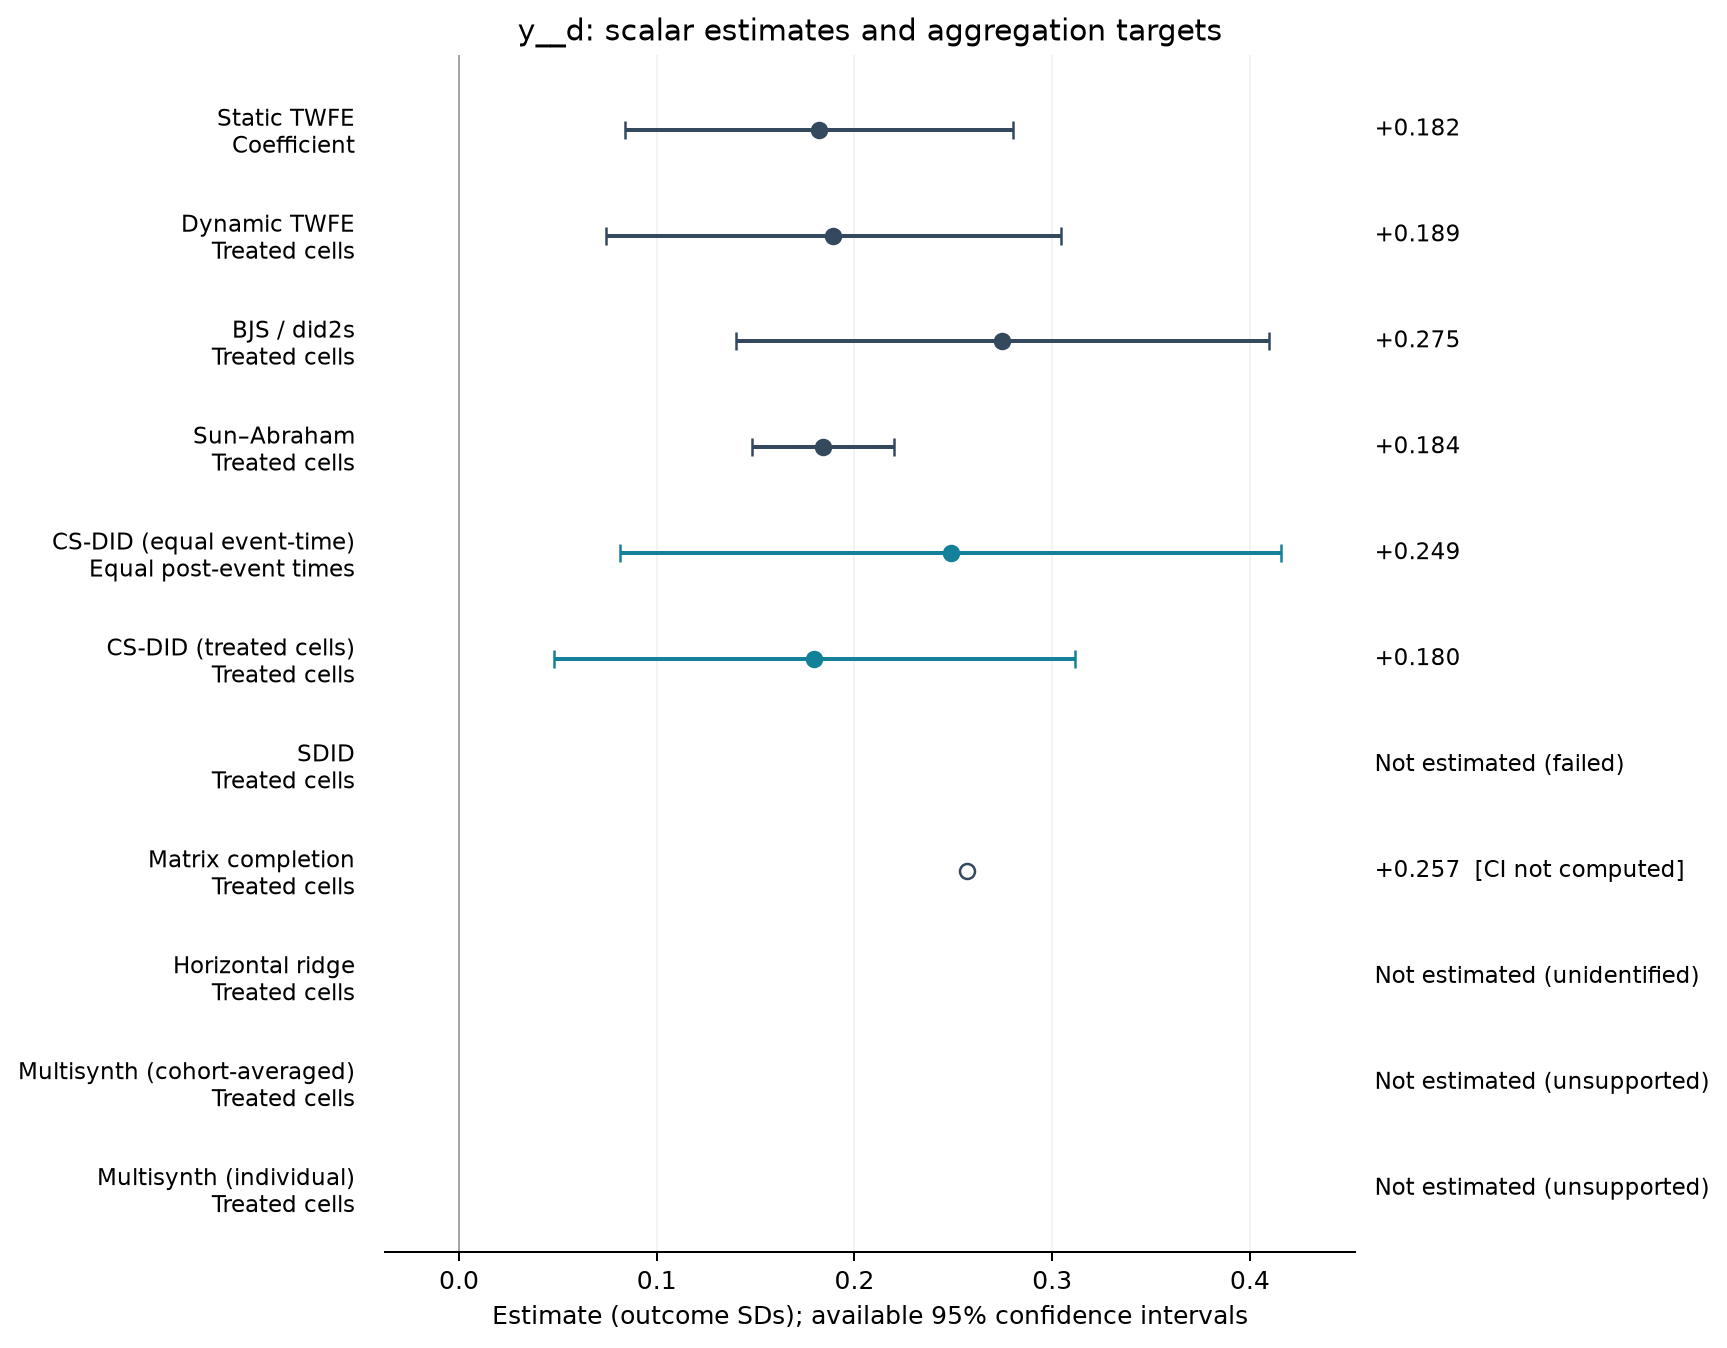
Estimate comparison
| Estimator | Estimate (SDs) | SE | 95% CI | Averaging |
|---|---|---|---|---|
| Static TWFE | 0.182 | 0.050 | [0.084, 0.280] | Coefficient |
| Dynamic TWFE | 0.189 | 0.059 | [0.074, 0.304] | Treated cells |
| BJS / did2s | 0.275 | 0.069 | [0.140, 0.410] | Treated cells |
| Sun–Abraham | 0.184 | 0.018 | [0.148, 0.220] | Treated cells |
| CS-DID (equal event-time) | 0.249 | 0.085 | [0.082, 0.416] | Equal post-event times |
| CS-DID (treated cells) | 0.180 | 0.067 | [0.048, 0.311] | Treated cells |
| Matrix completion | 0.257 | — | — | Treated cells |
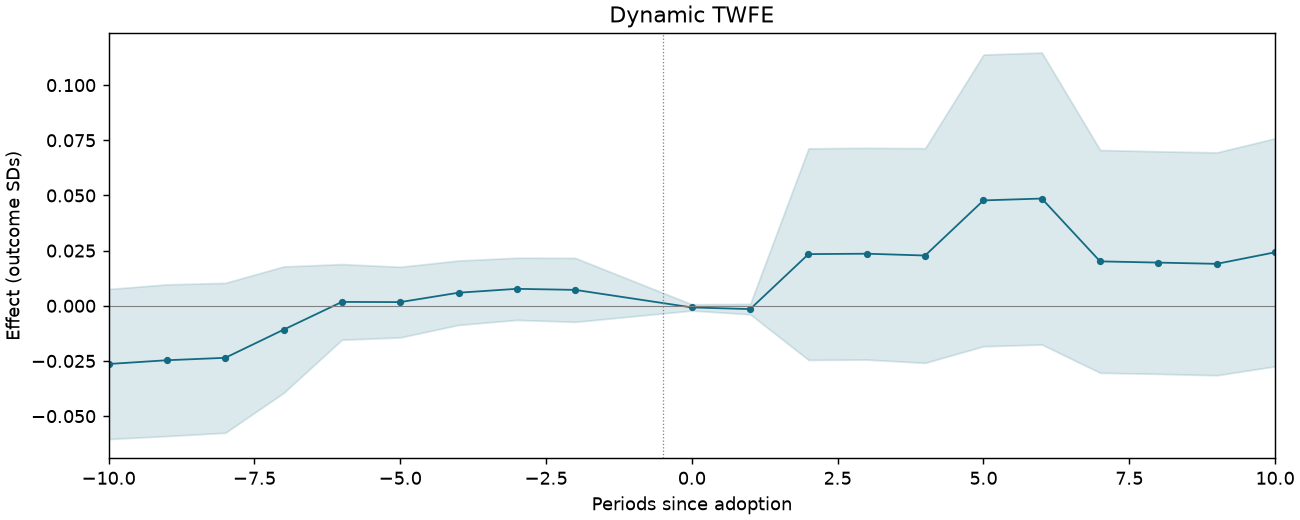
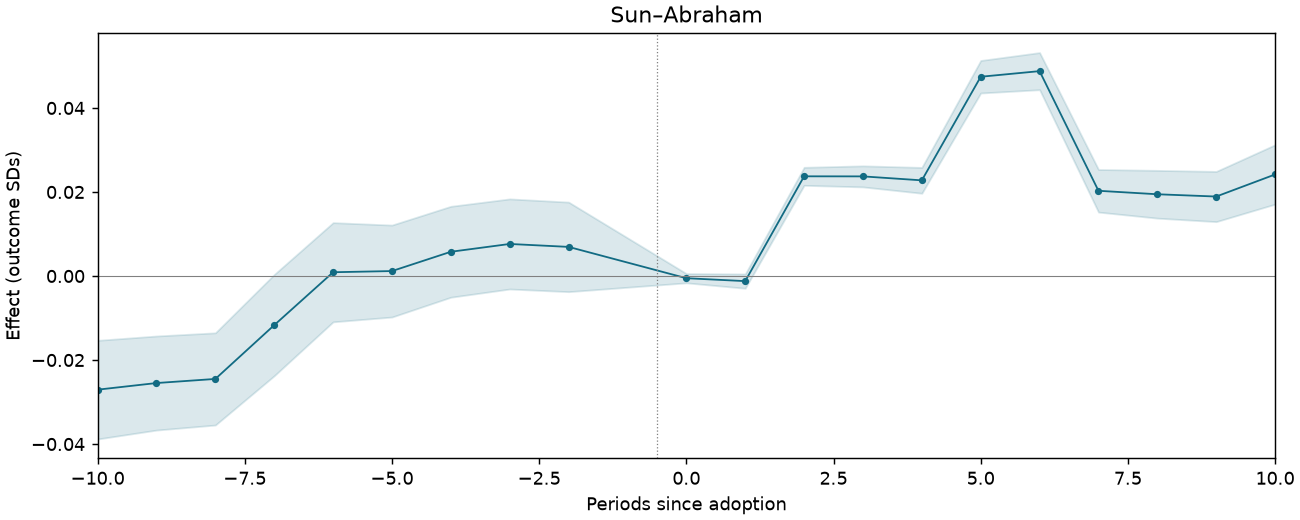
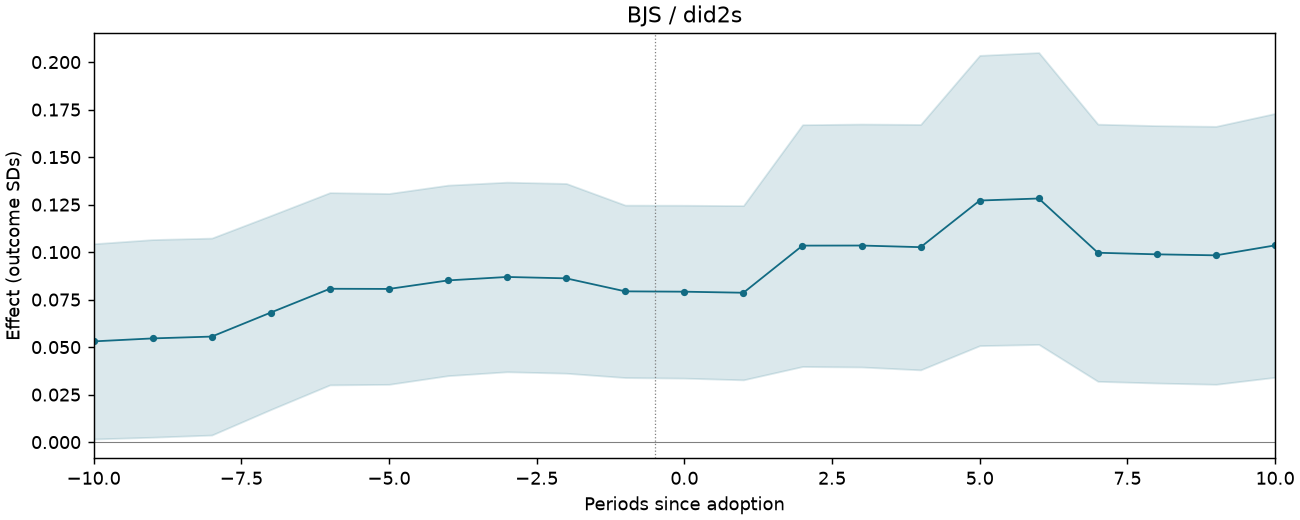
Event studies
Periods −10 to +10; pointwise 95% intervals where available.
FISCAL-T3-C5-SIZE-ALL
101,998 observations · 618 units · 618 clusters · 30 treated / 588 control units.
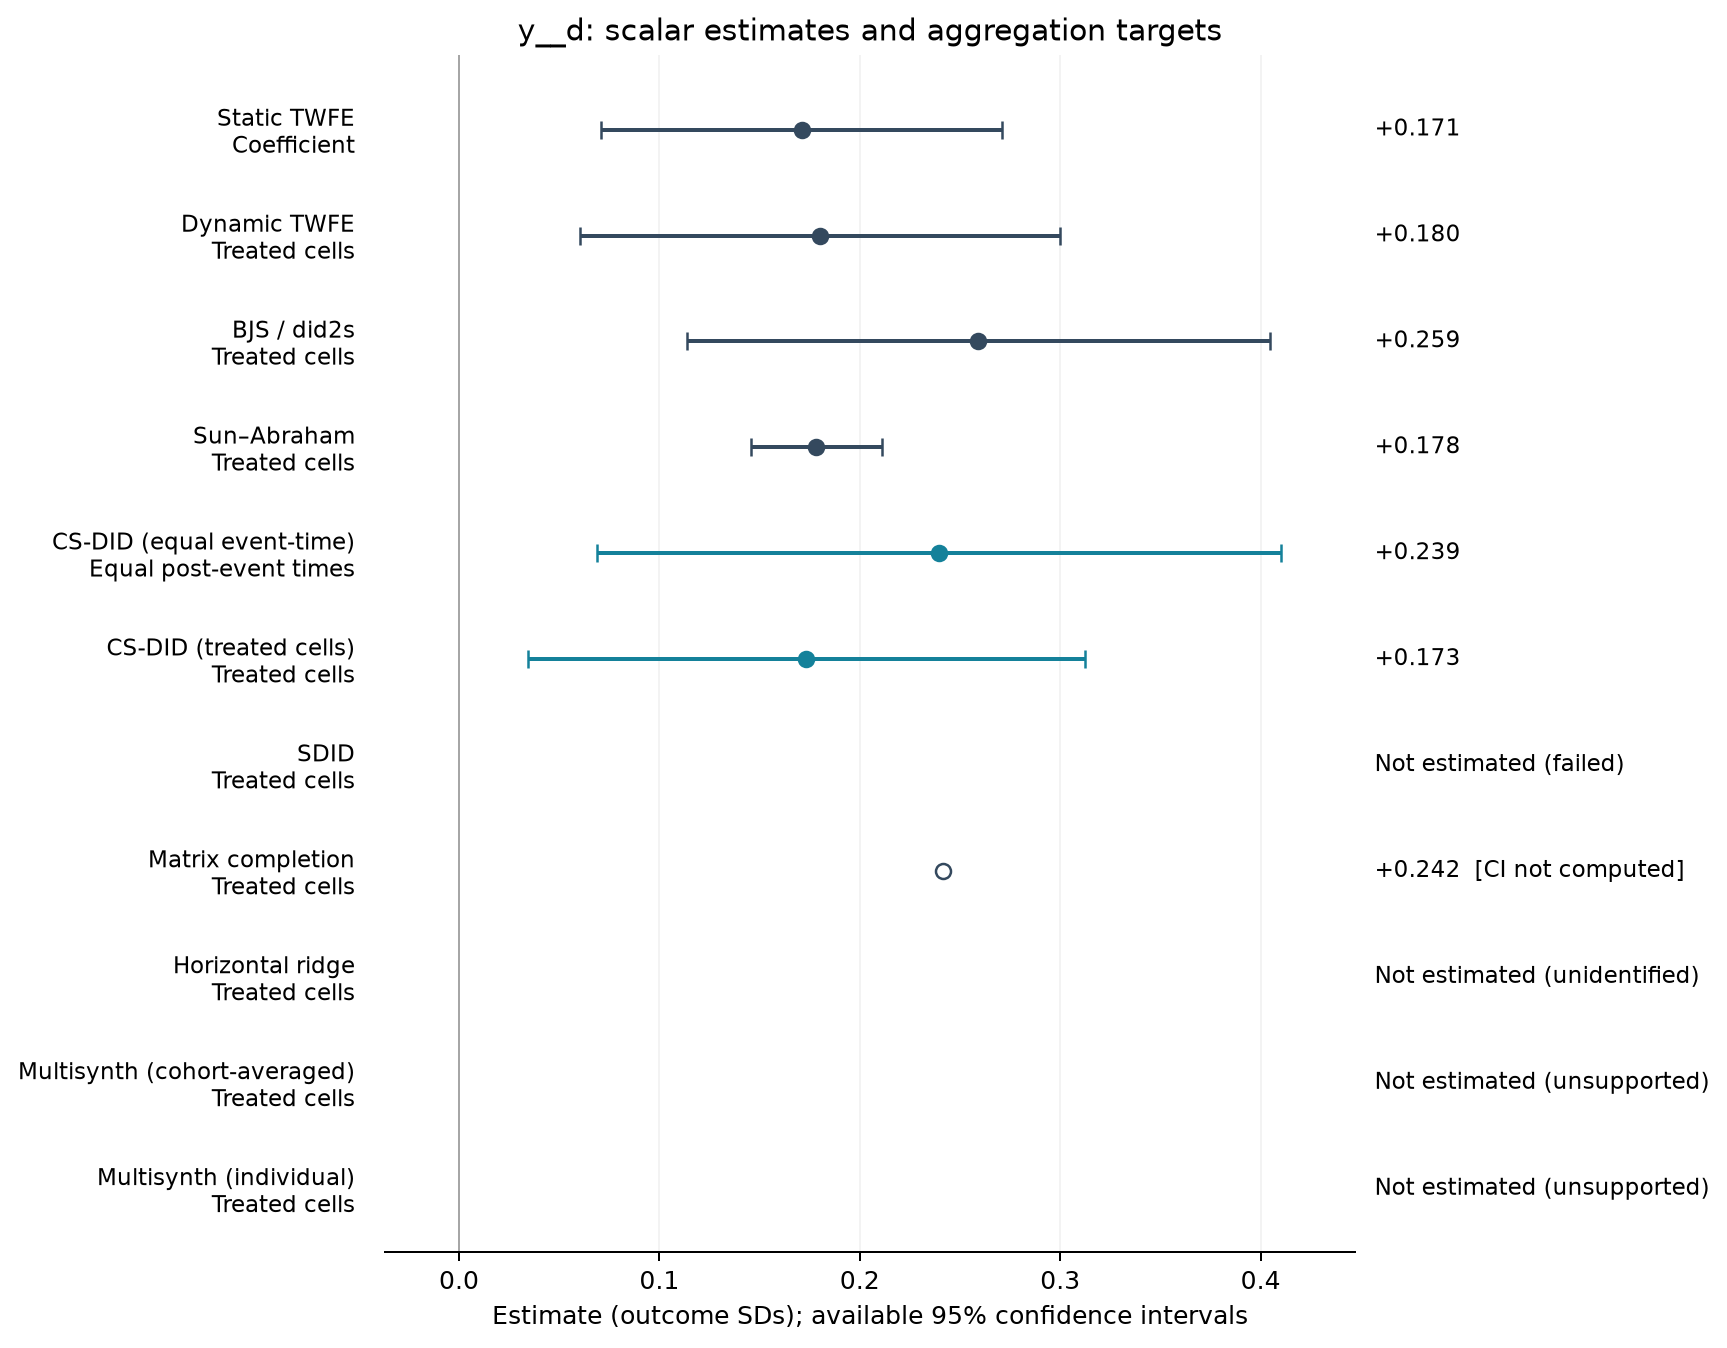
Estimate comparison
| Estimator | Estimate (SDs) | SE | 95% CI | Averaging |
|---|---|---|---|---|
| Static TWFE | 0.171 | 0.051 | [0.071, 0.271] | Coefficient |
| Dynamic TWFE | 0.180 | 0.061 | [0.060, 0.300] | Treated cells |
| BJS / did2s | 0.259 | 0.074 | [0.114, 0.405] | Treated cells |
| Sun–Abraham | 0.178 | 0.017 | [0.146, 0.211] | Treated cells |
| CS-DID (equal event-time) | 0.239 | 0.087 | [0.069, 0.410] | Equal post-event times |
| CS-DID (treated cells) | 0.173 | 0.071 | [0.034, 0.312] | Treated cells |
| Matrix completion | 0.242 | — | — | Treated cells |
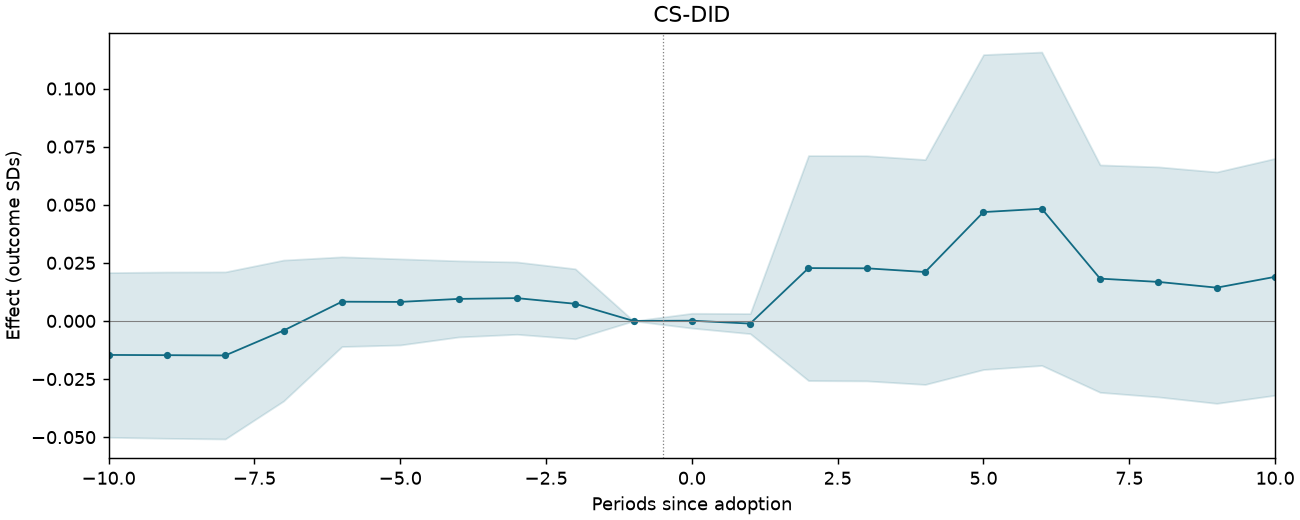
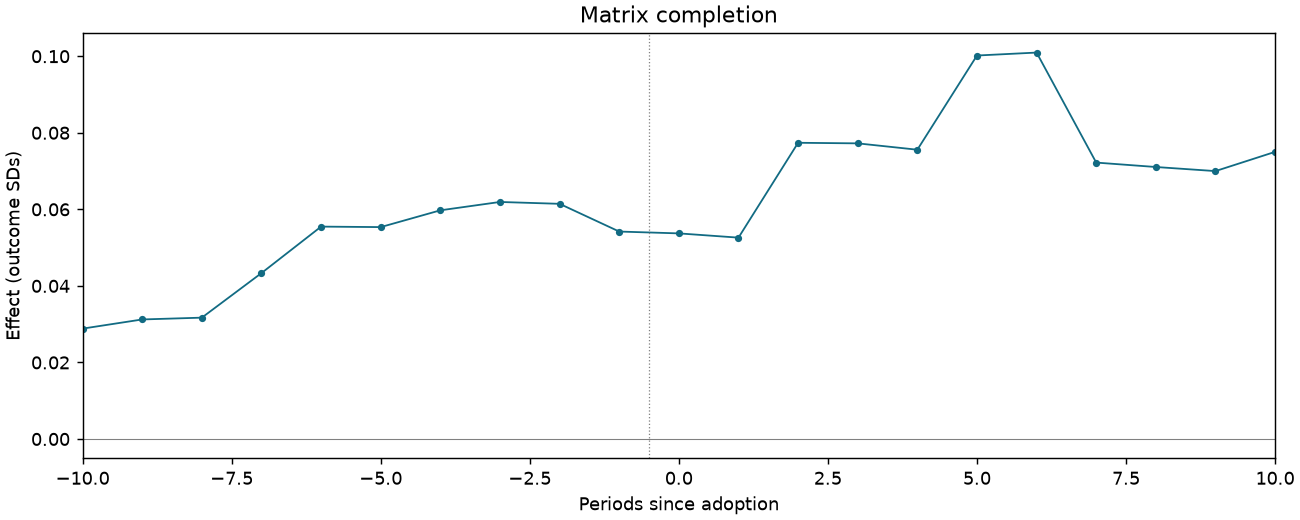
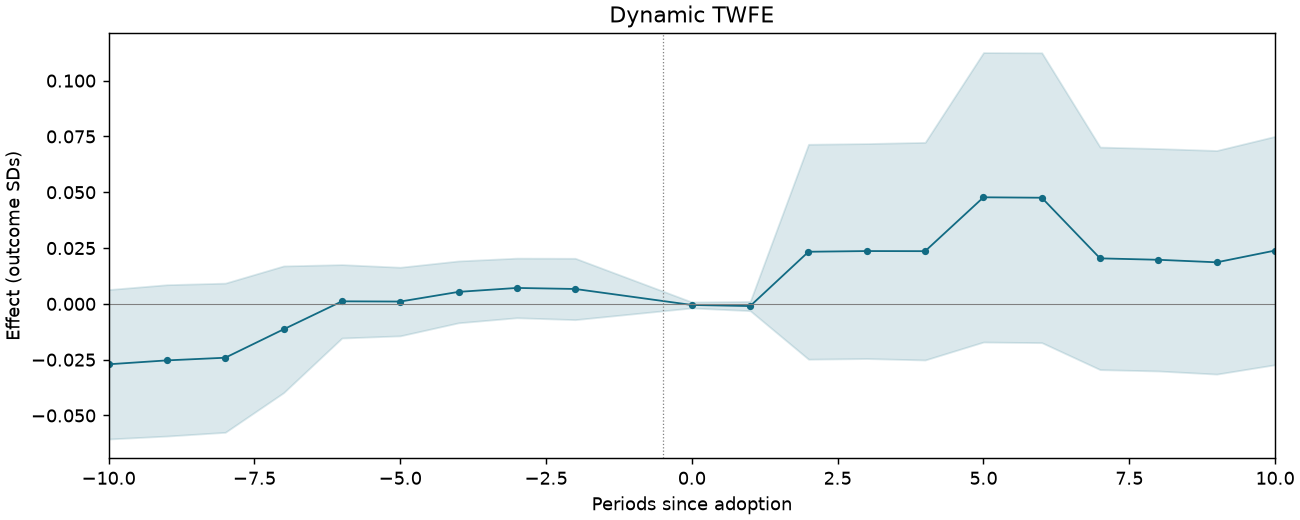
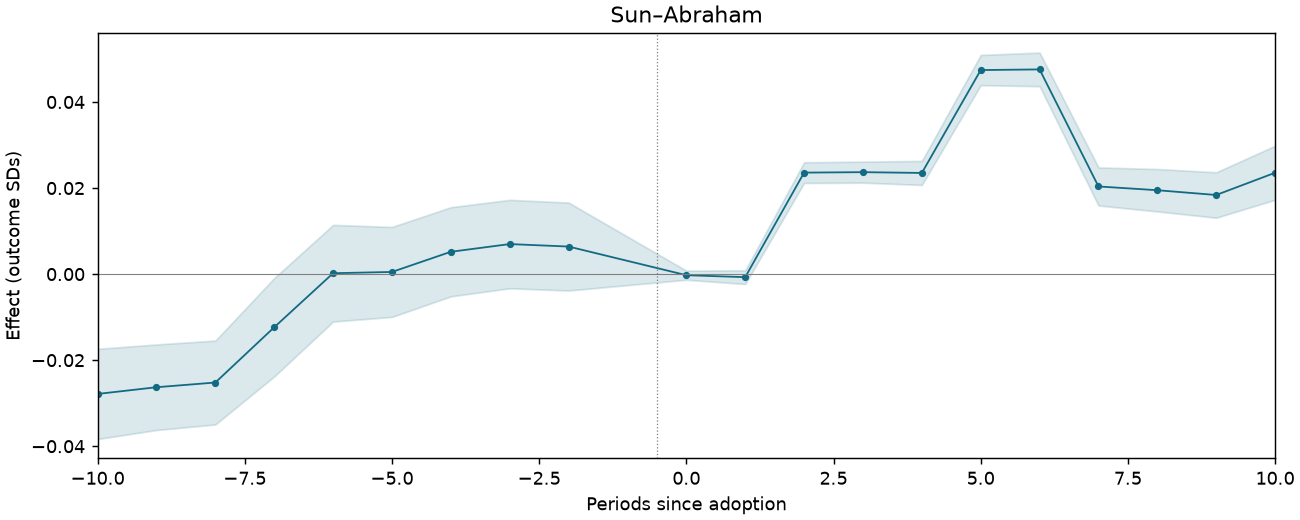
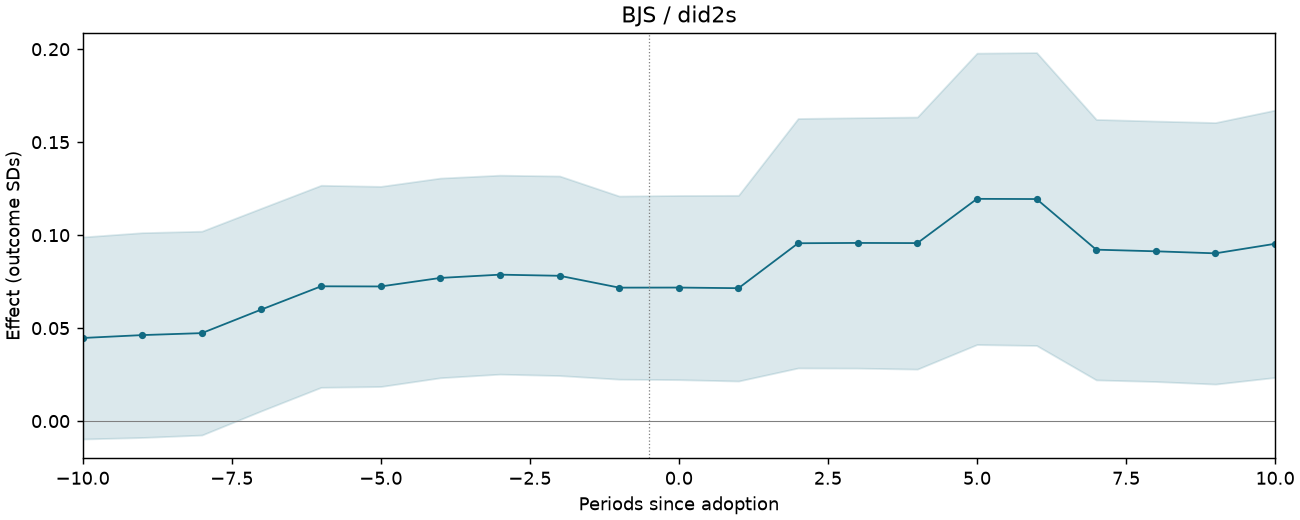
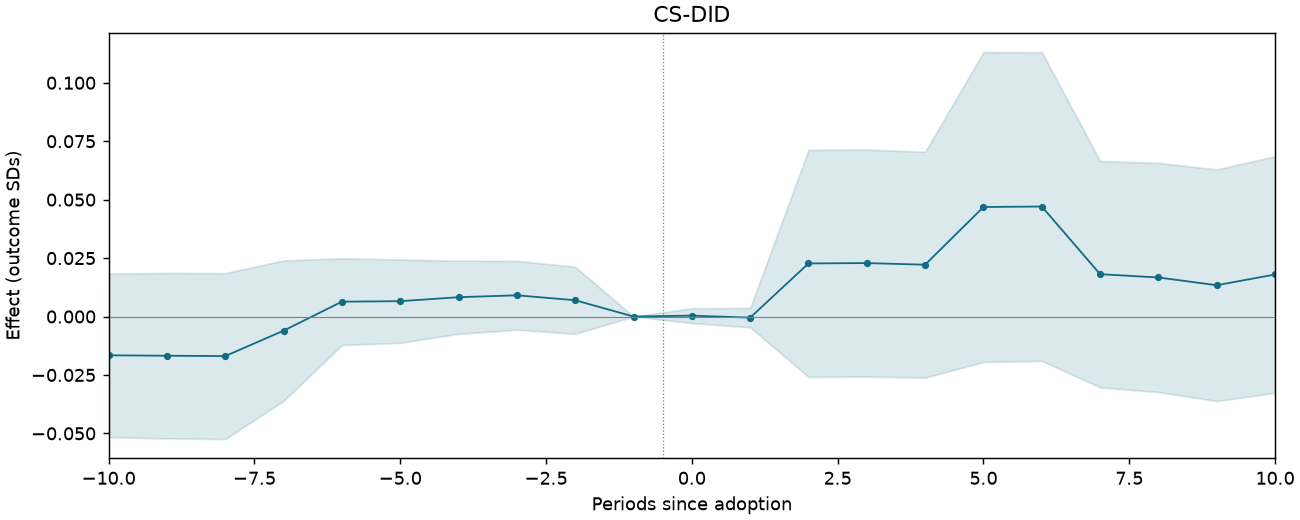
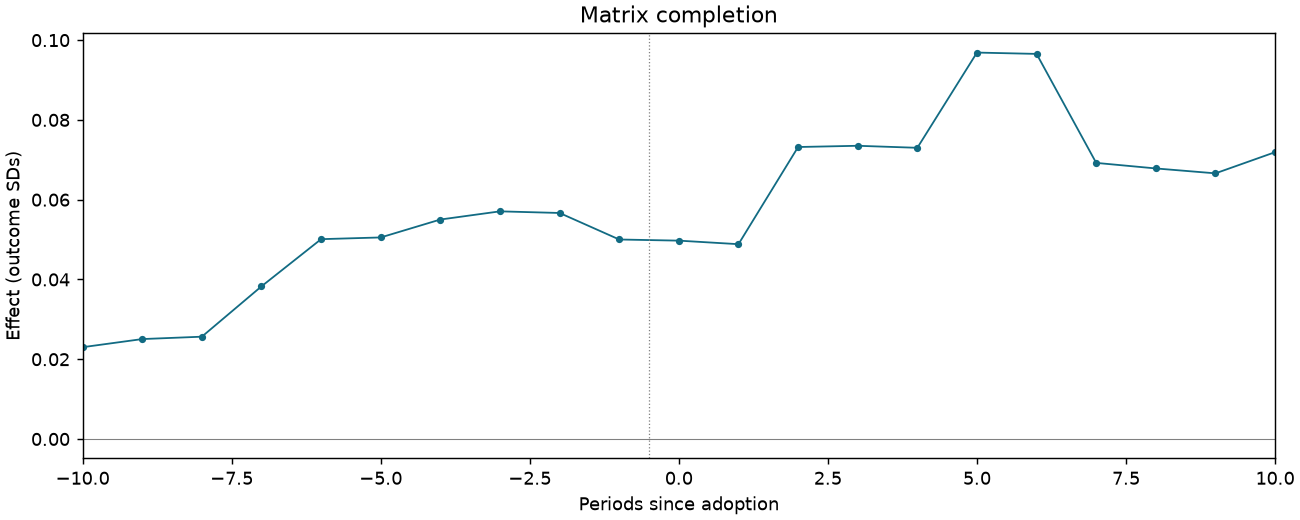
Event studies
Periods −10 to +10; pointwise 95% intervals where available.
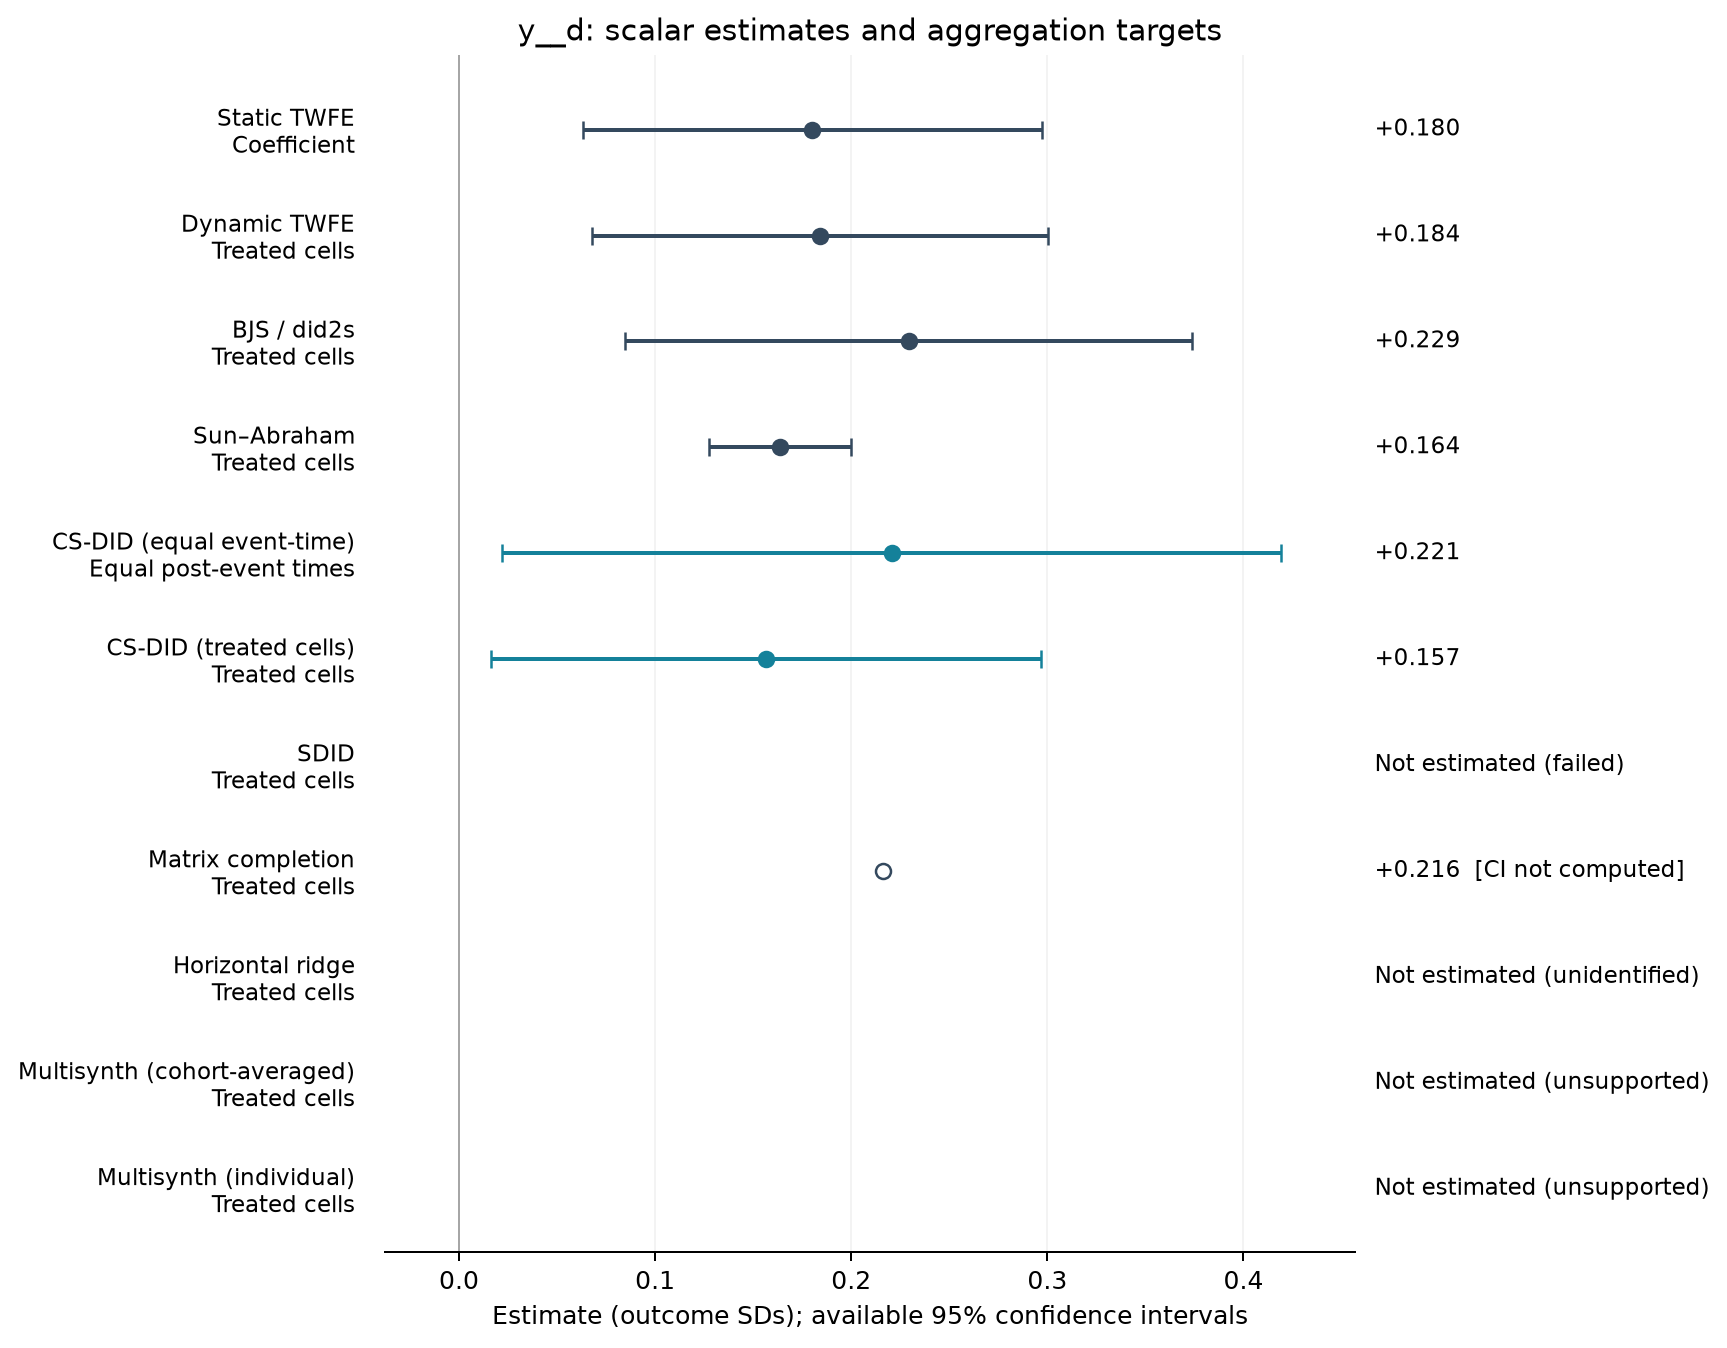
FISCAL-T4-C1-COMPACT-TERRITORY
101,998 observations · 618 units · 618 clusters · 30 treated / 588 control units.
Estimate comparison
| Estimator | Estimate (SDs) | SE | 95% CI | Averaging |
|---|---|---|---|---|
| Static TWFE | 0.180 | 0.059 | [0.063, 0.297] | Coefficient |
| Dynamic TWFE | 0.184 | 0.059 | [0.068, 0.300] | Treated cells |
| BJS / did2s | 0.229 | 0.074 | [0.085, 0.374] | Treated cells |
| Sun–Abraham | 0.164 | 0.018 | [0.128, 0.200] | Treated cells |
| CS-DID (equal event-time) | 0.221 | 0.101 | [0.022, 0.419] | Equal post-event times |
| CS-DID (treated cells) | 0.157 | 0.072 | [0.016, 0.297] | Treated cells |
| Matrix completion | 0.216 | — | — | Treated cells |
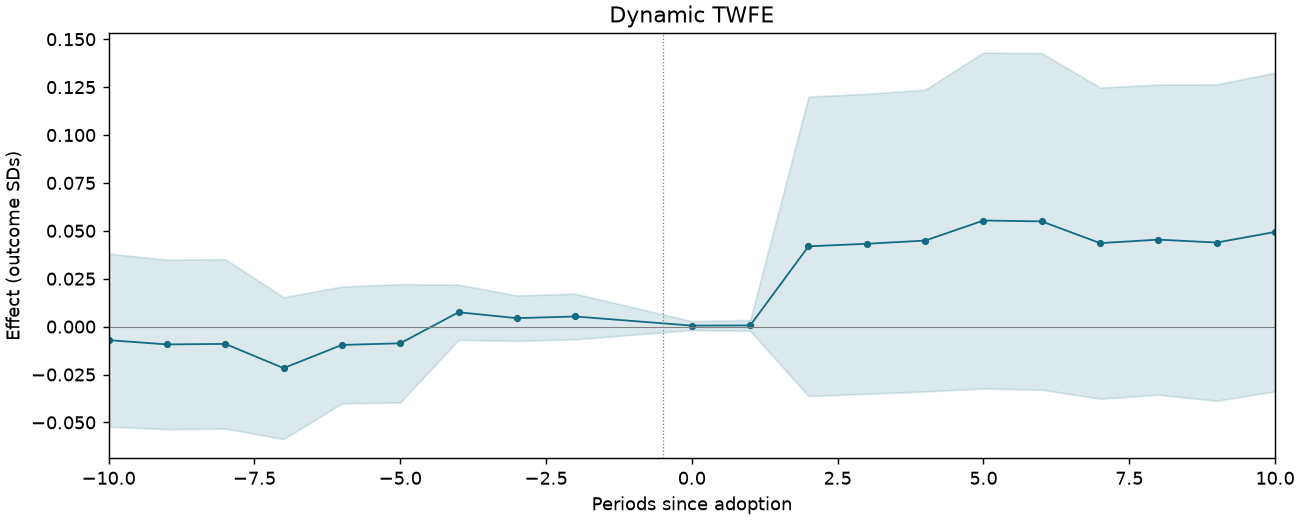
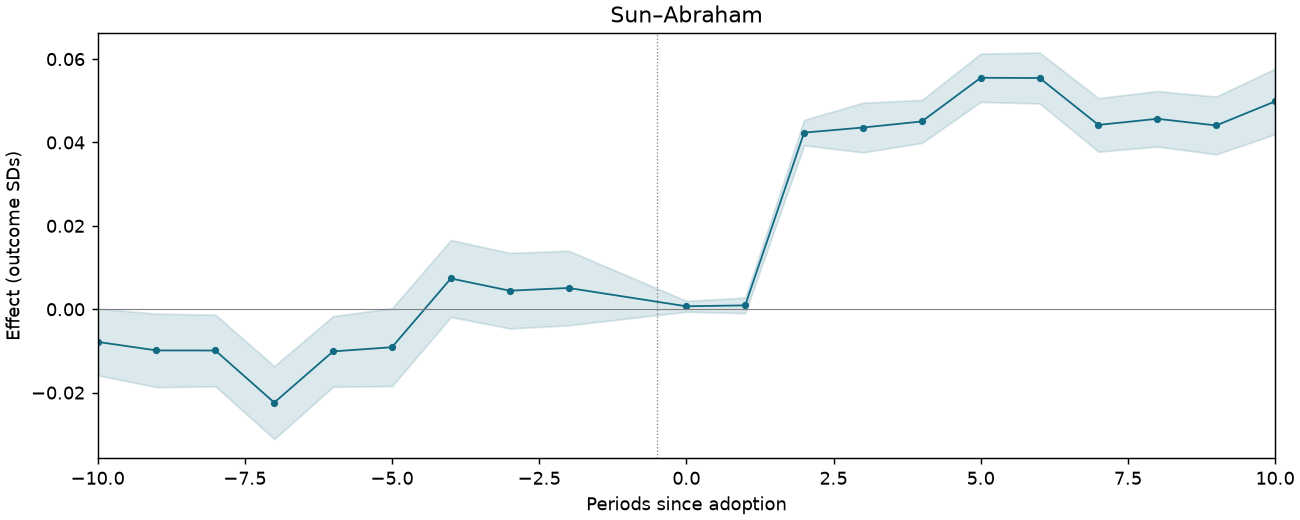
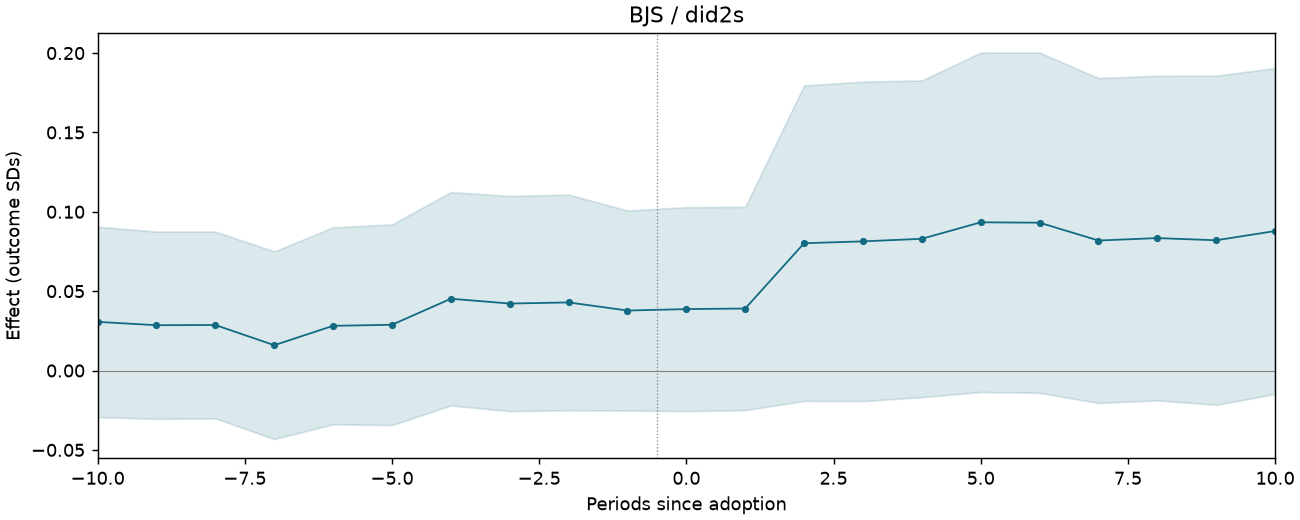
Event studies
Periods −10 to +10; pointwise 95% intervals where available.
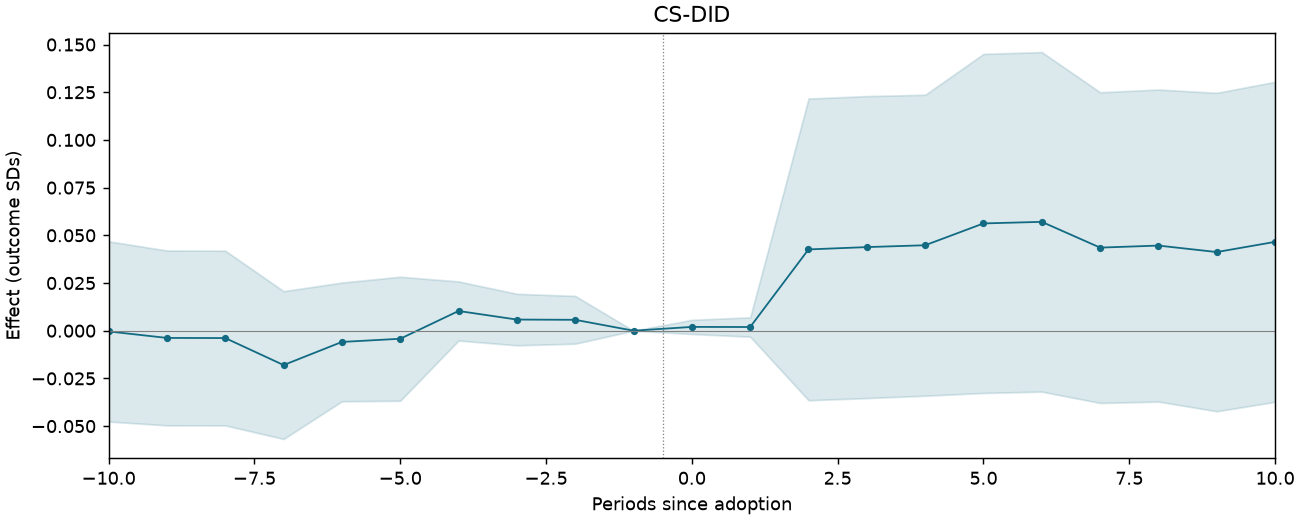
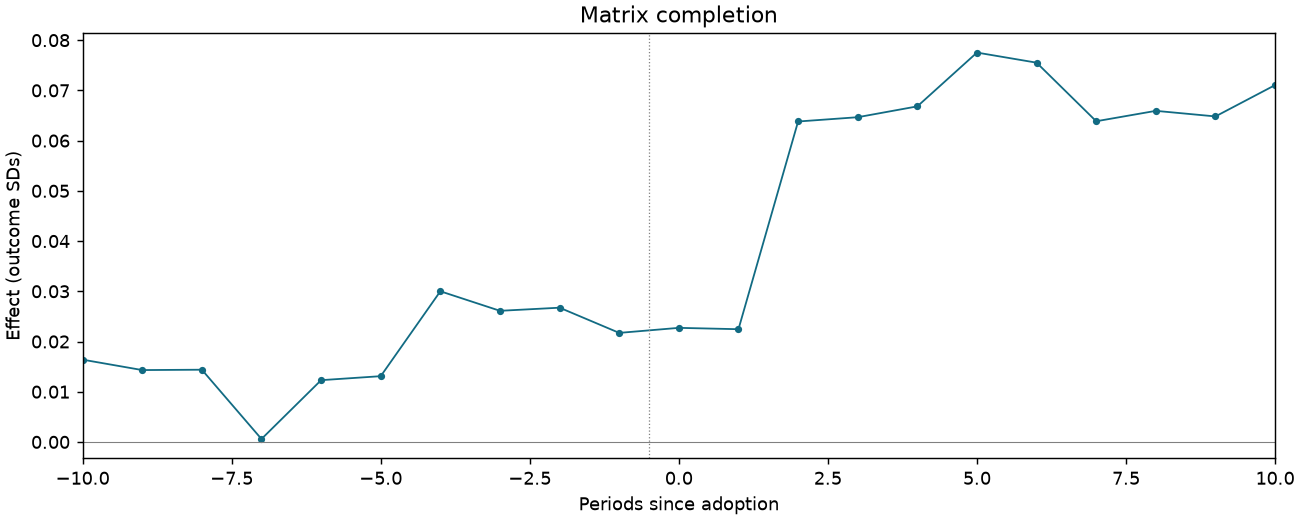
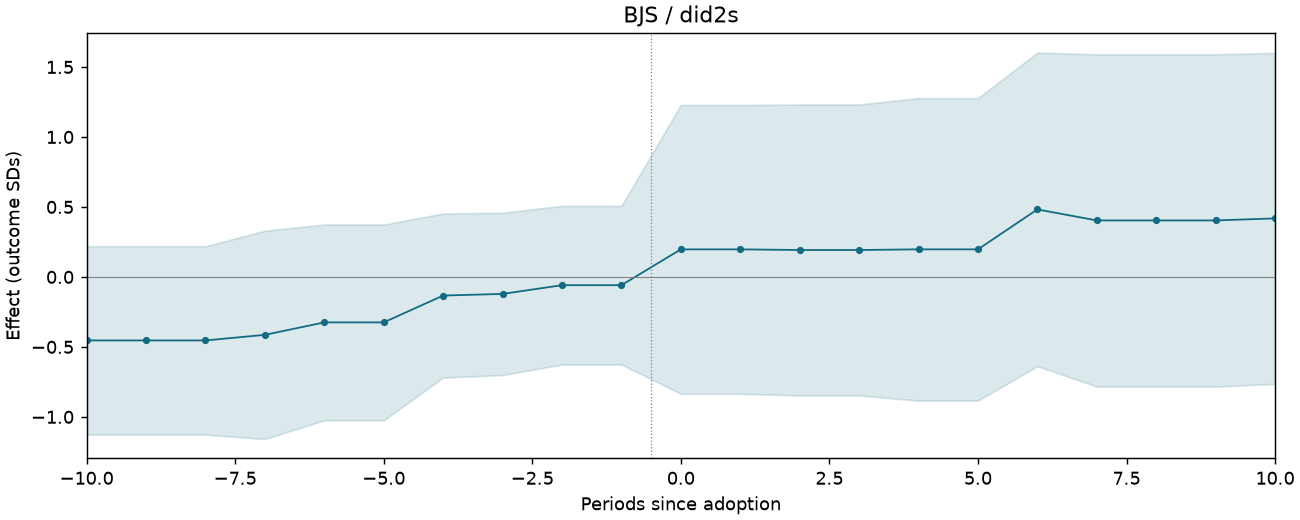
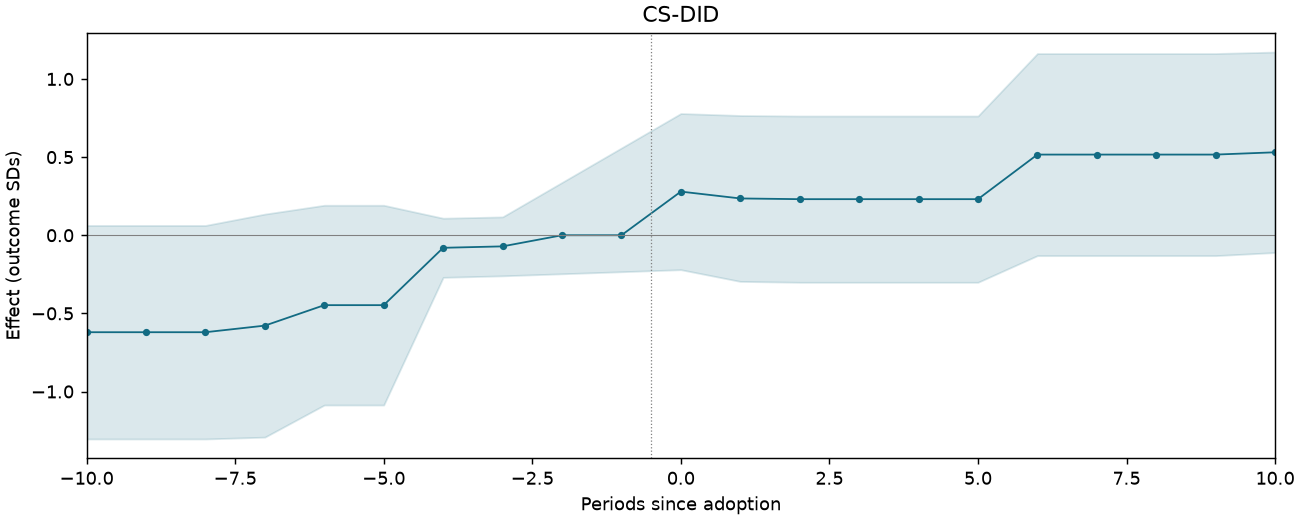
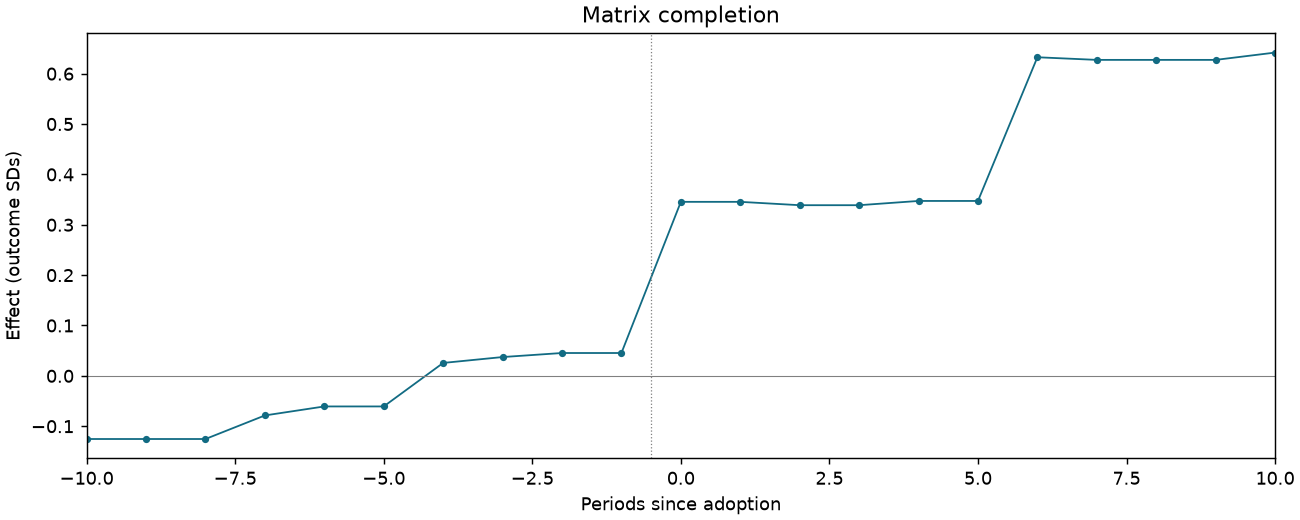
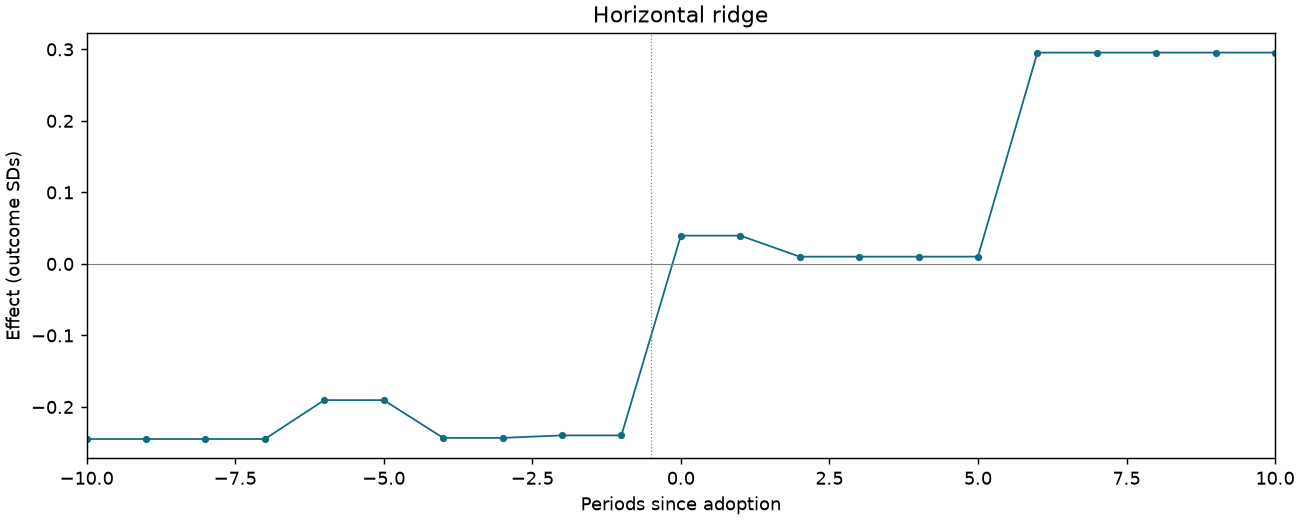
FISCAL-T8-C1-MARRIAGE-RULERS
1,198 observations · 10 units · 10 clusters · 6 treated / 4 control units.
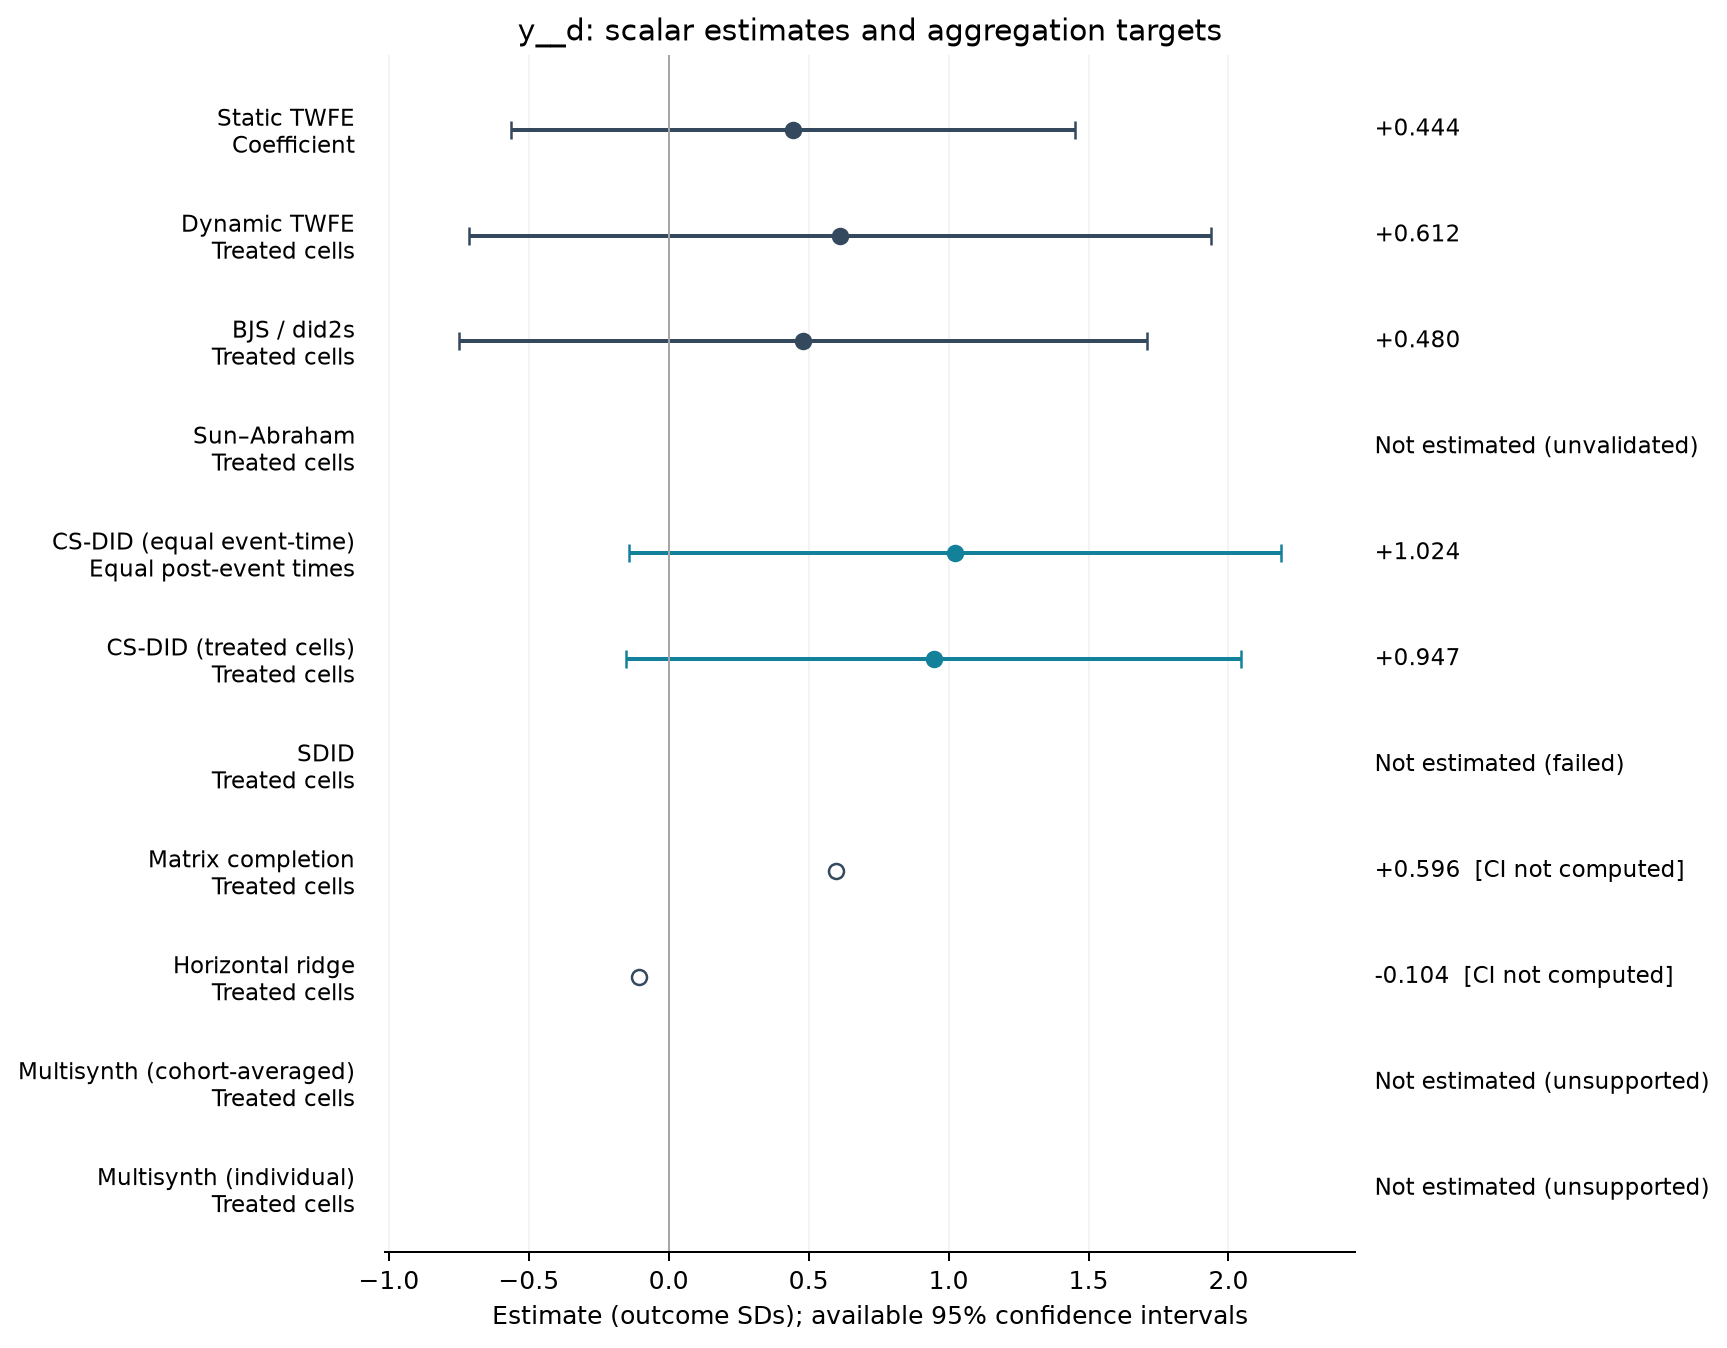
Estimate comparison
| Estimator | Estimate (SDs) | SE | 95% CI | Averaging |
|---|---|---|---|---|
| Static TWFE | 0.444 | 0.446 | [-0.564, 1.452] | Coefficient |
| Dynamic TWFE | 0.612 | 0.586 | [-0.714, 1.939] | Treated cells |
| BJS / did2s | 0.480 | 0.544 | [-0.749, 1.710] | Treated cells |
| CS-DID (equal event-time) | 1.024 | 0.594 | [-0.141, 2.188] | Equal post-event times |
| CS-DID (treated cells) | 0.947 | 0.560 | [-0.151, 2.046] | Treated cells |
| Matrix completion | 0.596 | — | — | Treated cells |
| Horizontal ridge | -0.104 | — | — | Treated cells |
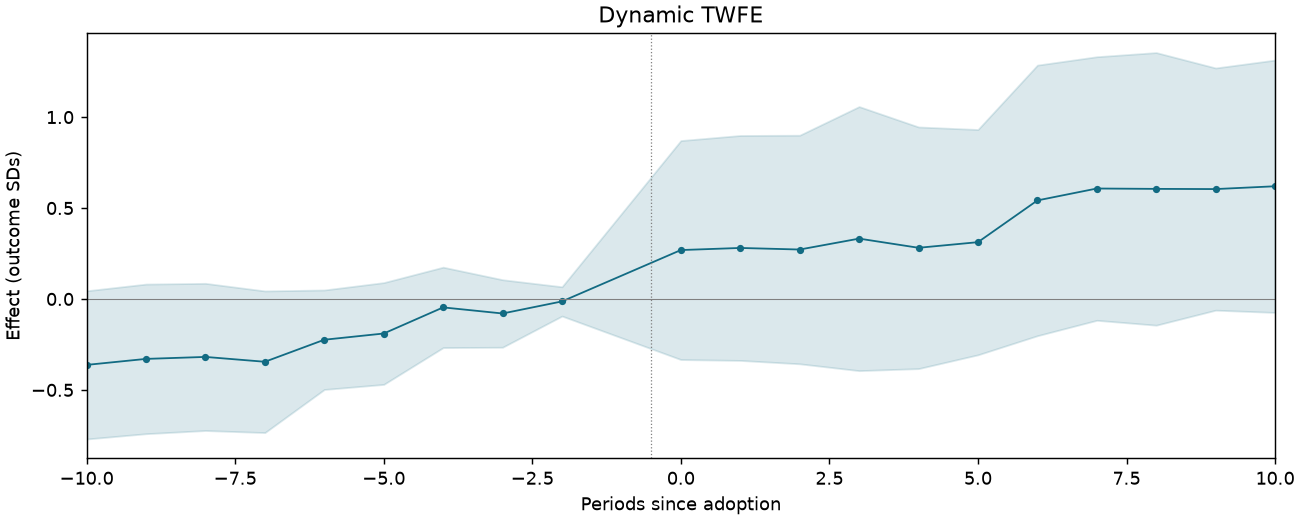
Event studies
Periods −10 to +10; pointwise 95% intervals where available.
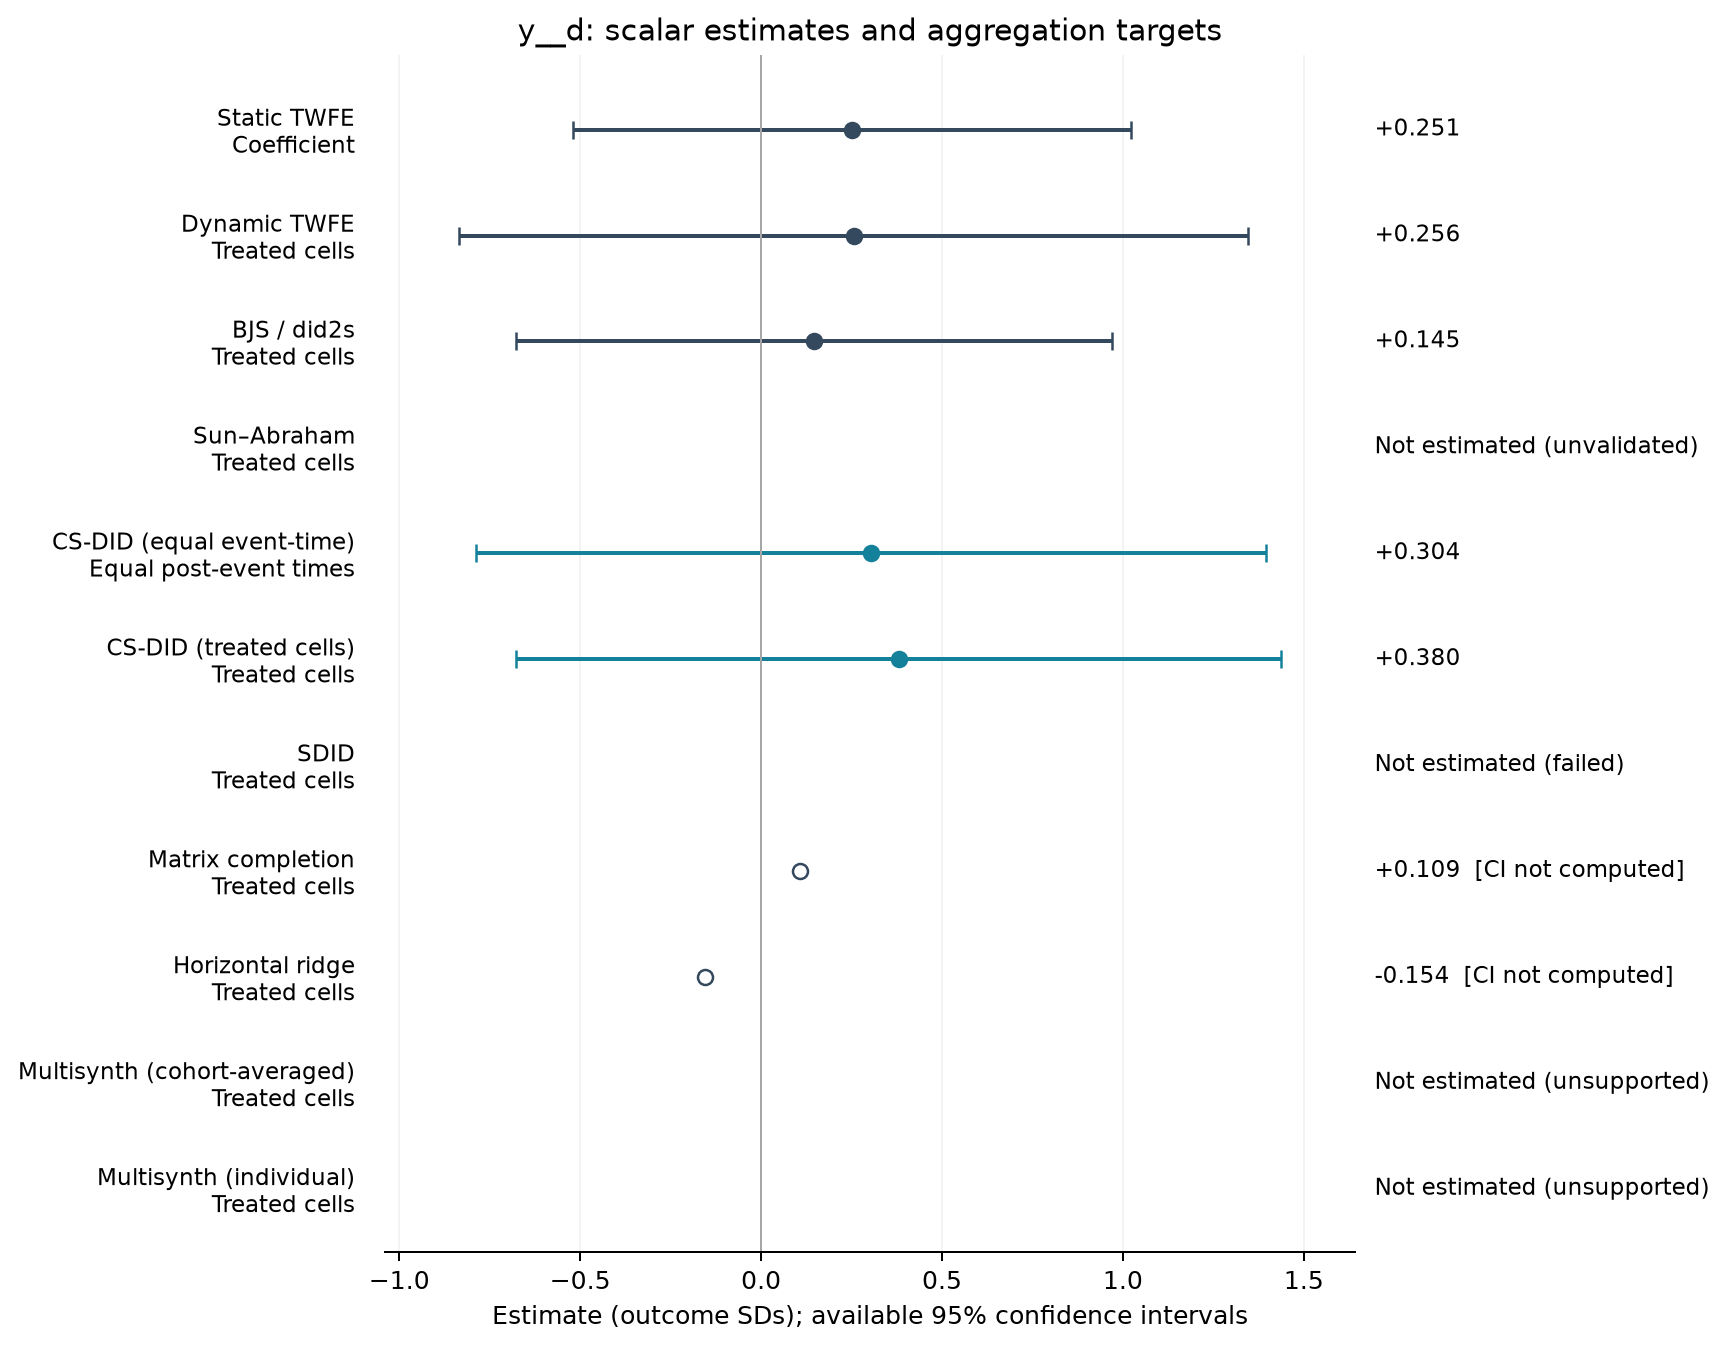
FISCAL-T8-C3-MARRIAGE-LAND
1,198 observations · 10 units · 10 clusters · 6 treated / 4 control units.
Estimate comparison
| Estimator | Estimate (SDs) | SE | 95% CI | Averaging |
|---|---|---|---|---|
| Static TWFE | 0.251 | 0.341 | [-0.521, 1.022] | Coefficient |
| Dynamic TWFE | 0.256 | 0.482 | [-0.835, 1.346] | Treated cells |
| BJS / did2s | 0.145 | 0.364 | [-0.678, 0.969] | Treated cells |
| CS-DID (equal event-time) | 0.304 | 0.557 | [-0.787, 1.395] | Equal post-event times |
| CS-DID (treated cells) | 0.380 | 0.539 | [-0.677, 1.437] | Treated cells |
| Matrix completion | 0.109 | — | — | Treated cells |
| Horizontal ridge | -0.154 | — | — | Treated cells |
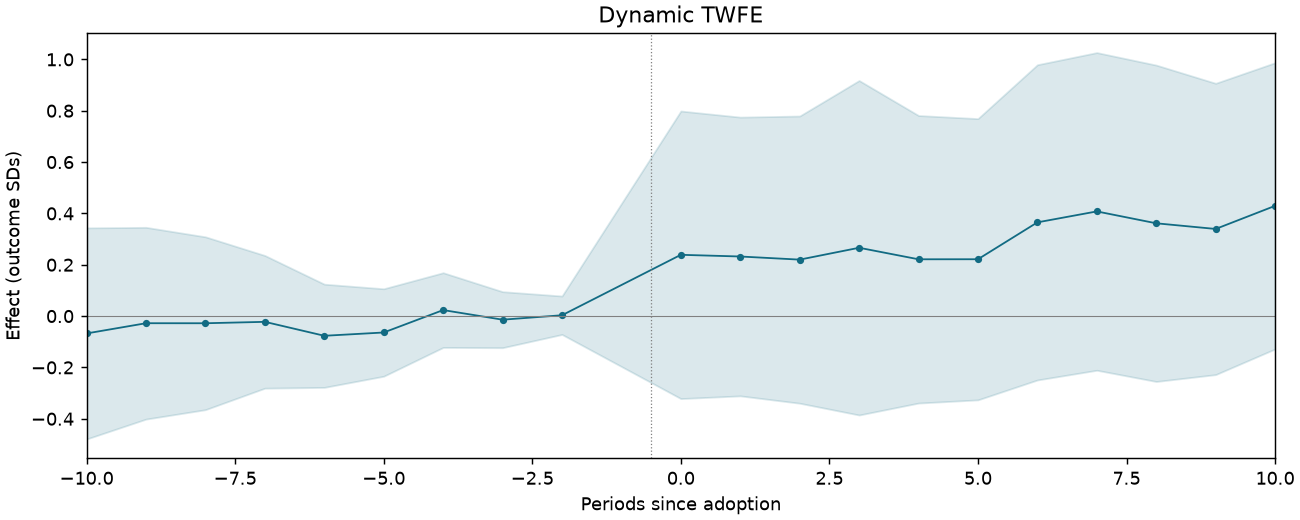
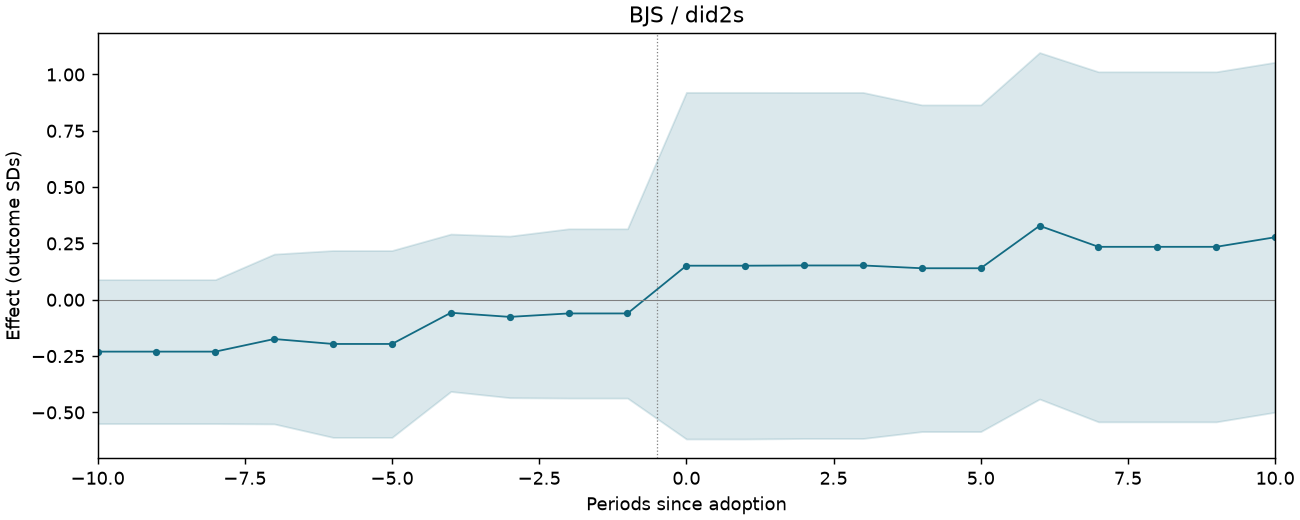
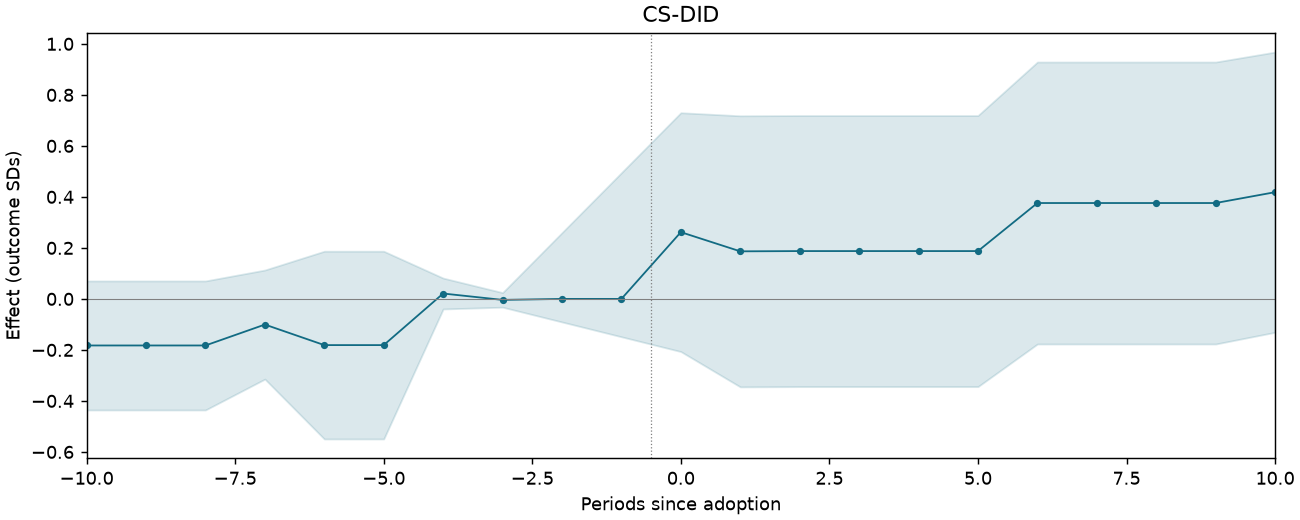
Event studies
Periods −10 to +10; pointwise 95% intervals where available.
FISCAL-T9-C1-VANISH-NOEXT
101,998 observations · 618 units · 618 clusters · 30 treated / 588 control units.
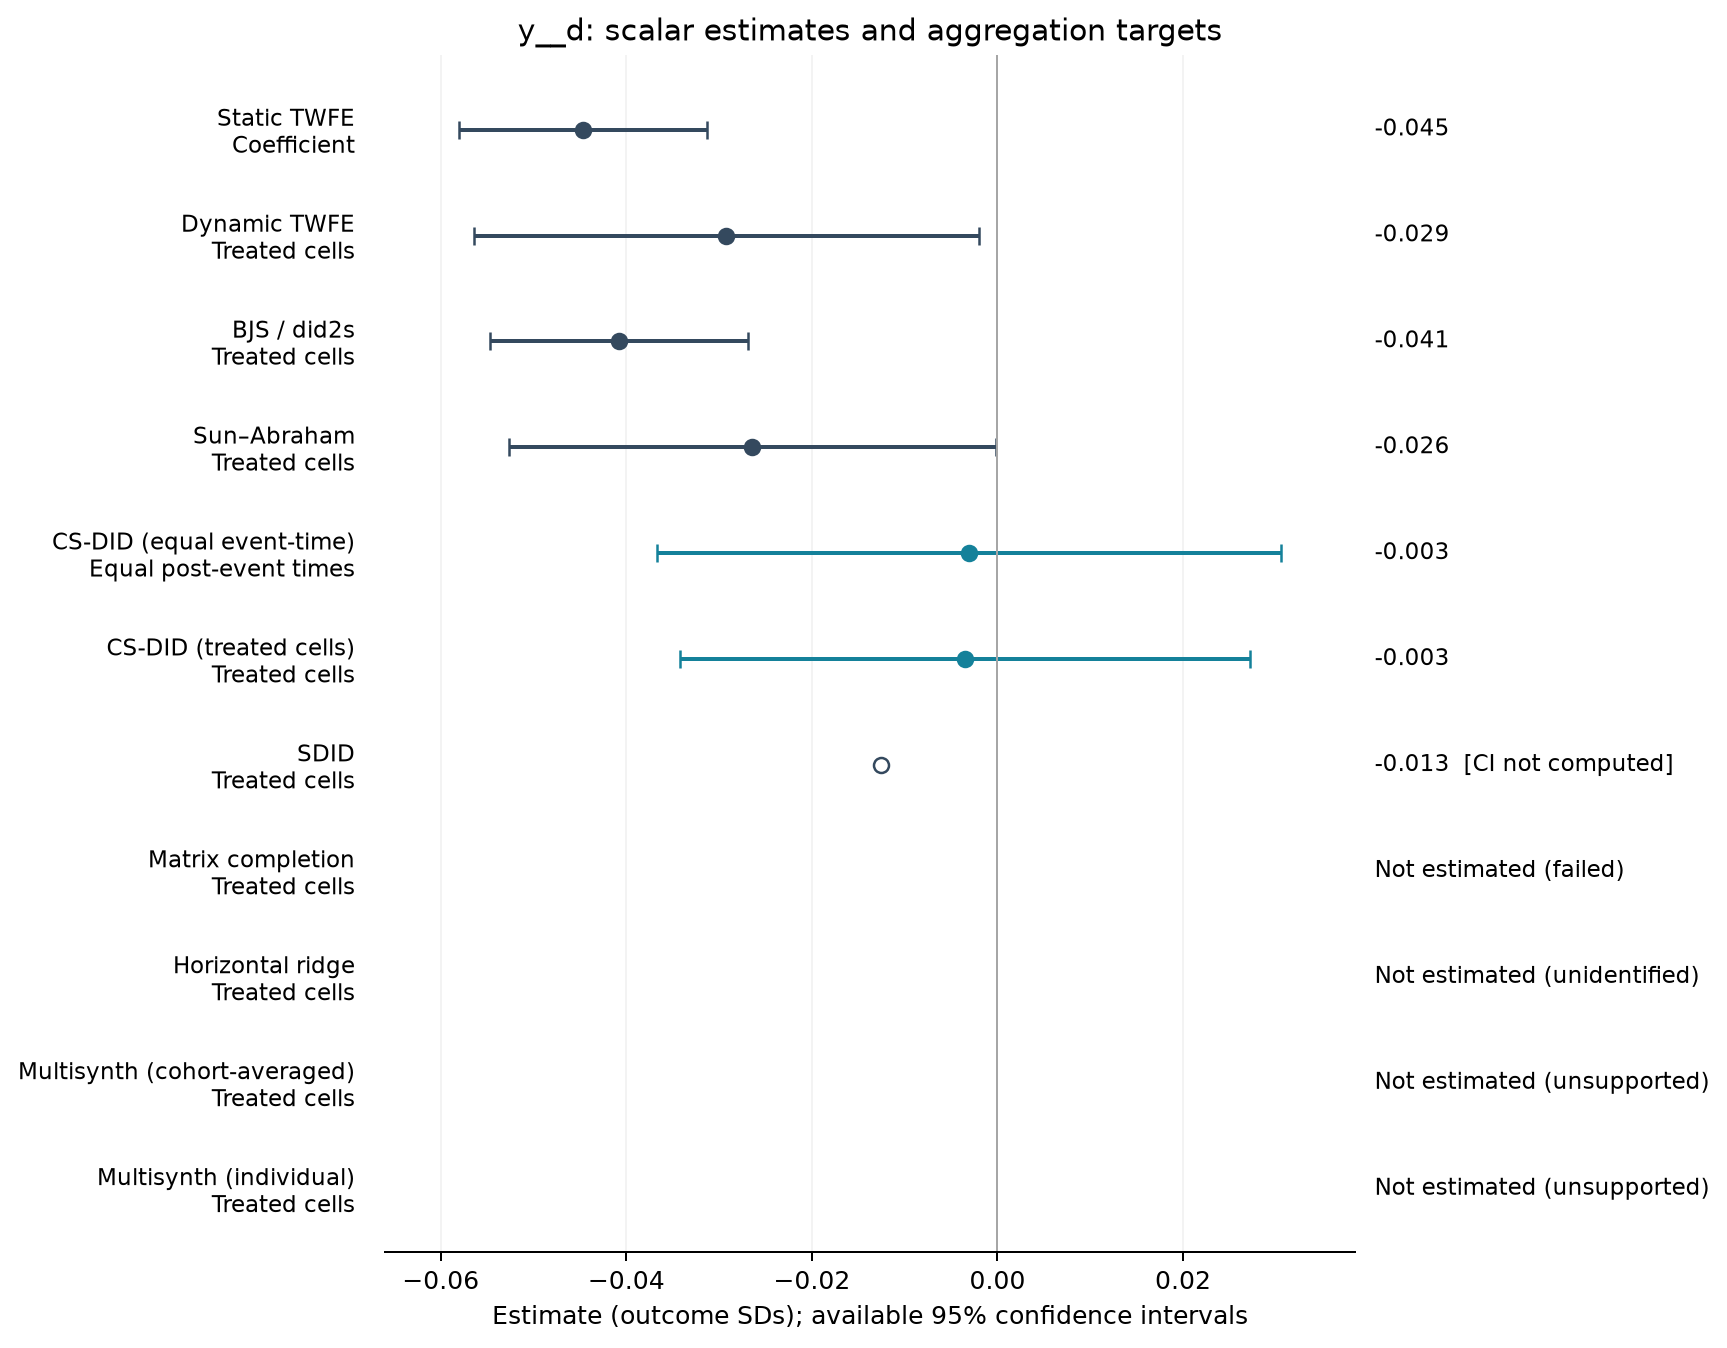
Estimate comparison
| Estimator | Estimate (SDs) | SE | 95% CI | Averaging |
|---|---|---|---|---|
| Static TWFE | -0.045 | 0.007 | [-0.058, -0.031] | Coefficient |
| Dynamic TWFE | -0.029 | 0.014 | [-0.056, -0.002] | Treated cells |
| BJS / did2s | -0.041 | 0.007 | [-0.055, -0.027] | Treated cells |
| Sun–Abraham | -0.026 | 0.013 | [-0.053, -0.000] | Treated cells |
| CS-DID (equal event-time) | -0.003 | 0.017 | [-0.037, 0.031] | Equal post-event times |
| CS-DID (treated cells) | -0.003 | 0.016 | [-0.034, 0.027] | Treated cells |
| SDID | -0.013 | — | — | Treated cells |
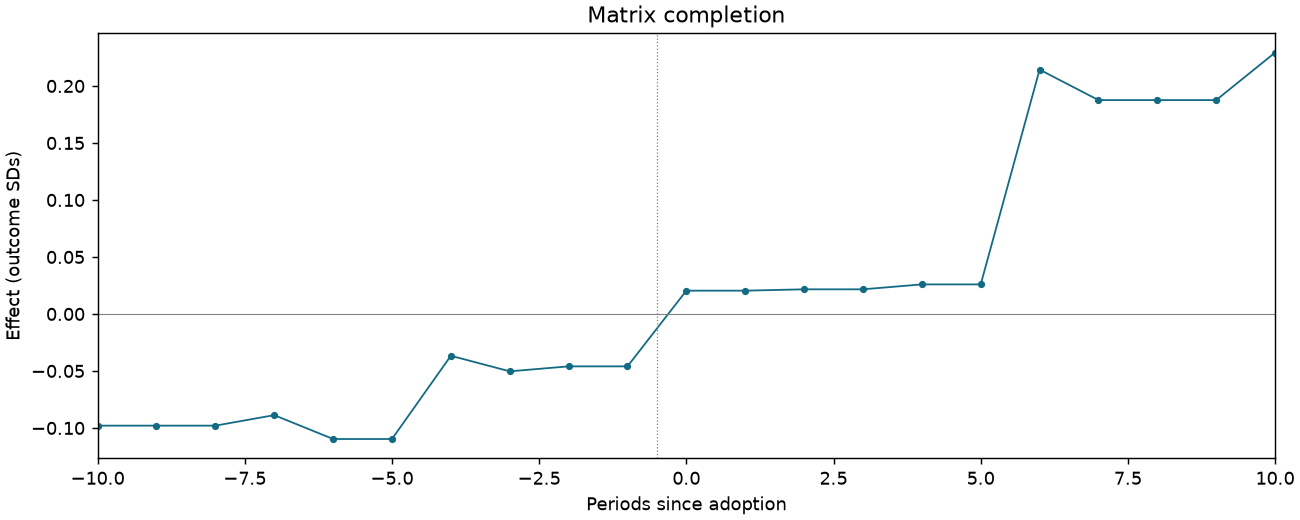
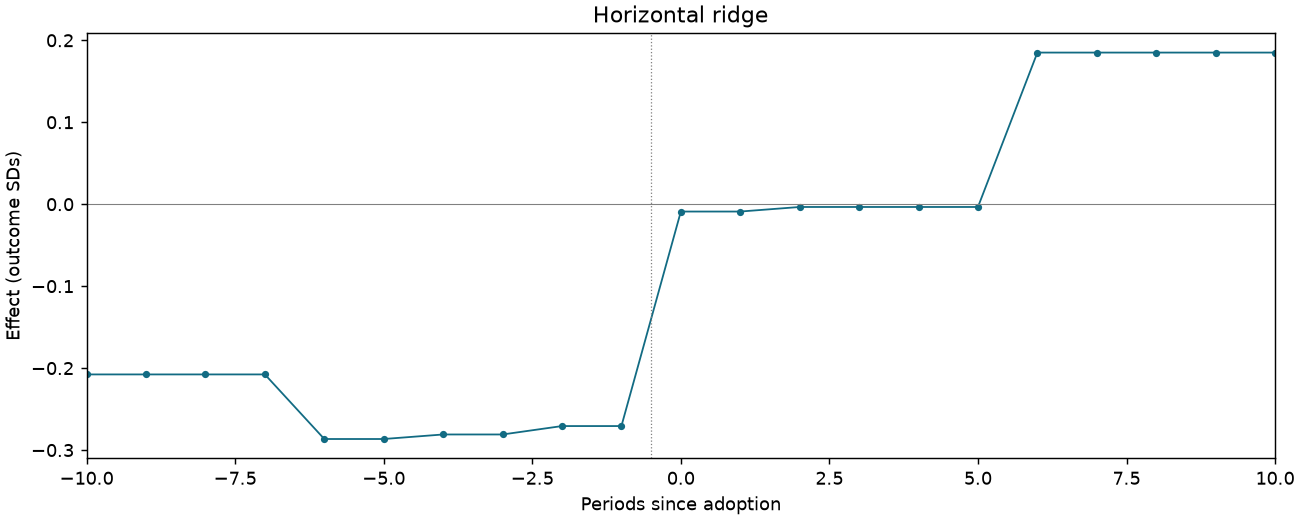
Event studies
Periods −10 to +10; pointwise 95% intervals where available.