The Gift of a Lifetime — expanded estimators
Archive index · Regression tests · Results & settings (JSON) · Methods & code
Hollingsworth et al. (2024), AER. https://doi.org/10.1257/aer.20230008
9 specifications. Effects are in outcome standard deviations; intervals are 95%.
Treatment adoption

S16-P001: seeded sample of 91 of 91 eligible units. Purple untreated; yellow treated; white unobserved.
GIFT-F4-LOGIMR-CSA-BLACK
1,826 observations · 91 units · 91 clusters · 41 treated / 50 control units.
Estimate comparison
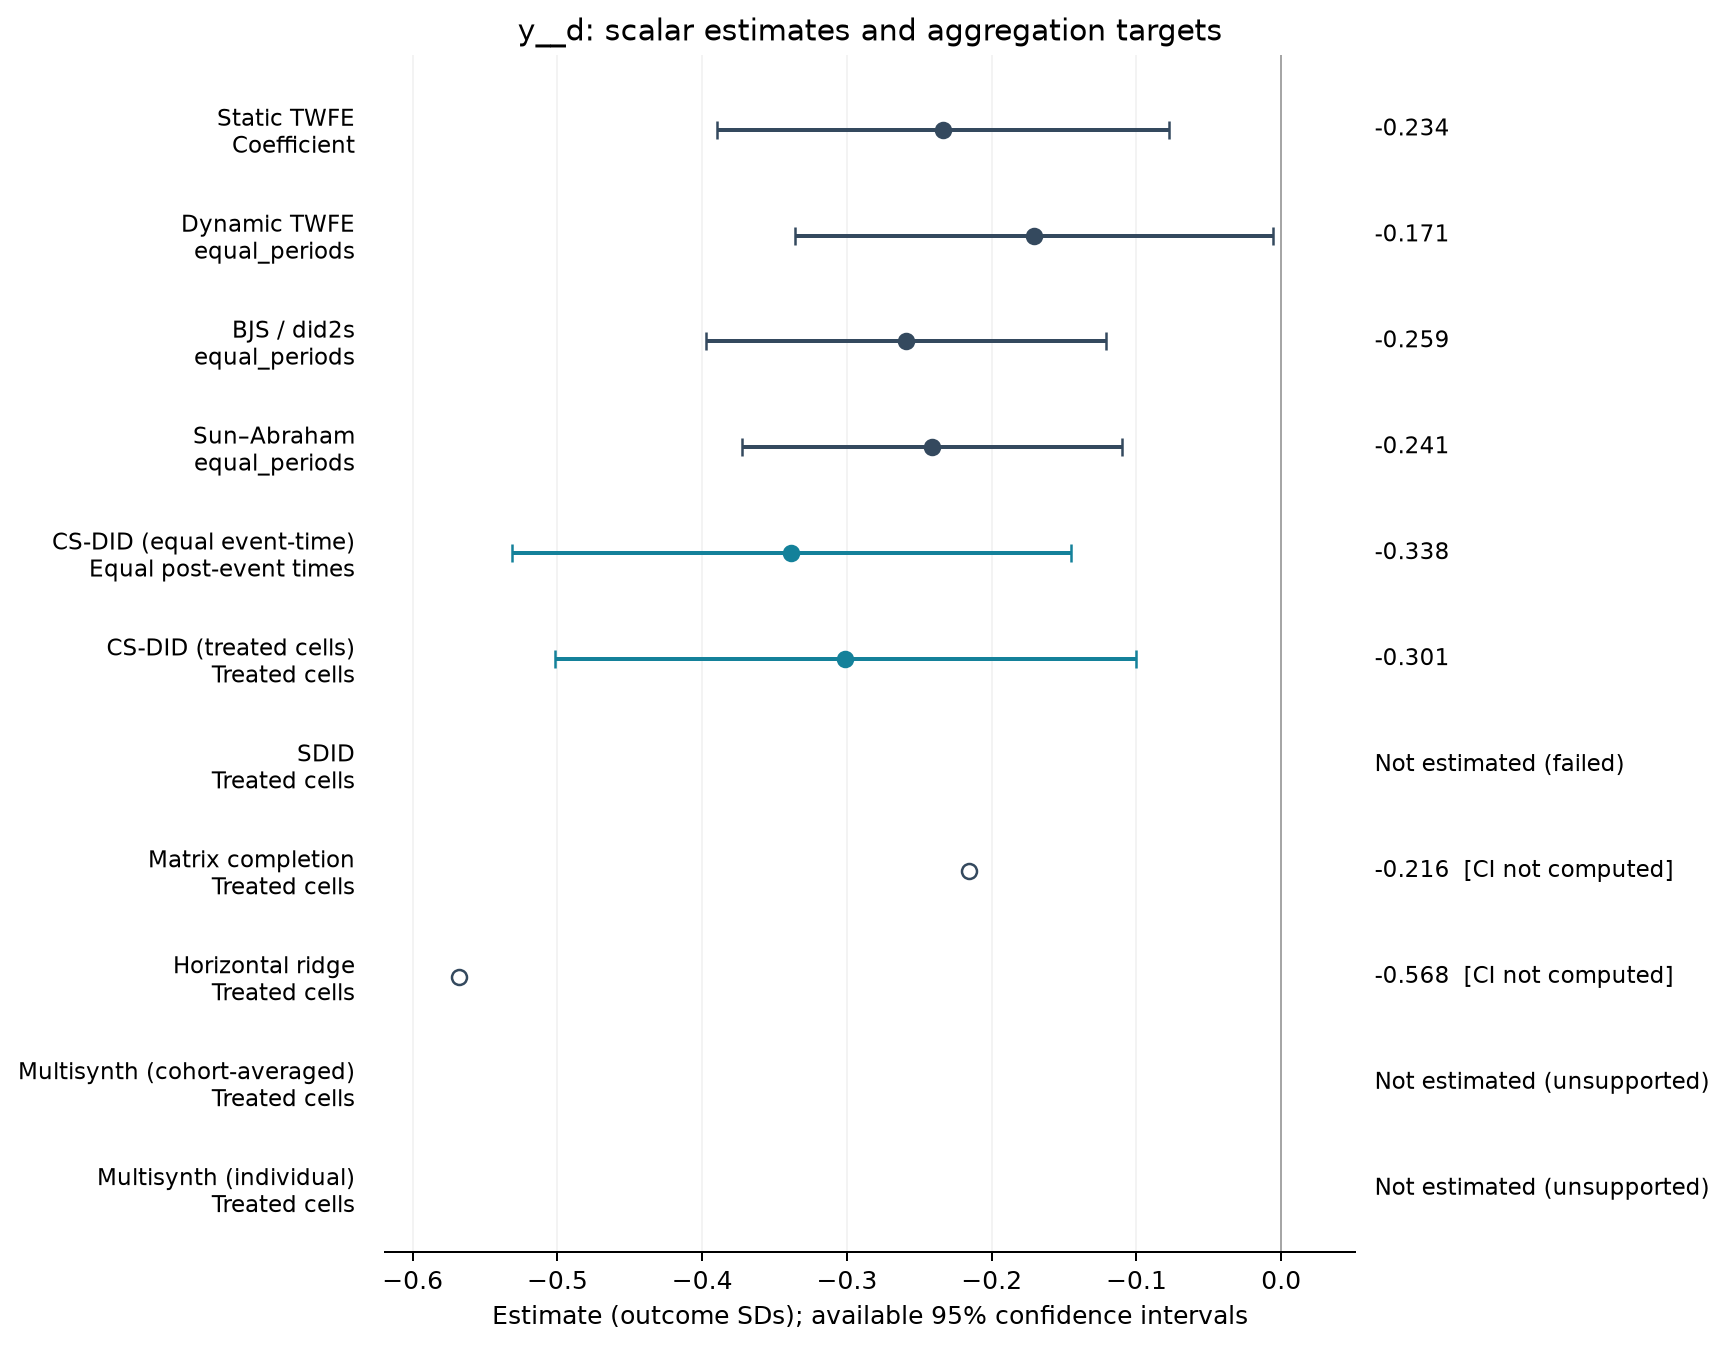
| Estimator | Estimate (SDs) | SE | 95% CI | Averaging |
|---|---|---|---|---|
| Static TWFE | -0.234 | 0.078 | [-0.390, -0.078] | Coefficient |
| Dynamic TWFE | -0.171 | 0.083 | [-0.336, -0.006] | equal_periods |
| BJS / did2s | -0.259 | 0.070 | [-0.397, -0.121] | equal_periods |
| Sun–Abraham | -0.241 | 0.066 | [-0.373, -0.110] | equal_periods |
| CS-DID (equal event-time) | -0.338 | 0.098 | [-0.531, -0.146] | Equal post-event times |
| CS-DID (treated cells) | -0.301 | 0.102 | [-0.502, -0.101] | Treated cells |
| Matrix completion | -0.216 | — | — | Treated cells |
| Horizontal ridge | -0.568 | — | — | Treated cells |
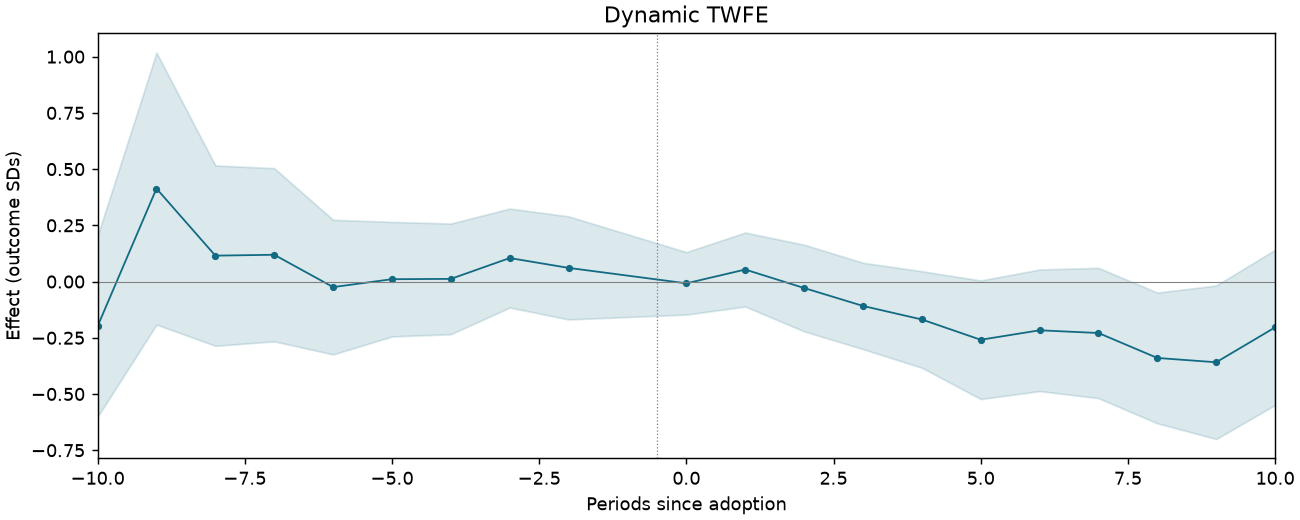
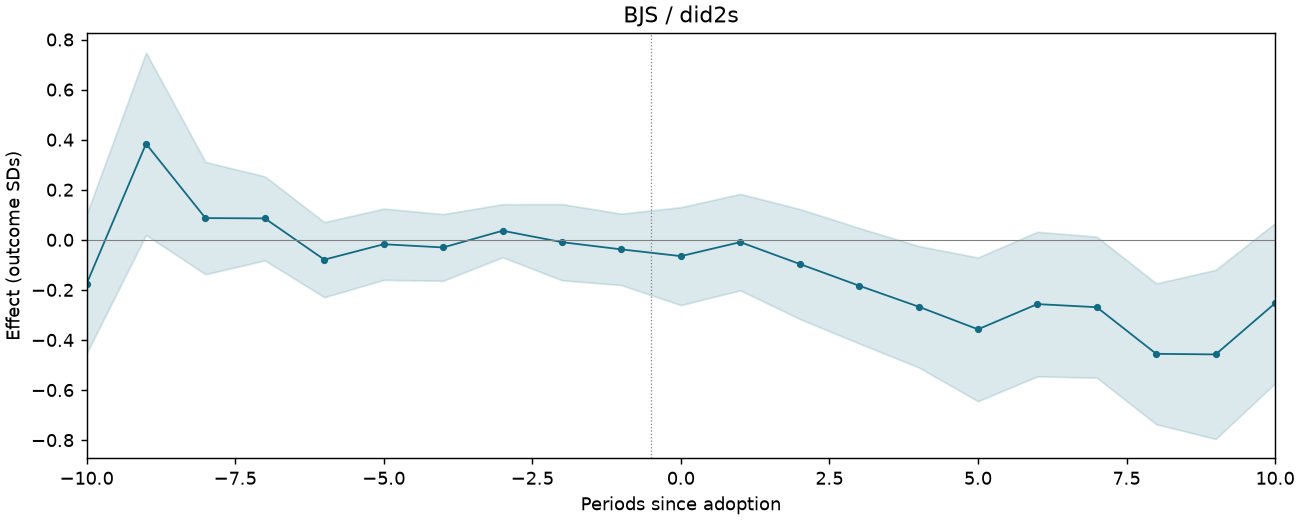
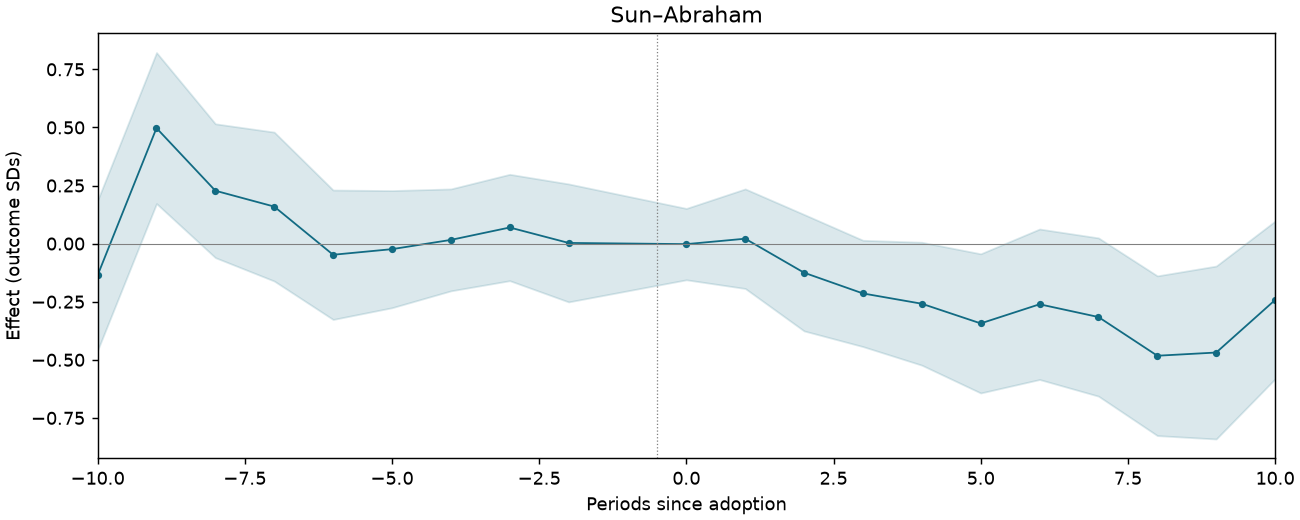
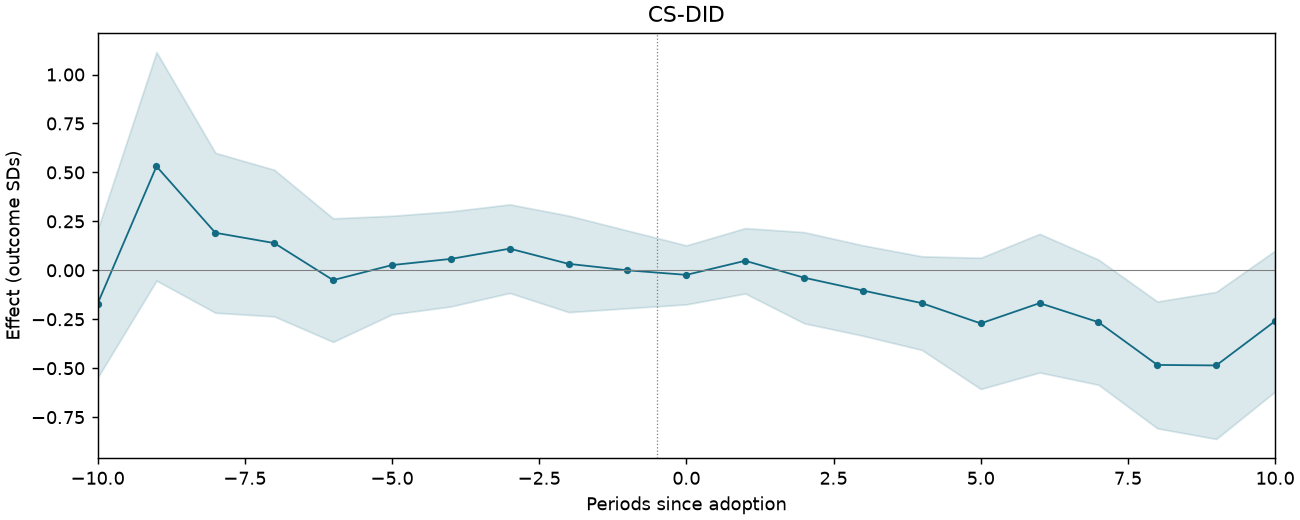
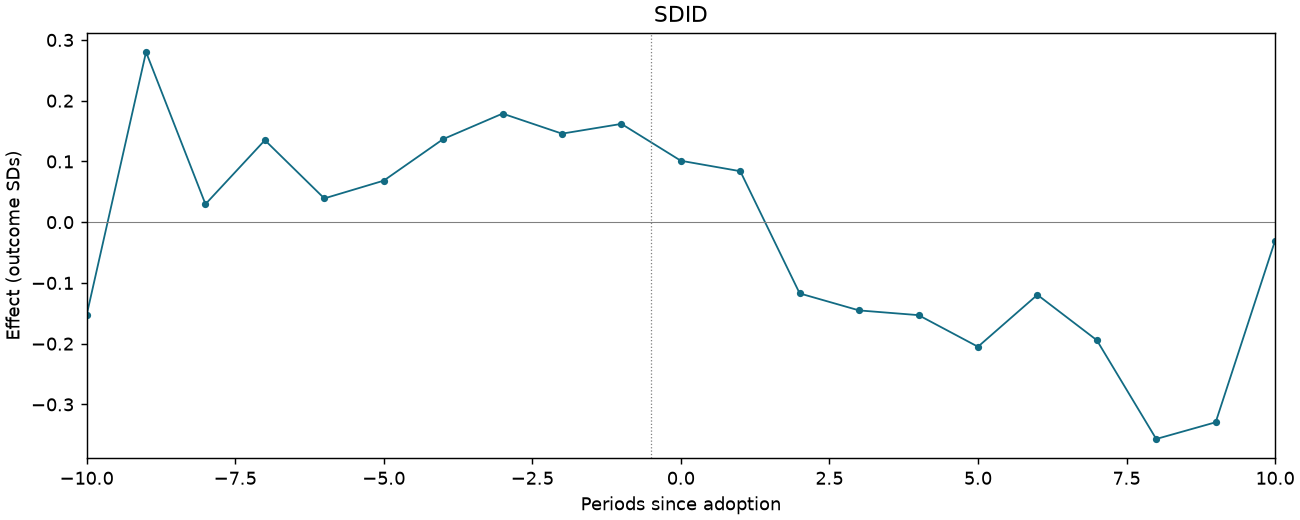
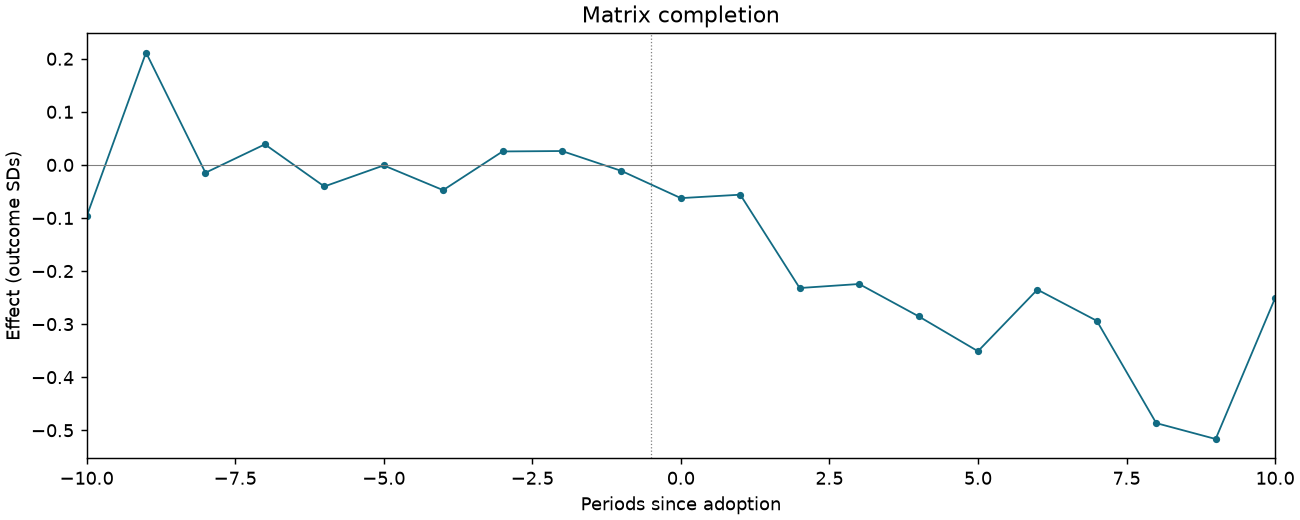
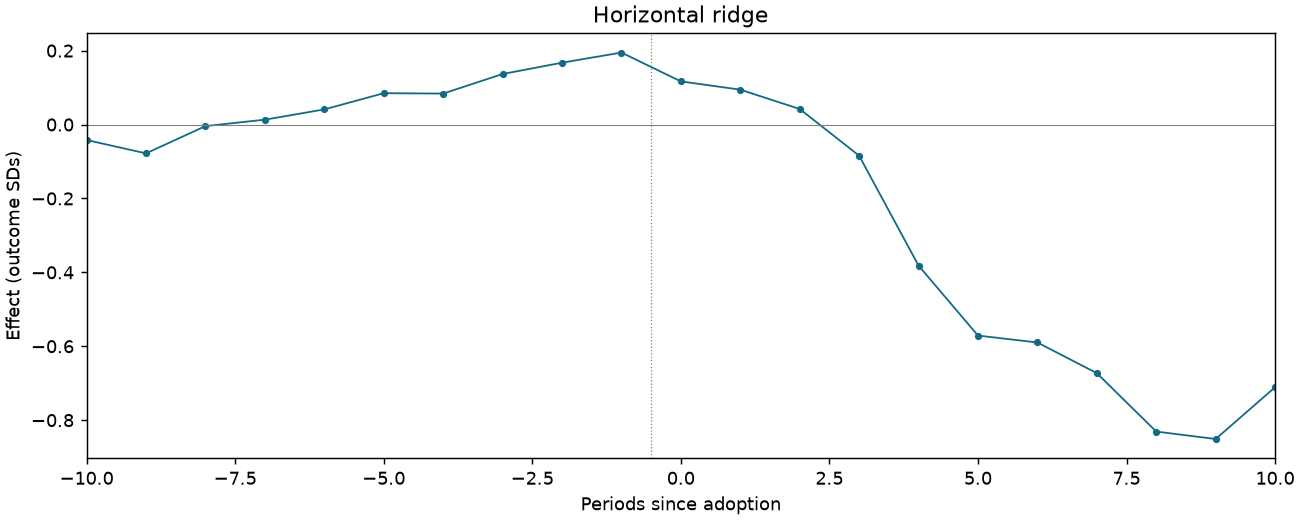
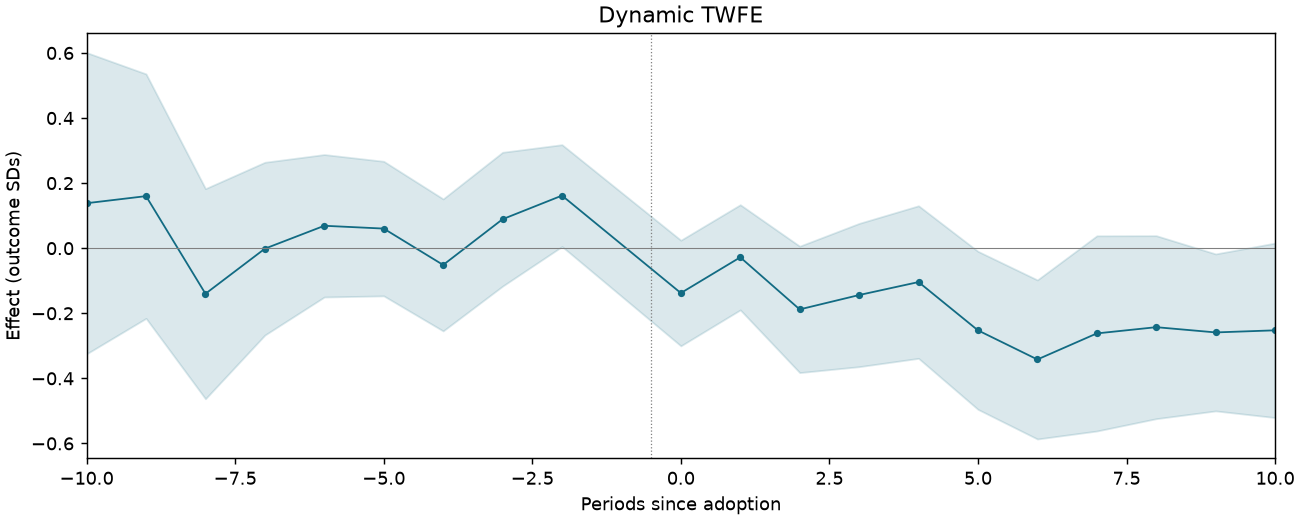
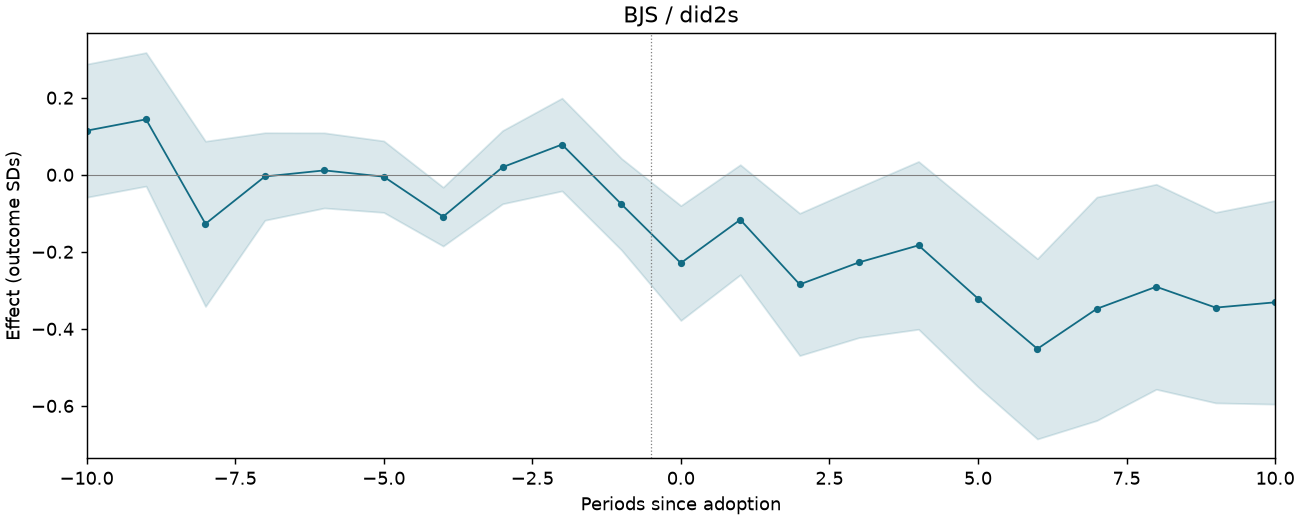
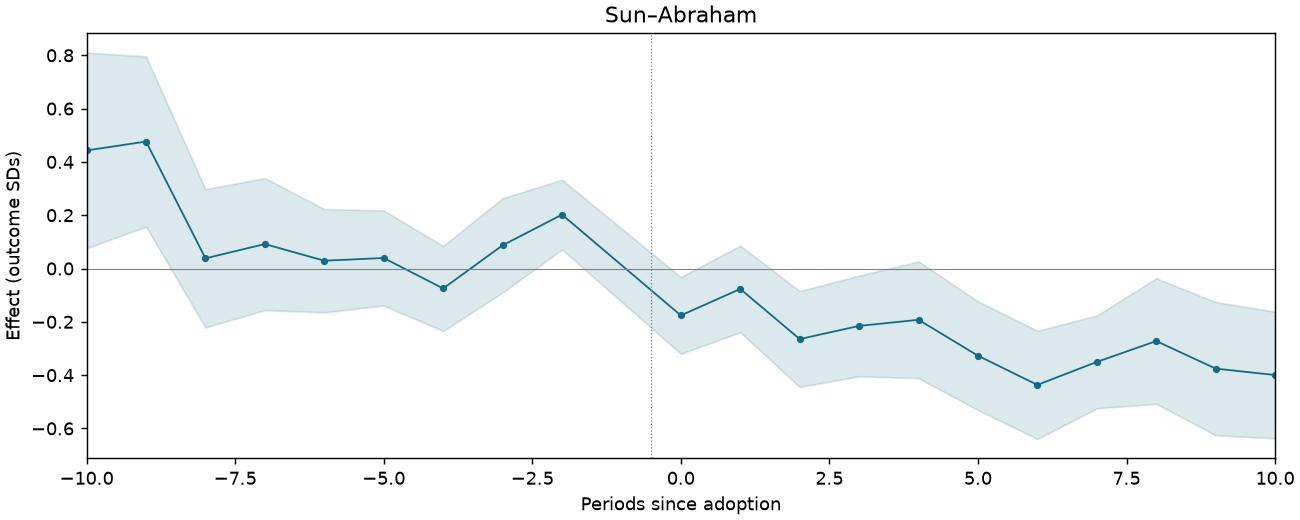
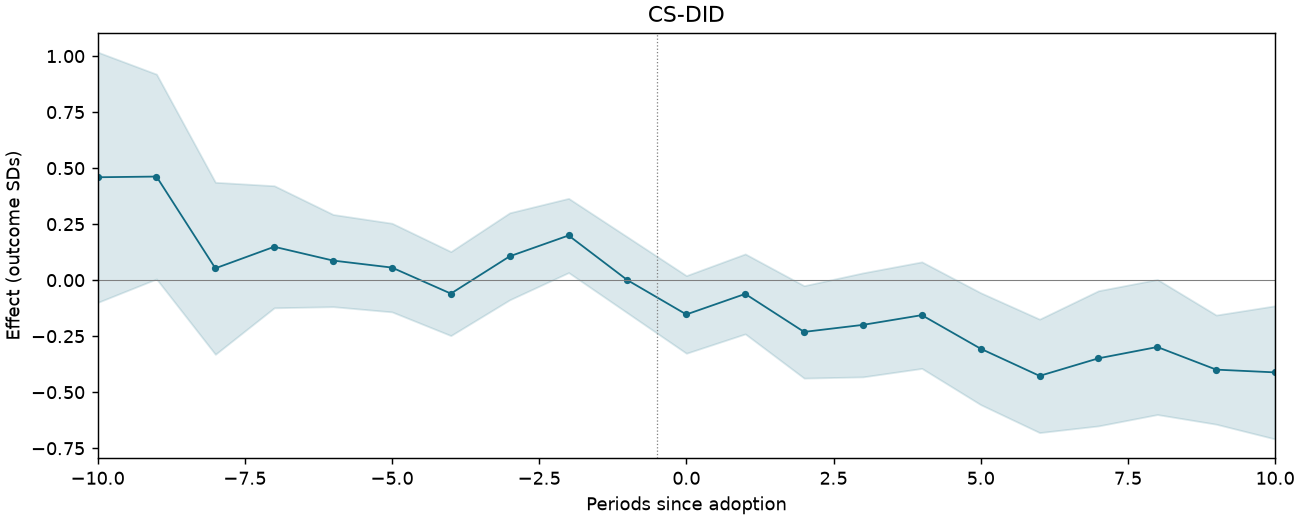
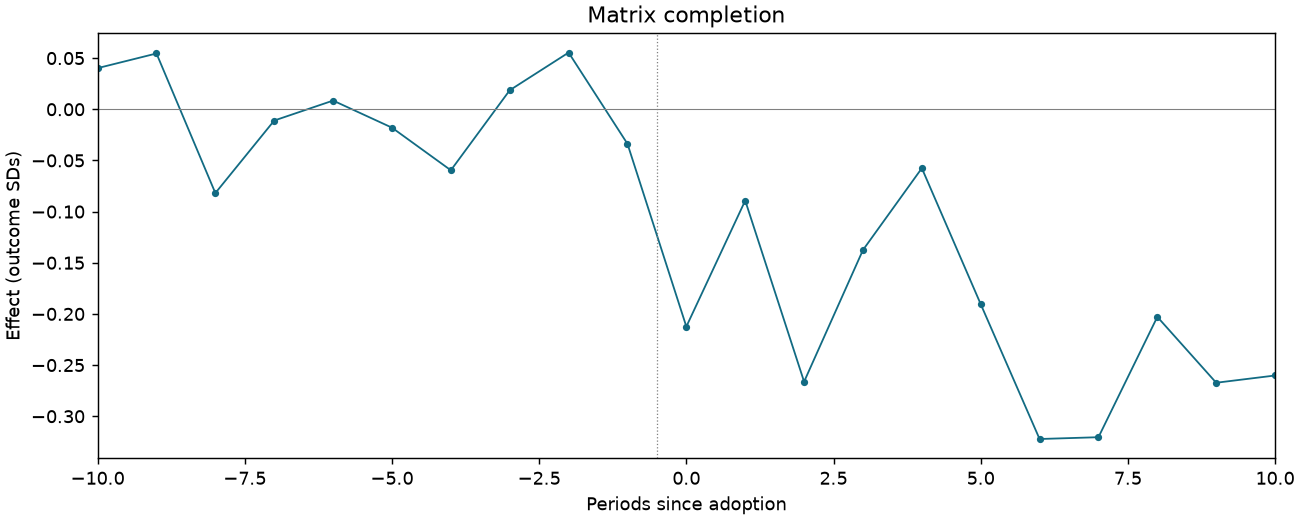
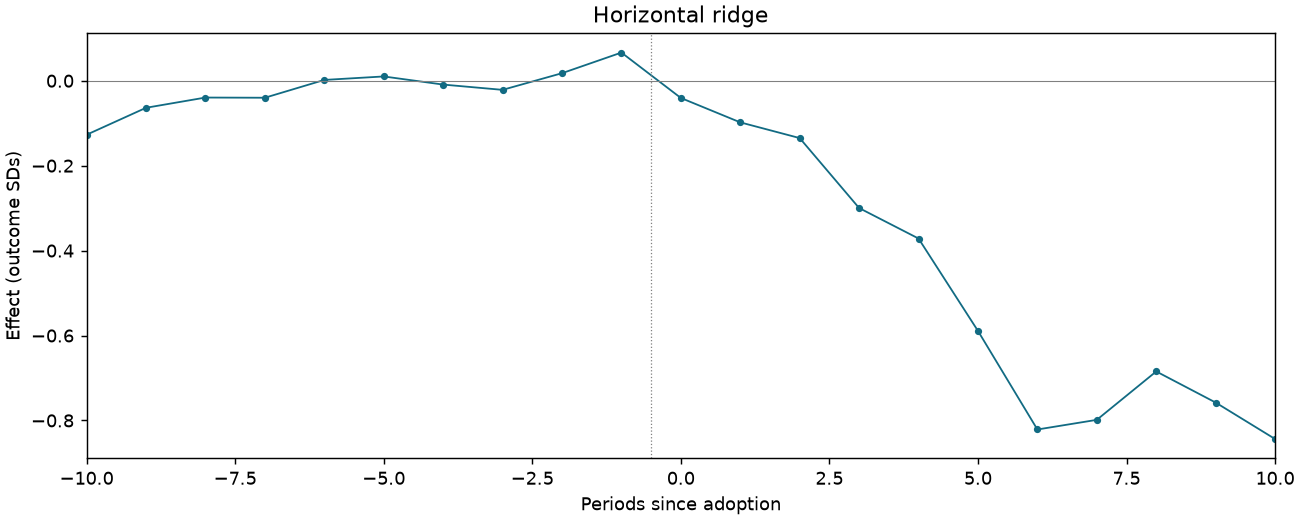
Event studies
Periods −10 to +10; pointwise 95% intervals where available.
GIFT-F4-LOGIMR-CSA-POOL
2,100 observations · 100 units · 100 clusters · 48 treated / 52 control units.
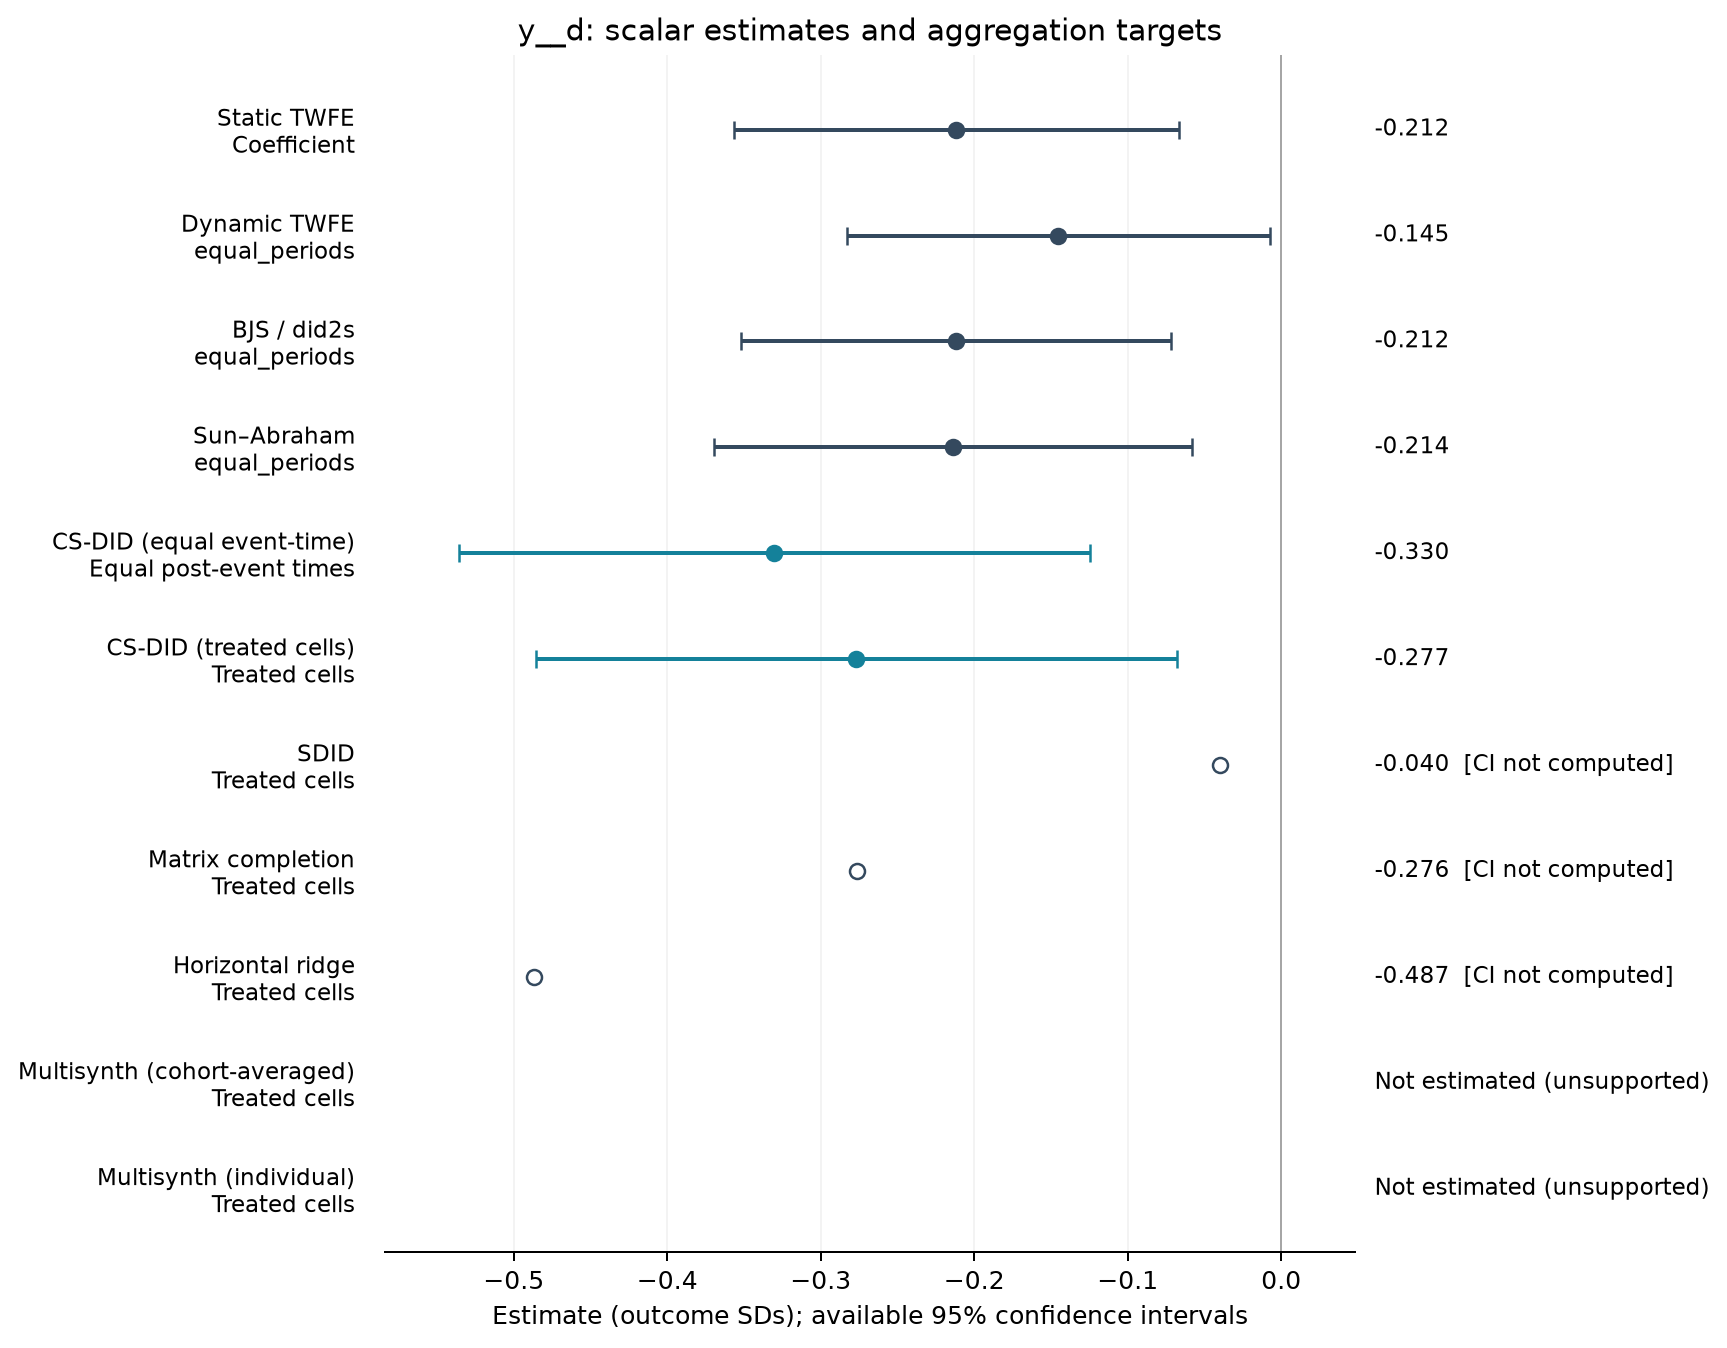
Estimate comparison
| Estimator | Estimate (SDs) | SE | 95% CI | Averaging |
|---|---|---|---|---|
| Static TWFE | -0.212 | 0.073 | [-0.357, -0.067] | Coefficient |
| Dynamic TWFE | -0.145 | 0.069 | [-0.283, -0.007] | equal_periods |
| BJS / did2s | -0.212 | 0.071 | [-0.352, -0.072] | equal_periods |
| Sun–Abraham | -0.214 | 0.079 | [-0.370, -0.058] | equal_periods |
| CS-DID (equal event-time) | -0.330 | 0.105 | [-0.536, -0.125] | Equal post-event times |
| CS-DID (treated cells) | -0.277 | 0.107 | [-0.486, -0.068] | Treated cells |
| SDID | -0.040 | — | — | Treated cells |
| Matrix completion | -0.276 | — | — | Treated cells |
| Horizontal ridge | -0.487 | — | — | Treated cells |
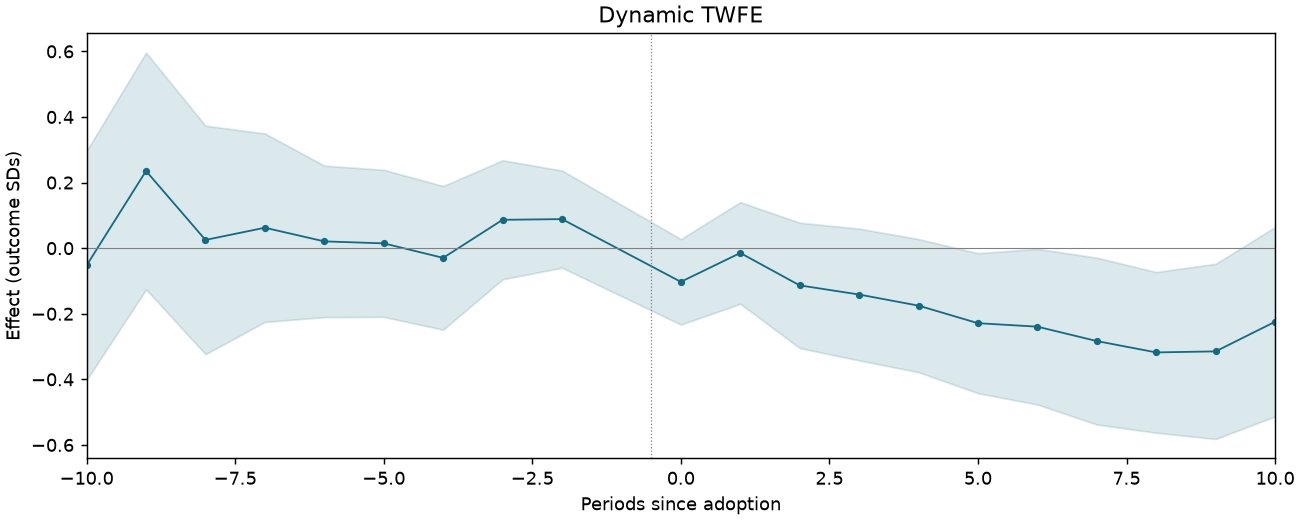
Event studies
Periods −10 to +10; pointwise 95% intervals where available.
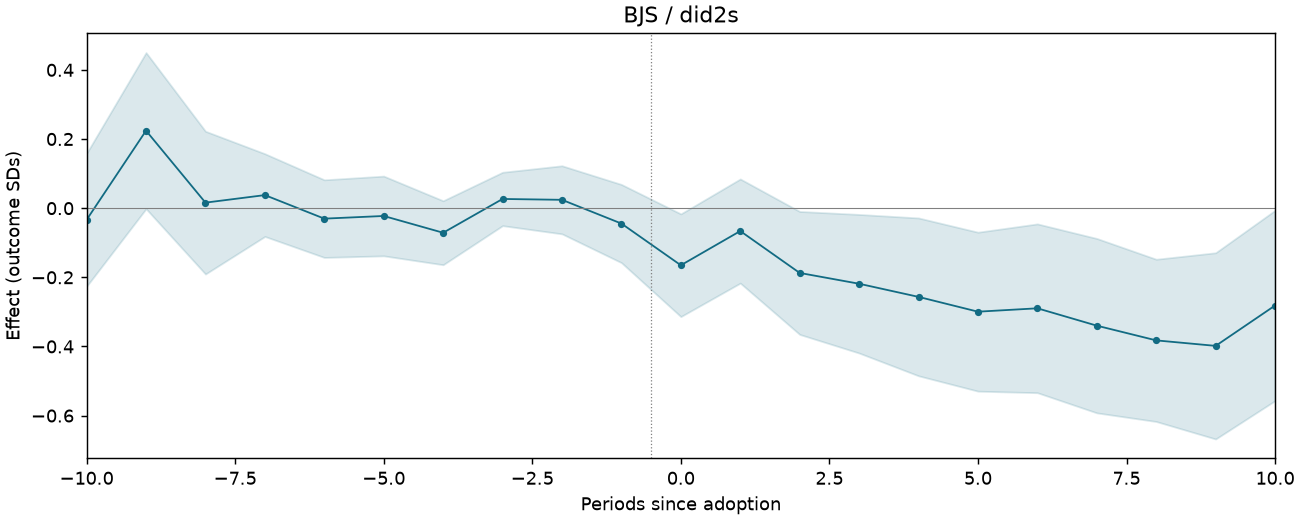
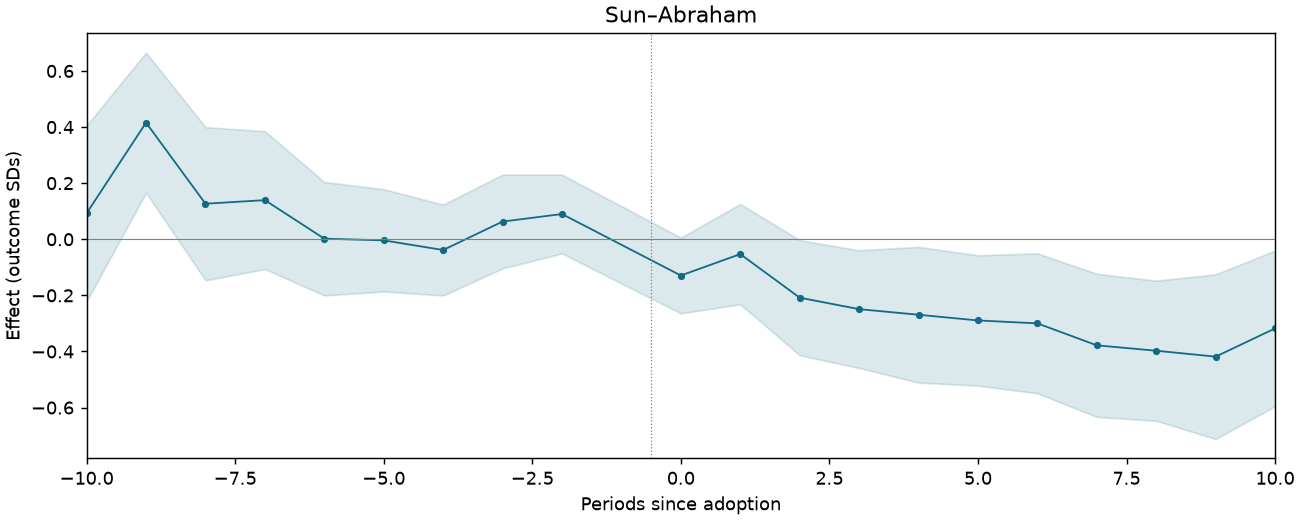
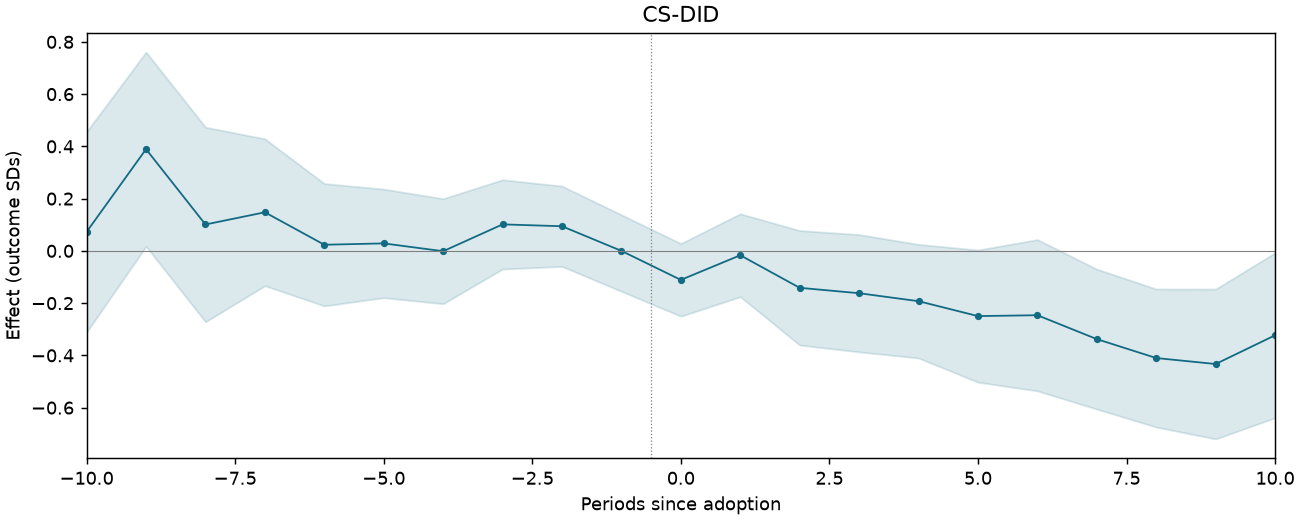
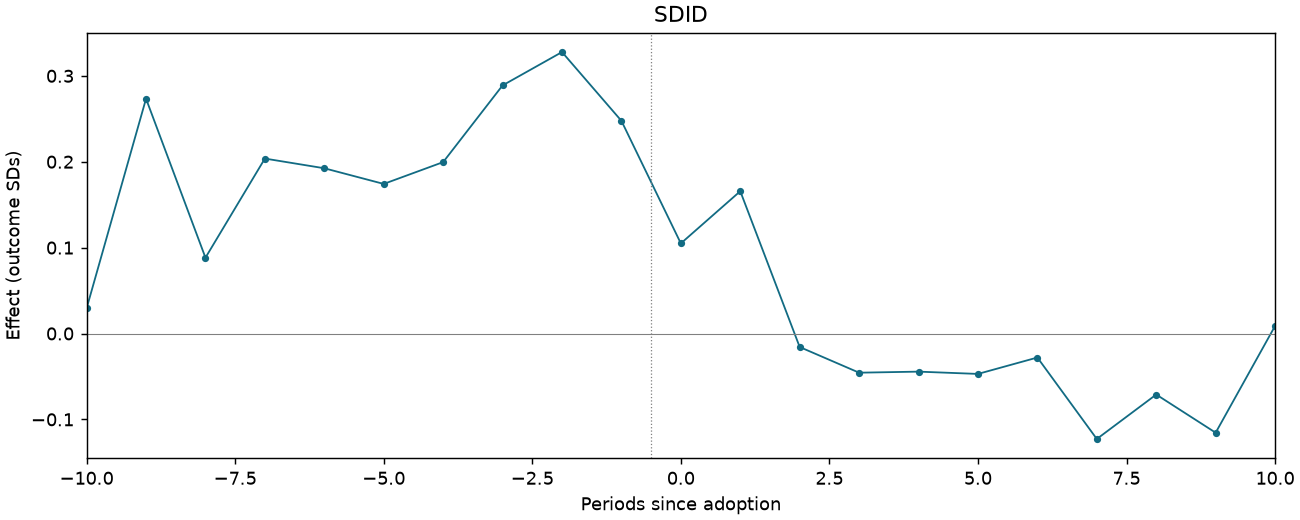
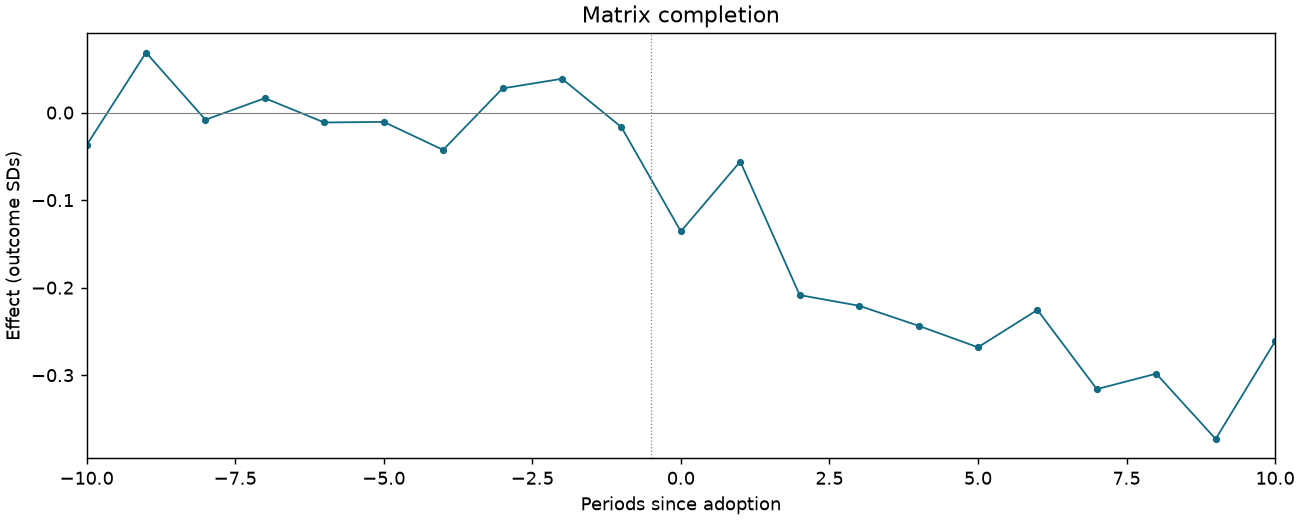
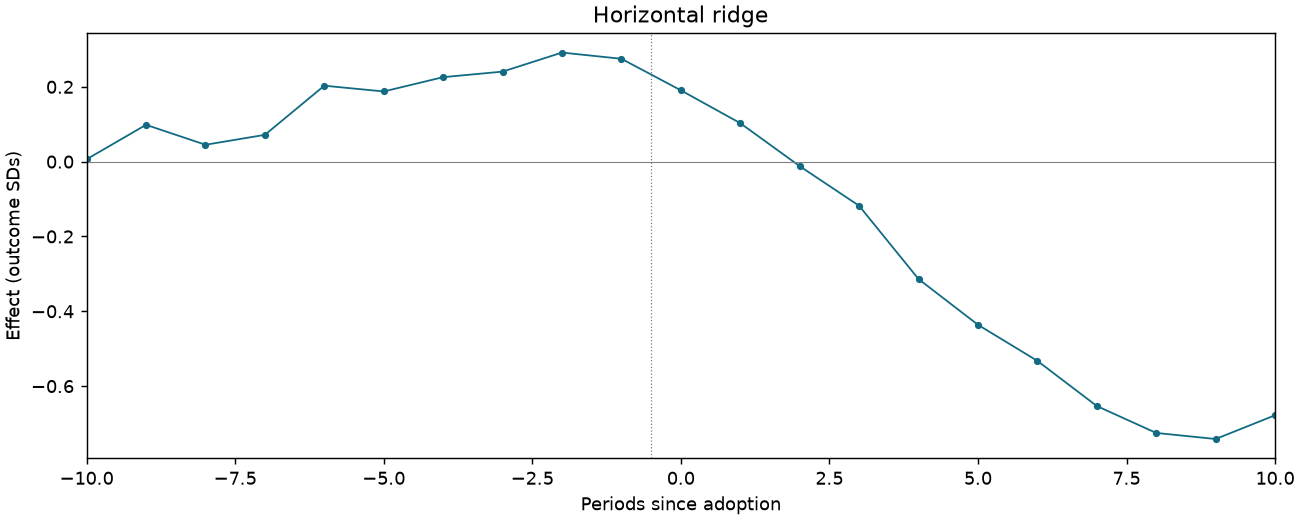
GIFT-F4-LOGIMR-CSA-WHITE
1,990 observations · 95 units · 95 clusters · 46 treated / 49 control units.
Estimate comparison
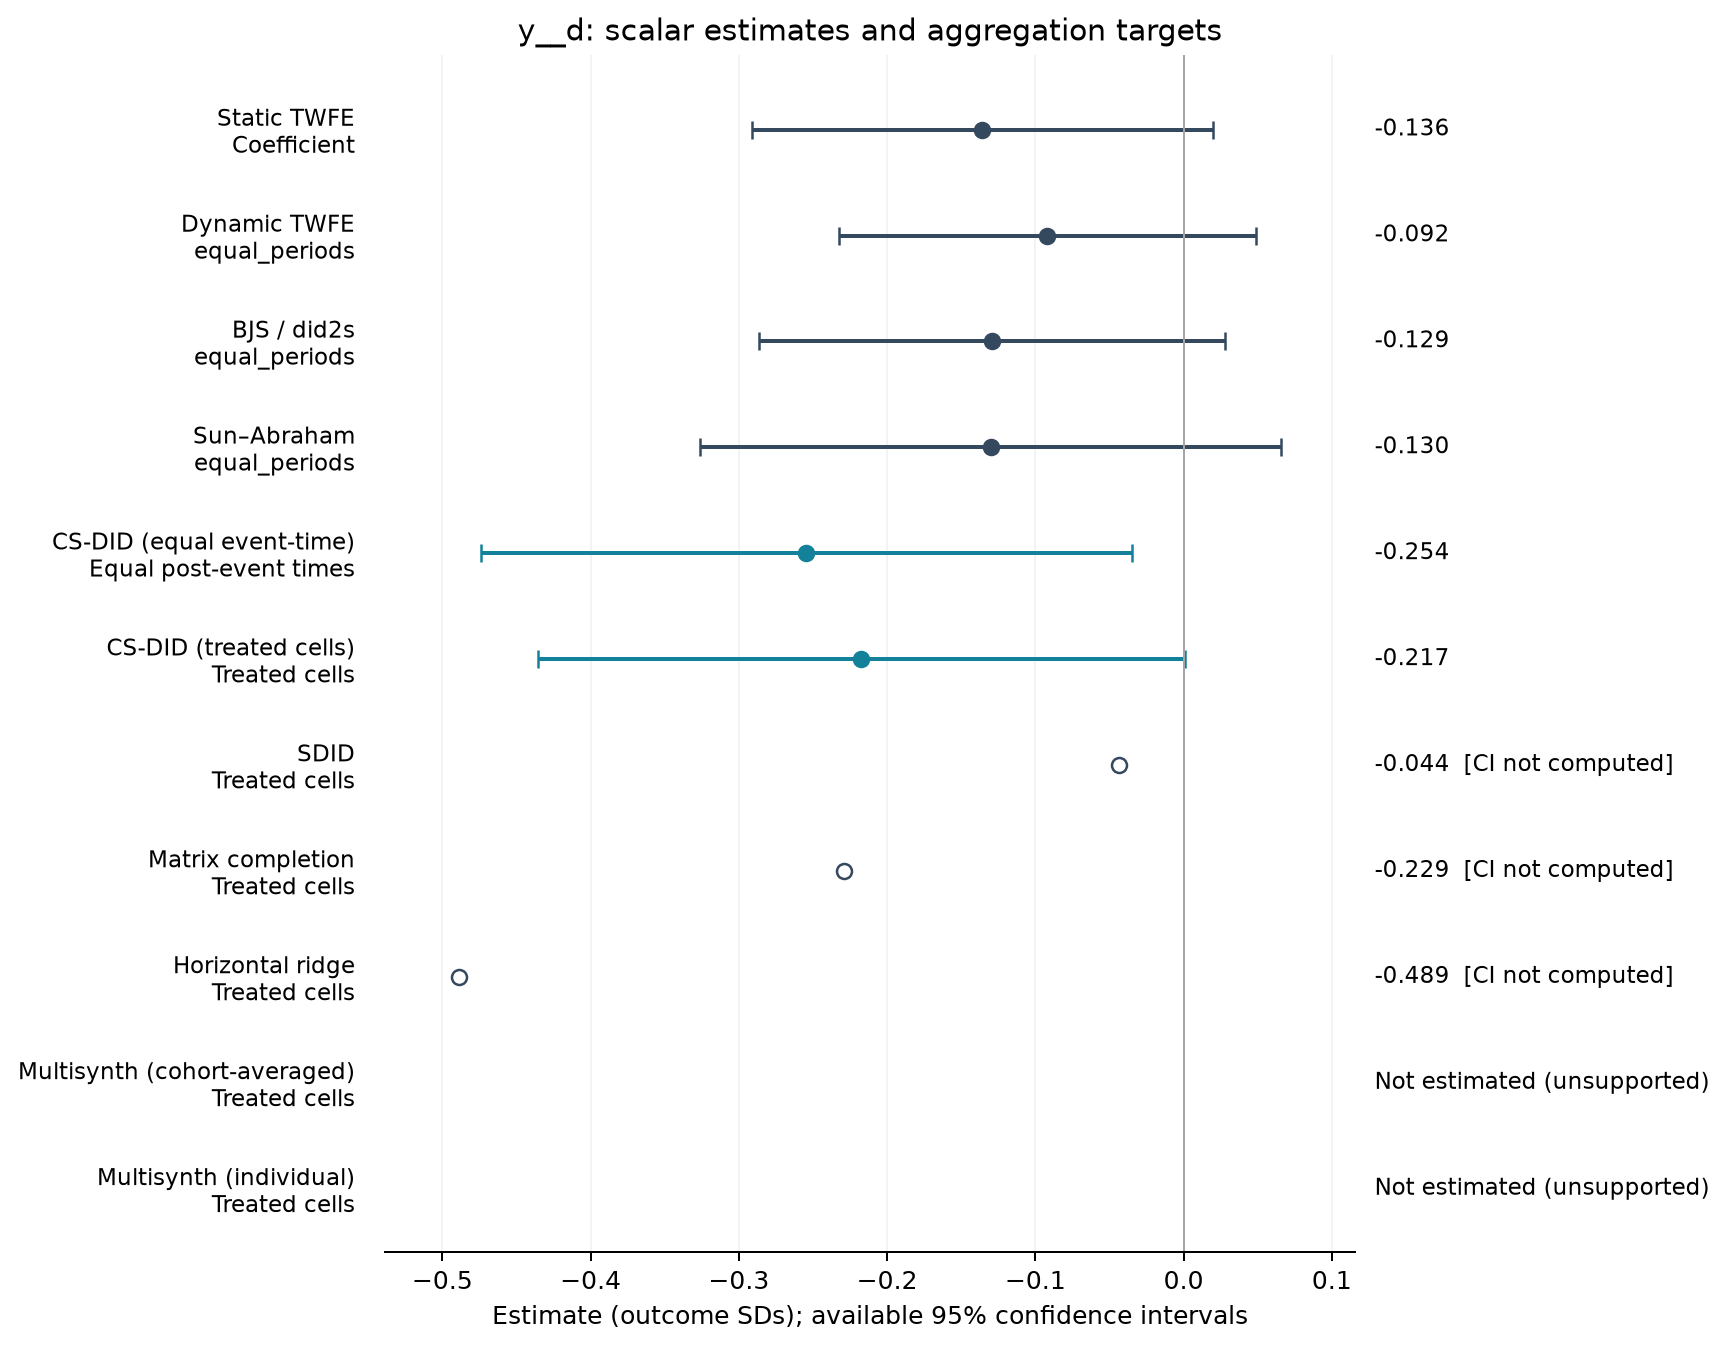
| Estimator | Estimate (SDs) | SE | 95% CI | Averaging |
|---|---|---|---|---|
| Static TWFE | -0.136 | 0.078 | [-0.291, 0.020] | Coefficient |
| Dynamic TWFE | -0.092 | 0.071 | [-0.232, 0.049] | equal_periods |
| BJS / did2s | -0.129 | 0.079 | [-0.287, 0.028] | equal_periods |
| Sun–Abraham | -0.130 | 0.099 | [-0.326, 0.066] | equal_periods |
| CS-DID (equal event-time) | -0.254 | 0.112 | [-0.474, -0.035] | Equal post-event times |
| CS-DID (treated cells) | -0.217 | 0.111 | [-0.436, 0.001] | Treated cells |
| SDID | -0.044 | — | — | Treated cells |
| Matrix completion | -0.229 | — | — | Treated cells |
| Horizontal ridge | -0.489 | — | — | Treated cells |
Event studies
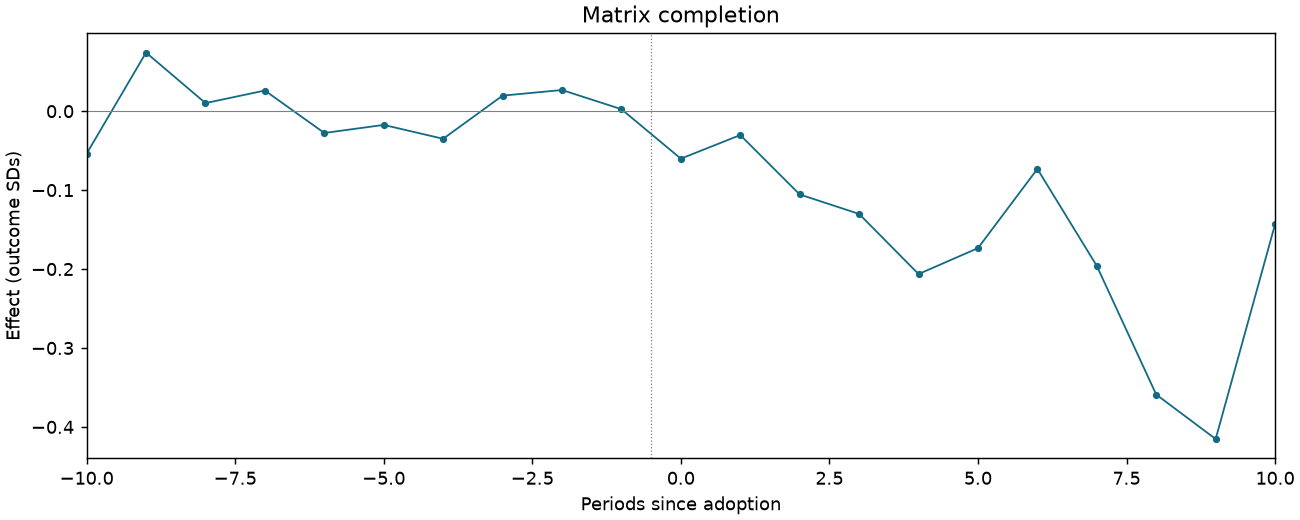
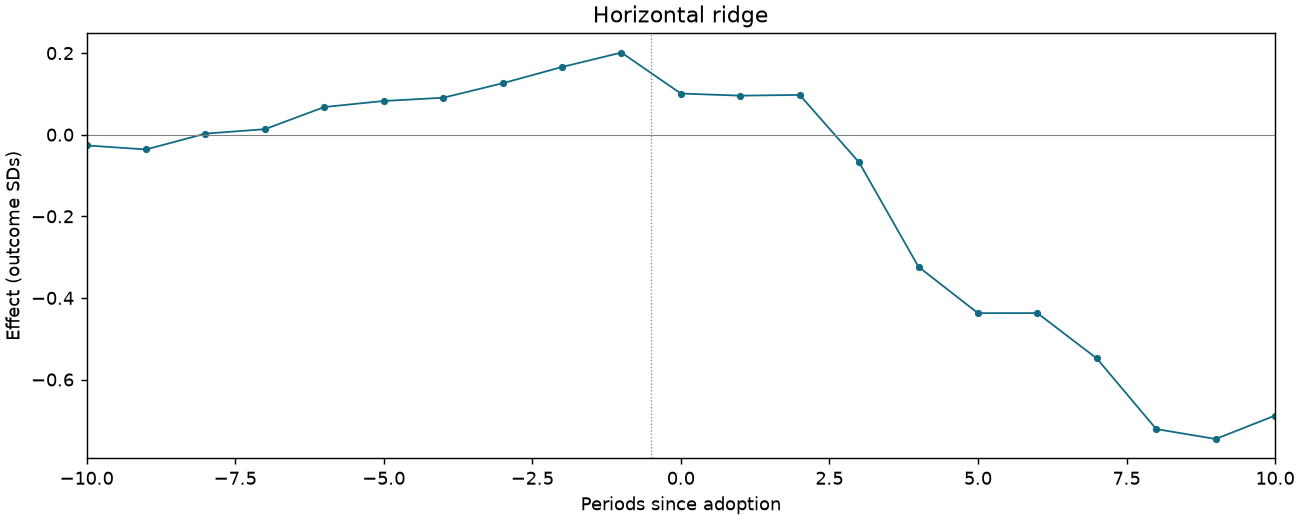
Periods −10 to +10; pointwise 95% intervals where available.
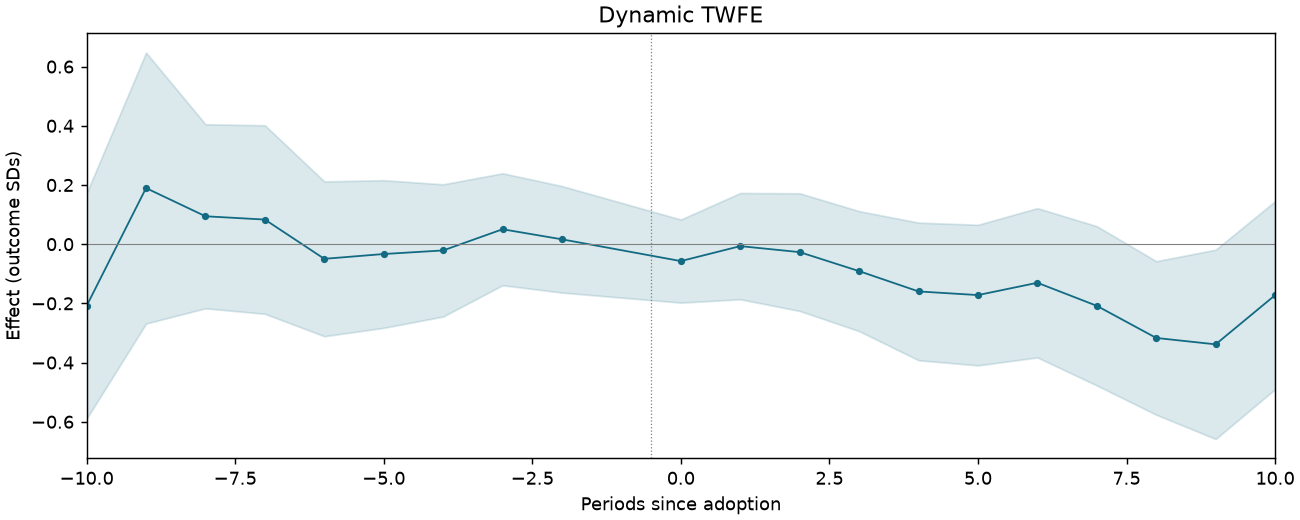
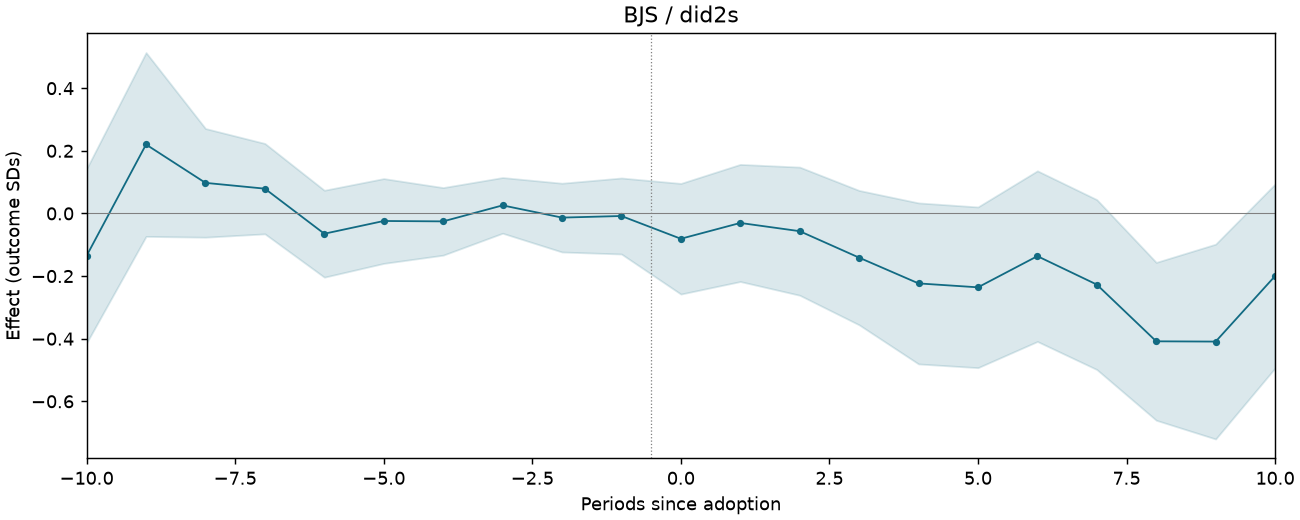
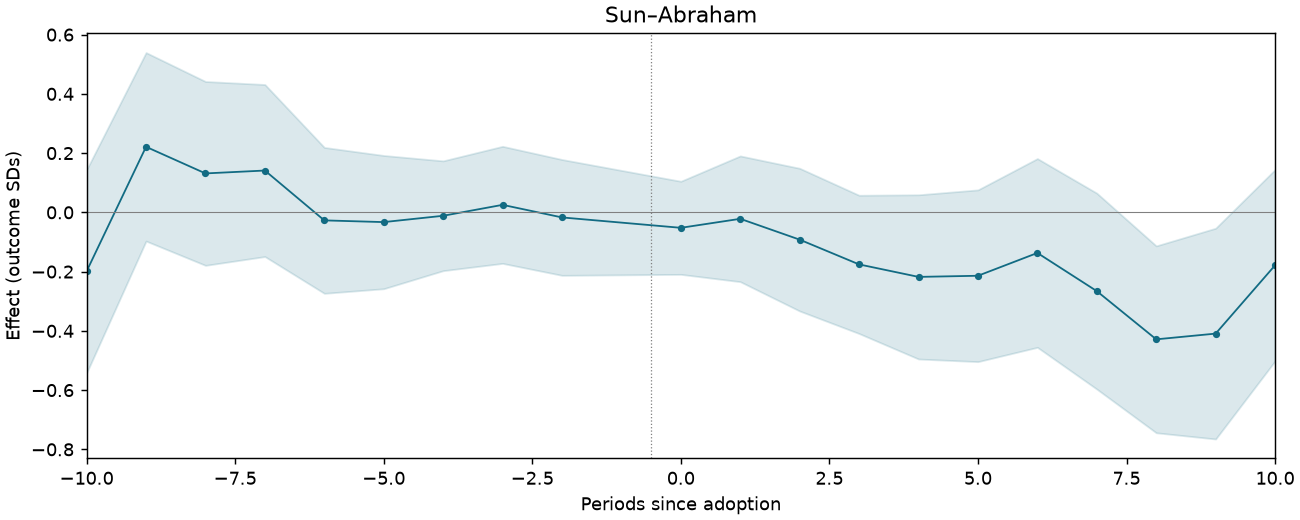
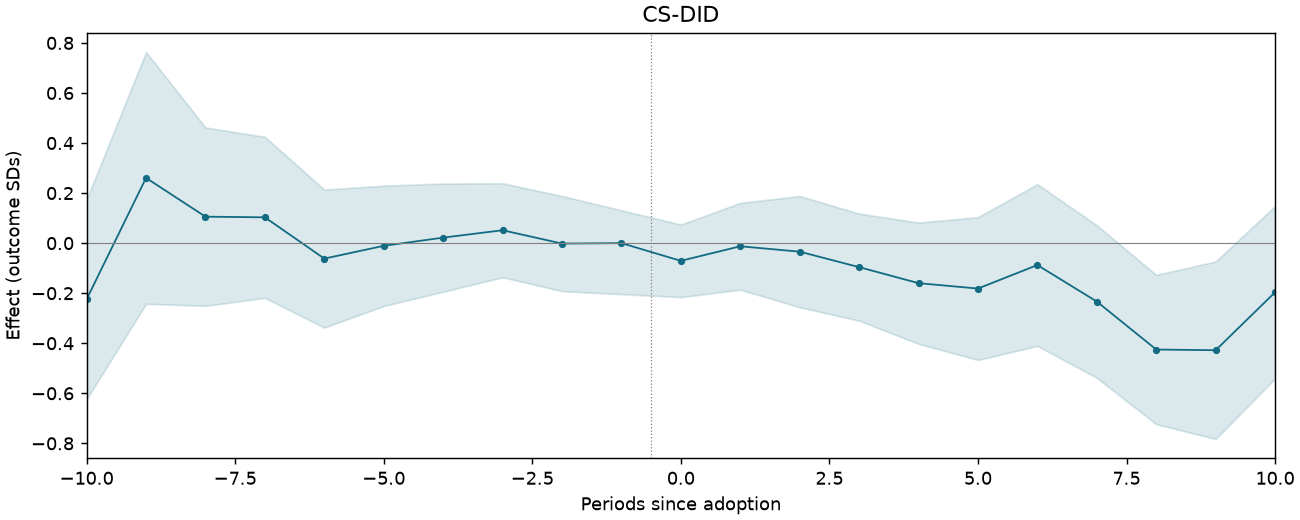
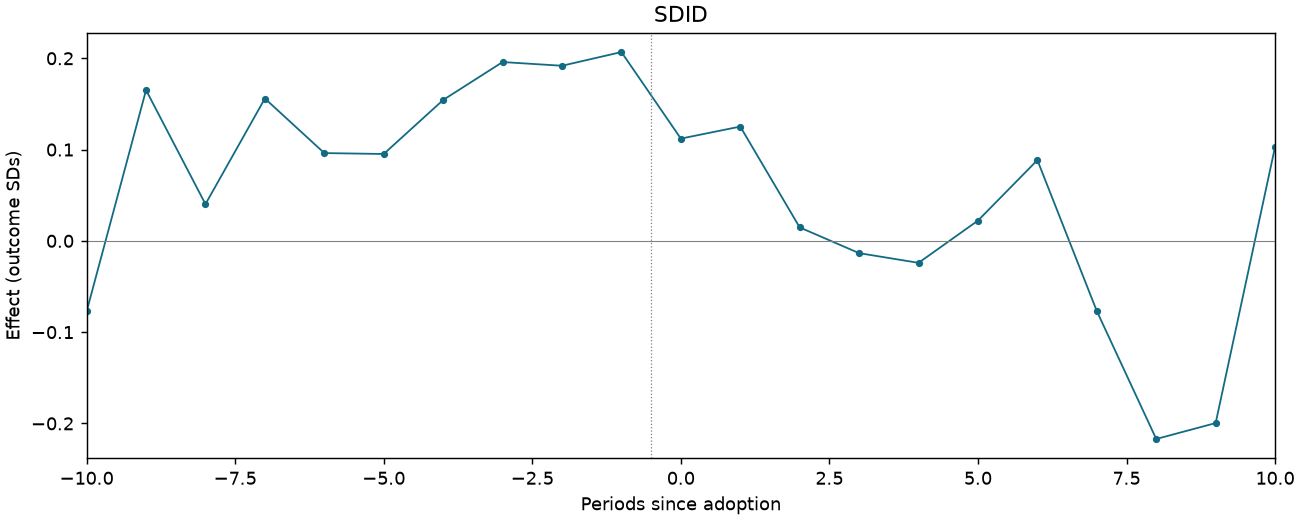
GIFT-F5A-BLACK
1,995 observations · 95 units · 95 clusters · 46 treated / 49 control units.
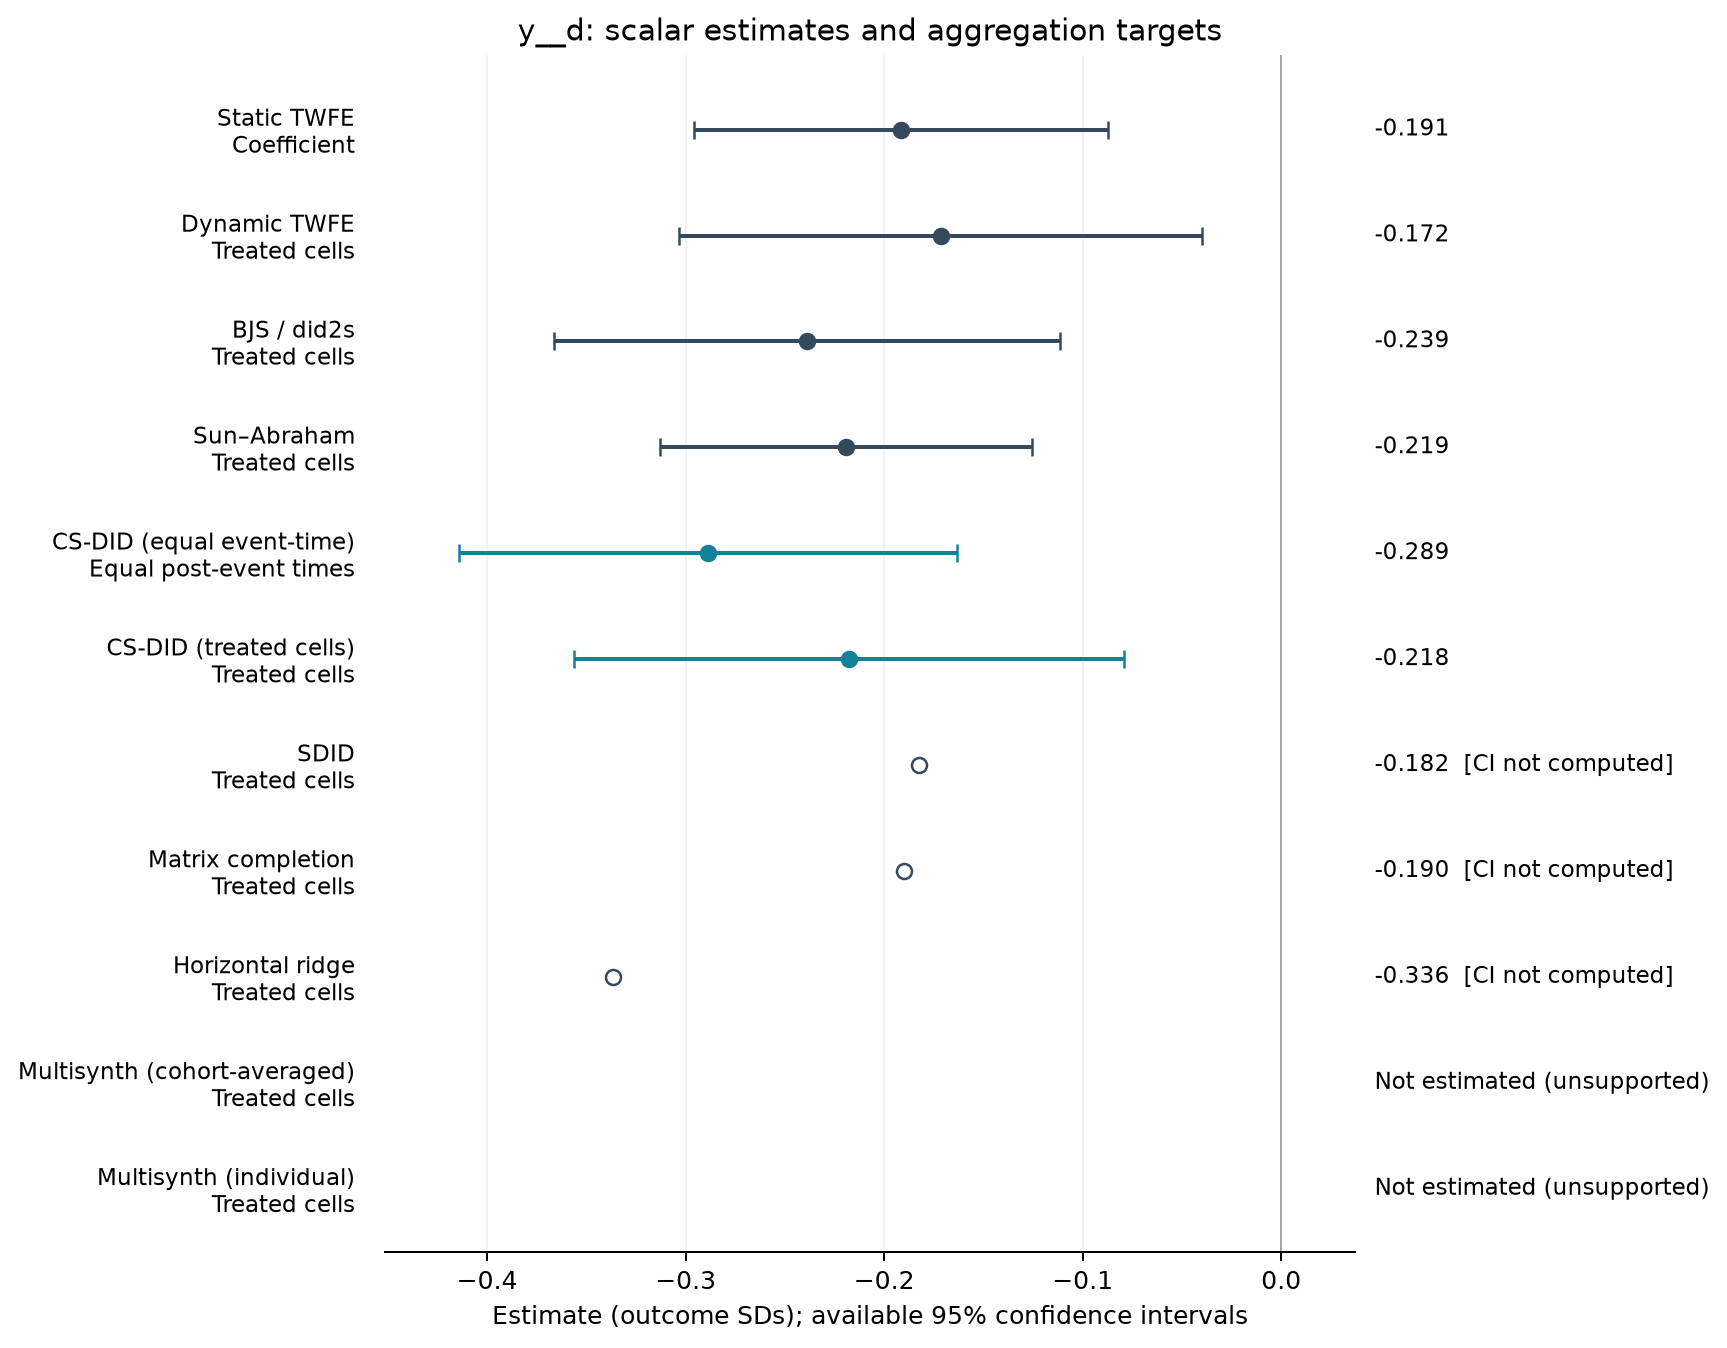
Estimate comparison
| Estimator | Estimate (SDs) | SE | 95% CI | Averaging |
|---|---|---|---|---|
| Static TWFE | -0.191 | 0.052 | [-0.296, -0.087] | Coefficient |
| Dynamic TWFE | -0.172 | 0.066 | [-0.303, -0.040] | Treated cells |
| BJS / did2s | -0.239 | 0.064 | [-0.366, -0.111] | Treated cells |
| Sun–Abraham | -0.219 | 0.047 | [-0.313, -0.126] | Treated cells |
| CS-DID (equal event-time) | -0.289 | 0.064 | [-0.414, -0.164] | Equal post-event times |
| CS-DID (treated cells) | -0.218 | 0.071 | [-0.356, -0.079] | Treated cells |
| SDID | -0.182 | — | — | Treated cells |
| Matrix completion | -0.190 | — | — | Treated cells |
| Horizontal ridge | -0.336 | — | — | Treated cells |
Event studies
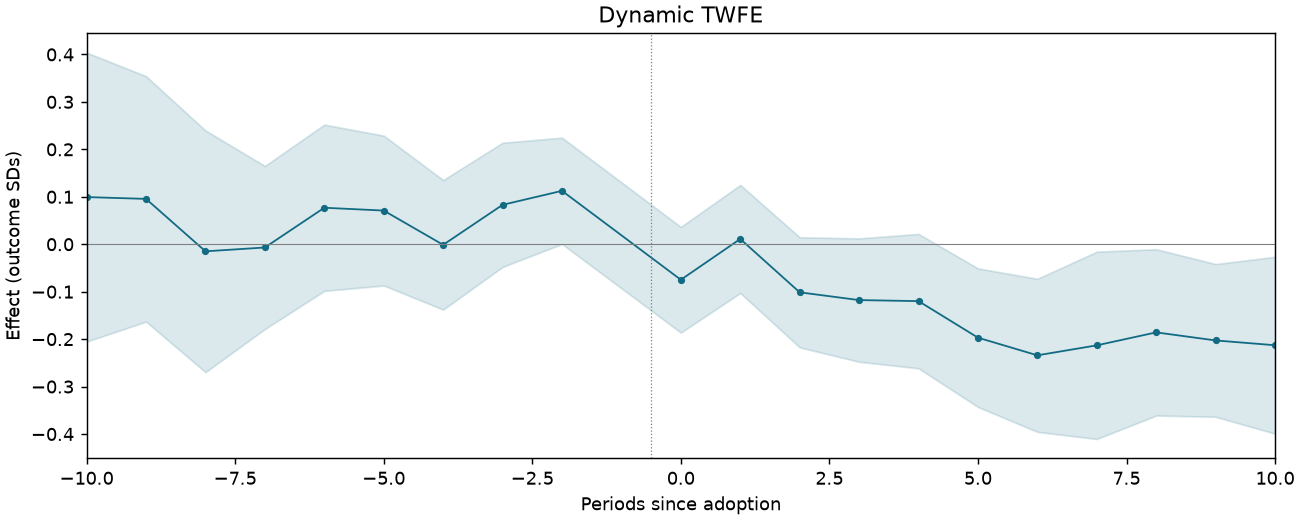
Periods −10 to +10; pointwise 95% intervals where available.
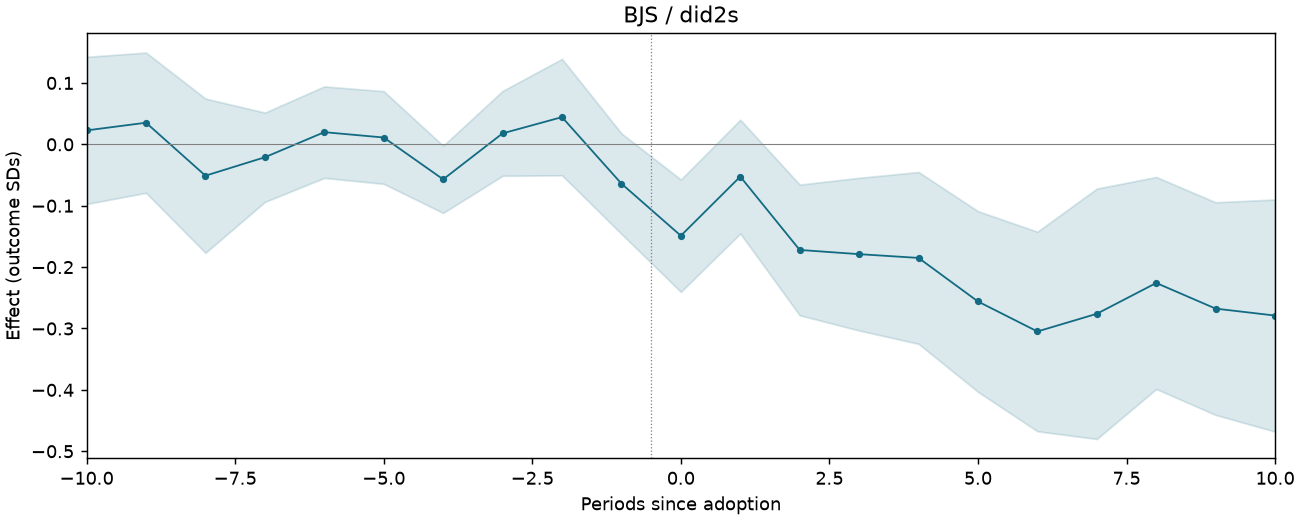
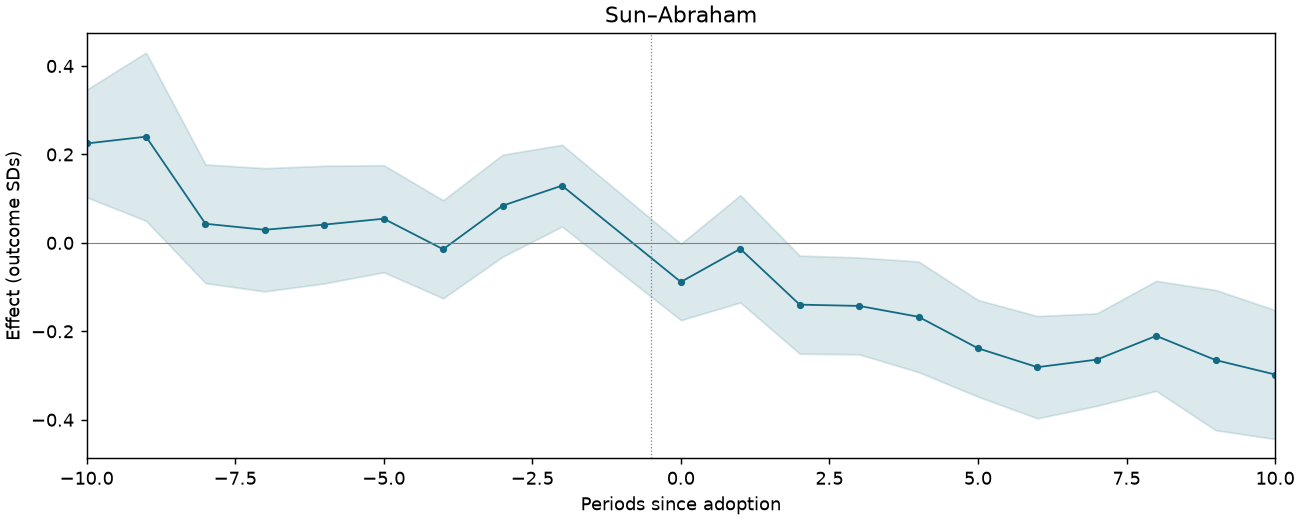
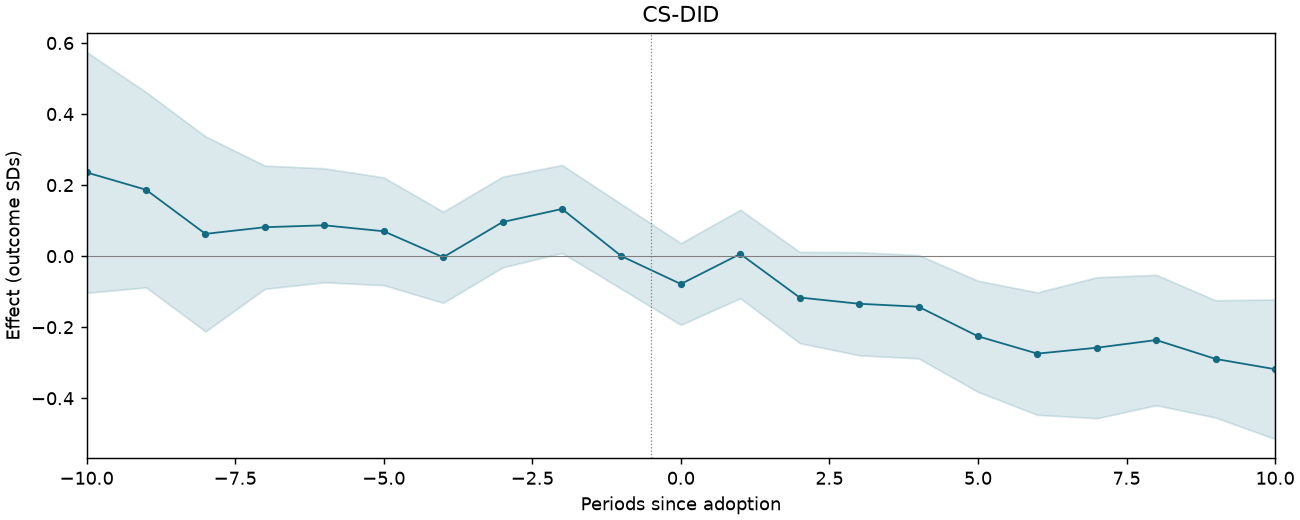
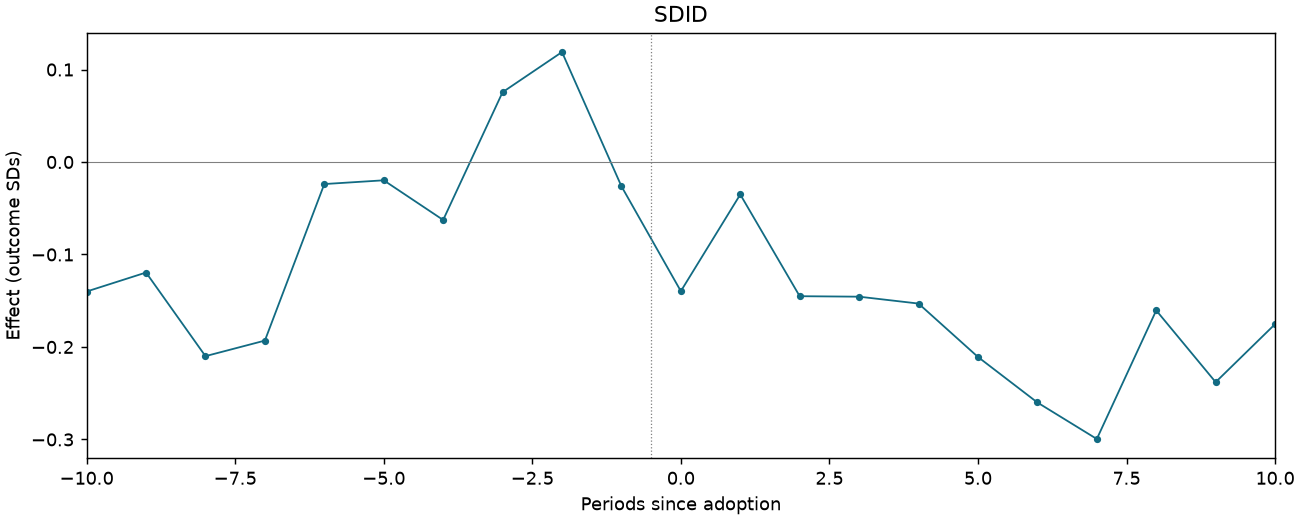
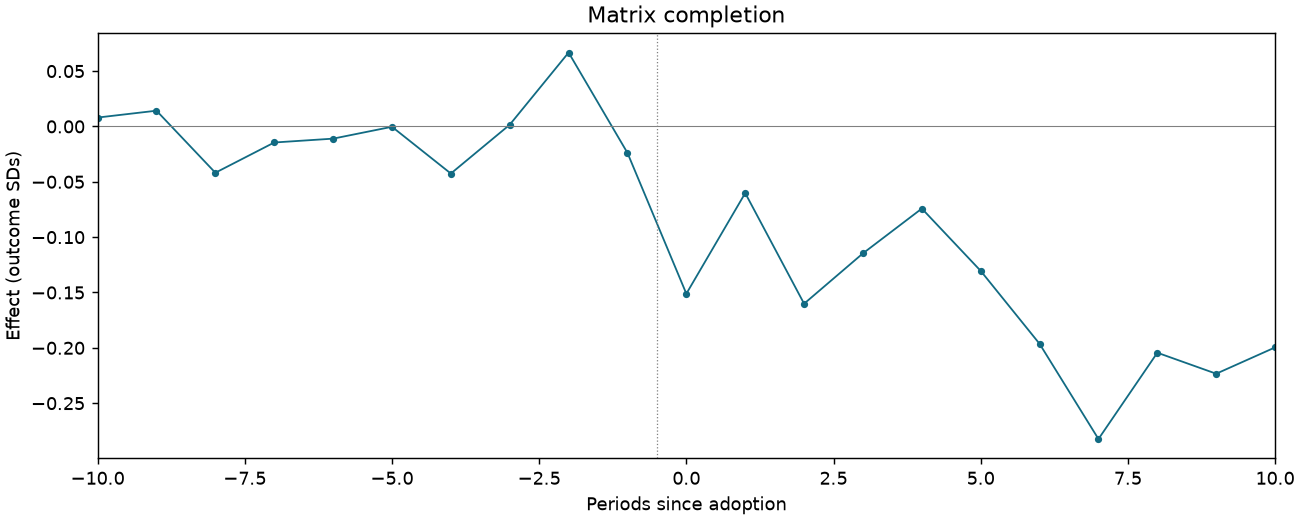
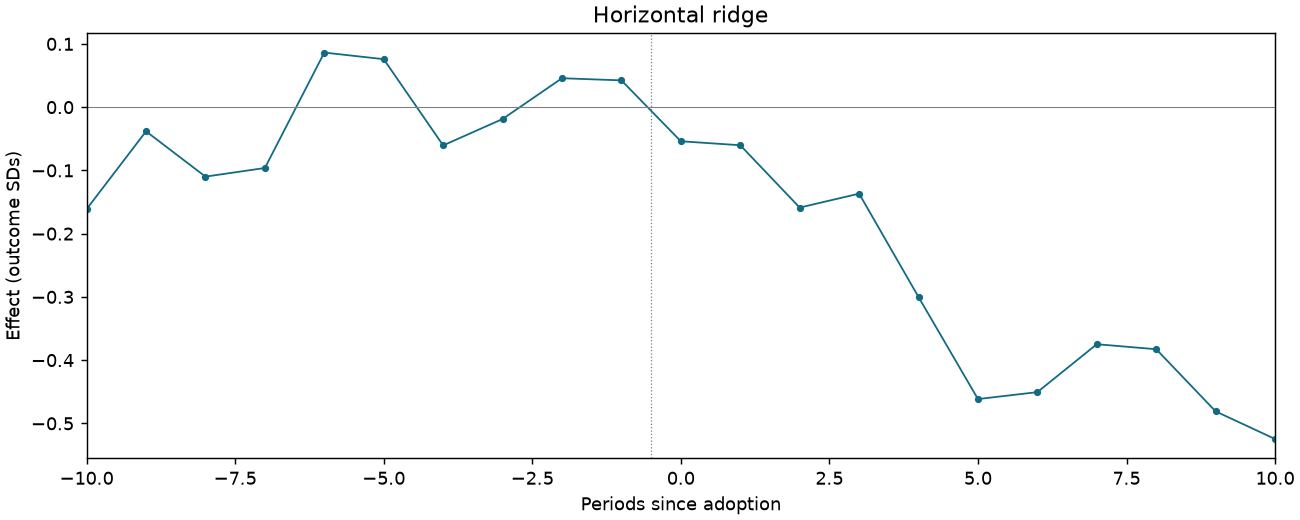
GIFT-F5A-LOGIMR-CSA-BLACK
1,862 observations · 95 units · 95 clusters · 42 treated / 53 control units.
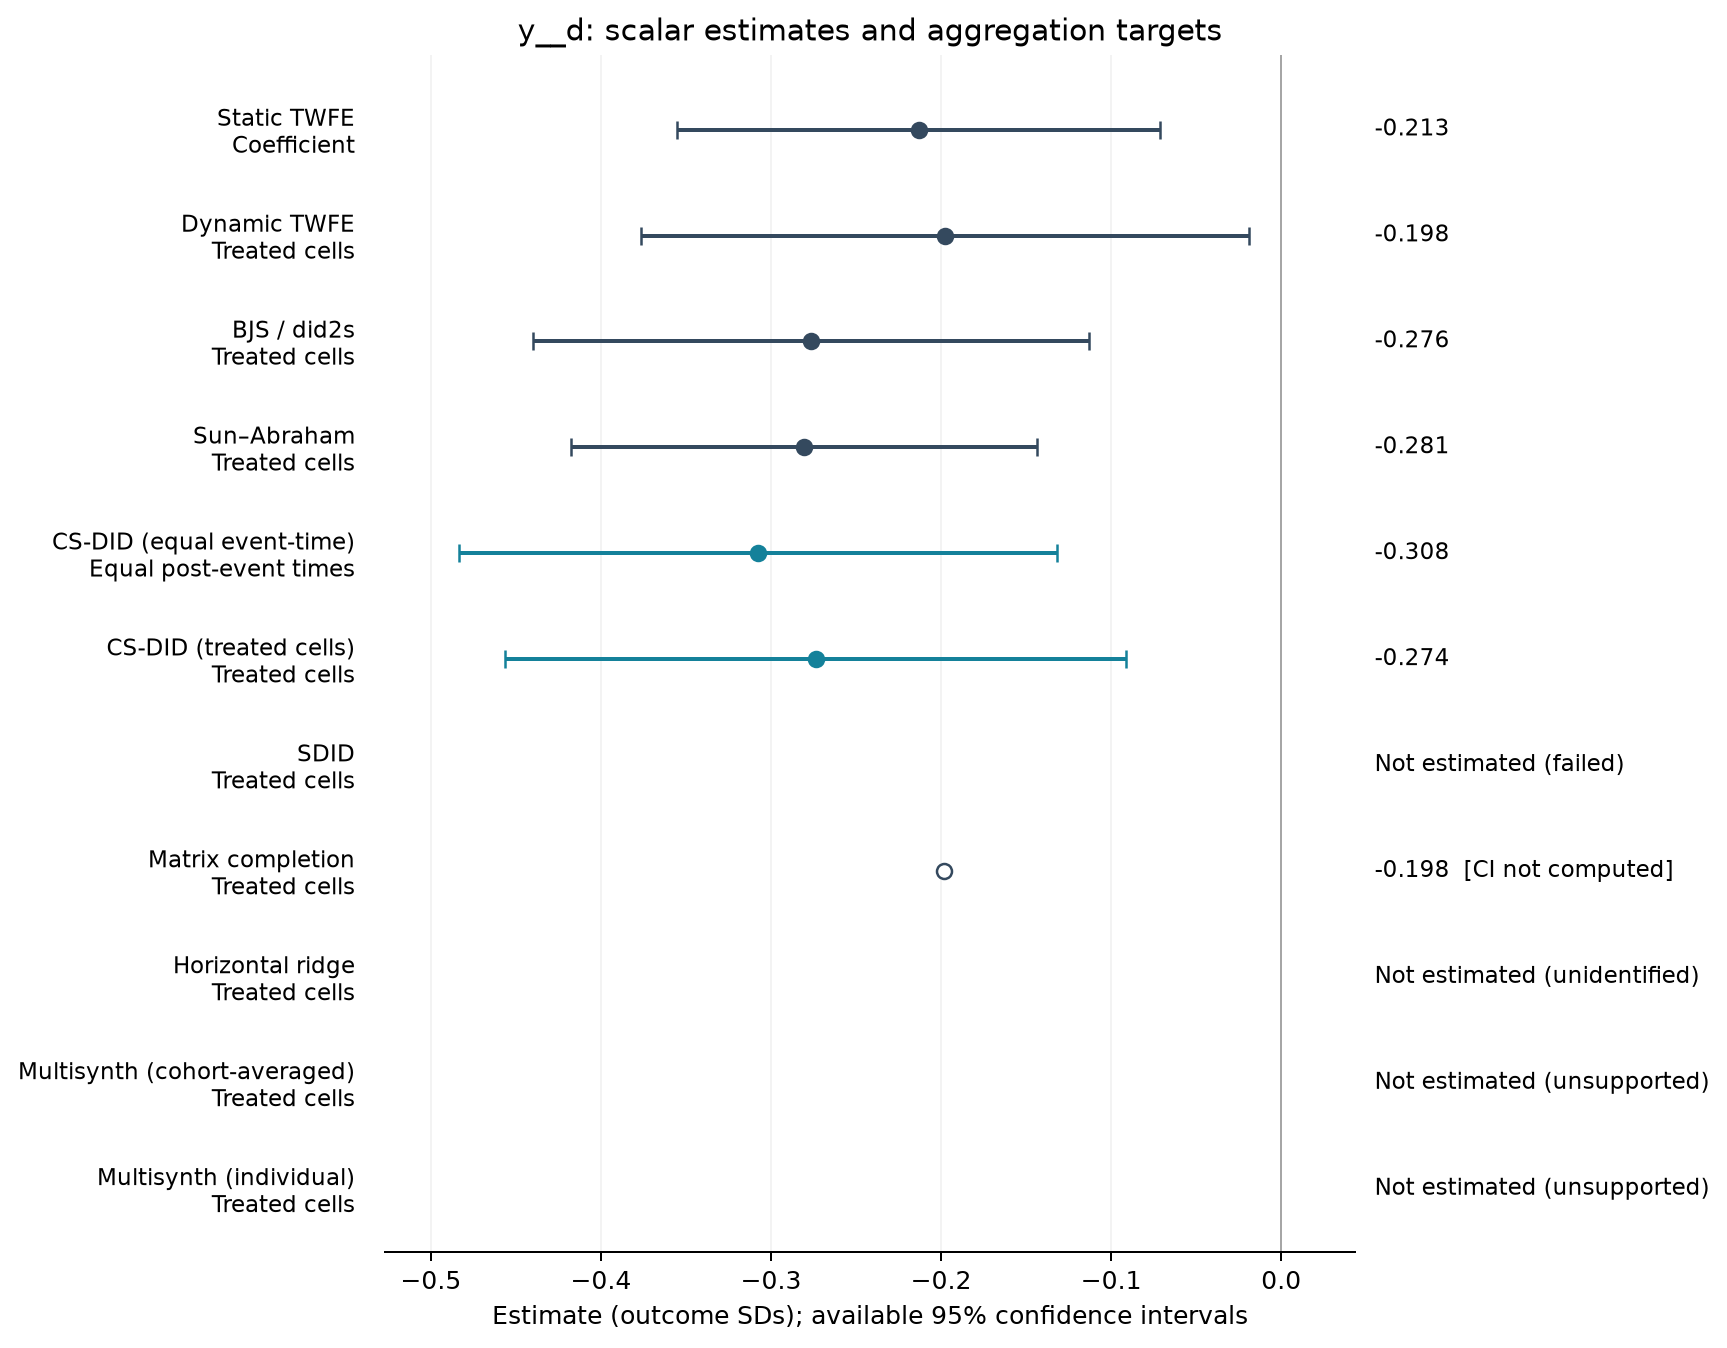
Estimate comparison
| Estimator | Estimate (SDs) | SE | 95% CI | Averaging |
|---|---|---|---|---|
| Static TWFE | -0.213 | 0.071 | [-0.355, -0.071] | Coefficient |
| Dynamic TWFE | -0.198 | 0.090 | [-0.376, -0.019] | Treated cells |
| BJS / did2s | -0.276 | 0.082 | [-0.440, -0.113] | Treated cells |
| Sun–Abraham | -0.281 | 0.069 | [-0.417, -0.144] | Treated cells |
| CS-DID (equal event-time) | -0.308 | 0.090 | [-0.483, -0.132] | Equal post-event times |
| CS-DID (treated cells) | -0.274 | 0.093 | [-0.457, -0.091] | Treated cells |
| Matrix completion | -0.198 | — | — | Treated cells |
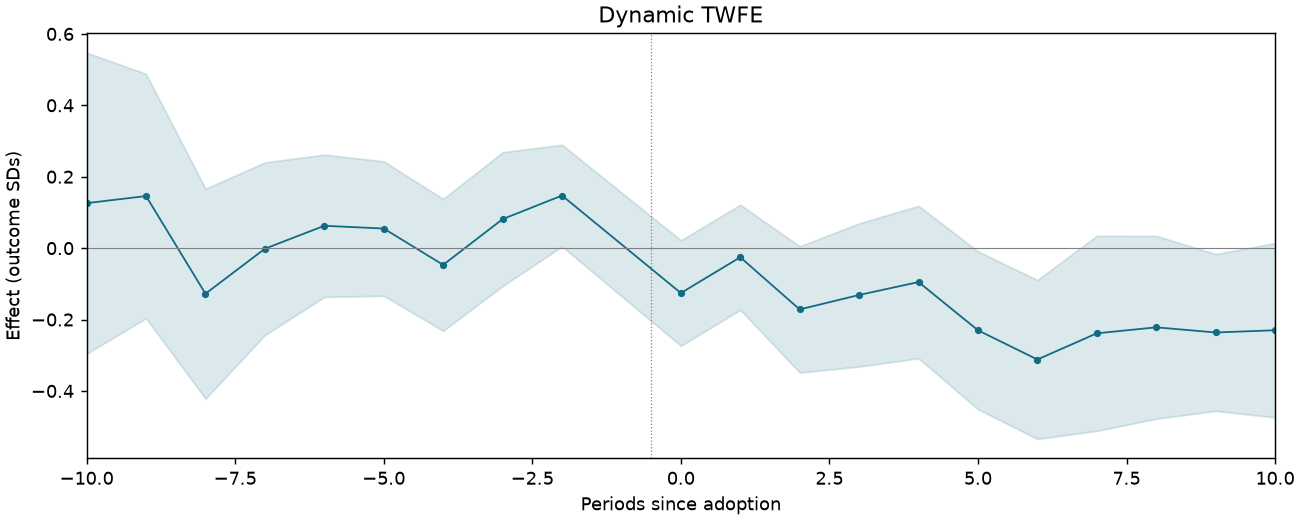
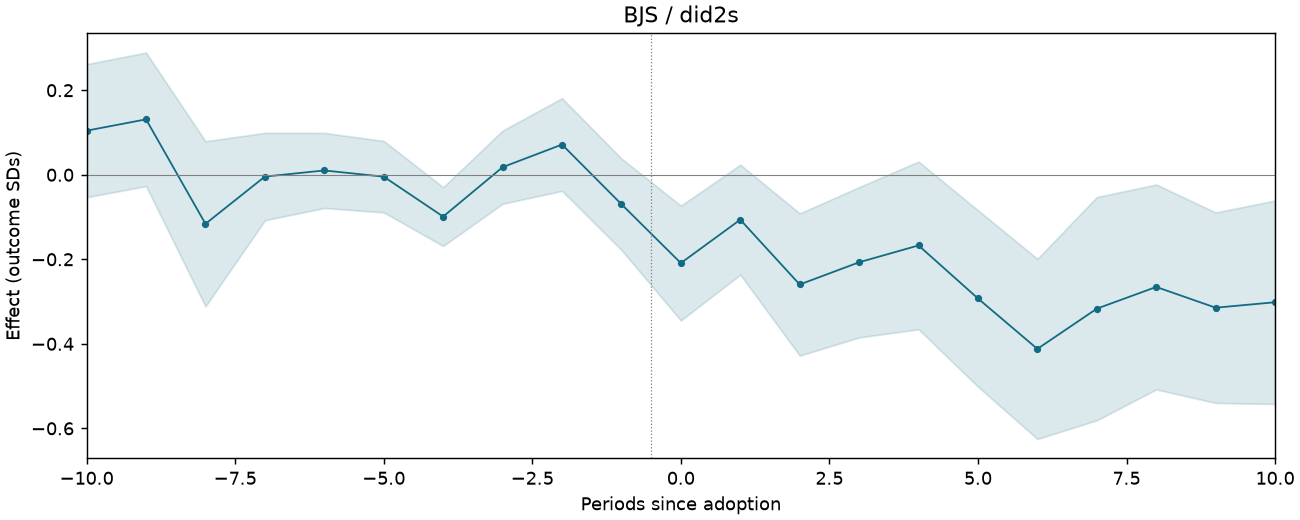
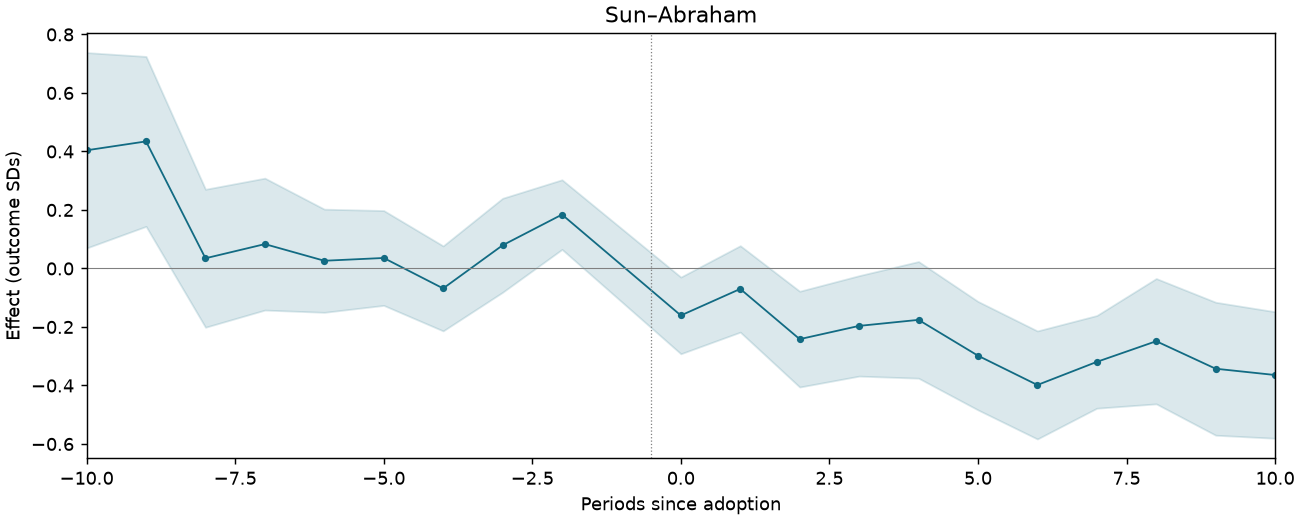
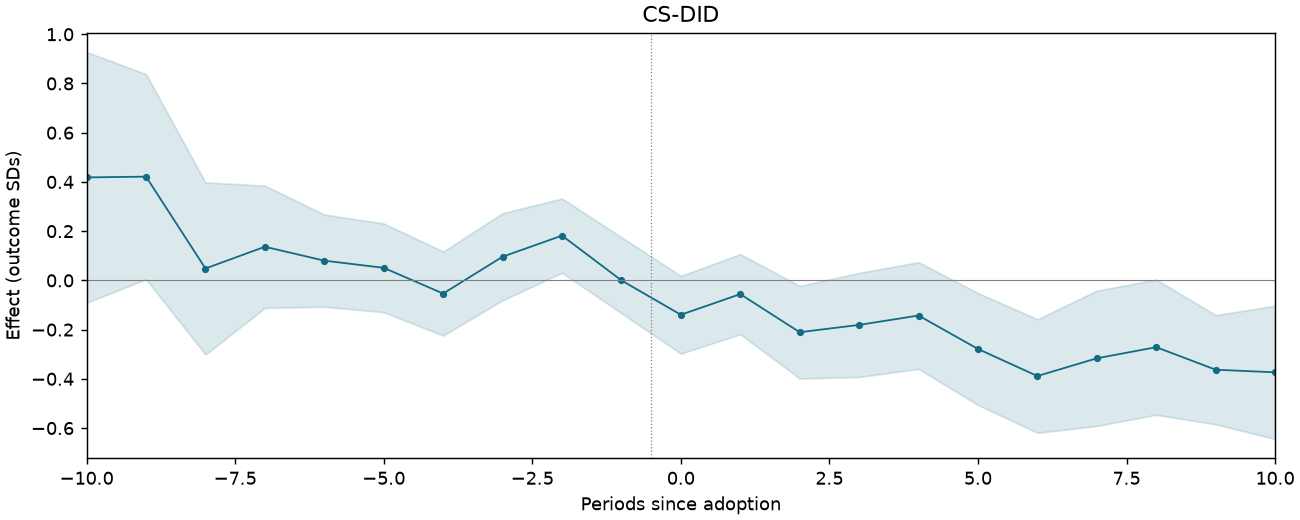
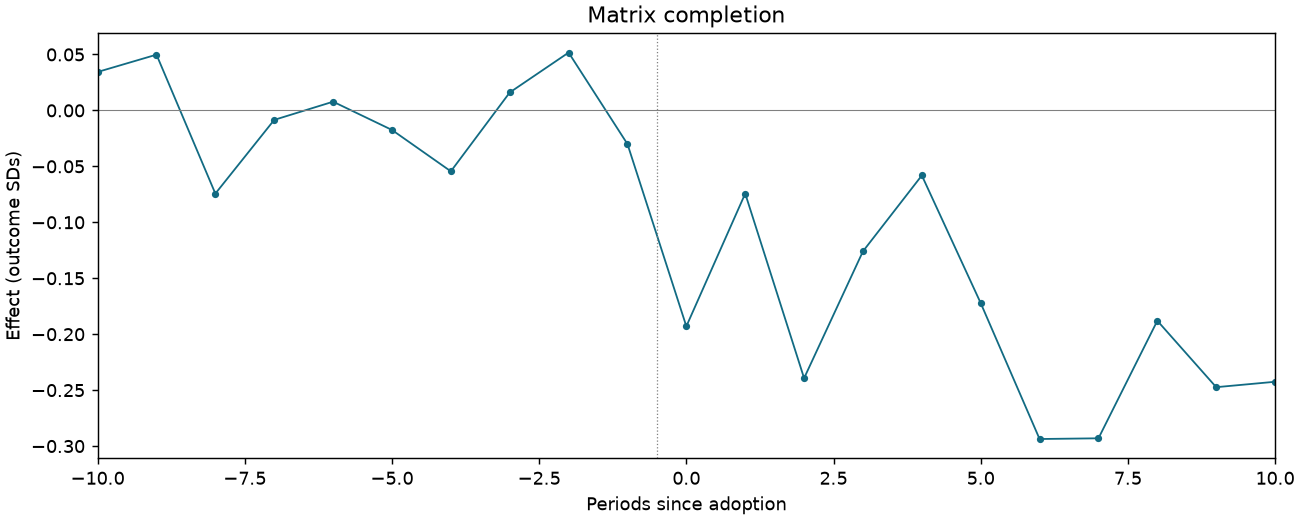
Event studies
Periods −10 to +10; pointwise 95% intervals where available.
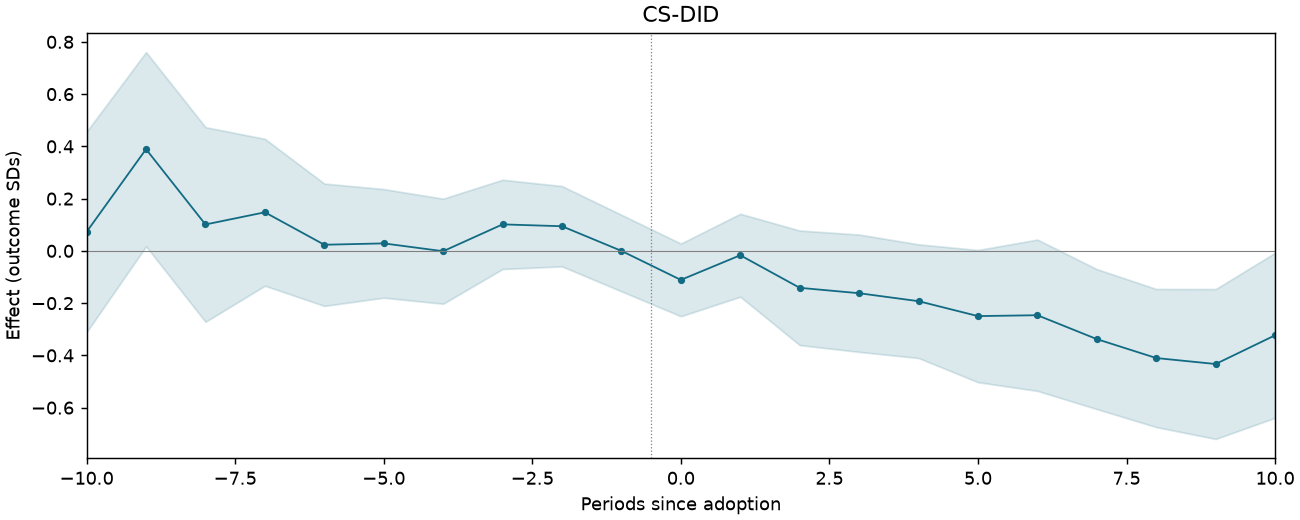
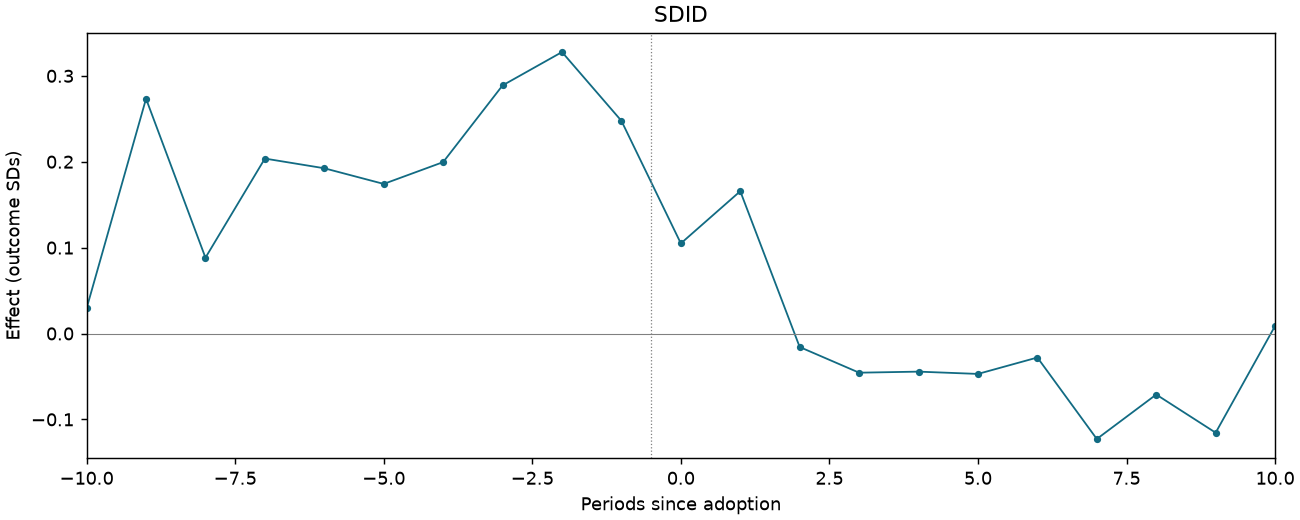
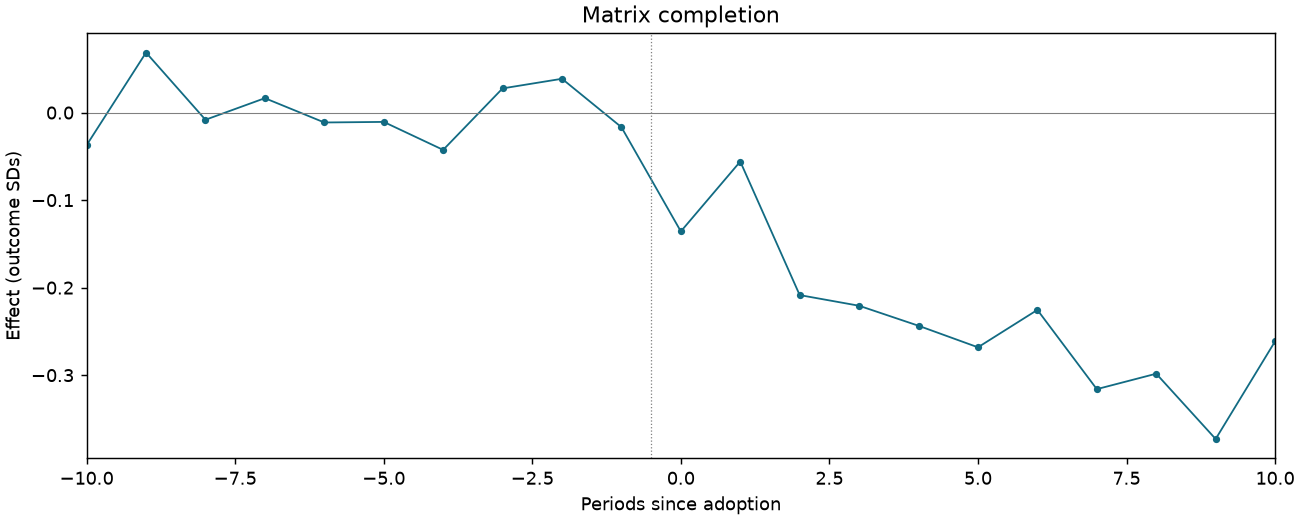
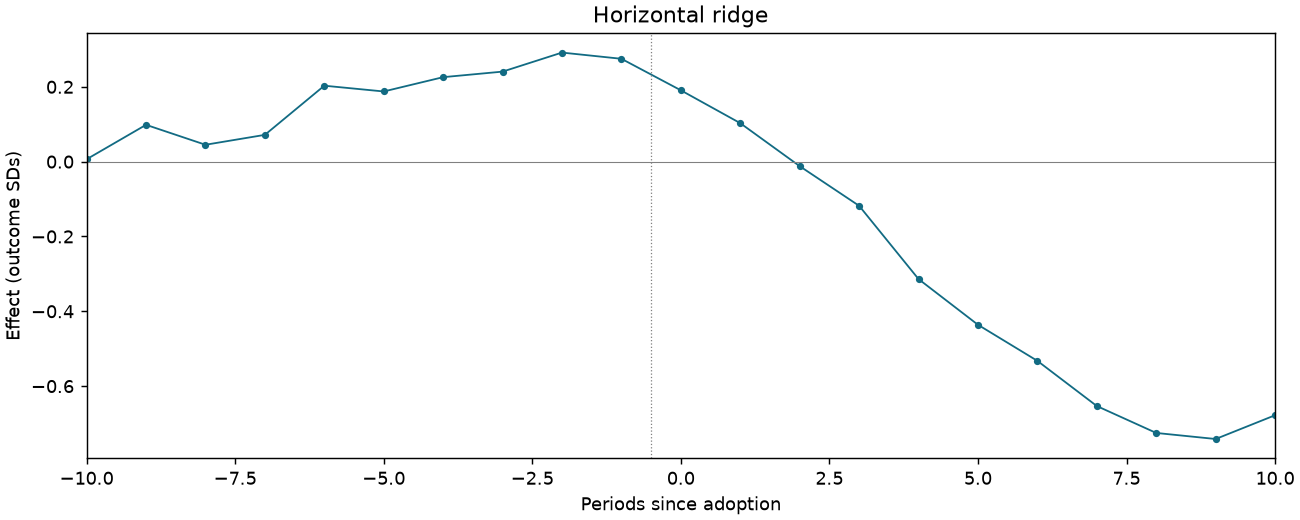
GIFT-F5A-LOGIMR-CSA-POOL
2,100 observations · 100 units · 100 clusters · 48 treated / 52 control units.
Estimate comparison
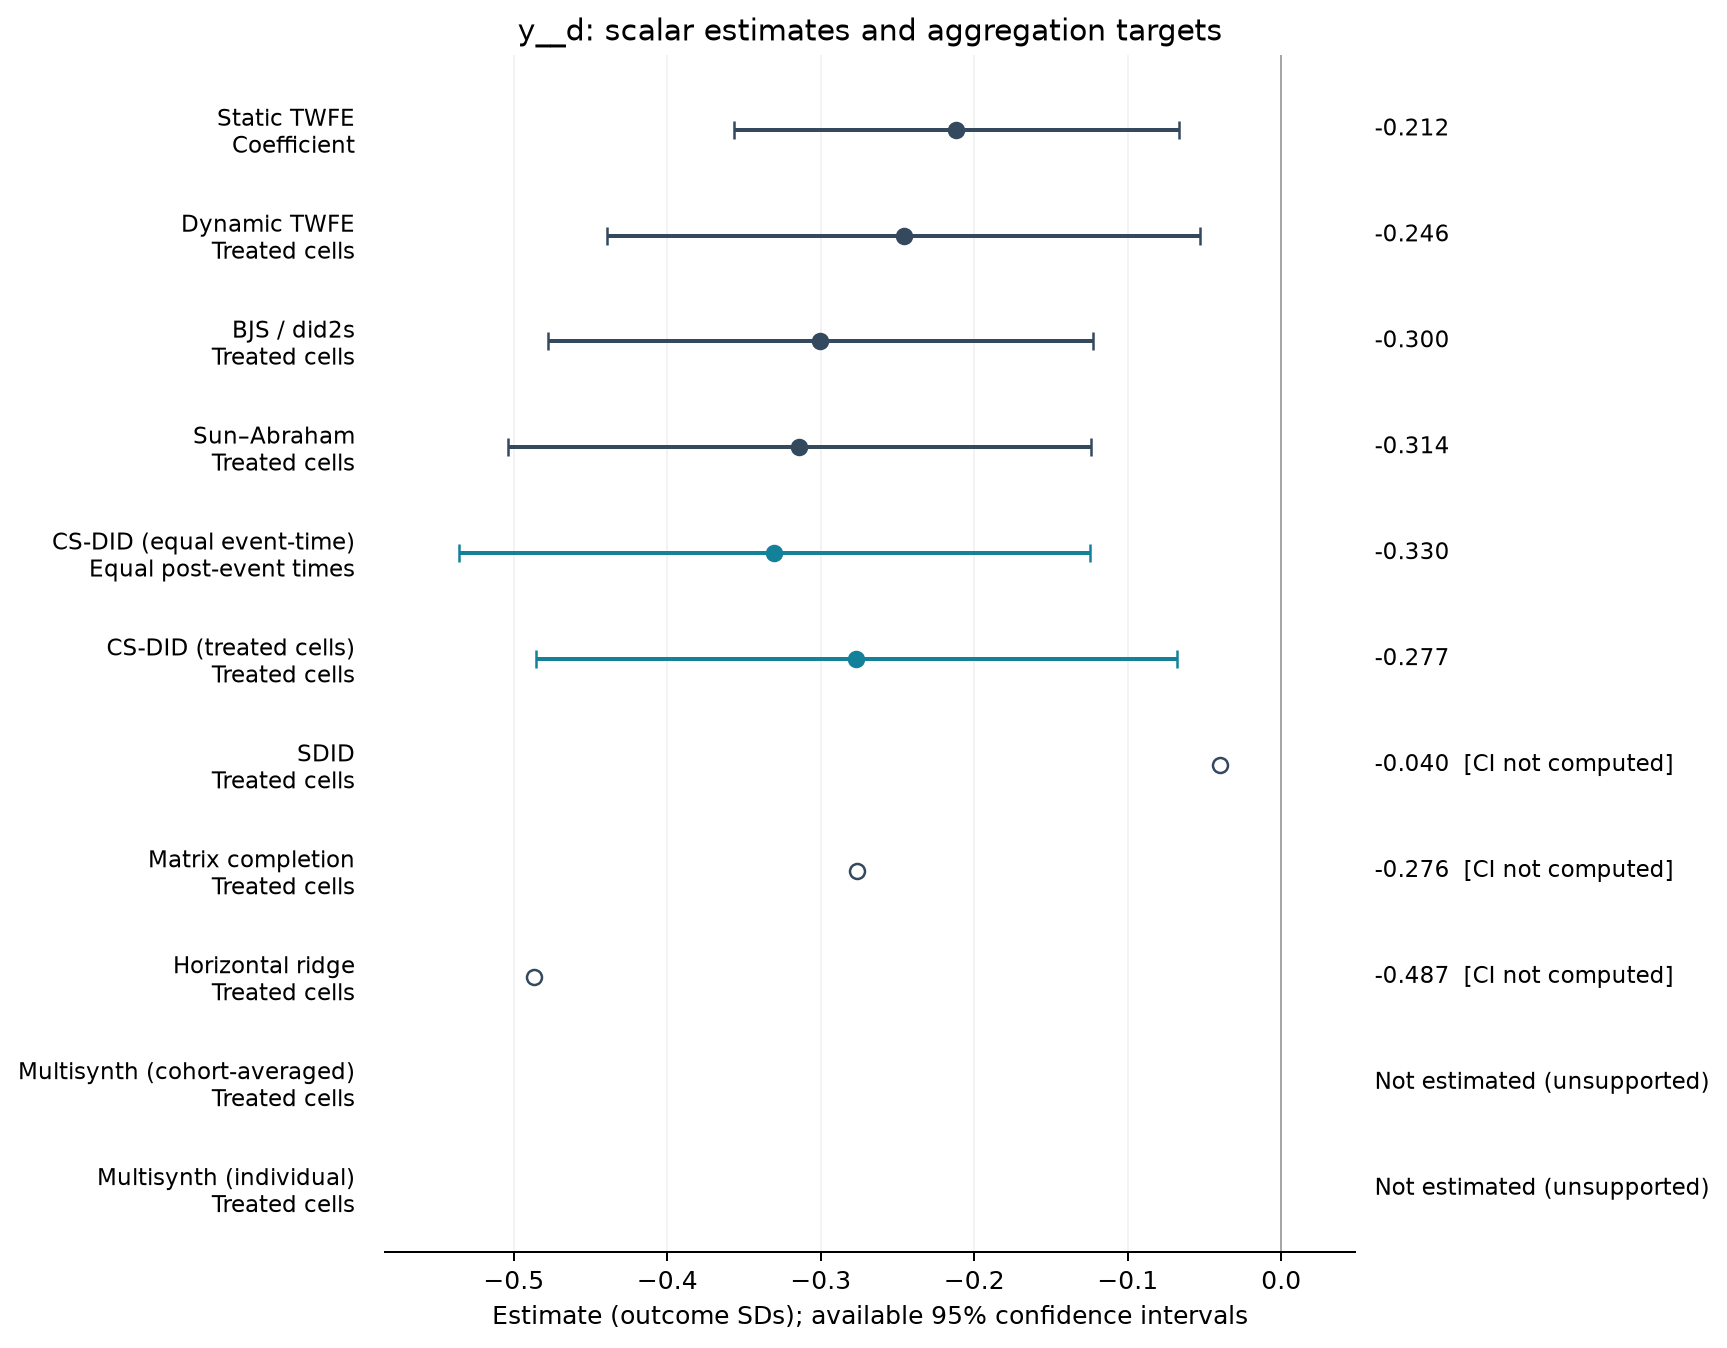
| Estimator | Estimate (SDs) | SE | 95% CI | Averaging |
|---|---|---|---|---|
| Static TWFE | -0.212 | 0.073 | [-0.357, -0.067] | Coefficient |
| Dynamic TWFE | -0.246 | 0.097 | [-0.439, -0.053] | Treated cells |
| BJS / did2s | -0.300 | 0.089 | [-0.478, -0.123] | Treated cells |
| Sun–Abraham | -0.314 | 0.096 | [-0.504, -0.124] | Treated cells |
| CS-DID (equal event-time) | -0.330 | 0.105 | [-0.536, -0.125] | Equal post-event times |
| CS-DID (treated cells) | -0.277 | 0.107 | [-0.486, -0.068] | Treated cells |
| SDID | -0.040 | — | — | Treated cells |
| Matrix completion | -0.276 | — | — | Treated cells |
| Horizontal ridge | -0.487 | — | — | Treated cells |
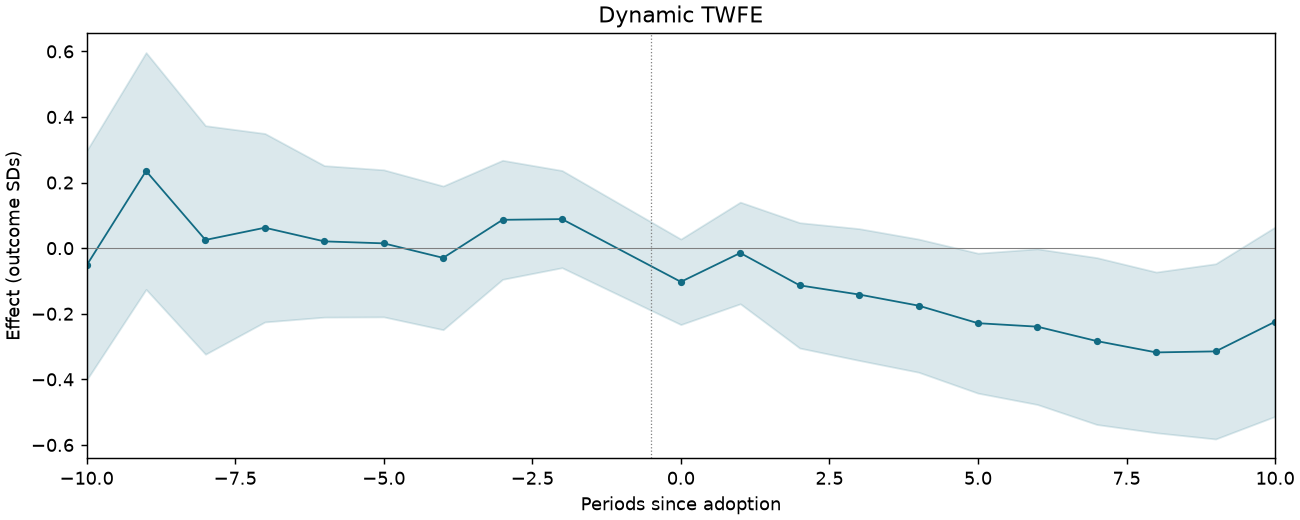
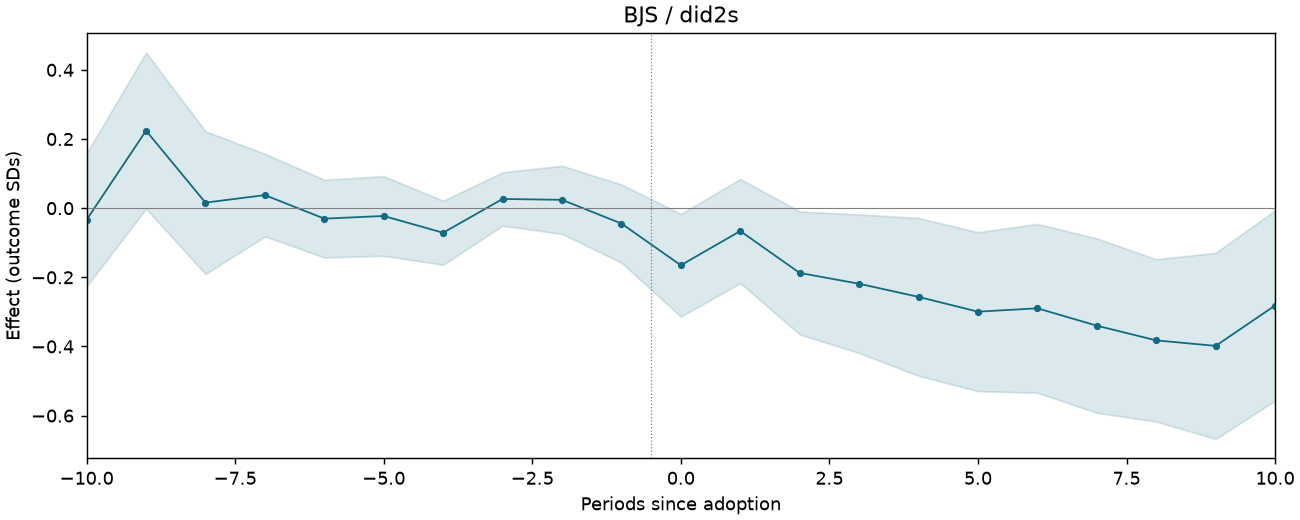
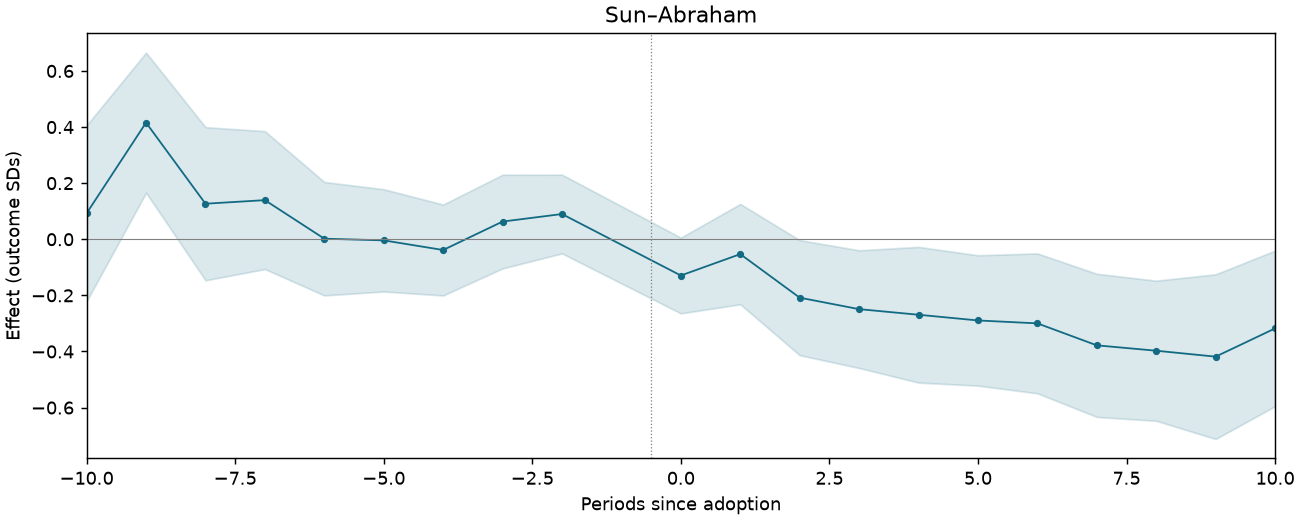
Event studies
Periods −10 to +10; pointwise 95% intervals where available.
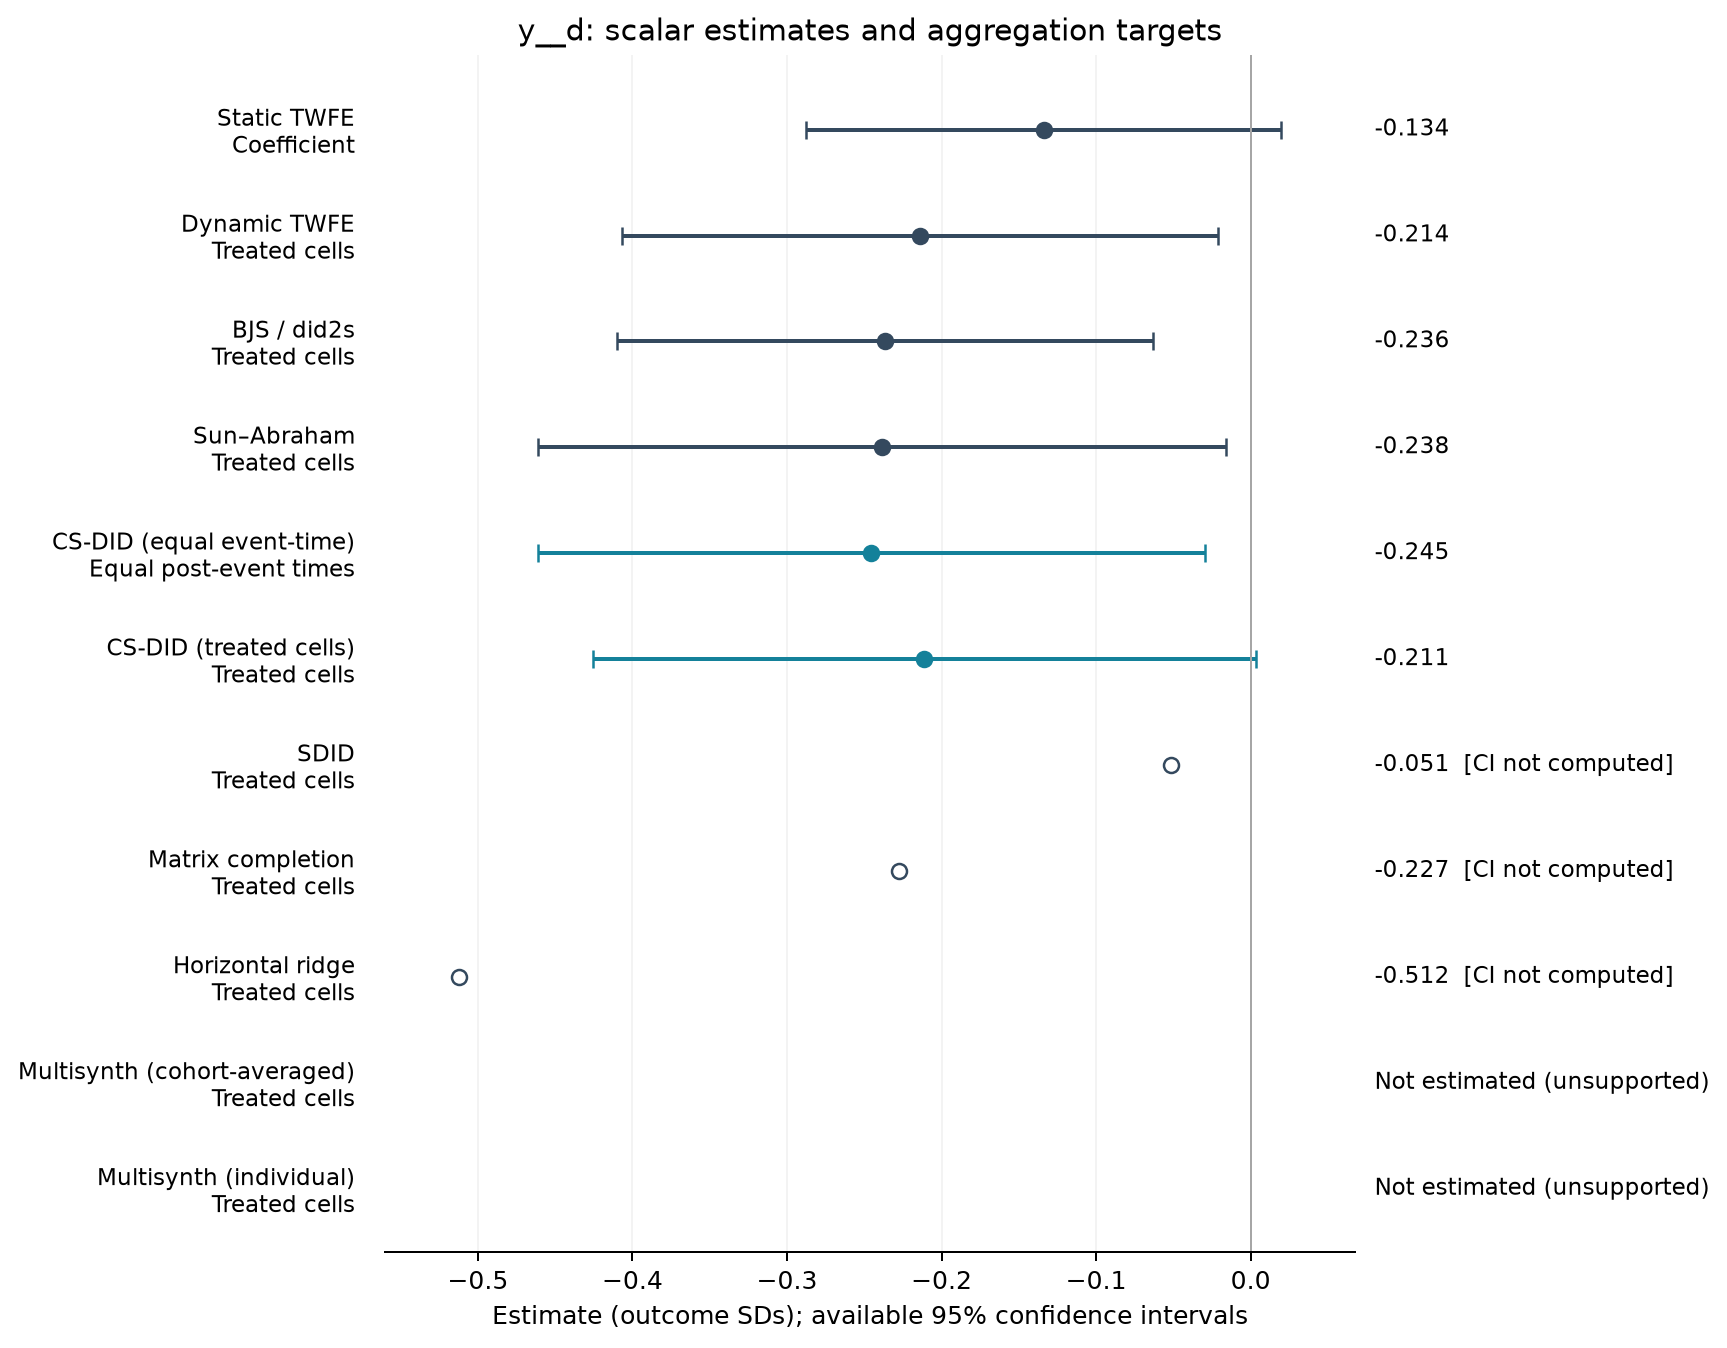
GIFT-F5A-LOGIMR-CSA-WHITE
2,095 observations · 100 units · 100 clusters · 48 treated / 52 control units.
Estimate comparison
| Estimator | Estimate (SDs) | SE | 95% CI | Averaging |
|---|---|---|---|---|
| Static TWFE | -0.134 | 0.077 | [-0.288, 0.020] | Coefficient |
| Dynamic TWFE | -0.214 | 0.097 | [-0.407, -0.021] | Treated cells |
| BJS / did2s | -0.236 | 0.087 | [-0.410, -0.063] | Treated cells |
| Sun–Abraham | -0.238 | 0.112 | [-0.461, -0.016] | Treated cells |
| CS-DID (equal event-time) | -0.245 | 0.110 | [-0.461, -0.030] | Equal post-event times |
| CS-DID (treated cells) | -0.211 | 0.109 | [-0.426, 0.003] | Treated cells |
| SDID | -0.051 | — | — | Treated cells |
| Matrix completion | -0.227 | — | — | Treated cells |
| Horizontal ridge | -0.512 | — | — | Treated cells |
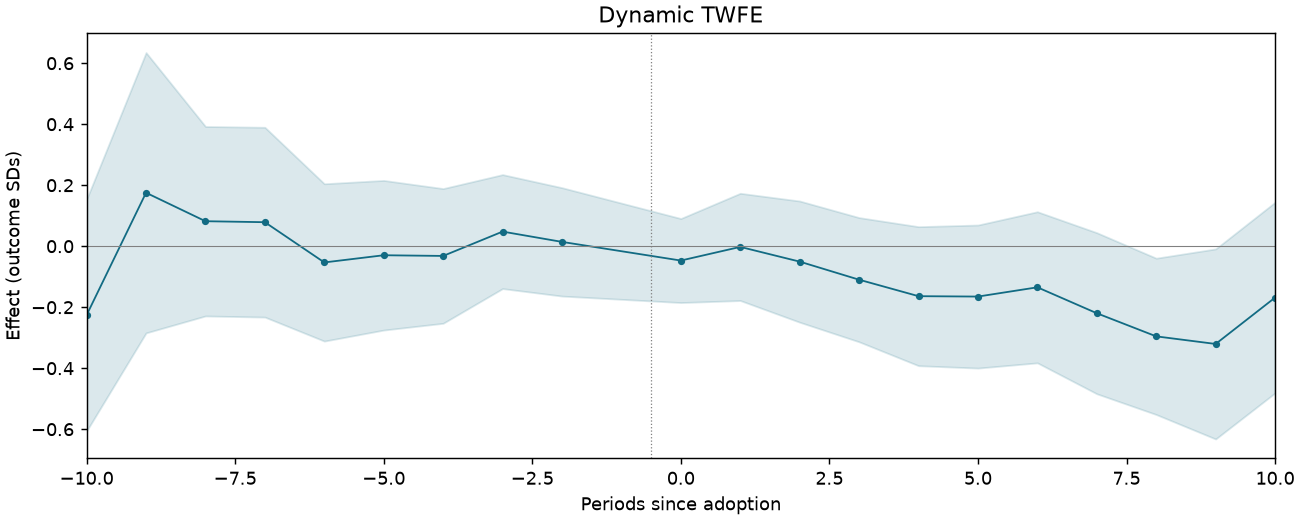
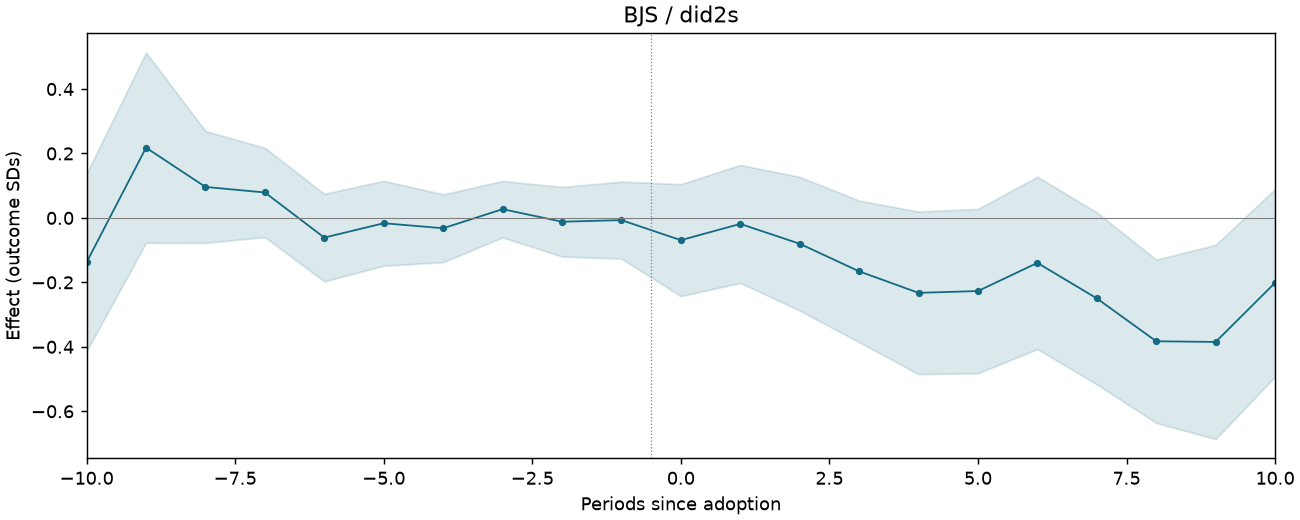
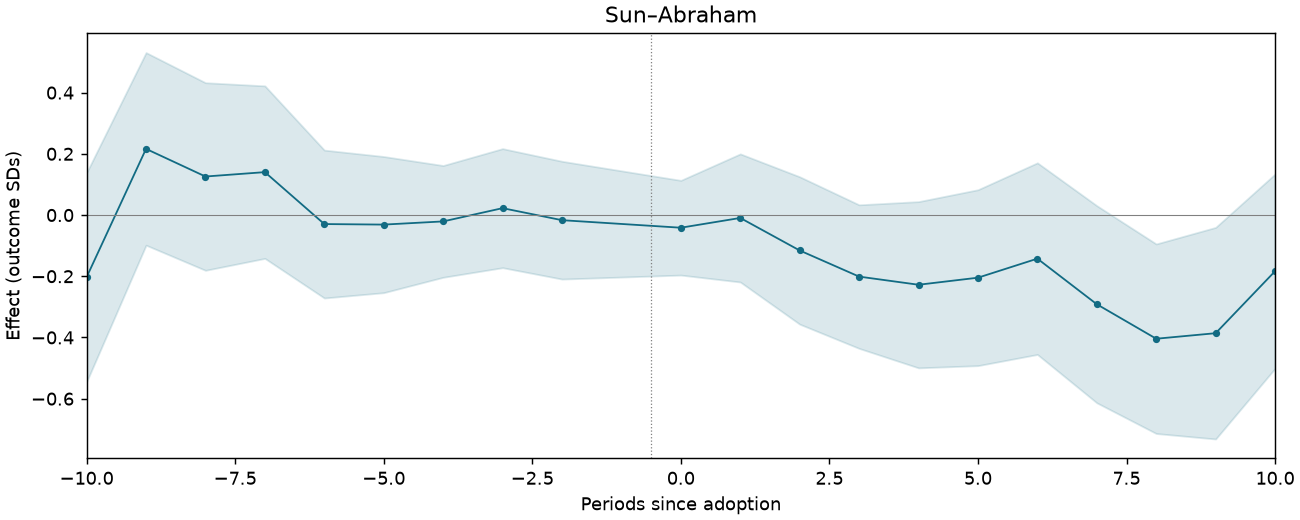
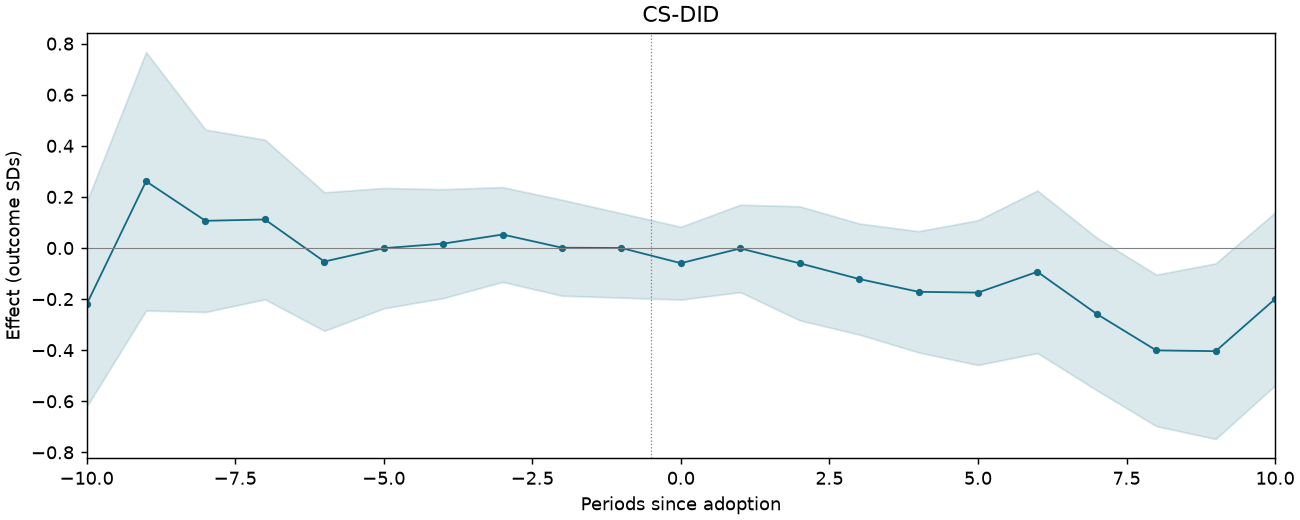
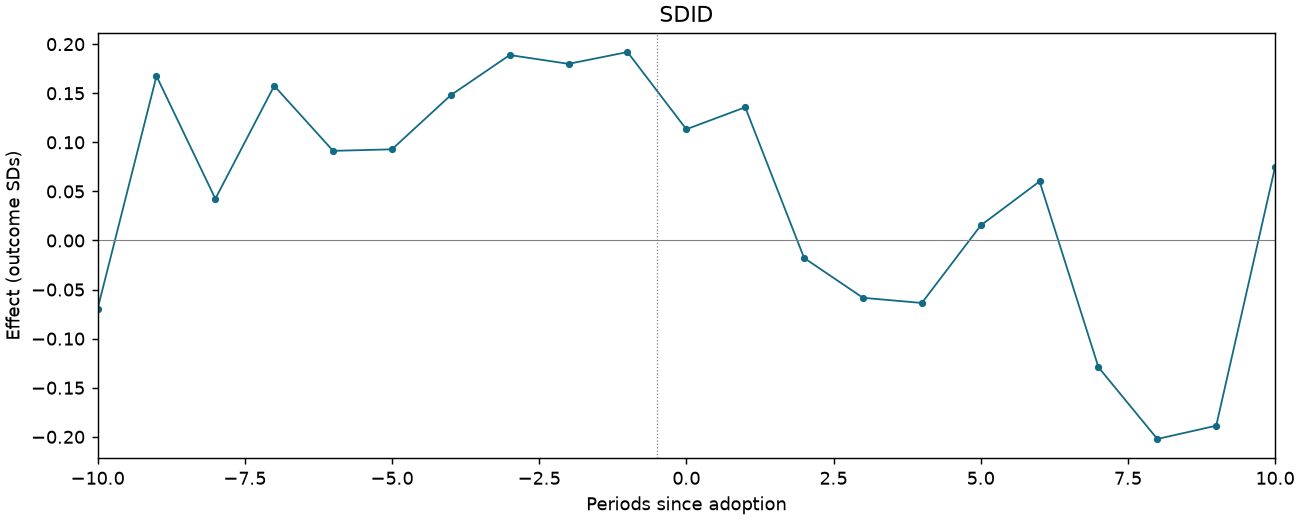
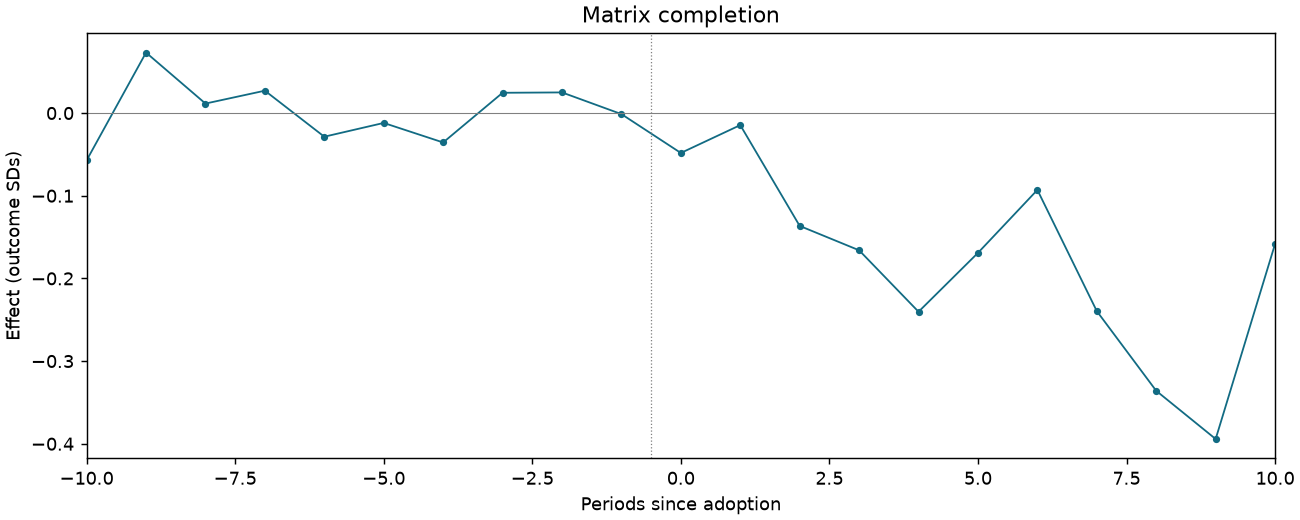
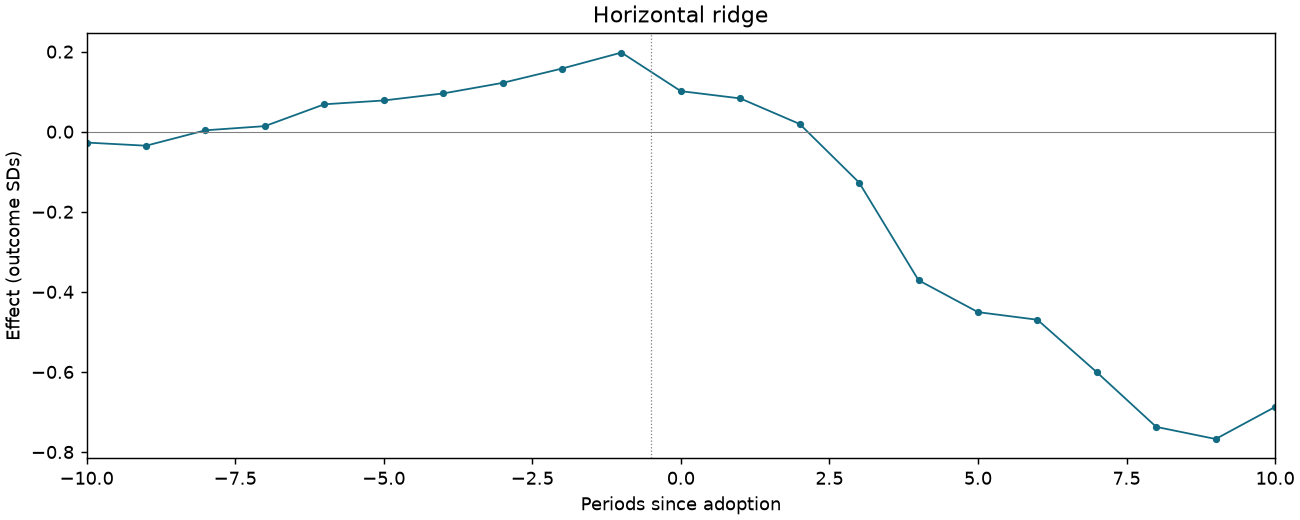
Event studies
Periods −10 to +10; pointwise 95% intervals where available.
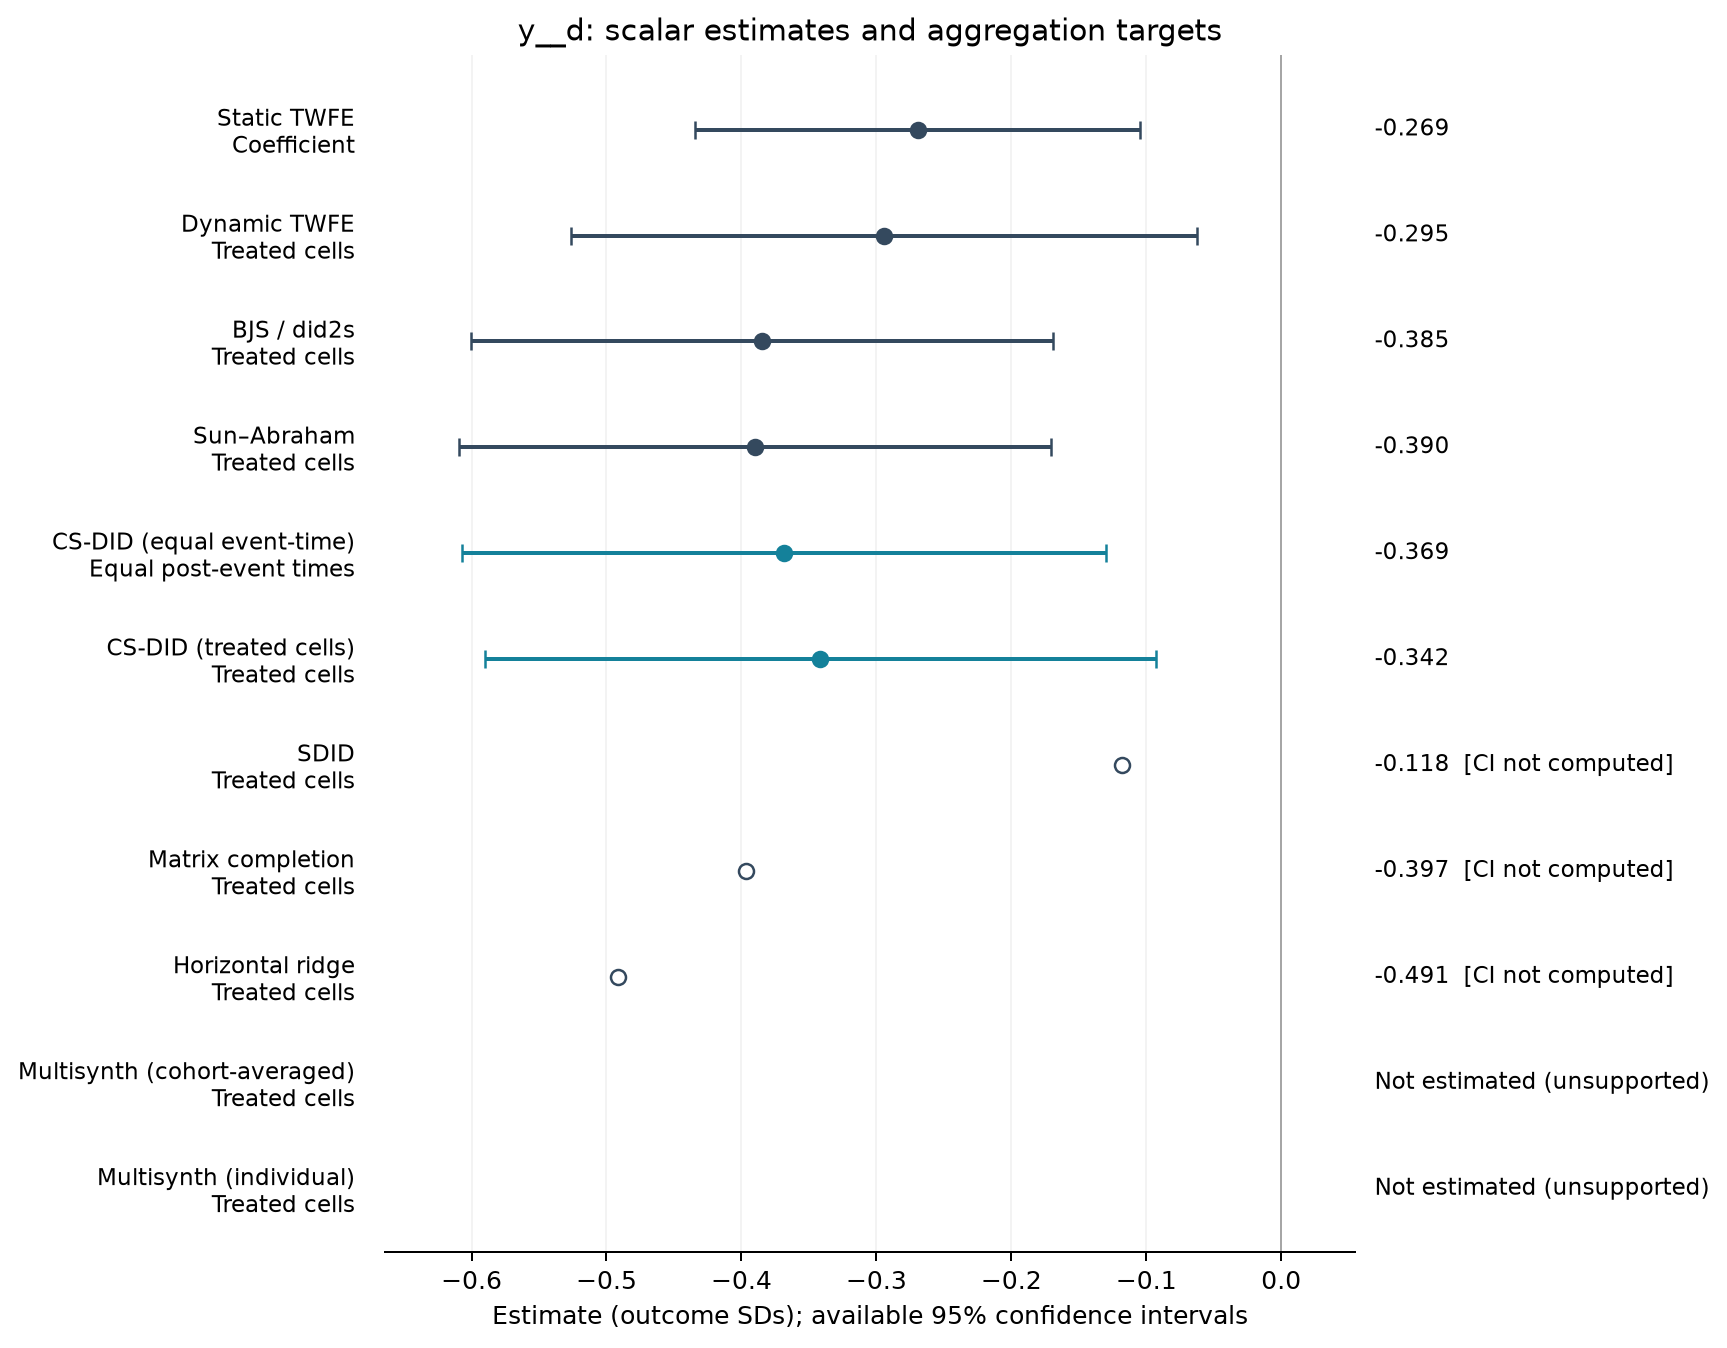
GIFT-F5A-POOL
2,100 observations · 100 units · 100 clusters · 48 treated / 52 control units.
Estimate comparison
| Estimator | Estimate (SDs) | SE | 95% CI | Averaging |
|---|---|---|---|---|
| Static TWFE | -0.269 | 0.083 | [-0.434, -0.104] | Coefficient |
| Dynamic TWFE | -0.295 | 0.117 | [-0.527, -0.063] | Treated cells |
| BJS / did2s | -0.385 | 0.109 | [-0.601, -0.169] | Treated cells |
| Sun–Abraham | -0.390 | 0.111 | [-0.609, -0.171] | Treated cells |
| CS-DID (equal event-time) | -0.369 | 0.122 | [-0.607, -0.130] | Equal post-event times |
| CS-DID (treated cells) | -0.342 | 0.127 | [-0.590, -0.093] | Treated cells |
| SDID | -0.118 | — | — | Treated cells |
| Matrix completion | -0.397 | — | — | Treated cells |
| Horizontal ridge | -0.491 | — | — | Treated cells |
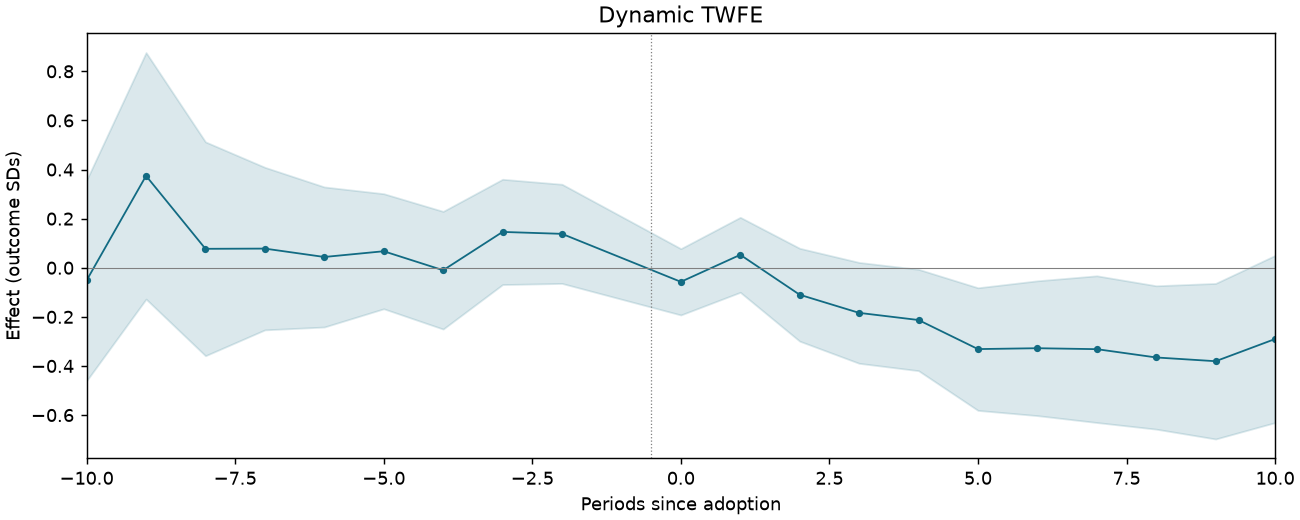
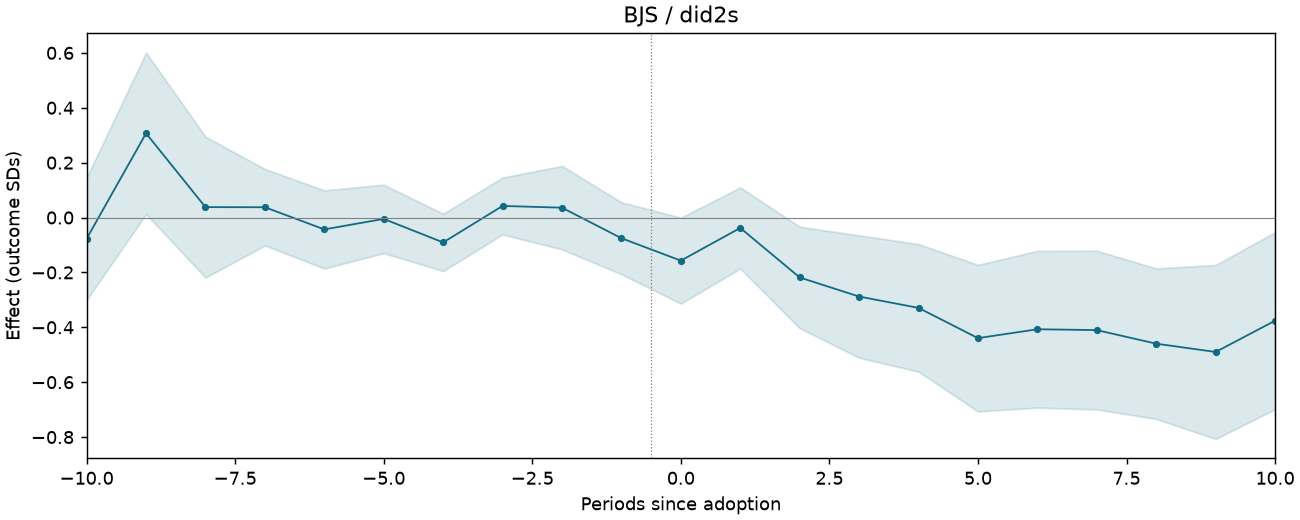
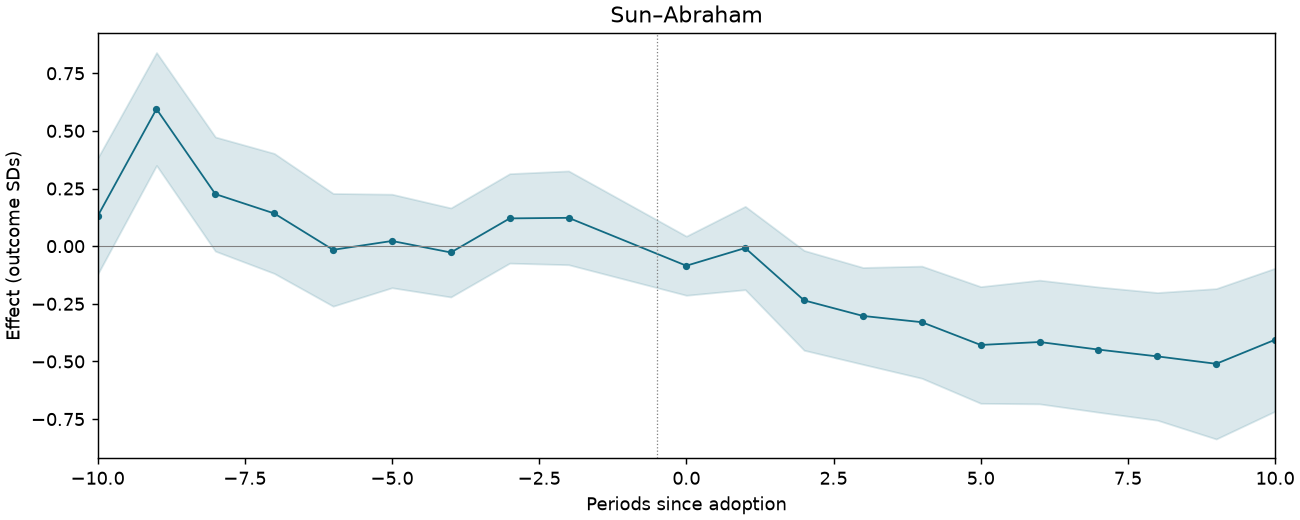
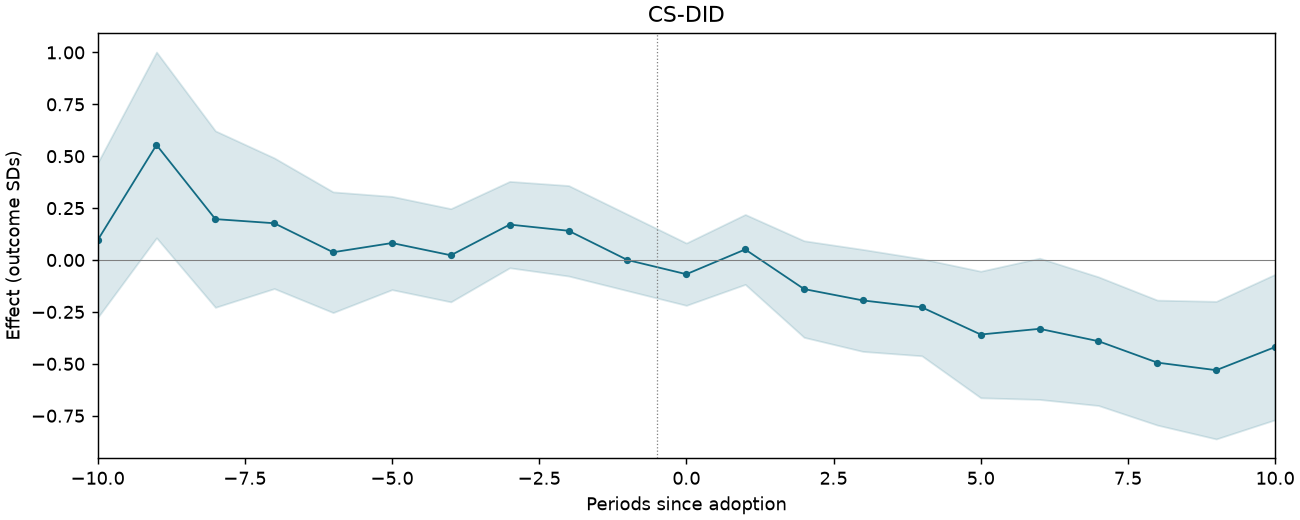
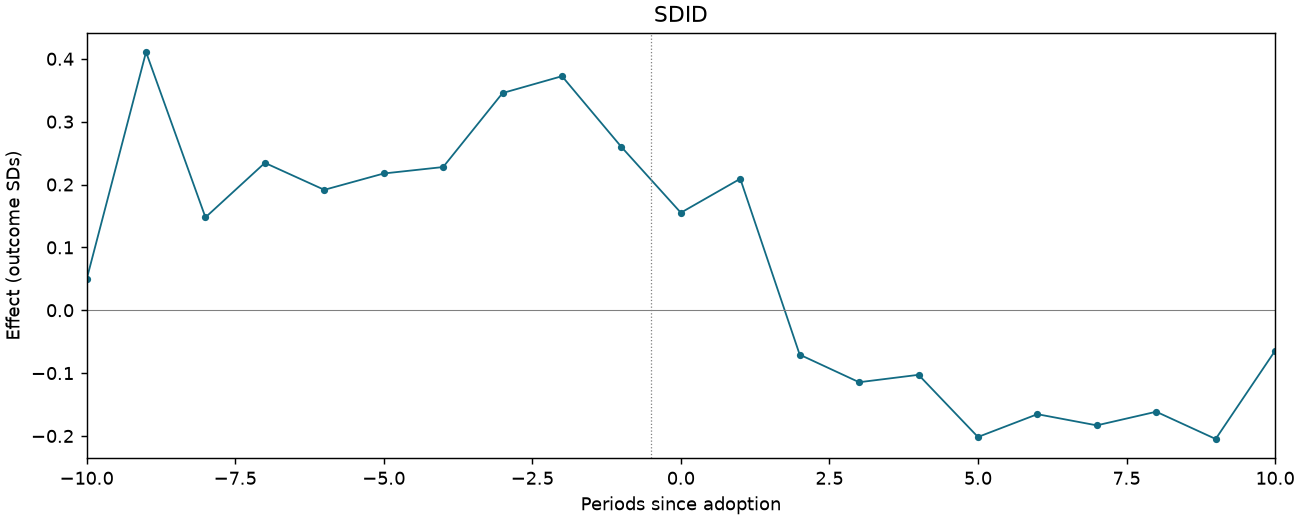
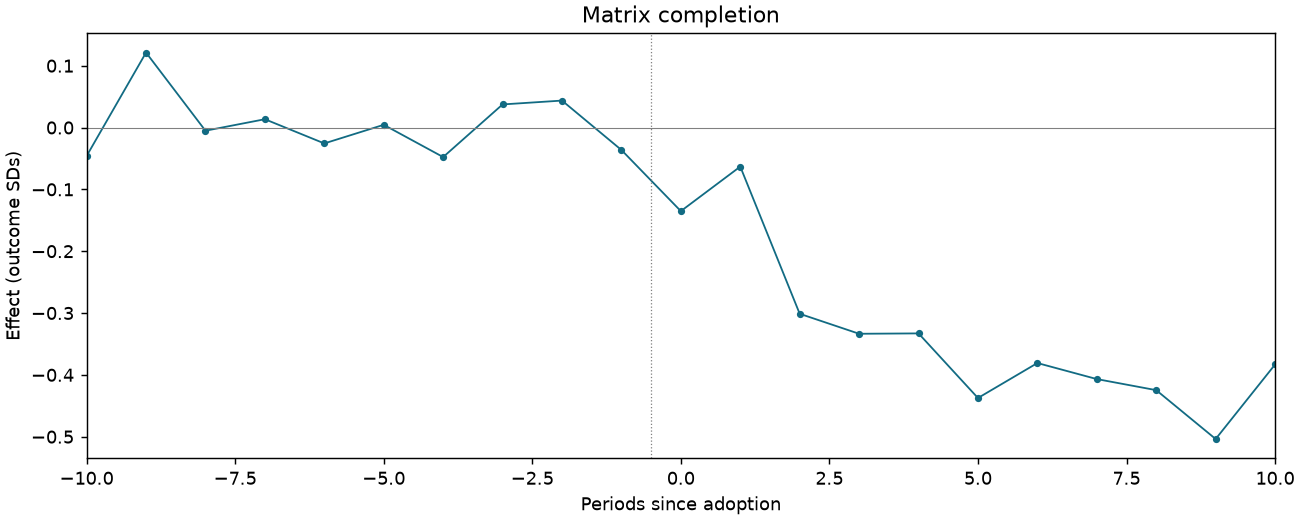
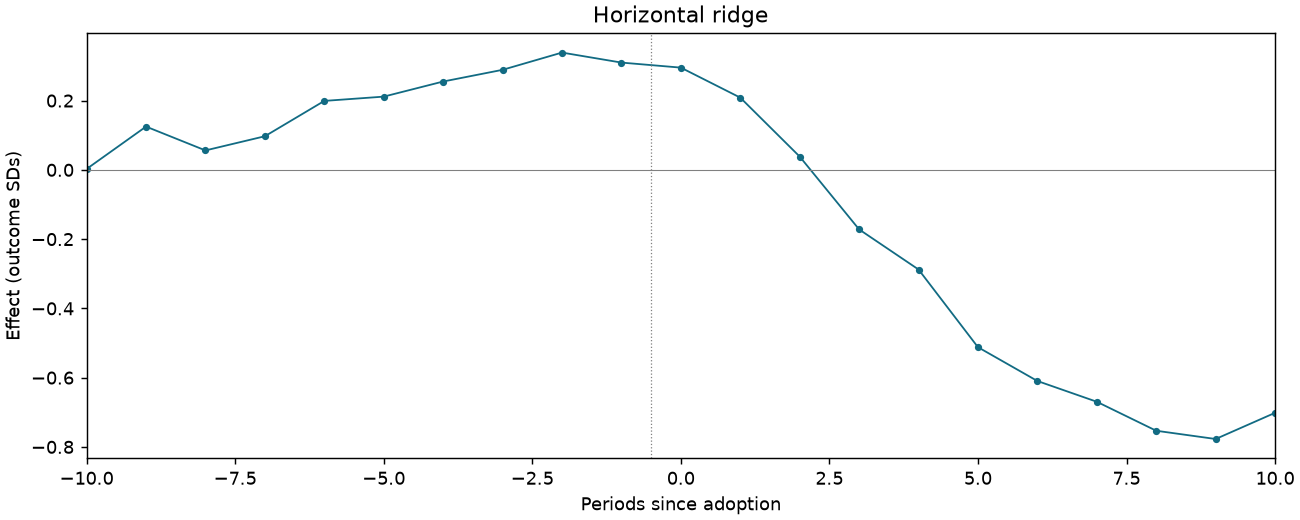
Event studies
Periods −10 to +10; pointwise 95% intervals where available.
GIFT-F5A-WHITE
1,995 observations · 95 units · 95 clusters · 46 treated / 49 control units.
Estimate comparison
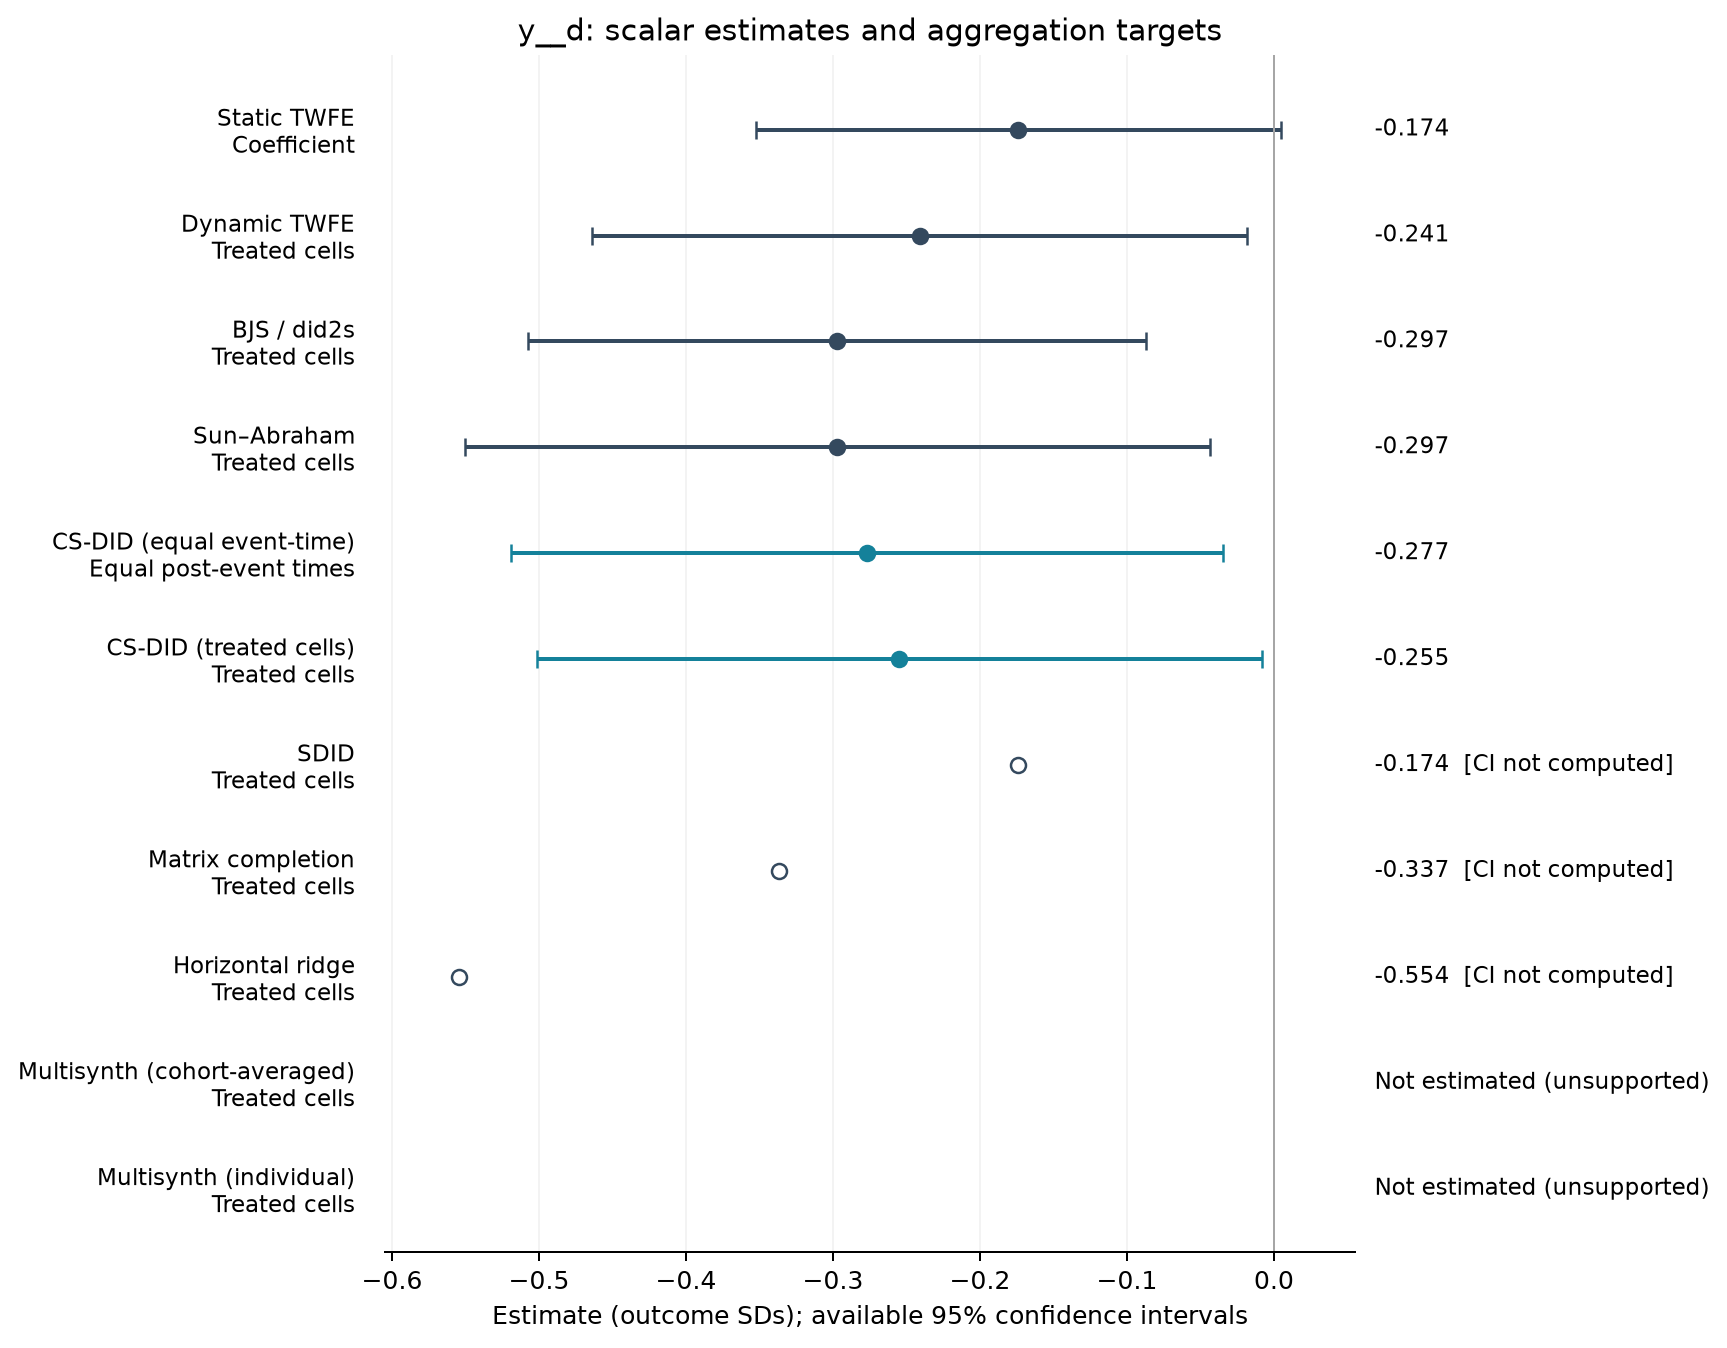
| Estimator | Estimate (SDs) | SE | 95% CI | Averaging |
|---|---|---|---|---|
| Static TWFE | -0.174 | 0.090 | [-0.353, 0.005] | Coefficient |
| Dynamic TWFE | -0.241 | 0.112 | [-0.464, -0.018] | Treated cells |
| BJS / did2s | -0.297 | 0.106 | [-0.507, -0.087] | Treated cells |
| Sun–Abraham | -0.297 | 0.128 | [-0.551, -0.044] | Treated cells |
| CS-DID (equal event-time) | -0.277 | 0.124 | [-0.519, -0.034] | Equal post-event times |
| CS-DID (treated cells) | -0.255 | 0.126 | [-0.501, -0.008] | Treated cells |
| SDID | -0.174 | — | — | Treated cells |
| Matrix completion | -0.337 | — | — | Treated cells |
| Horizontal ridge | -0.554 | — | — | Treated cells |
Event studies
Periods −10 to +10; pointwise 95% intervals where available.