Reconciliation Narratives — expanded estimators
Archive index · Regression tests · Results & settings (JSON) · Methods & code
Esposito et al. (2023), AER. https://doi.org/10.1257/aer.20210413
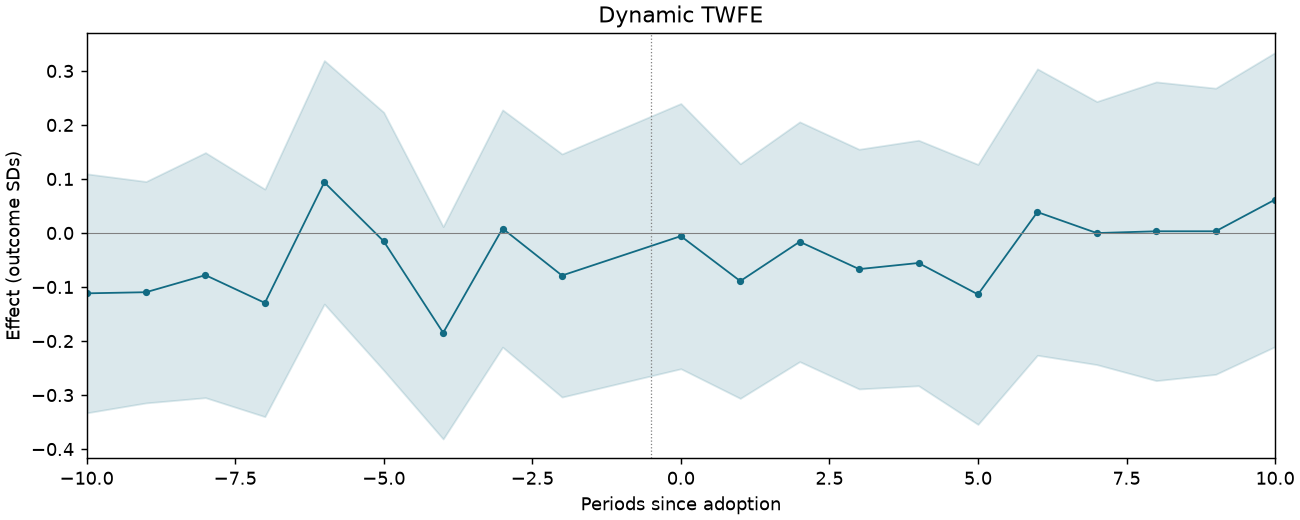
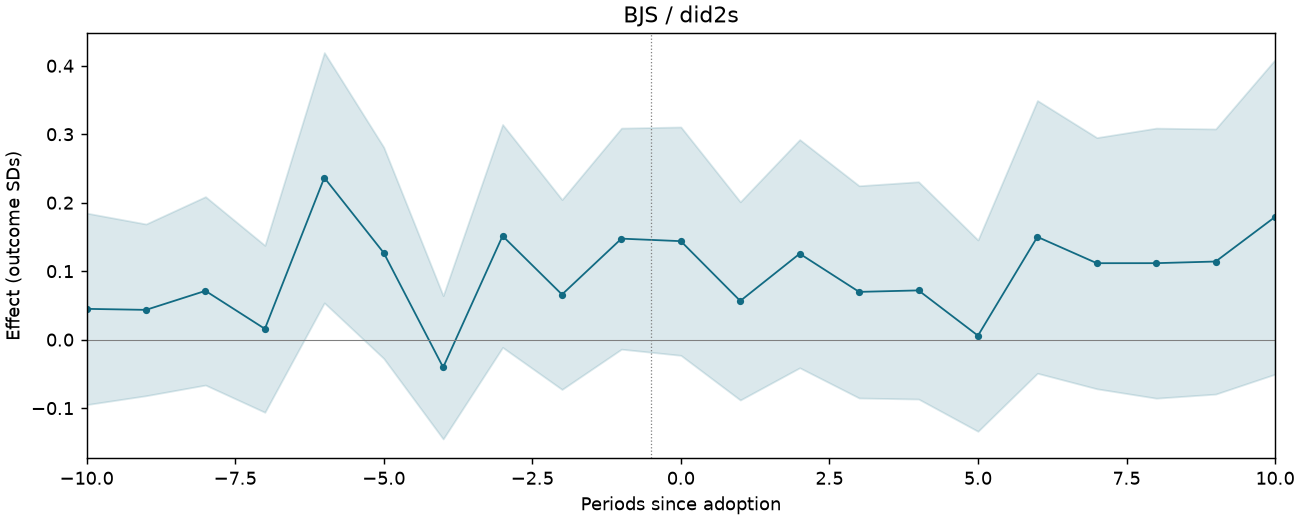
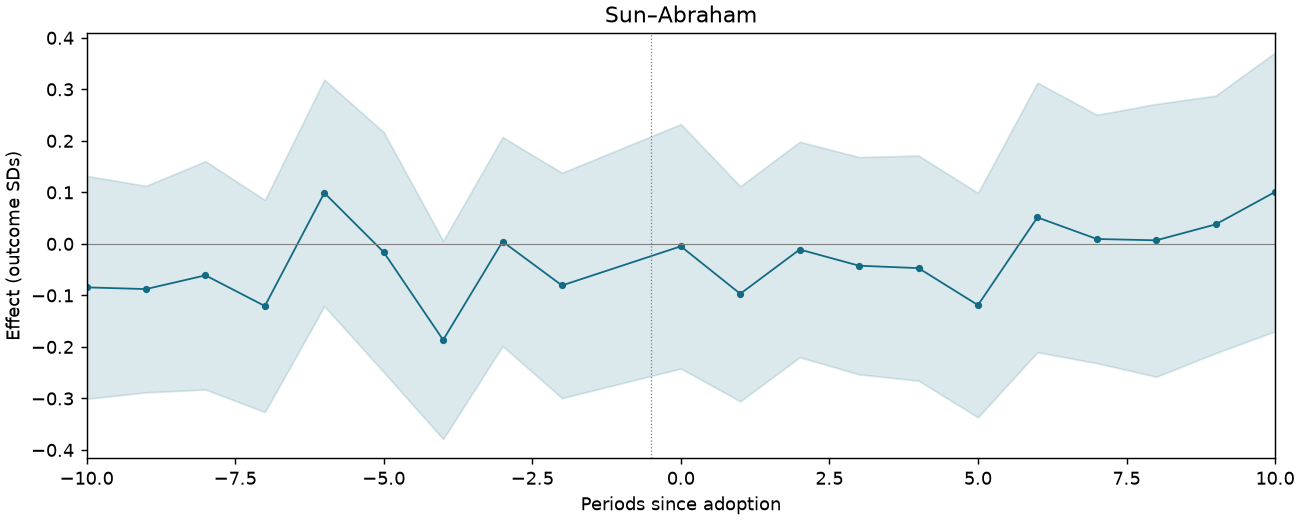
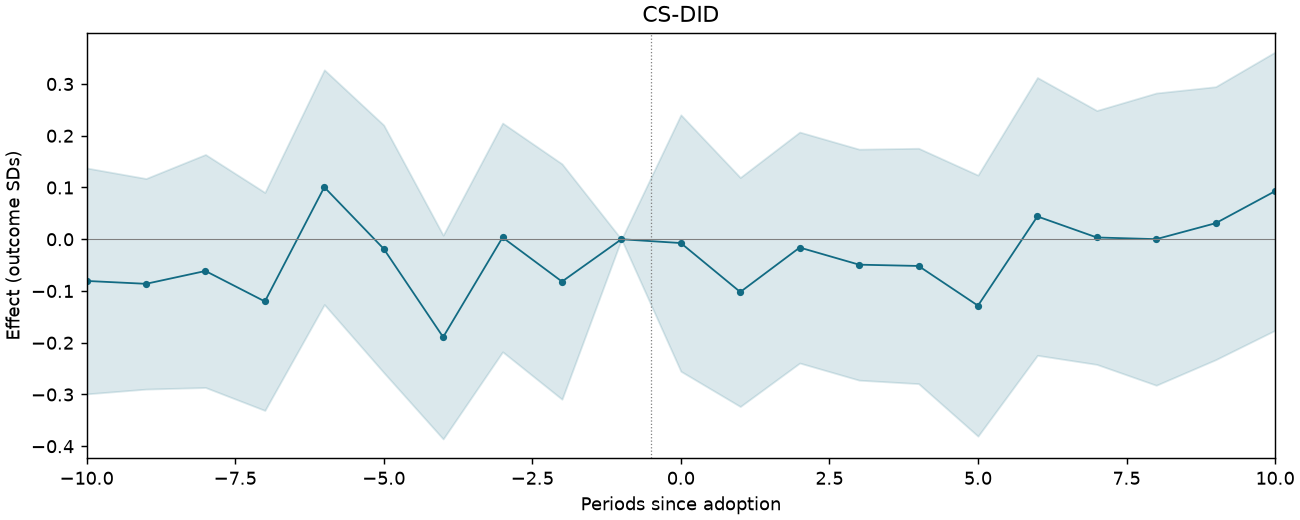
4 specifications. Effects are in outcome standard deviations; intervals are 95%.
Treatment adoption

S14-P004: seeded sample of 100 of 923 eligible units. Purple untreated; yellow treated; white unobserved.
BON-T4-PA-C1
62,968 observations · 926 units · 926 clusters · 431 treated / 495 control units.
Estimate comparison
| Estimator | Estimate (SDs) | SE | 95% CI | Averaging |
|---|---|---|---|---|
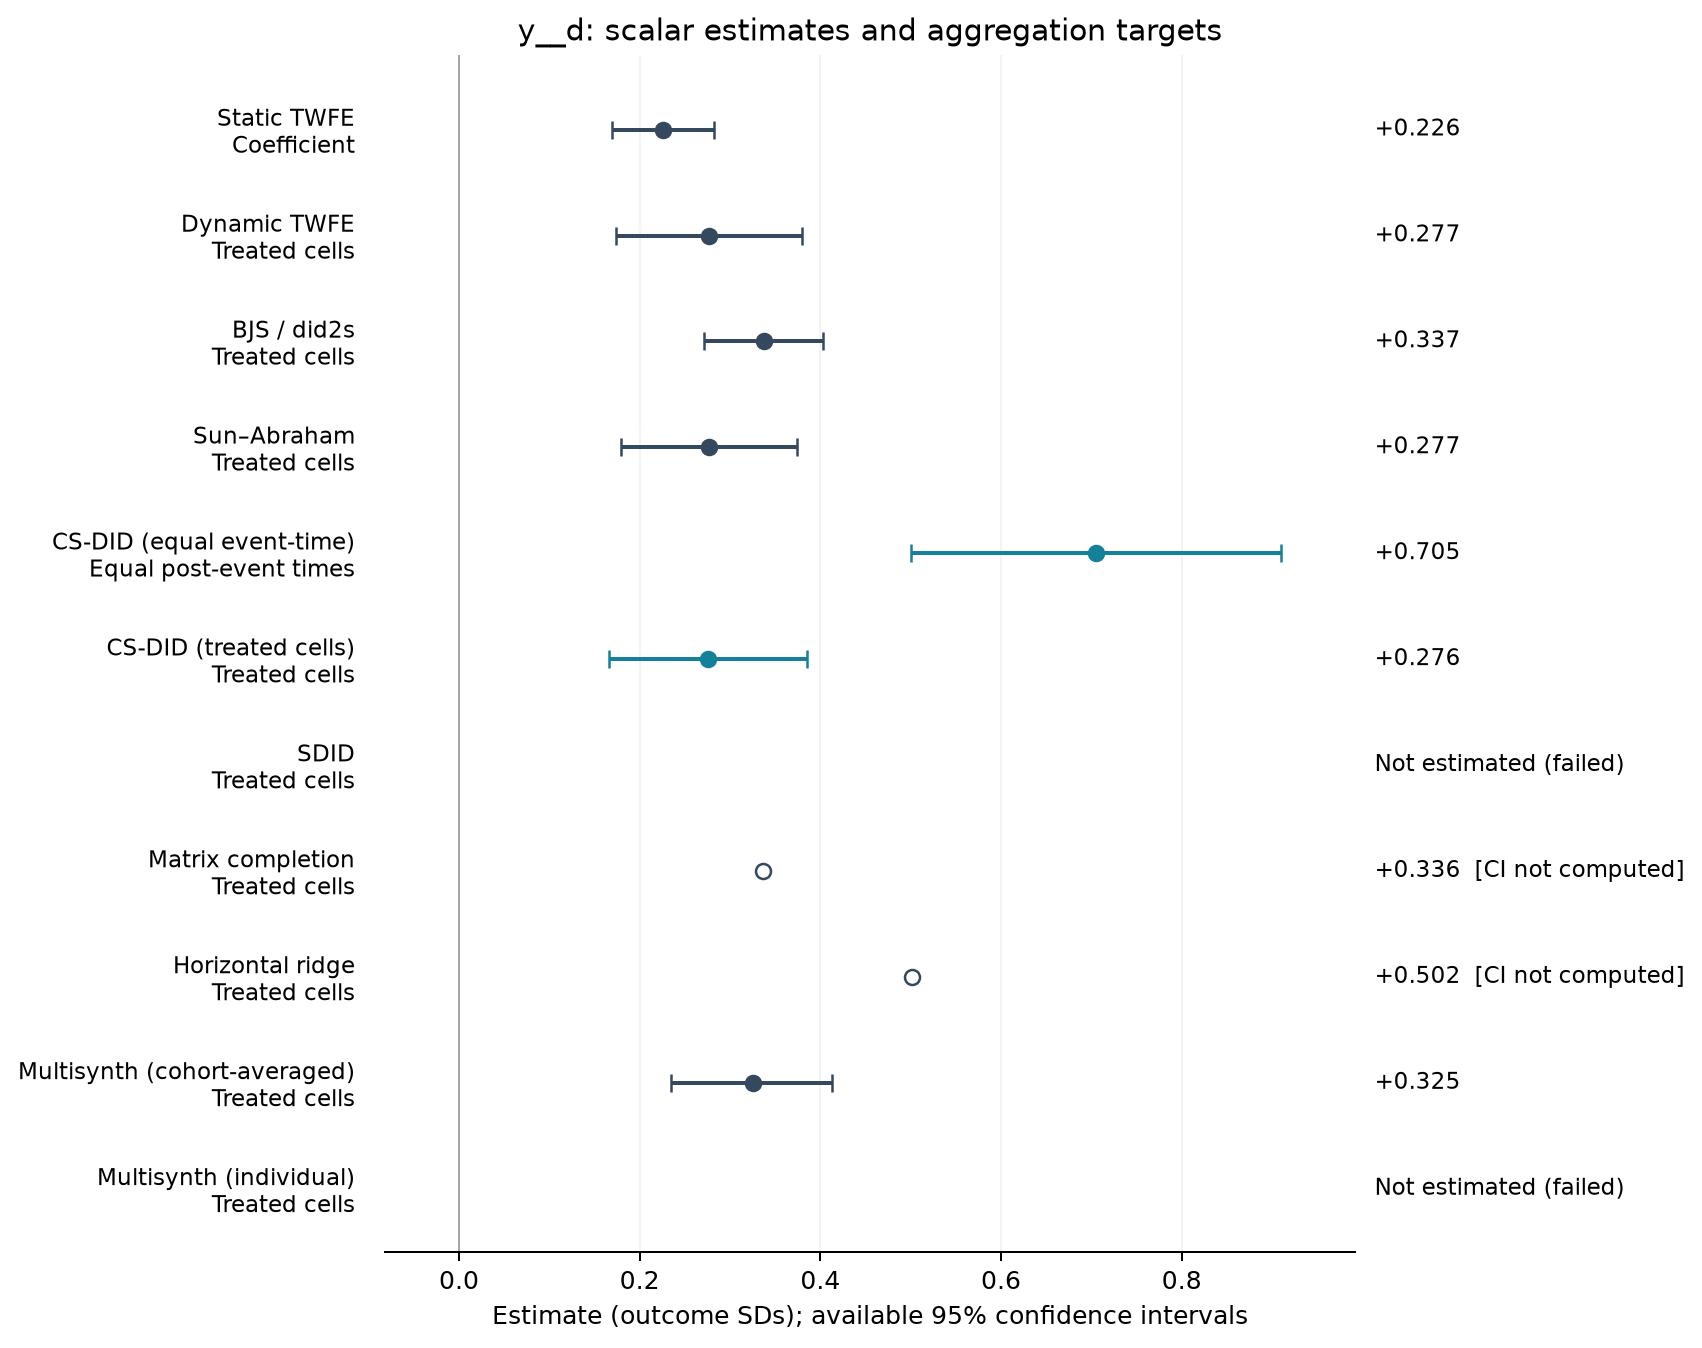
| Static TWFE | 0.226 | 0.029 | [0.170, 0.283] | Coefficient |
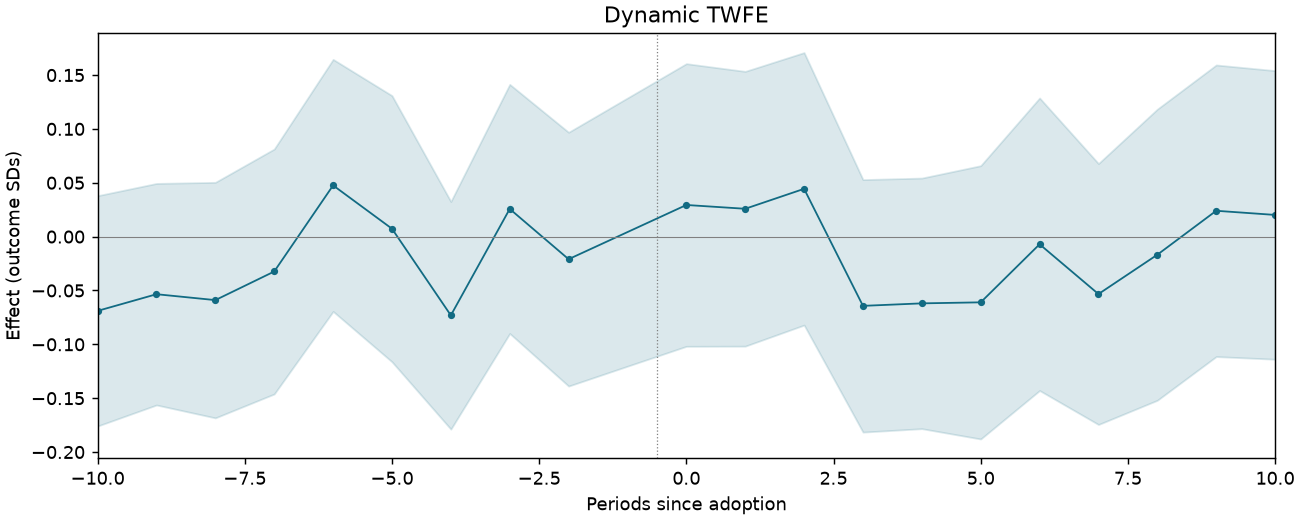
| Dynamic TWFE | 0.277 | 0.052 | [0.174, 0.379] | Treated cells |
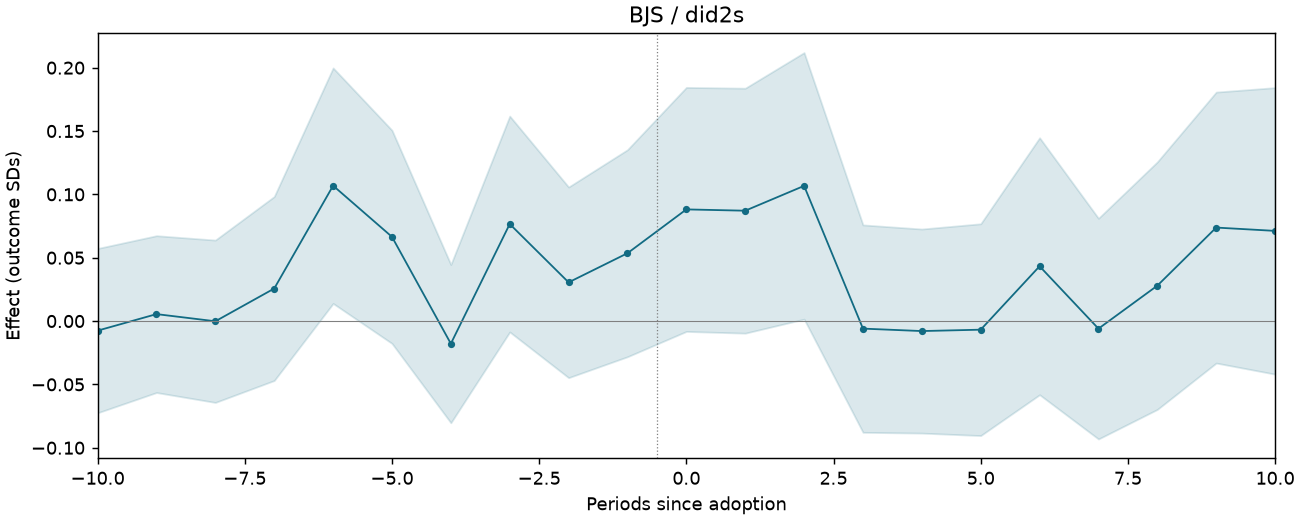
| BJS / did2s | 0.337 | 0.034 | [0.271, 0.403] | Treated cells |
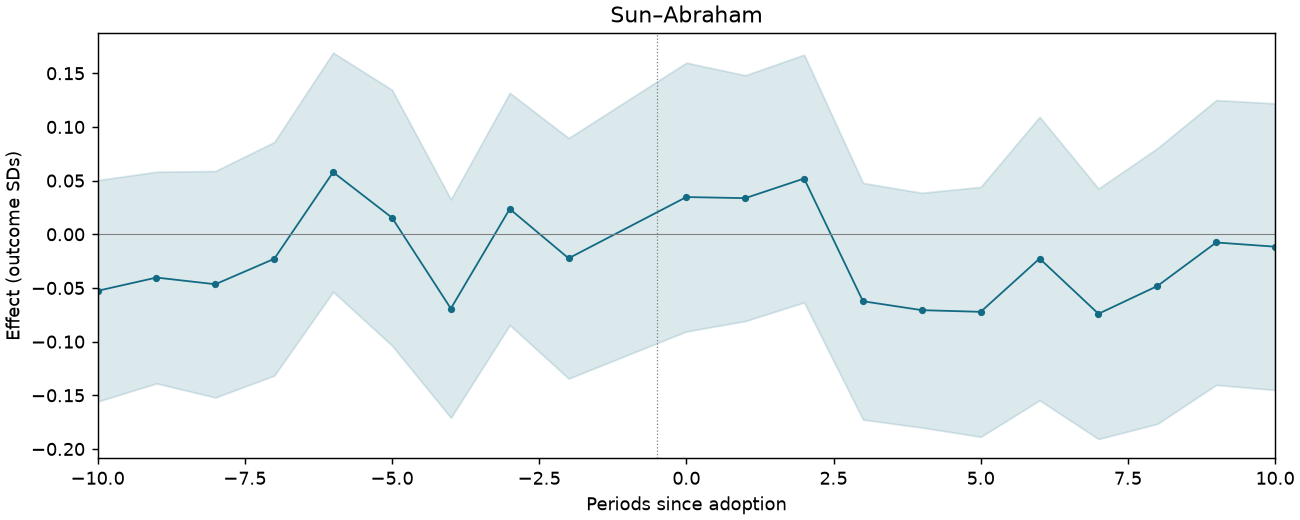
| Sun–Abraham | 0.277 | 0.049 | [0.180, 0.374] | Treated cells |
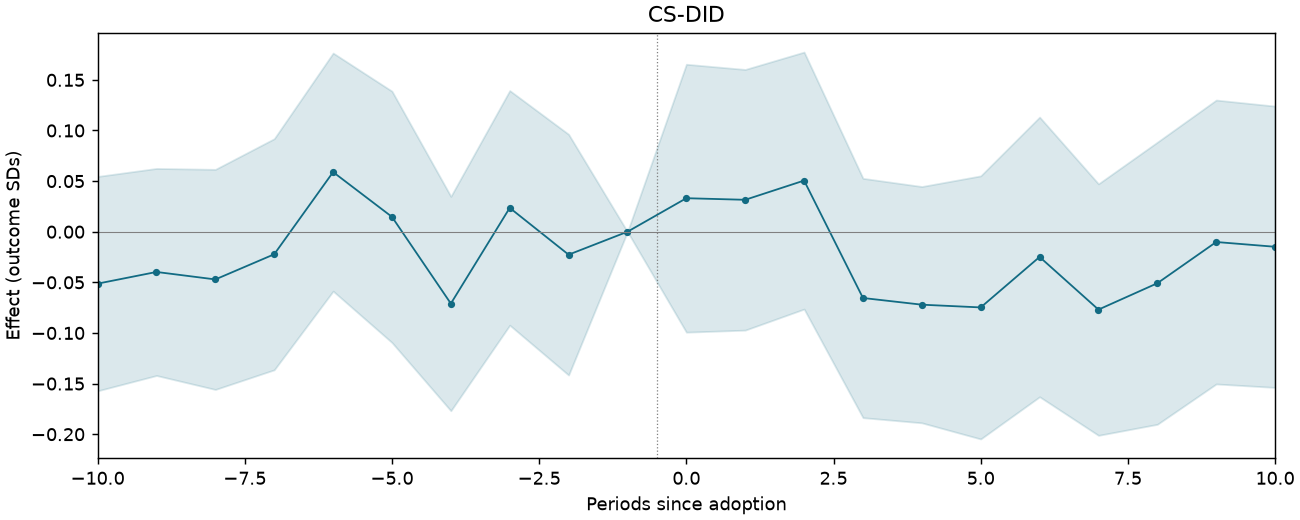
| CS-DID (equal event-time) | 0.705 | 0.105 | [0.500, 0.910] | Equal post-event times |
| CS-DID (treated cells) | 0.276 | 0.056 | [0.166, 0.385] | Treated cells |
| Matrix completion | 0.336 | — | — | Treated cells |
| Horizontal ridge | 0.502 | — | — | Treated cells |
| Multisynth (cohort-averaged) | 0.325 | 0.045 | [0.235, 0.413] | Treated cells |
Event studies
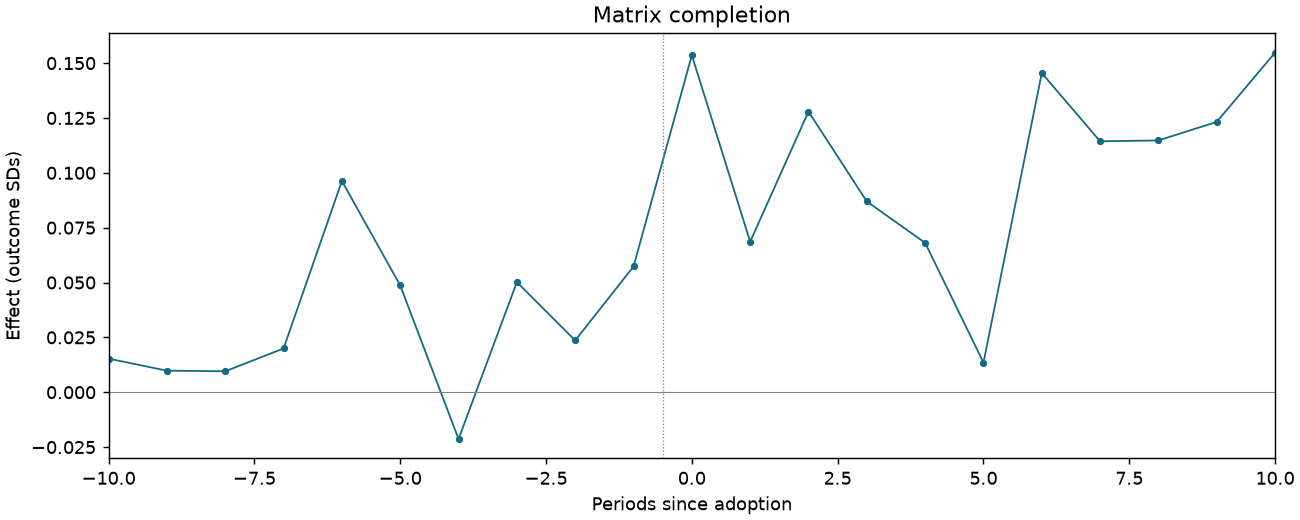
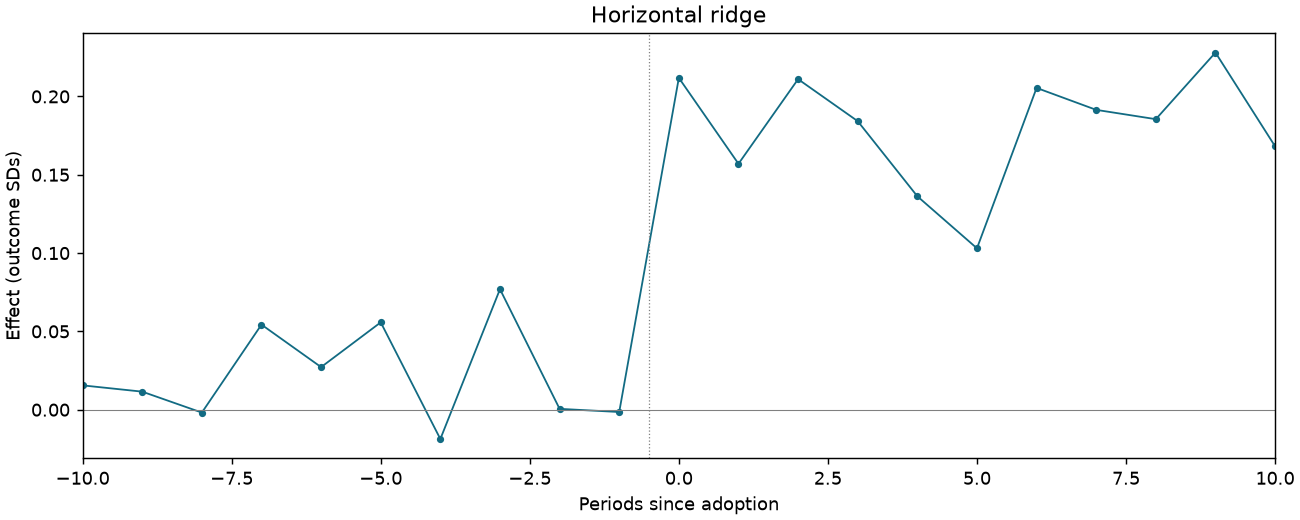
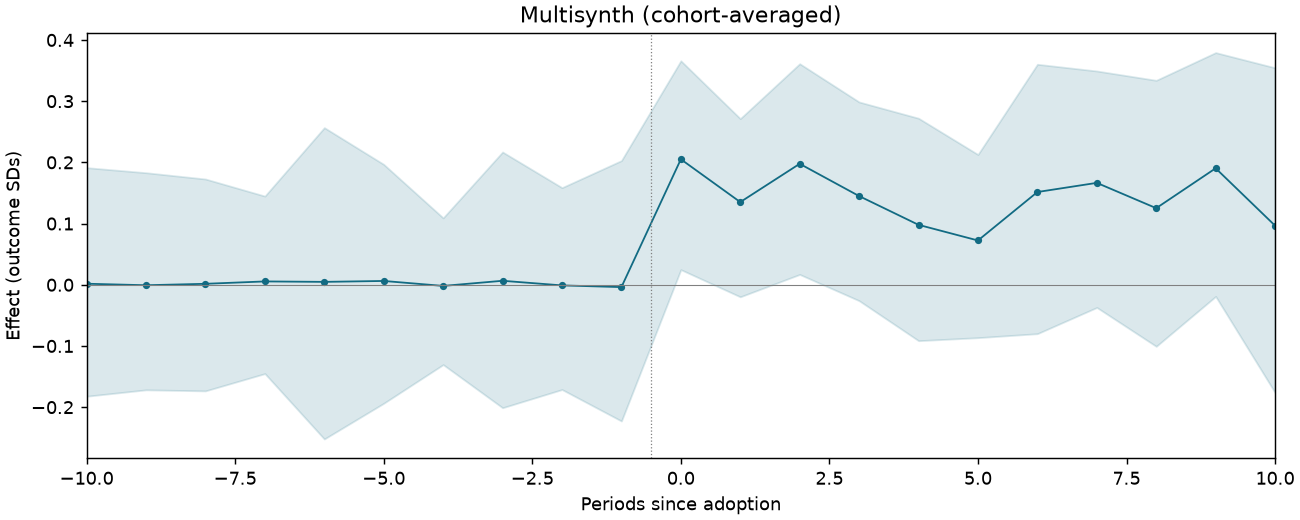
Periods −10 to +10; pointwise 95% intervals where available.
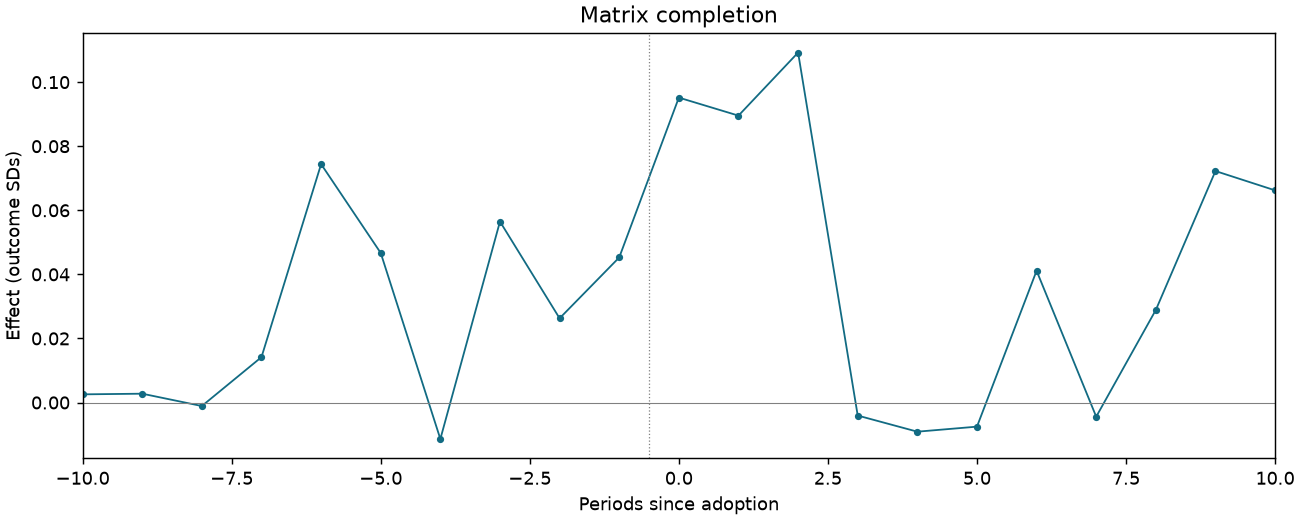
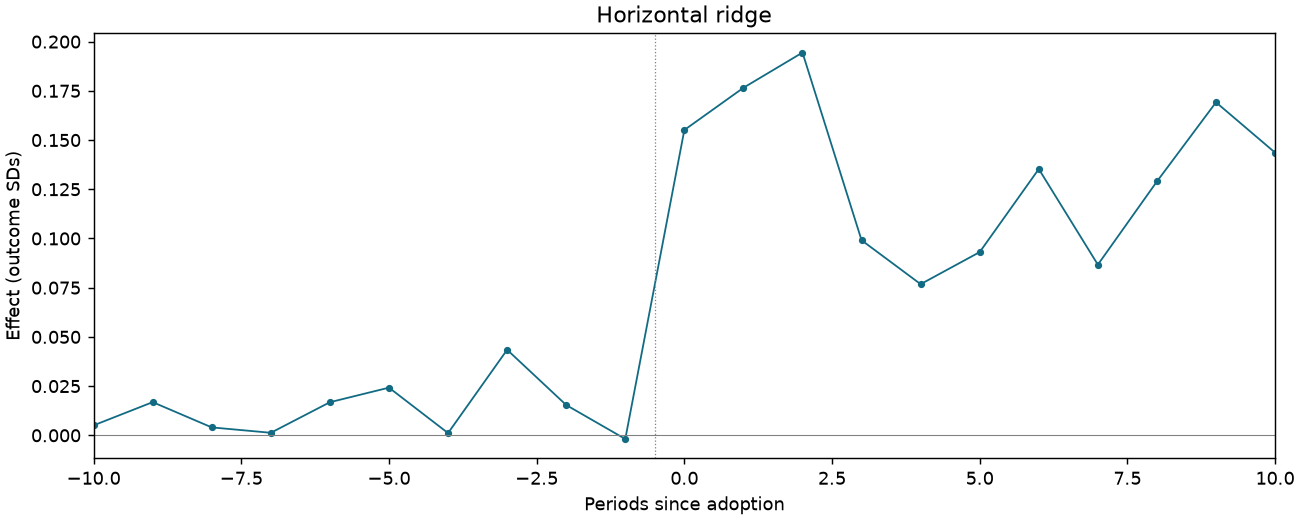
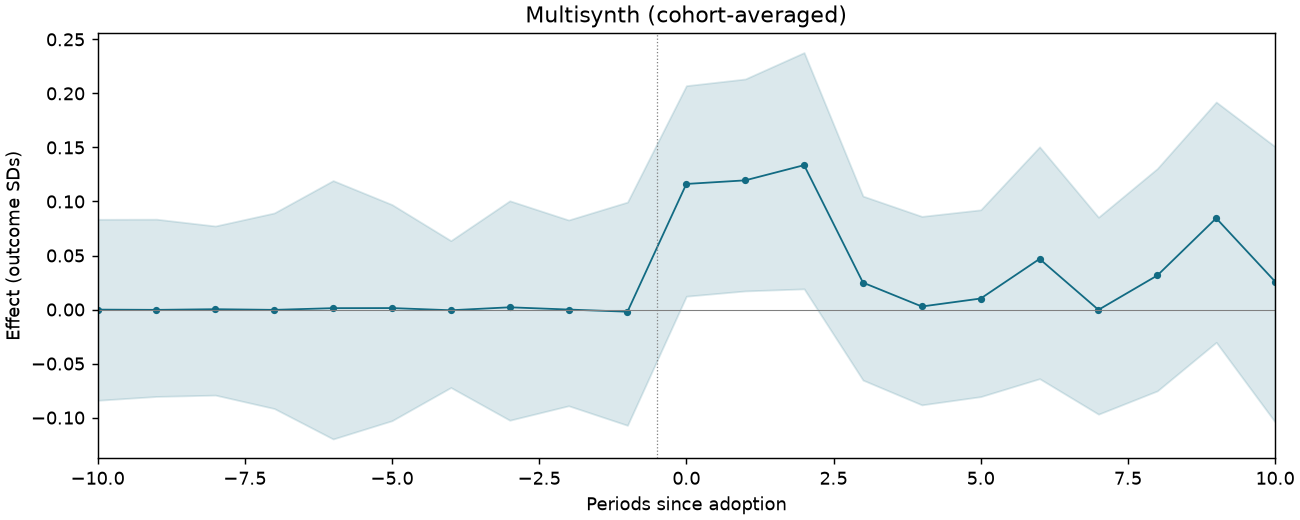
BON-T4-PA-C4
47,226 observations · 926 units · 926 clusters · 366 treated / 560 control units.
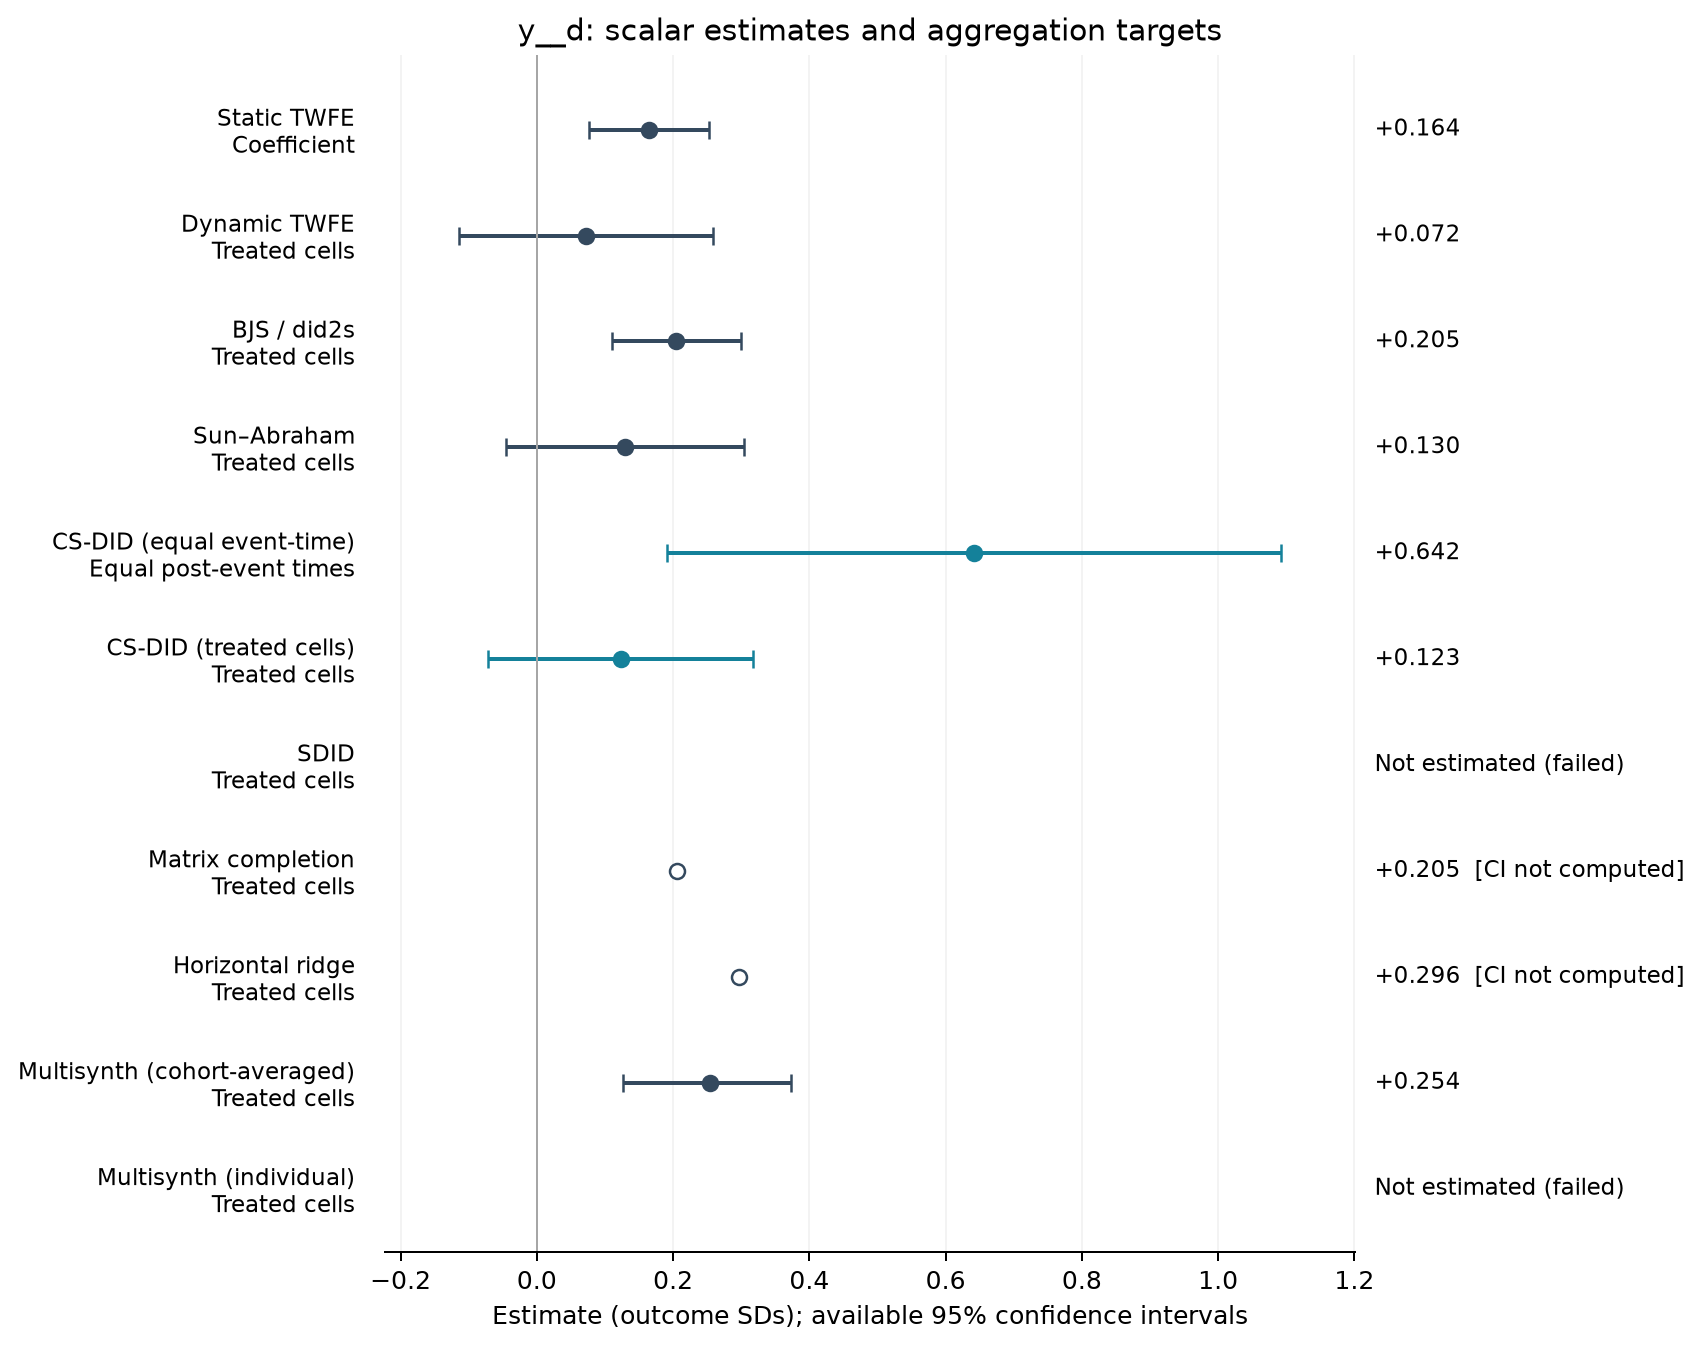
Estimate comparison
| Estimator | Estimate (SDs) | SE | 95% CI | Averaging |
|---|---|---|---|---|
| Static TWFE | 0.164 | 0.045 | [0.076, 0.252] | Coefficient |
| Dynamic TWFE | 0.072 | 0.095 | [-0.114, 0.259] | Treated cells |
| BJS / did2s | 0.205 | 0.048 | [0.110, 0.299] | Treated cells |
| Sun–Abraham | 0.130 | 0.089 | [-0.045, 0.304] | Treated cells |
| CS-DID (equal event-time) | 0.642 | 0.230 | [0.191, 1.093] | Equal post-event times |
| CS-DID (treated cells) | 0.123 | 0.099 | [-0.071, 0.317] | Treated cells |
| Matrix completion | 0.205 | — | — | Treated cells |
| Horizontal ridge | 0.296 | — | — | Treated cells |
| Multisynth (cohort-averaged) | 0.254 | 0.064 | [0.127, 0.374] | Treated cells |
Event studies
Periods −10 to +10; pointwise 95% intervals where available.
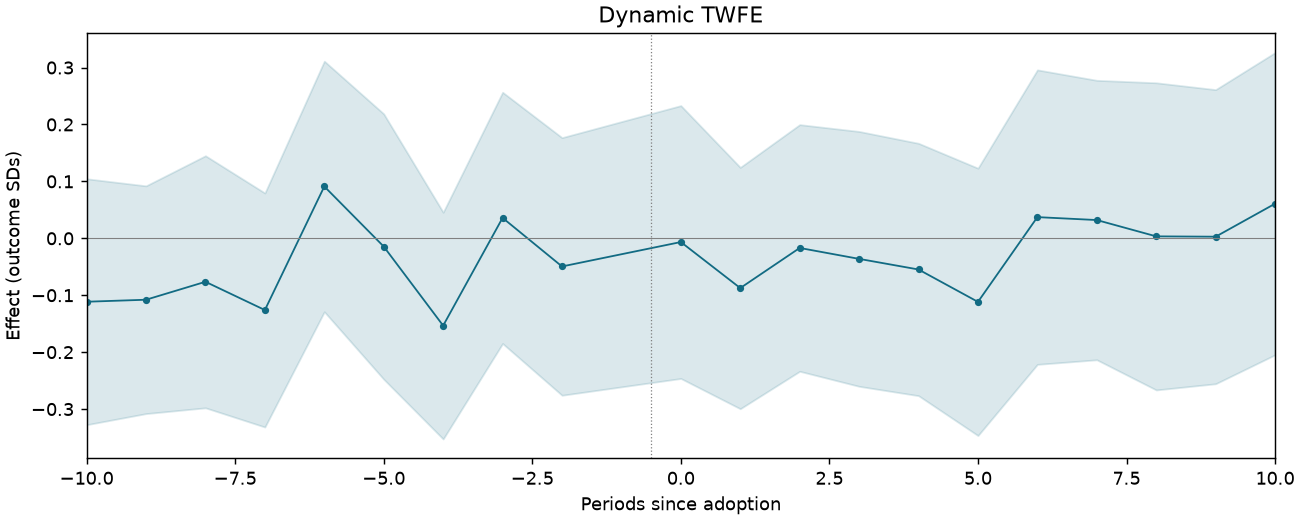
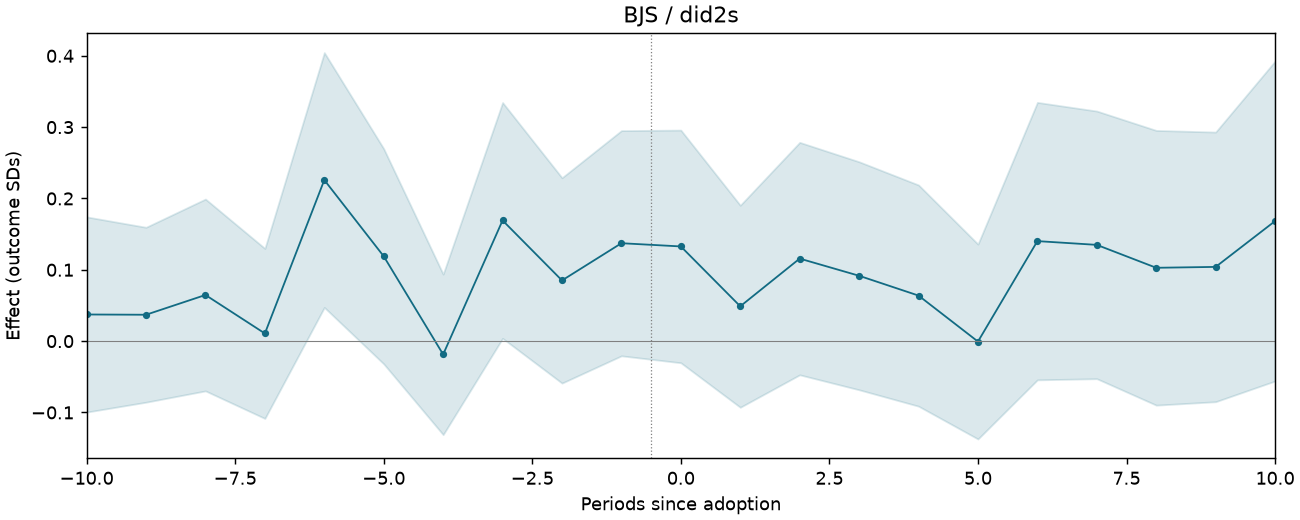
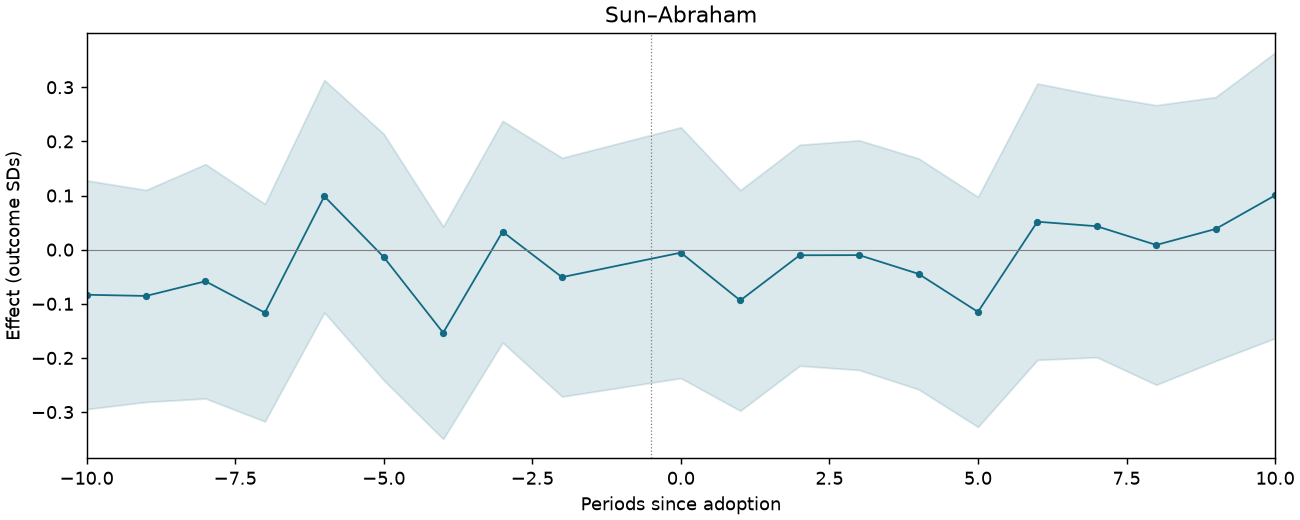
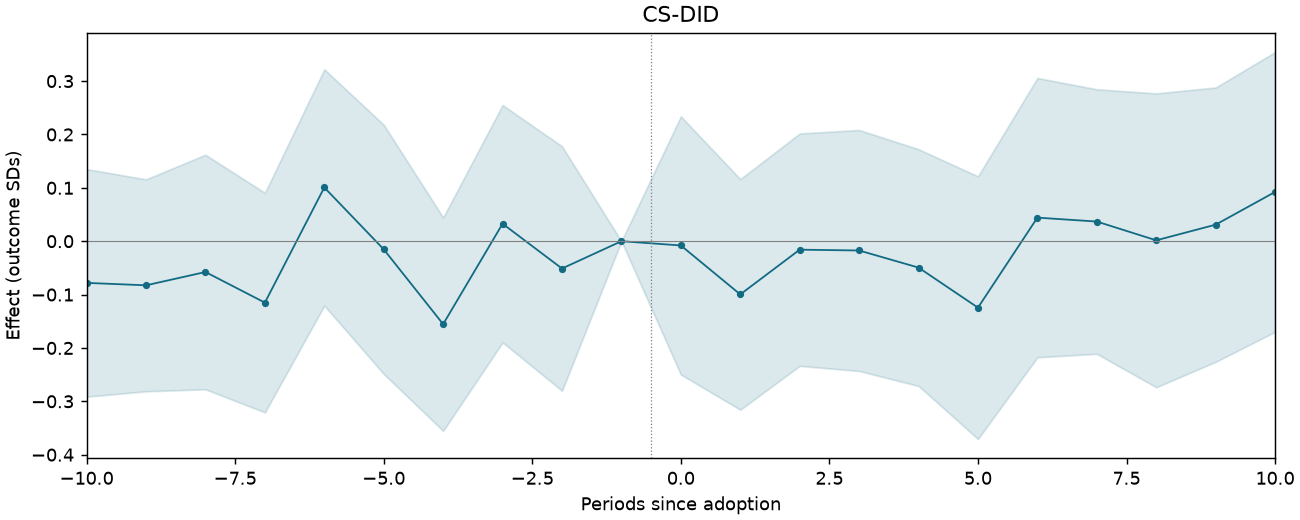
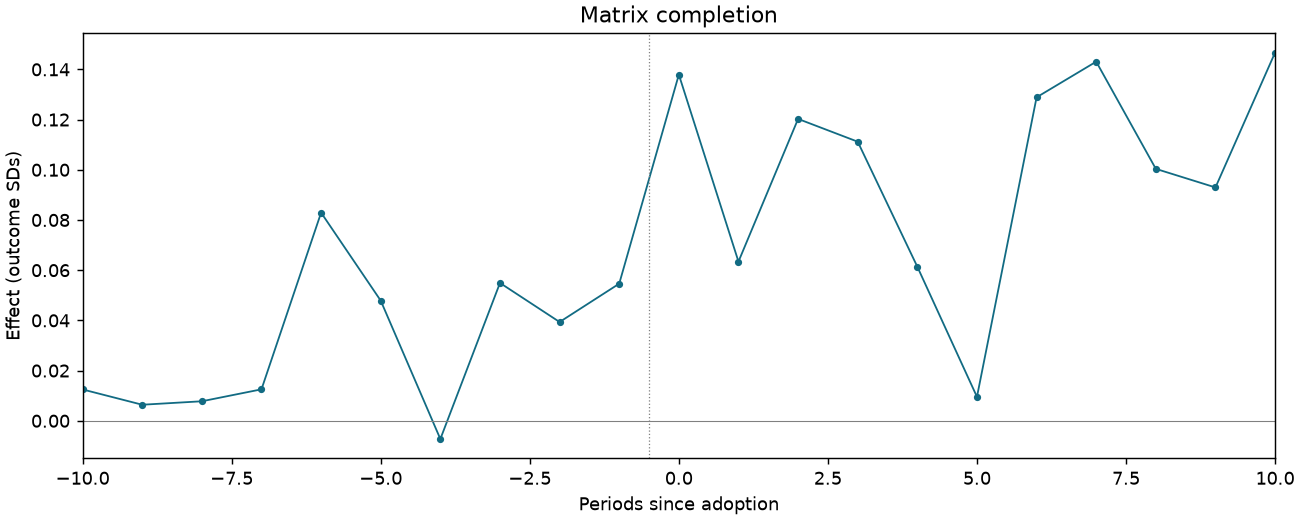
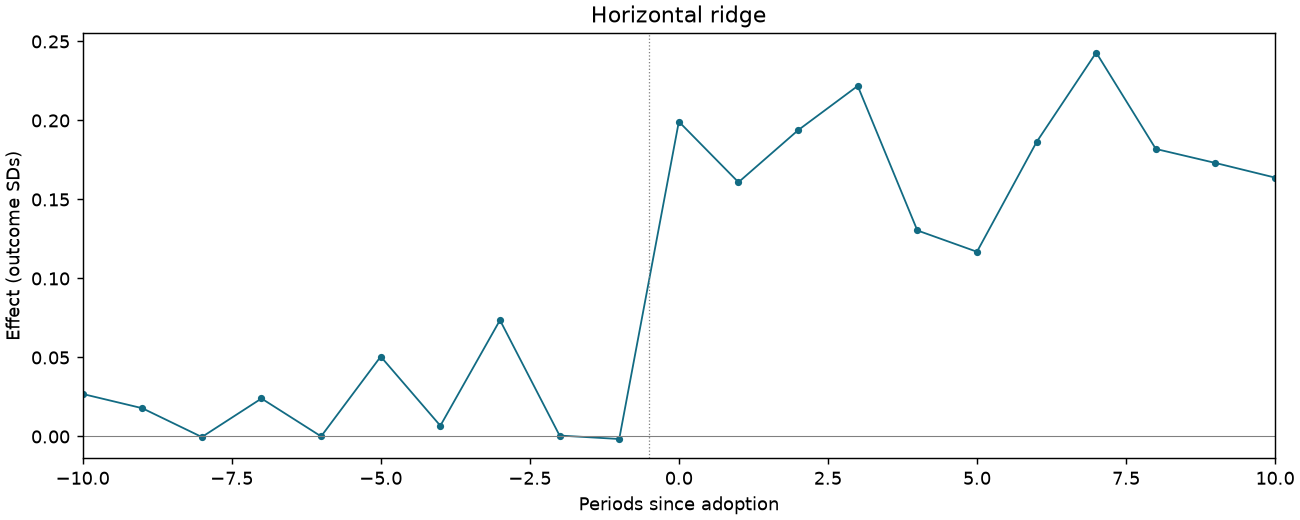
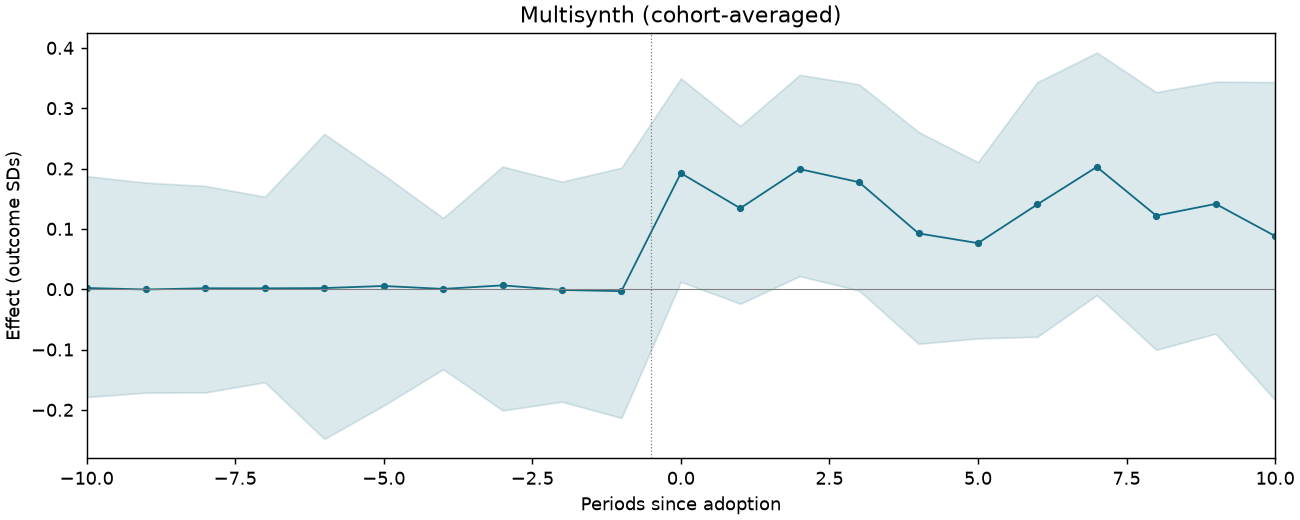
BON-T4-PB-C1
62,764 observations · 923 units · 923 clusters · 429 treated / 494 control units.
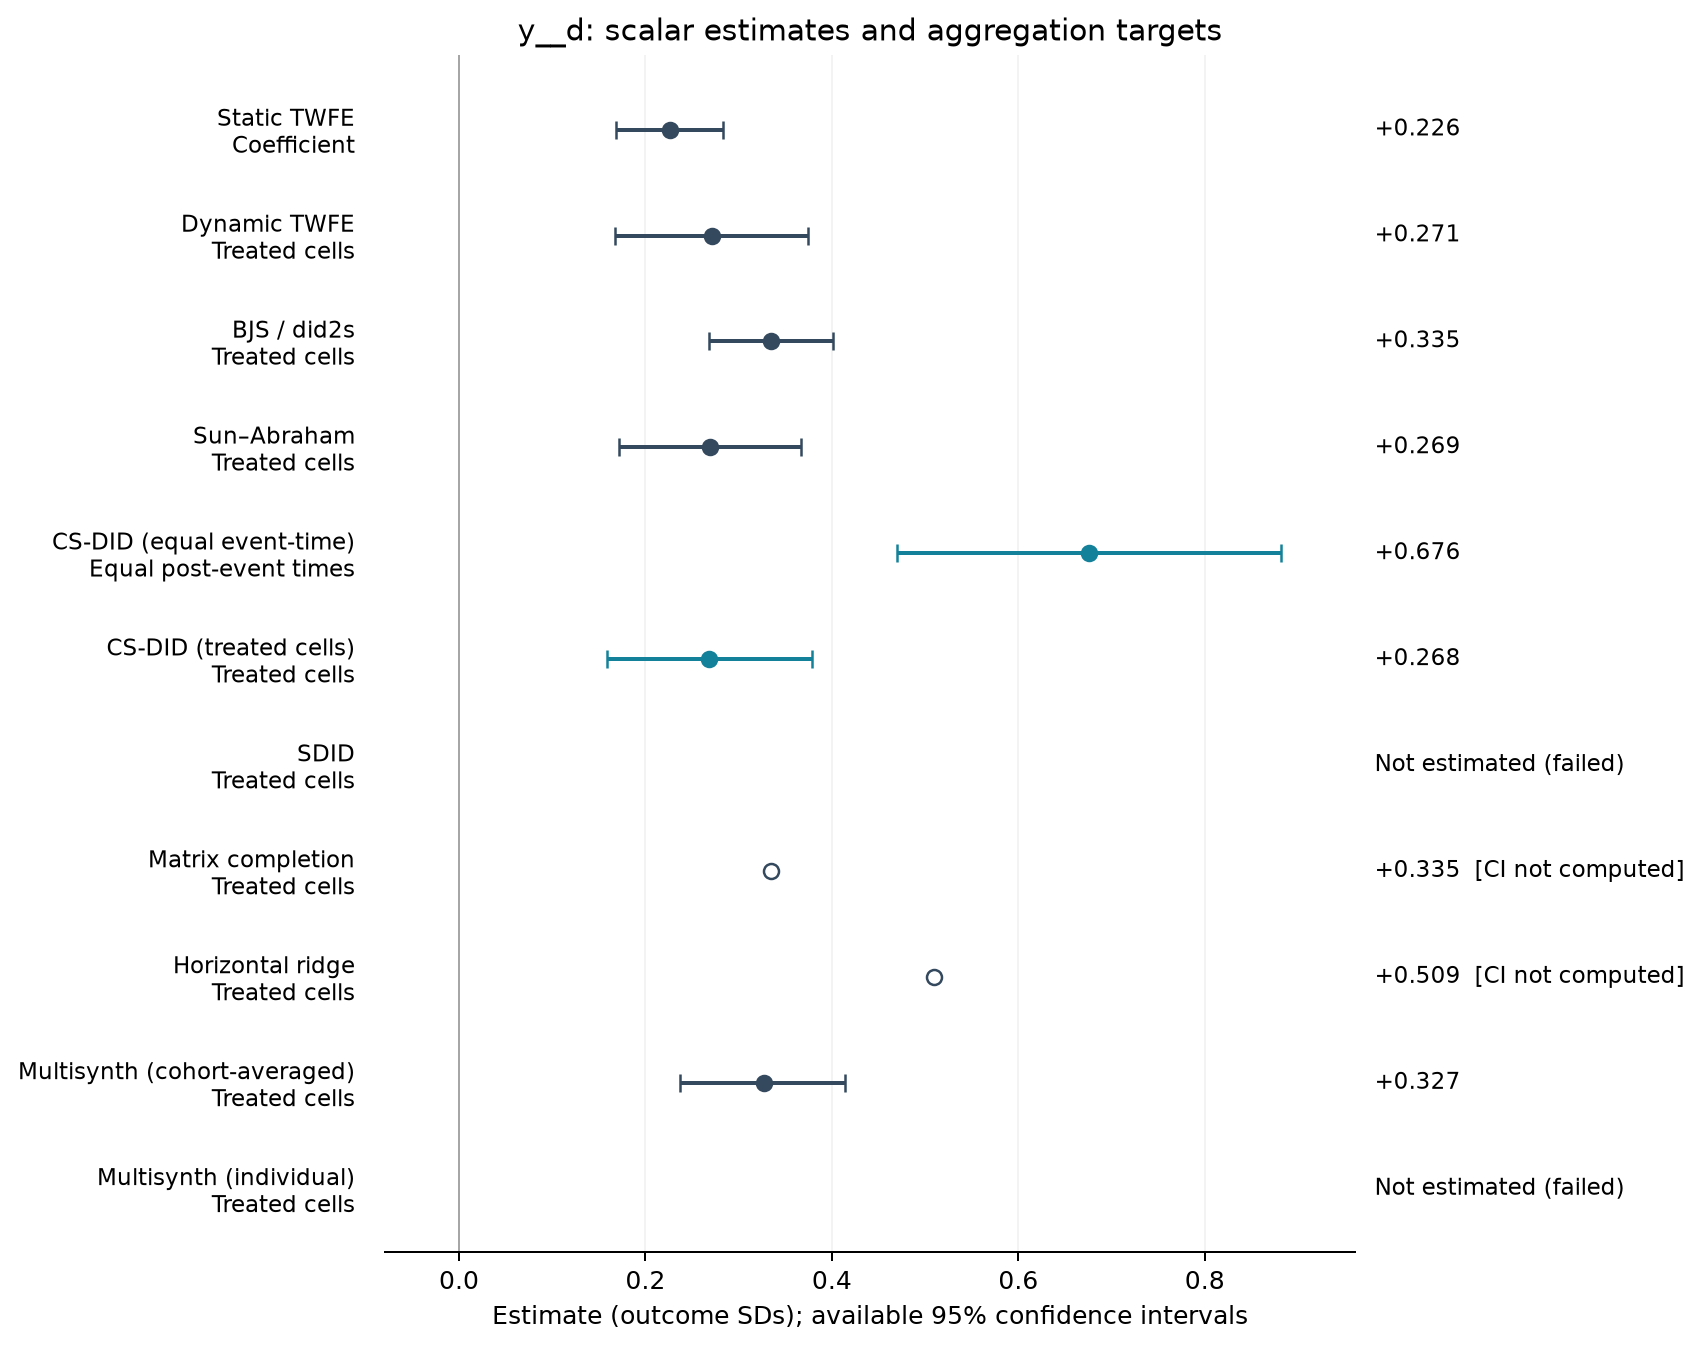
Estimate comparison
| Estimator | Estimate (SDs) | SE | 95% CI | Averaging |
|---|---|---|---|---|
| Static TWFE | 0.226 | 0.029 | [0.169, 0.283] | Coefficient |
| Dynamic TWFE | 0.271 | 0.053 | [0.167, 0.375] | Treated cells |
| BJS / did2s | 0.335 | 0.034 | [0.268, 0.402] | Treated cells |
| Sun–Abraham | 0.269 | 0.050 | [0.171, 0.367] | Treated cells |
| CS-DID (equal event-time) | 0.676 | 0.105 | [0.470, 0.882] | Equal post-event times |
| CS-DID (treated cells) | 0.268 | 0.056 | [0.158, 0.378] | Treated cells |
| Matrix completion | 0.335 | — | — | Treated cells |
| Horizontal ridge | 0.509 | — | — | Treated cells |
| Multisynth (cohort-averaged) | 0.327 | 0.046 | [0.237, 0.414] | Treated cells |
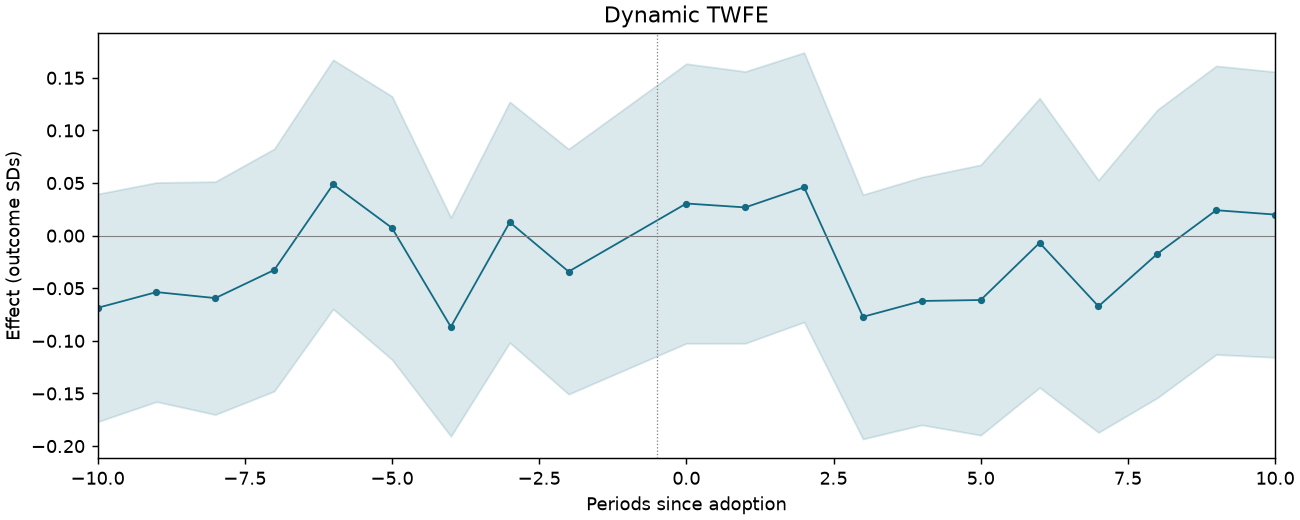
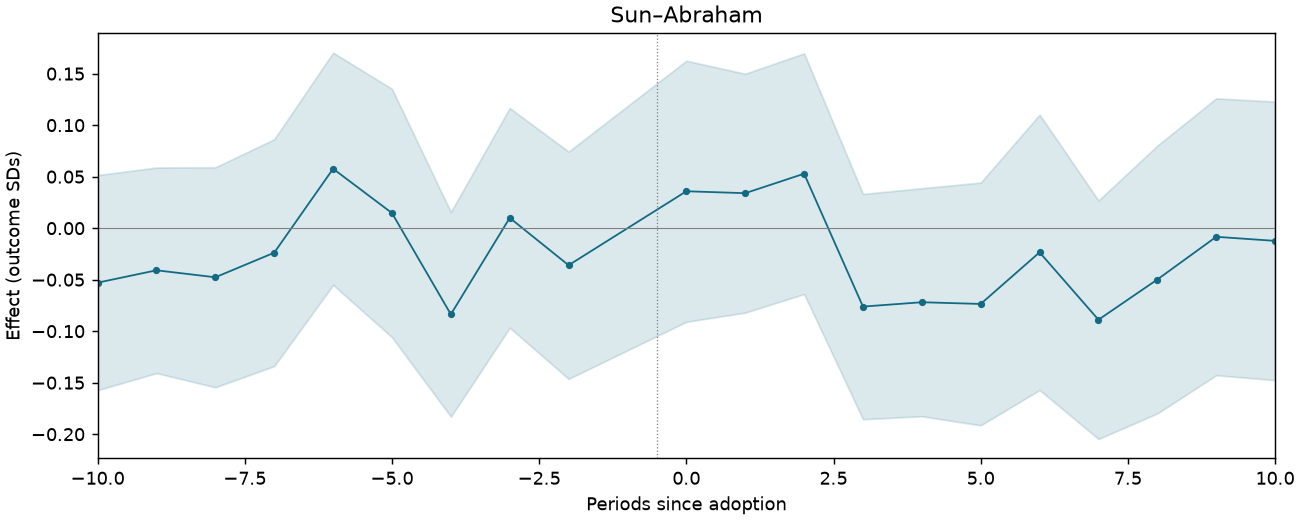
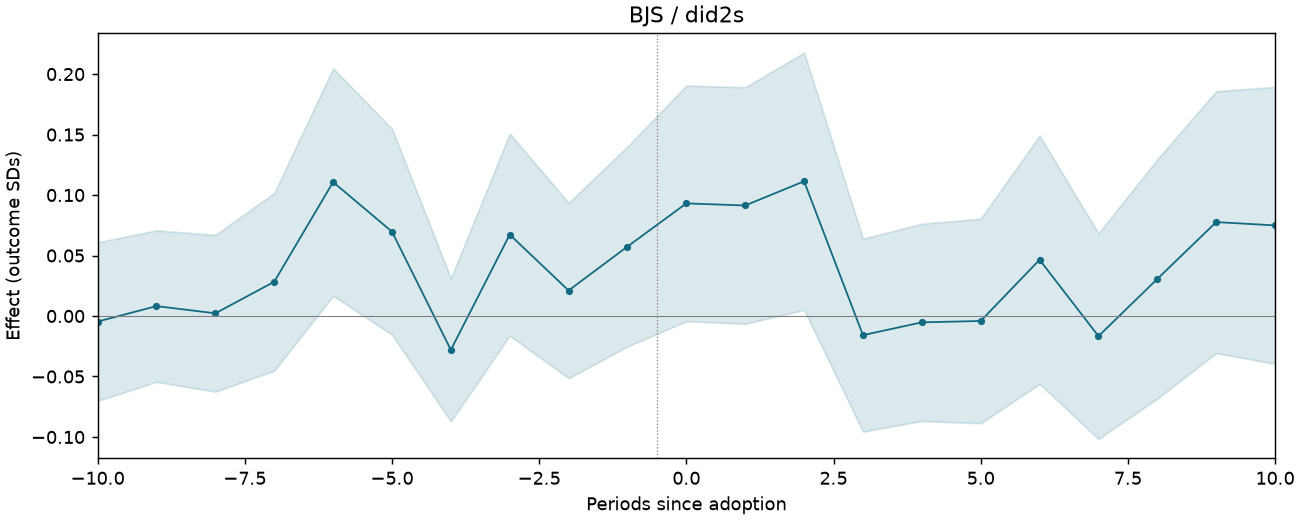
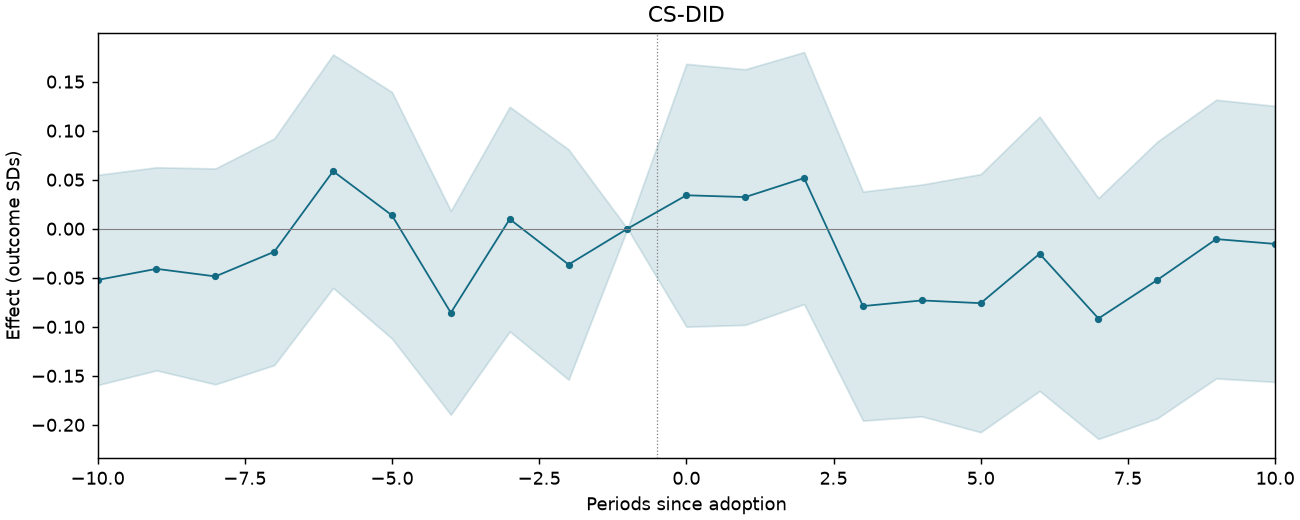
Event studies
Periods −10 to +10; pointwise 95% intervals where available.
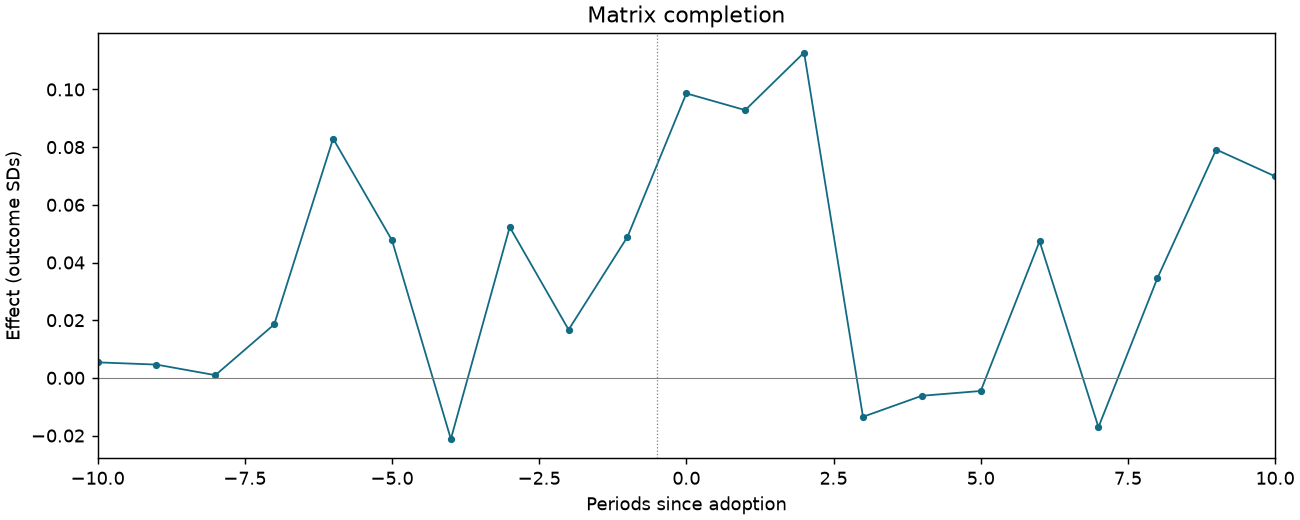
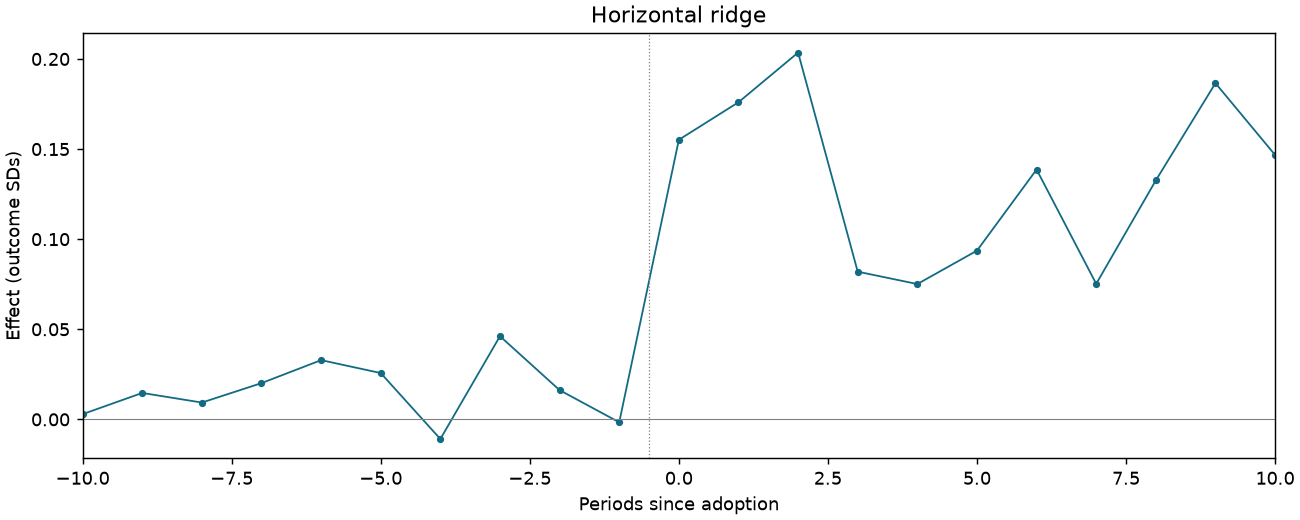
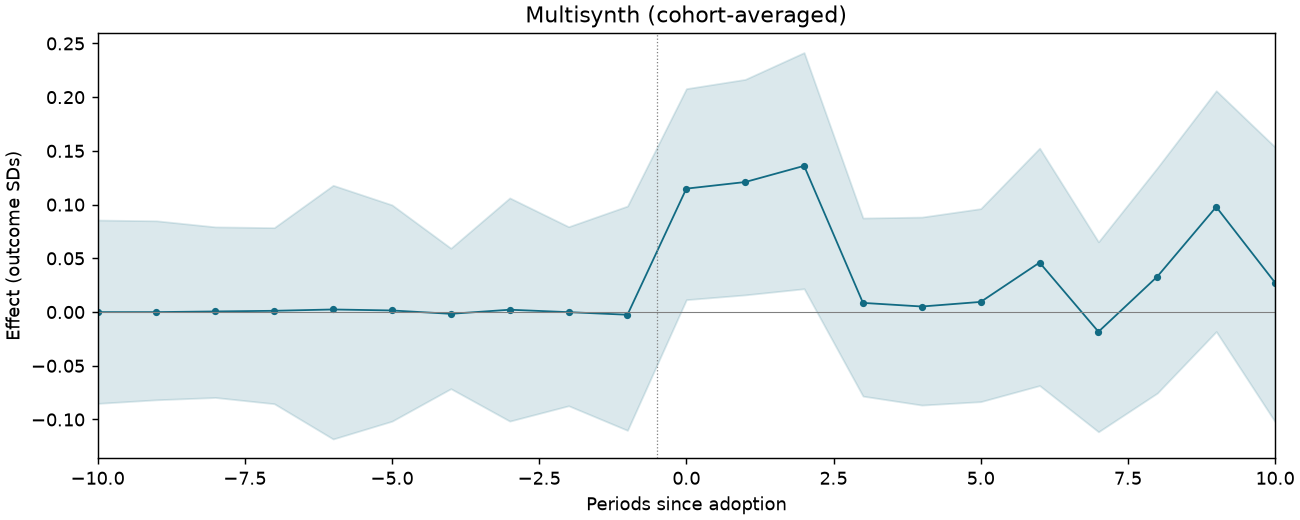
BON-T4-PB-C4
47,073 observations · 923 units · 923 clusters · 364 treated / 559 control units.
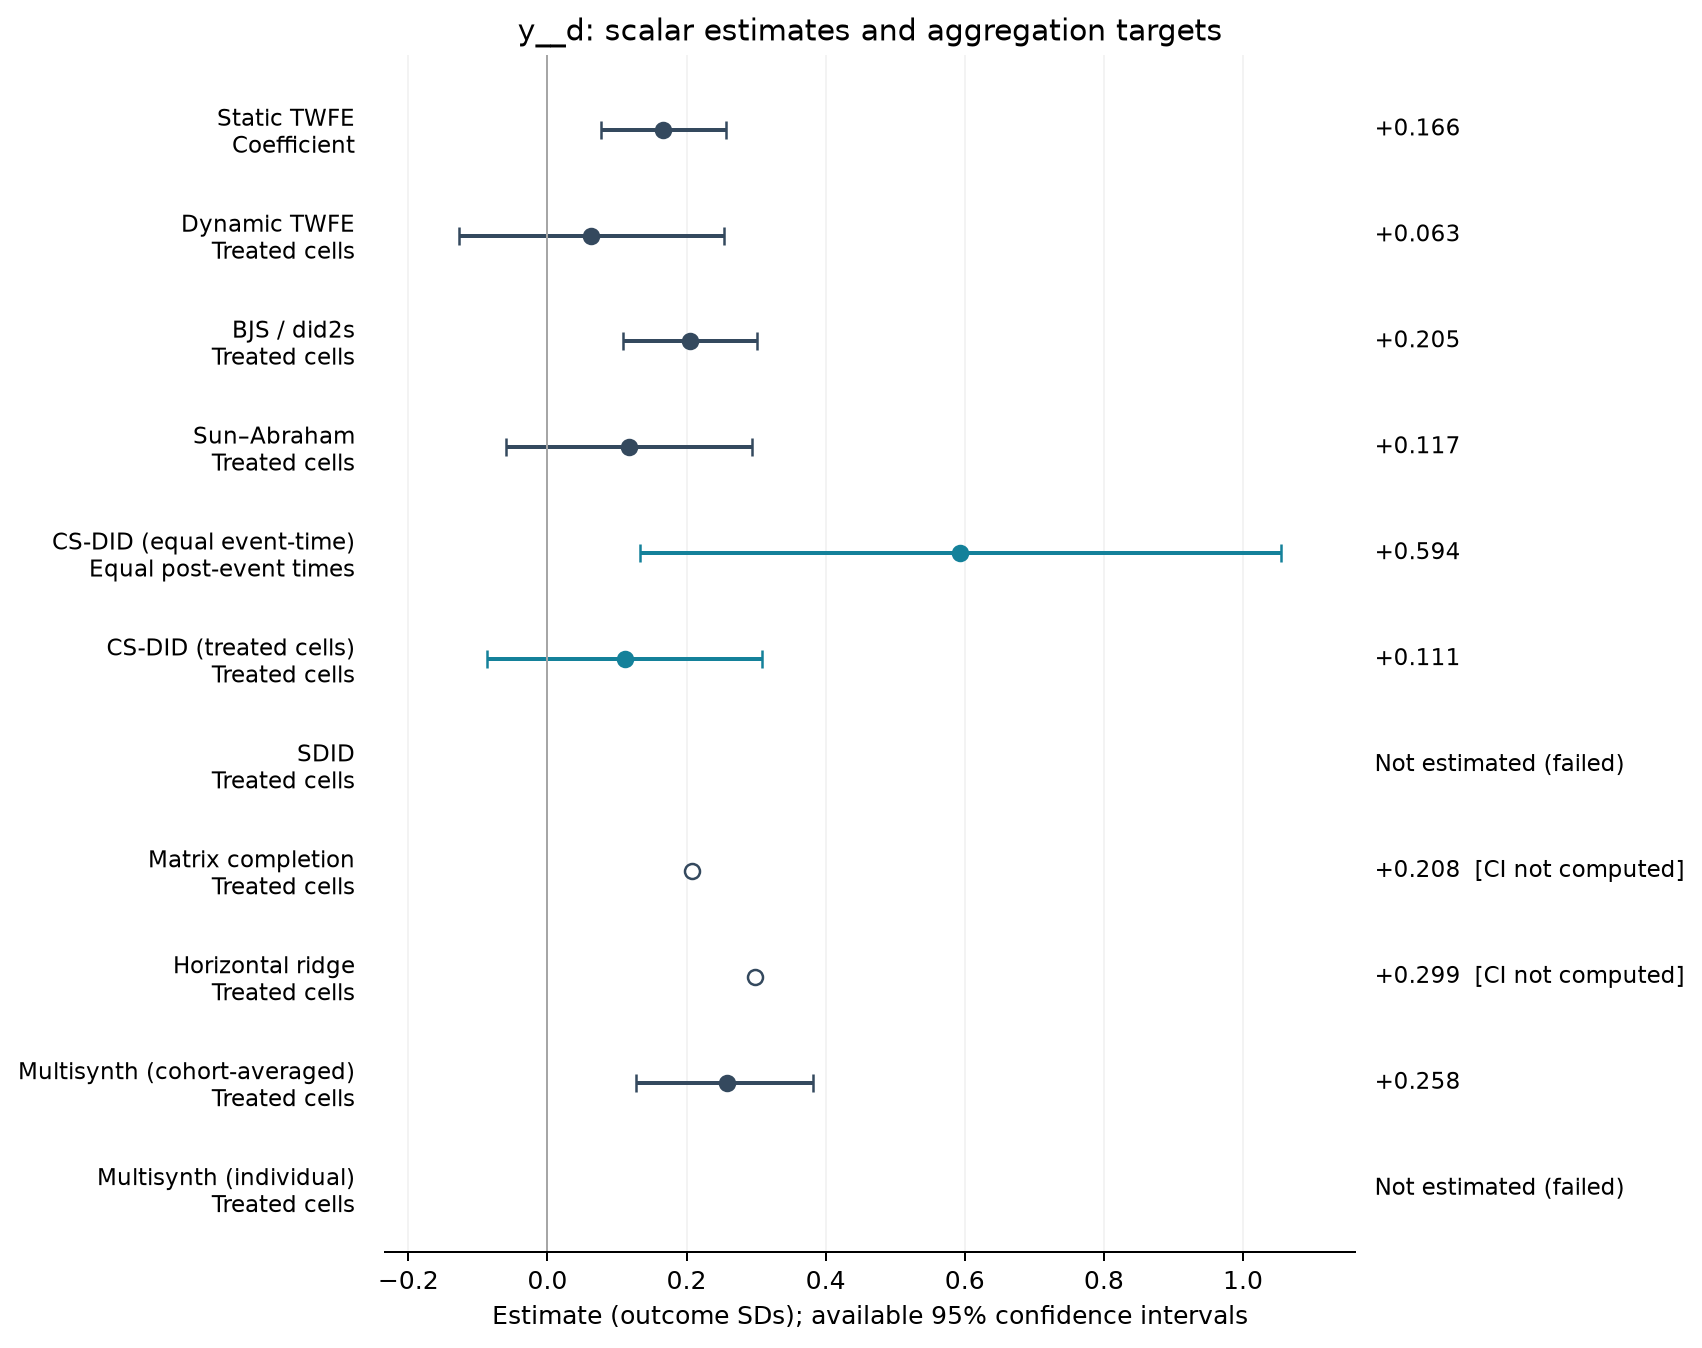
Estimate comparison
| Estimator | Estimate (SDs) | SE | 95% CI | Averaging |
|---|---|---|---|---|
| Static TWFE | 0.166 | 0.046 | [0.076, 0.256] | Coefficient |
| Dynamic TWFE | 0.063 | 0.097 | [-0.127, 0.254] | Treated cells |
| BJS / did2s | 0.205 | 0.049 | [0.108, 0.302] | Treated cells |
| Sun–Abraham | 0.117 | 0.090 | [-0.060, 0.295] | Treated cells |
| CS-DID (equal event-time) | 0.594 | 0.235 | [0.133, 1.055] | Equal post-event times |
| CS-DID (treated cells) | 0.111 | 0.101 | [-0.087, 0.309] | Treated cells |
| Matrix completion | 0.208 | — | — | Treated cells |
| Horizontal ridge | 0.299 | — | — | Treated cells |
| Multisynth (cohort-averaged) | 0.258 | 0.064 | [0.127, 0.381] | Treated cells |
Event studies
Periods −10 to +10; pointwise 95% intervals where available.