Ideology and Performance in Public Organizations — expanded estimators
Archive index · Regression tests · Results & settings (JSON) · Methods & code
Spenkuch et al. (2023), ECMA
3 specifications. Effects are in outcome standard deviations; intervals are 95%.
Treatment adoption

S13-P003: seeded sample of 100 of 2,909 eligible units. Purple untreated; yellow treated; white unobserved.
IPPO-T3-C1-LOGPAY
27,087,260 observations · 998,045 units · 998,045 clusters · 379,004 treated / 619,041 control units.
Estimate comparison
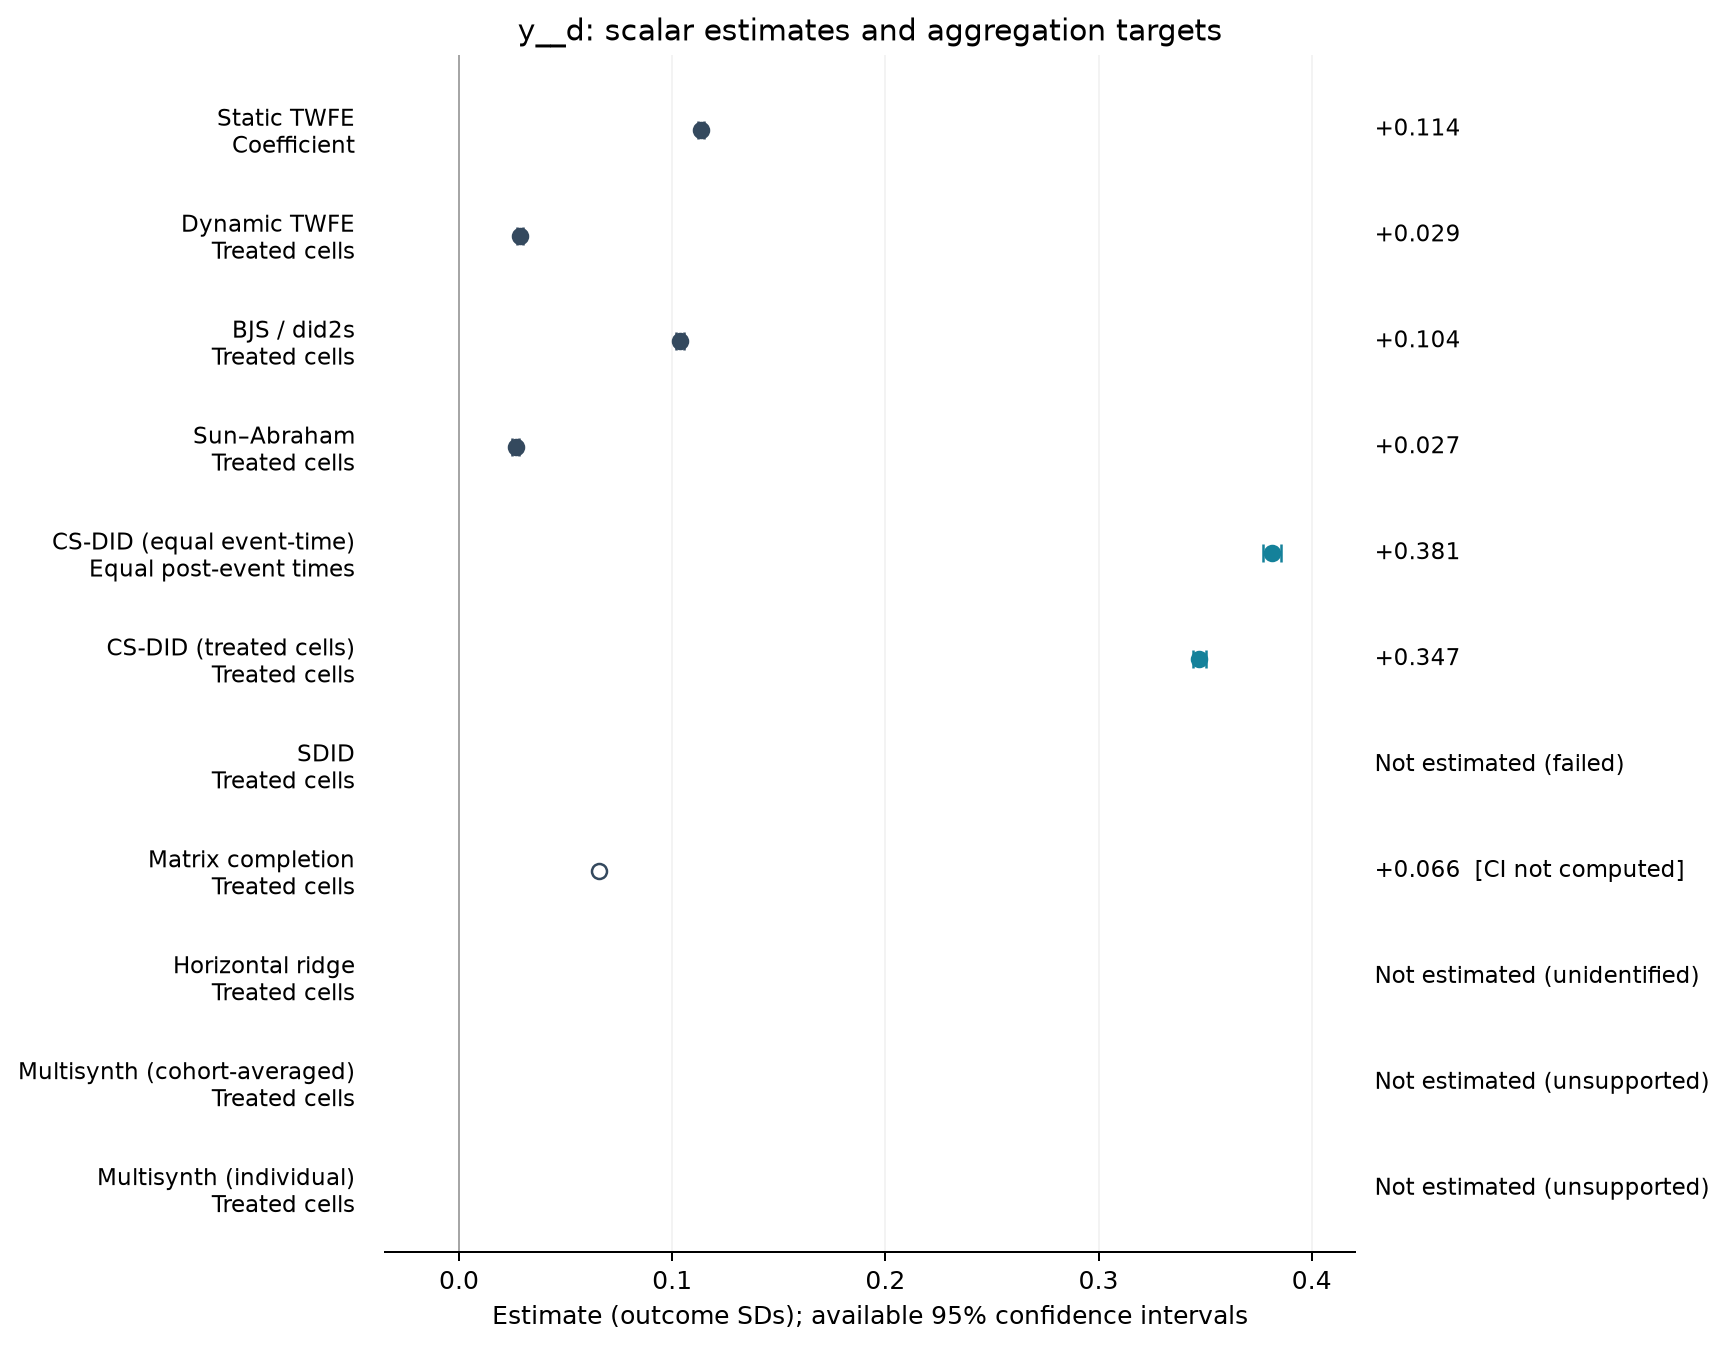
| Estimator | Estimate (SDs) | SE | 95% CI | Averaging |
|---|---|---|---|---|
| Static TWFE | 0.114 | 0.001 | [0.112, 0.115] | Coefficient |
| Dynamic TWFE | 0.029 | 0.001 | [0.027, 0.030] | Treated cells |
| BJS / did2s | 0.104 | 0.001 | [0.102, 0.105] | Treated cells |
| Sun–Abraham | 0.027 | 0.001 | [0.025, 0.028] | Treated cells |
| CS-DID (equal event-time) | 0.381 | 0.002 | [0.377, 0.386] | Equal post-event times |
| CS-DID (treated cells) | 0.347 | 0.002 | [0.344, 0.351] | Treated cells |
| Matrix completion | 0.066 | — | — | Treated cells |
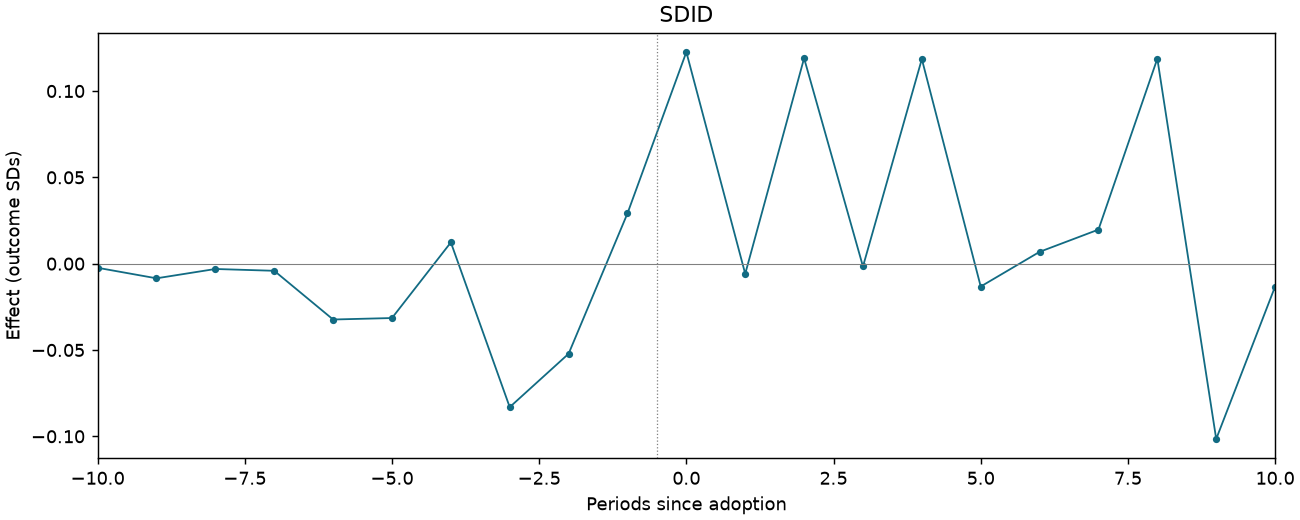
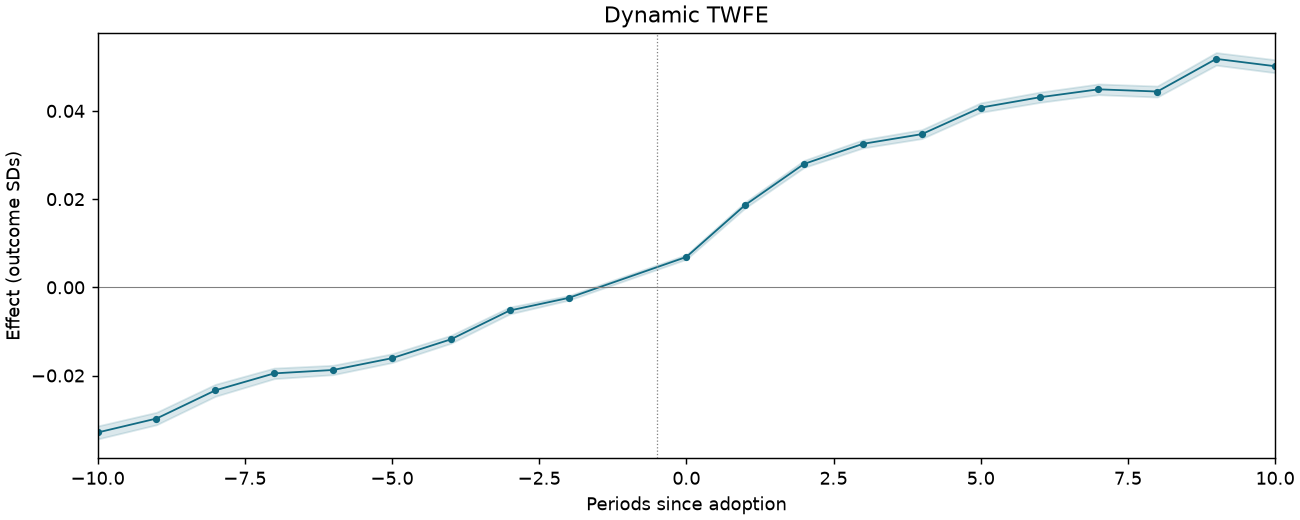
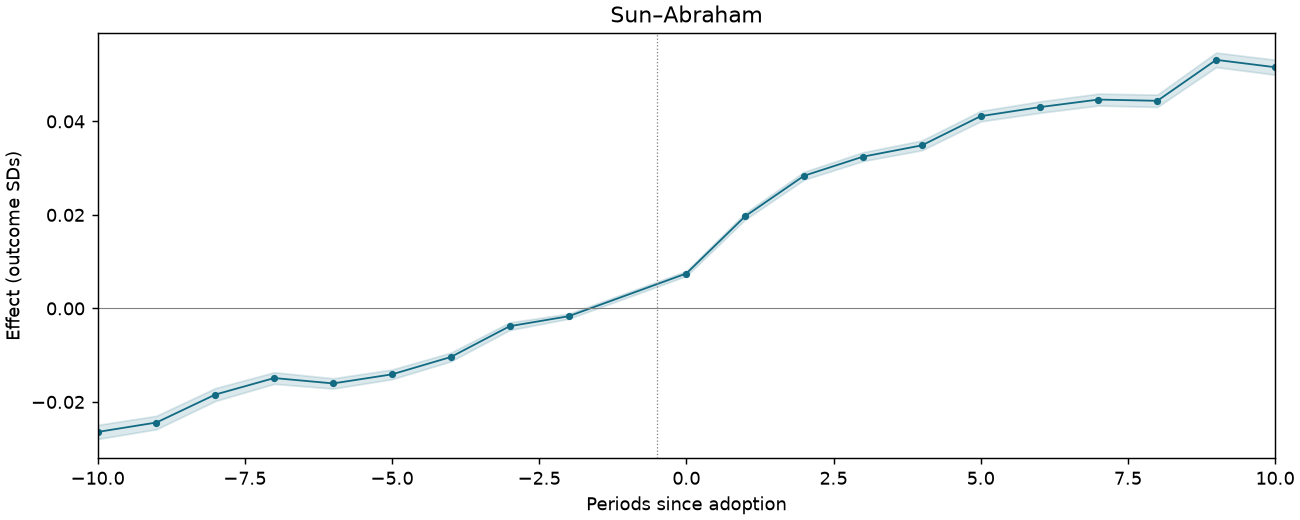
Event studies
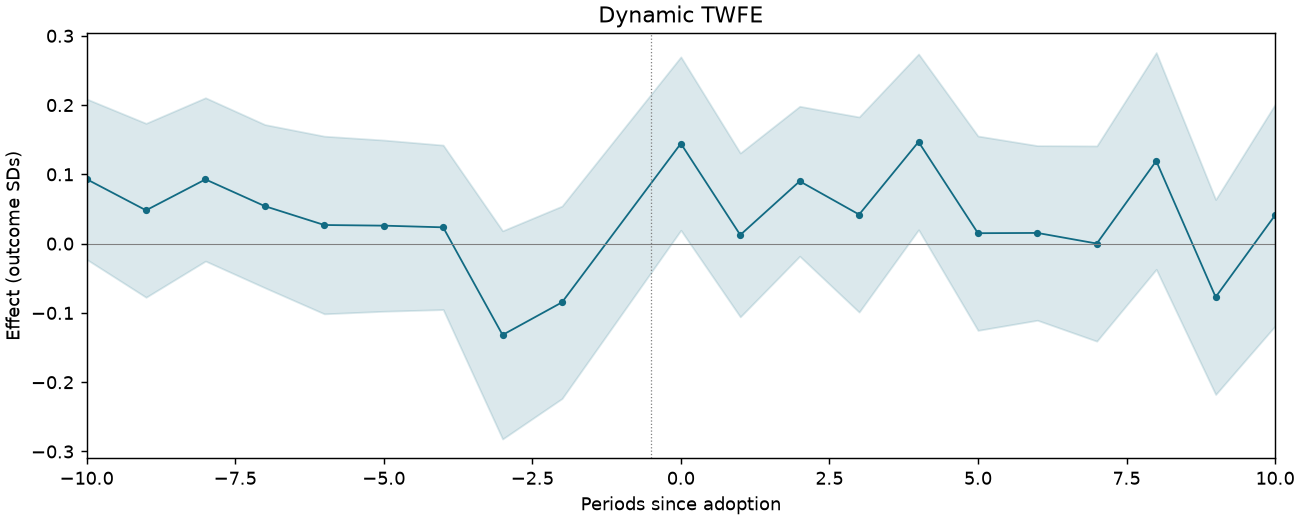
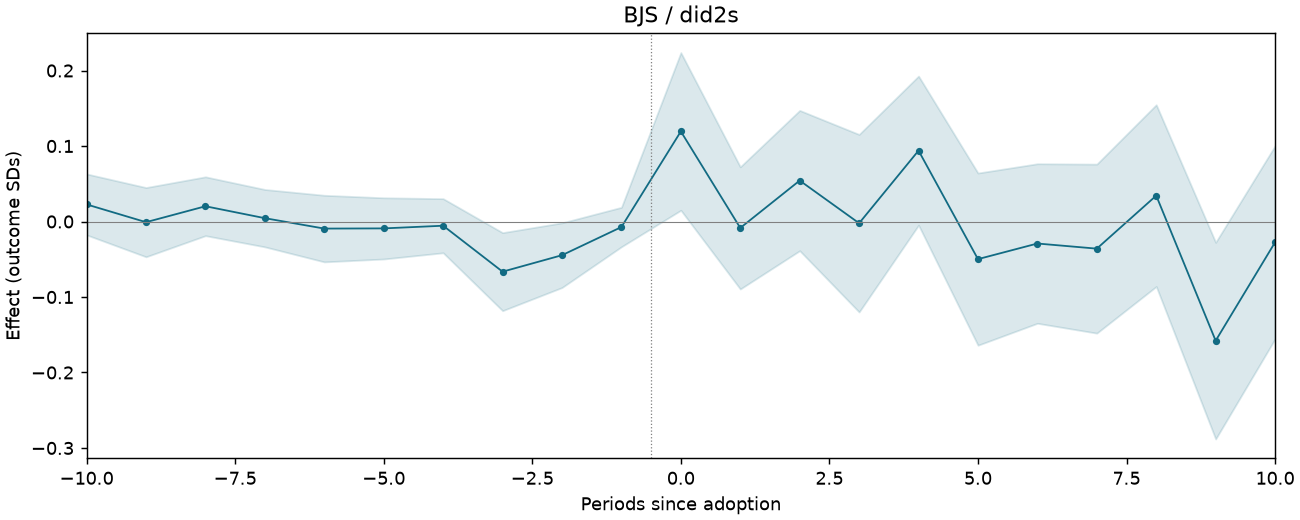
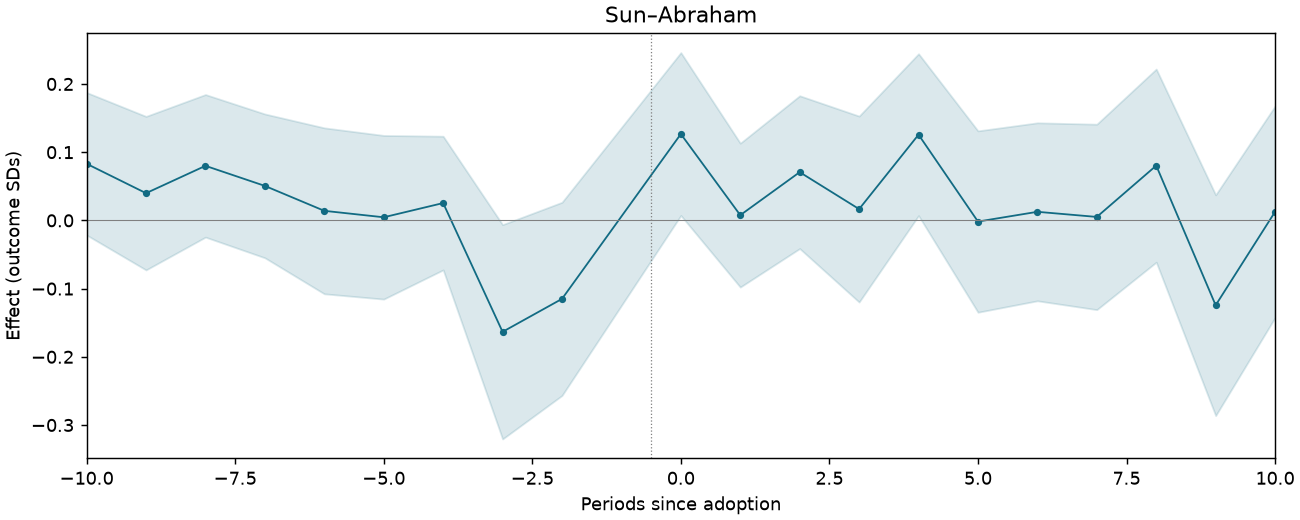
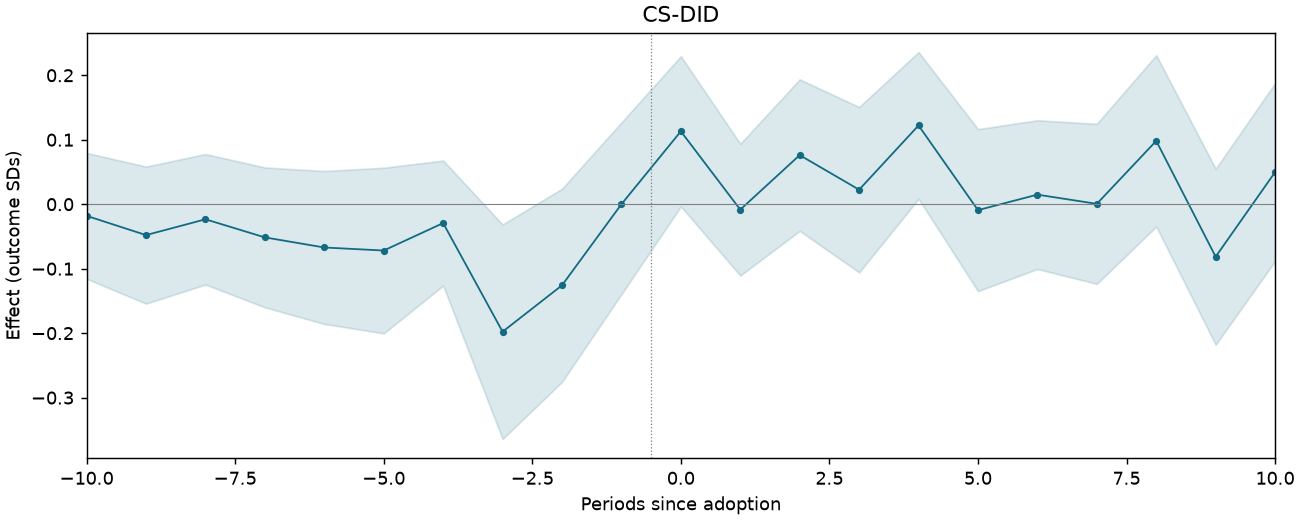
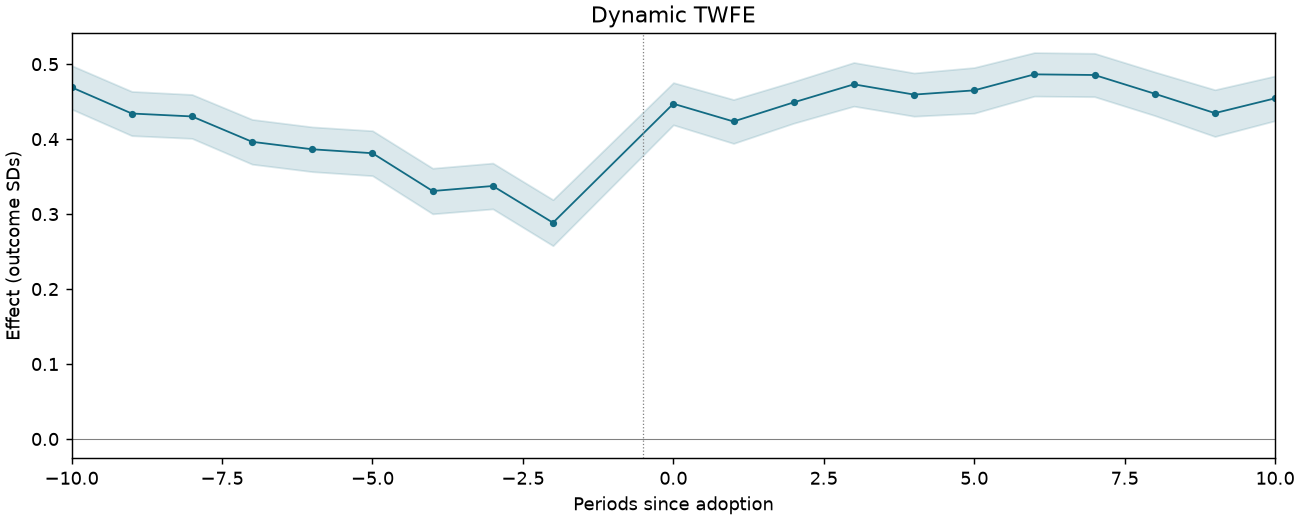
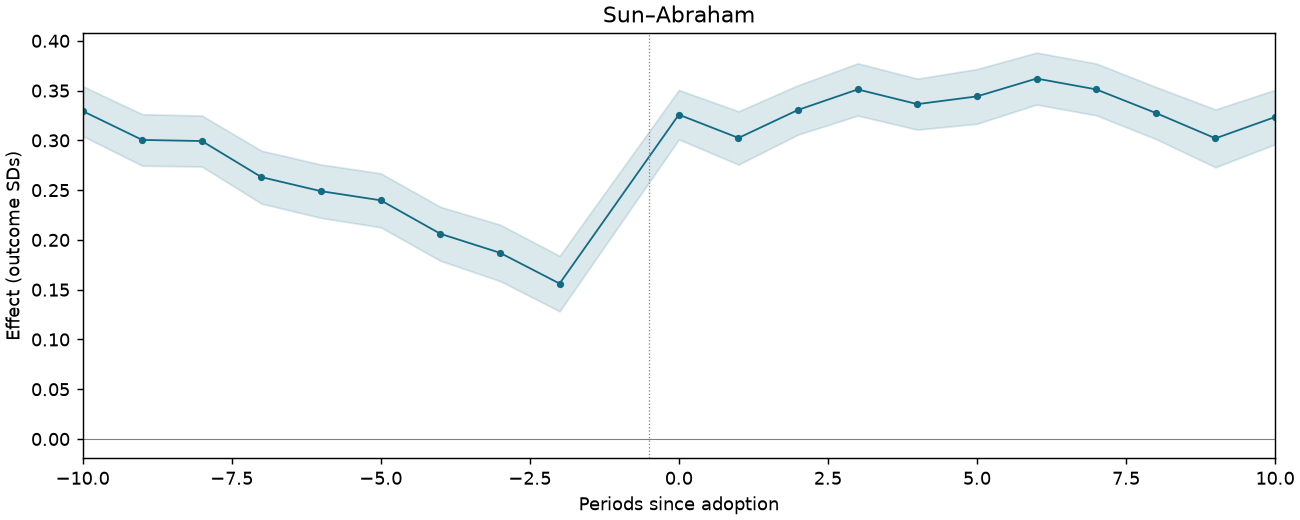
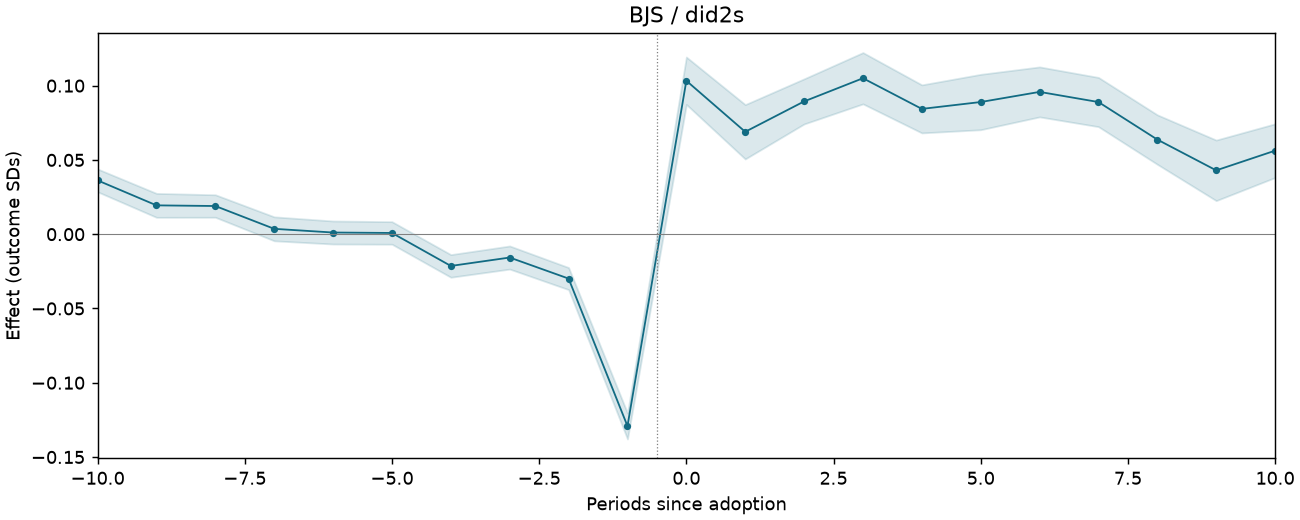
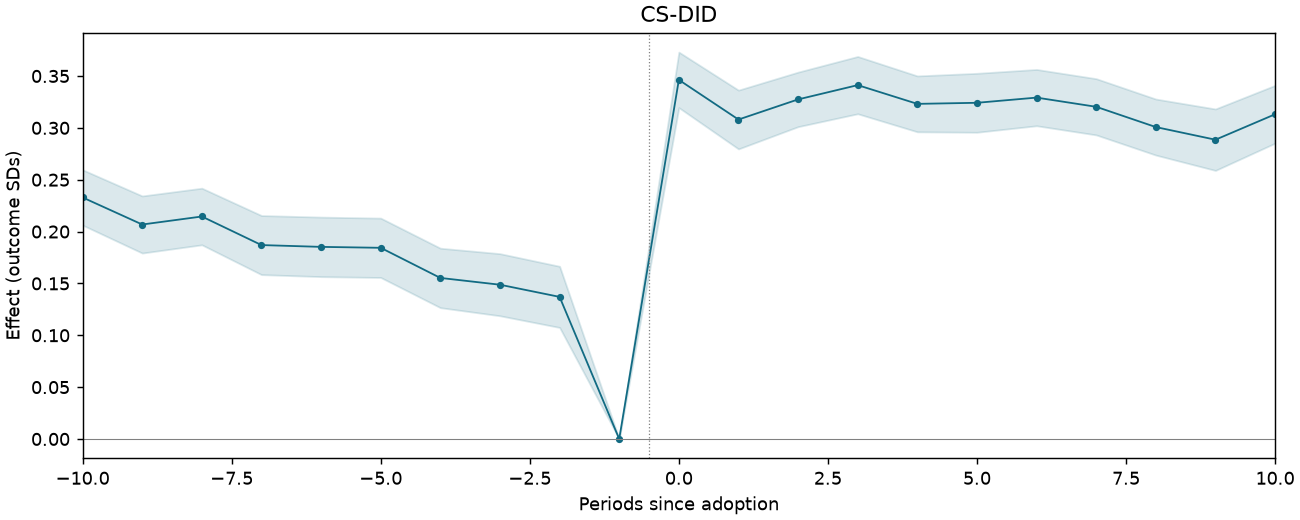
Periods −10 to +10; pointwise 95% intervals where available.
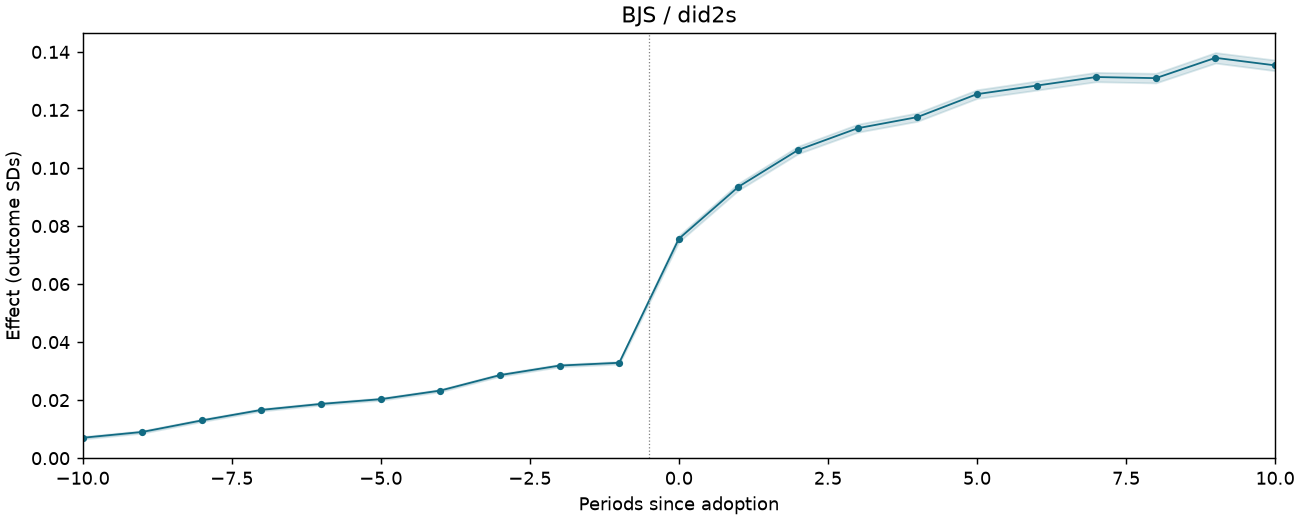
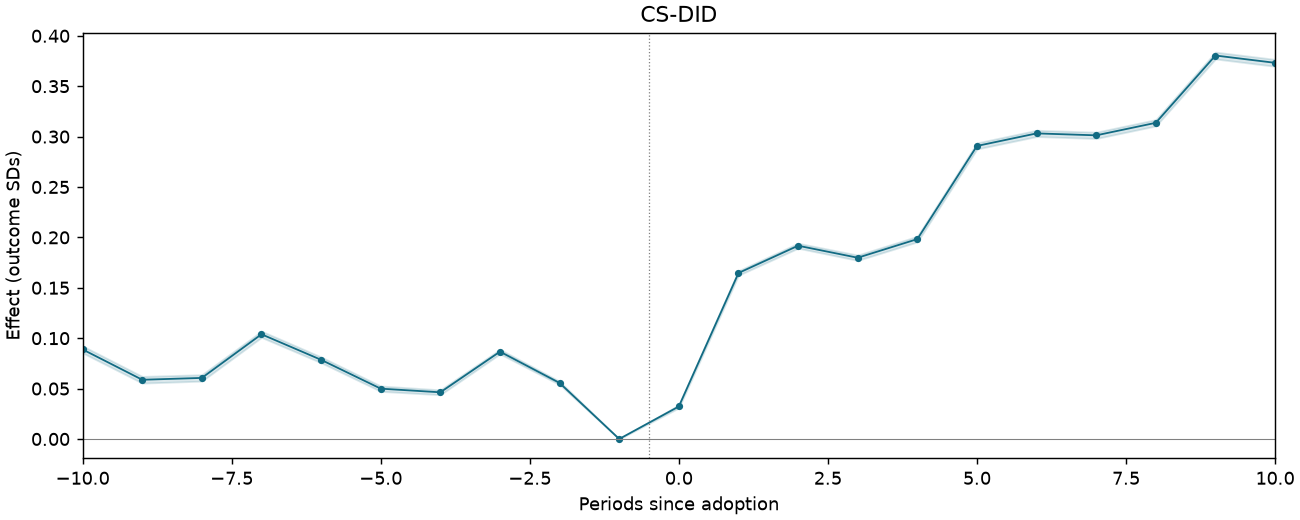
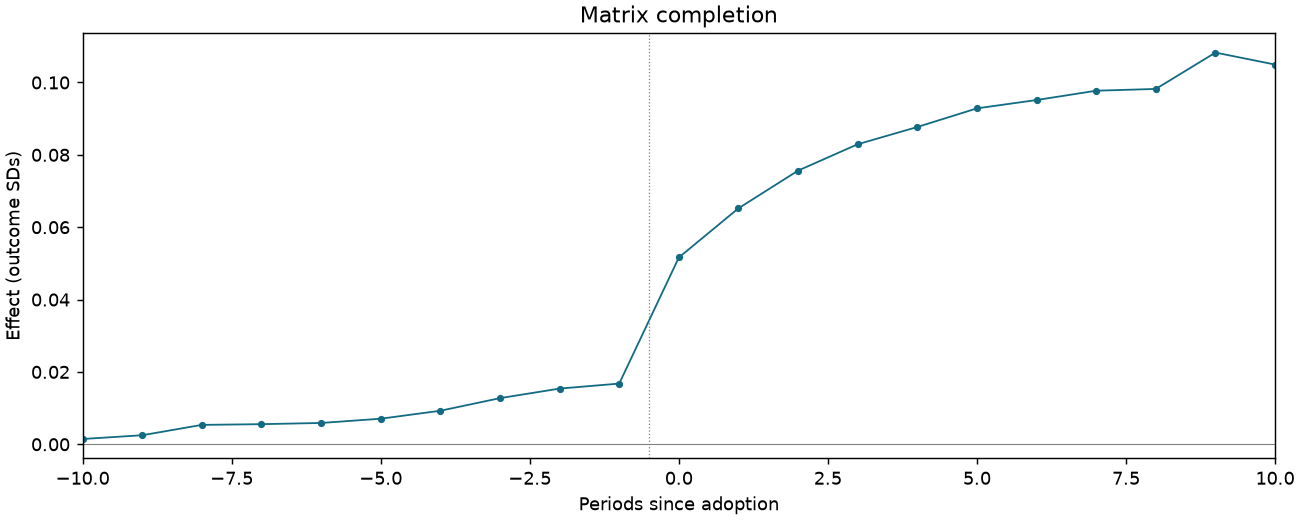
IPPO-T3-C3-TRANSFER-NONSES
2,307,491 observations · 92,706 units · 92,706 clusters · 36,260 treated / 56,446 control units.
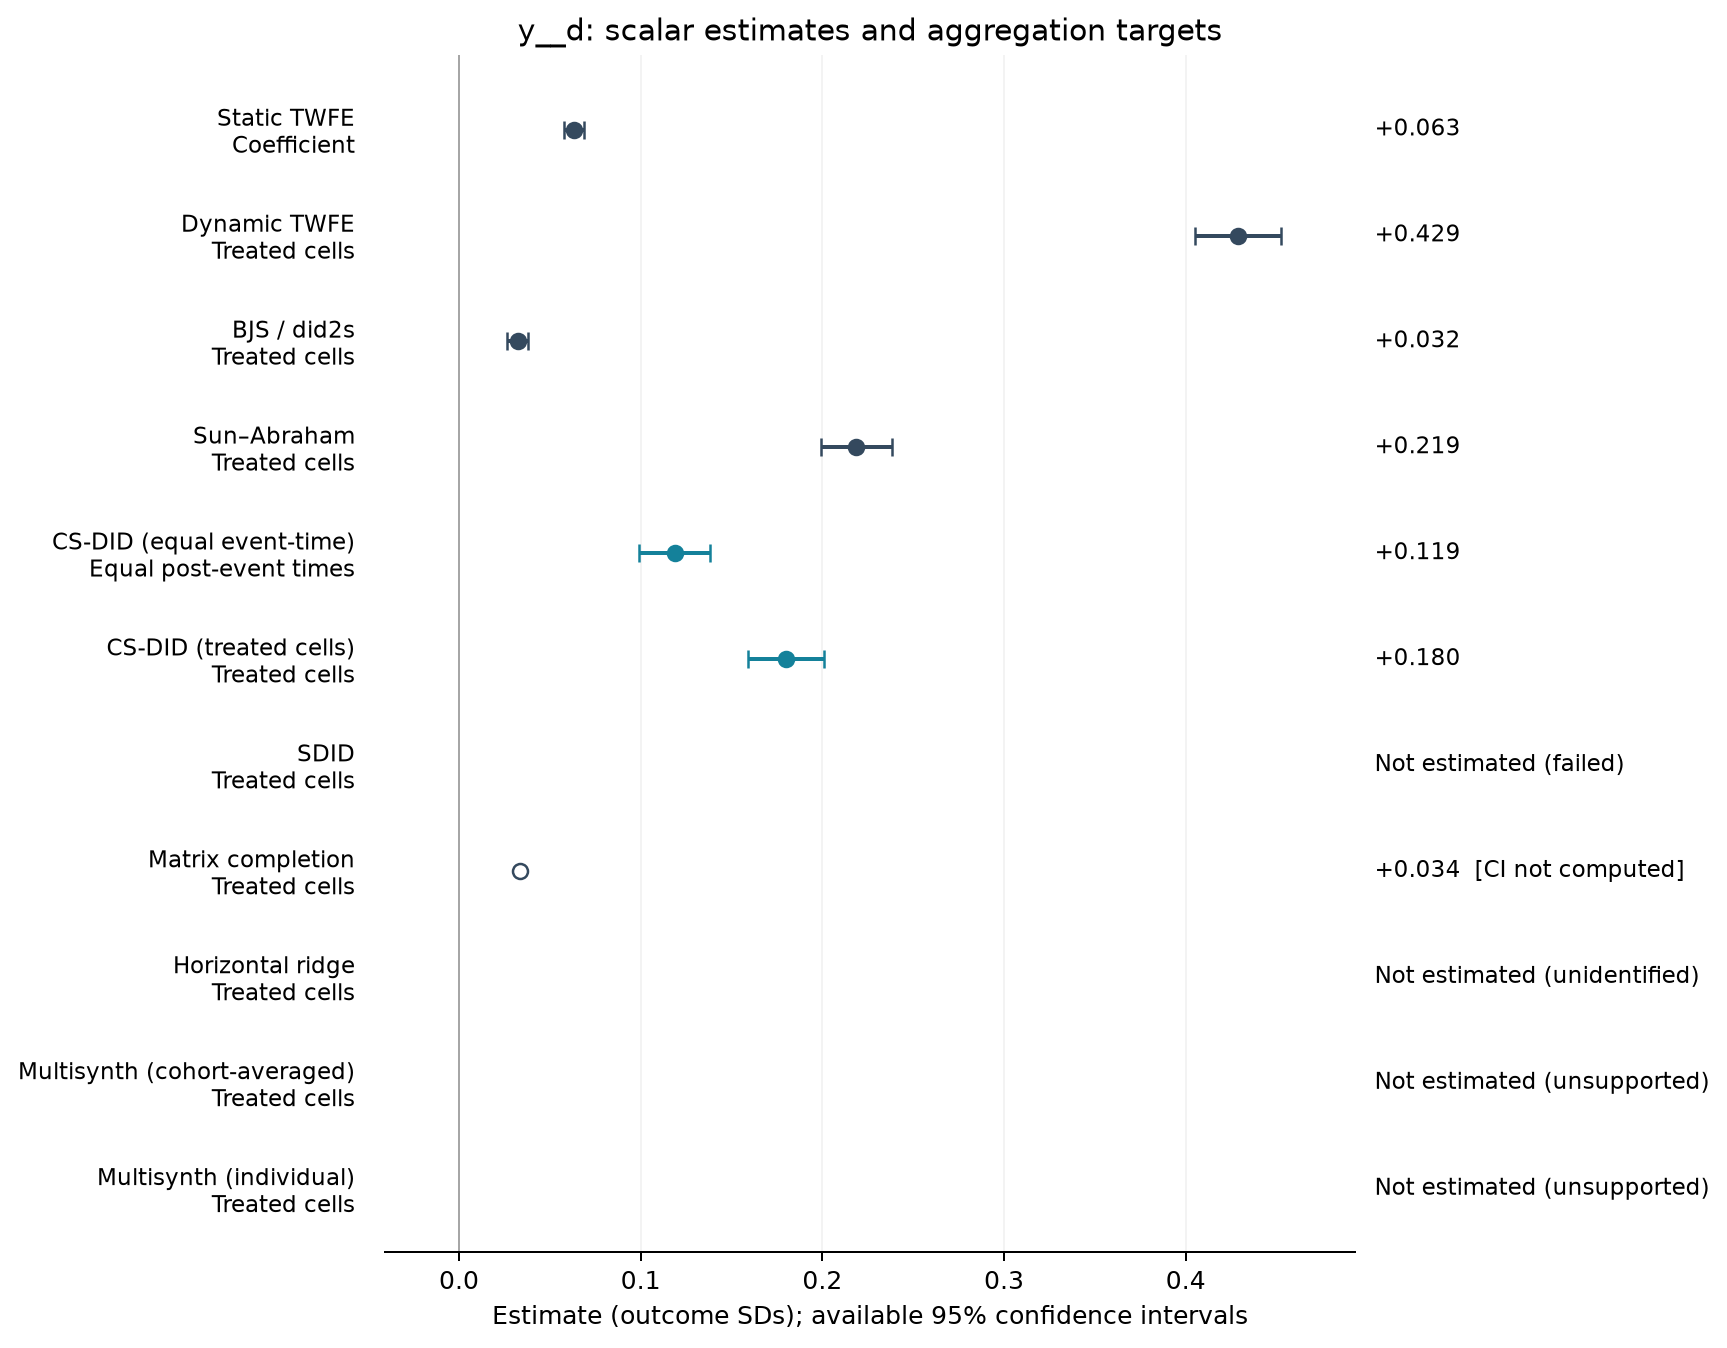
Estimate comparison
| Estimator | Estimate (SDs) | SE | 95% CI | Averaging |
|---|---|---|---|---|
| Static TWFE | 0.063 | 0.003 | [0.058, 0.069] | Coefficient |
| Dynamic TWFE | 0.429 | 0.012 | [0.405, 0.453] | Treated cells |
| BJS / did2s | 0.032 | 0.003 | [0.027, 0.038] | Treated cells |
| Sun–Abraham | 0.219 | 0.010 | [0.199, 0.239] | Treated cells |
| CS-DID (equal event-time) | 0.119 | 0.010 | [0.099, 0.138] | Equal post-event times |
| CS-DID (treated cells) | 0.180 | 0.011 | [0.159, 0.201] | Treated cells |
| Matrix completion | 0.034 | — | — | Treated cells |
Event studies
Periods −10 to +10; pointwise 95% intervals where available.
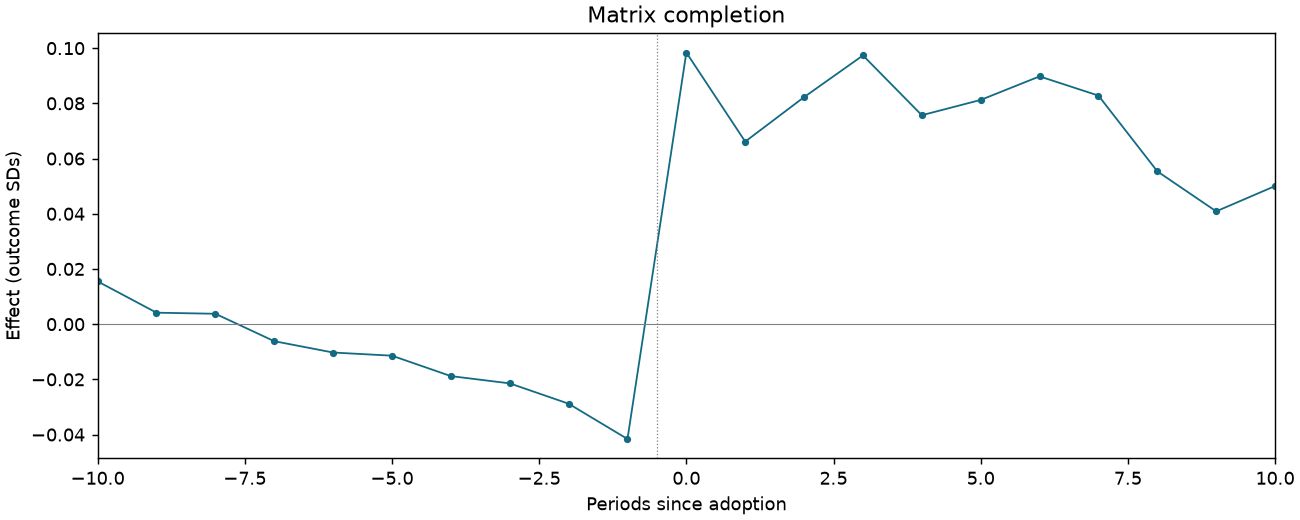
IPPO-T3-C5-TRANSFER-SES
63,551 observations · 2,909 units · 2,909 clusters · 1,235 treated / 1,674 control units.
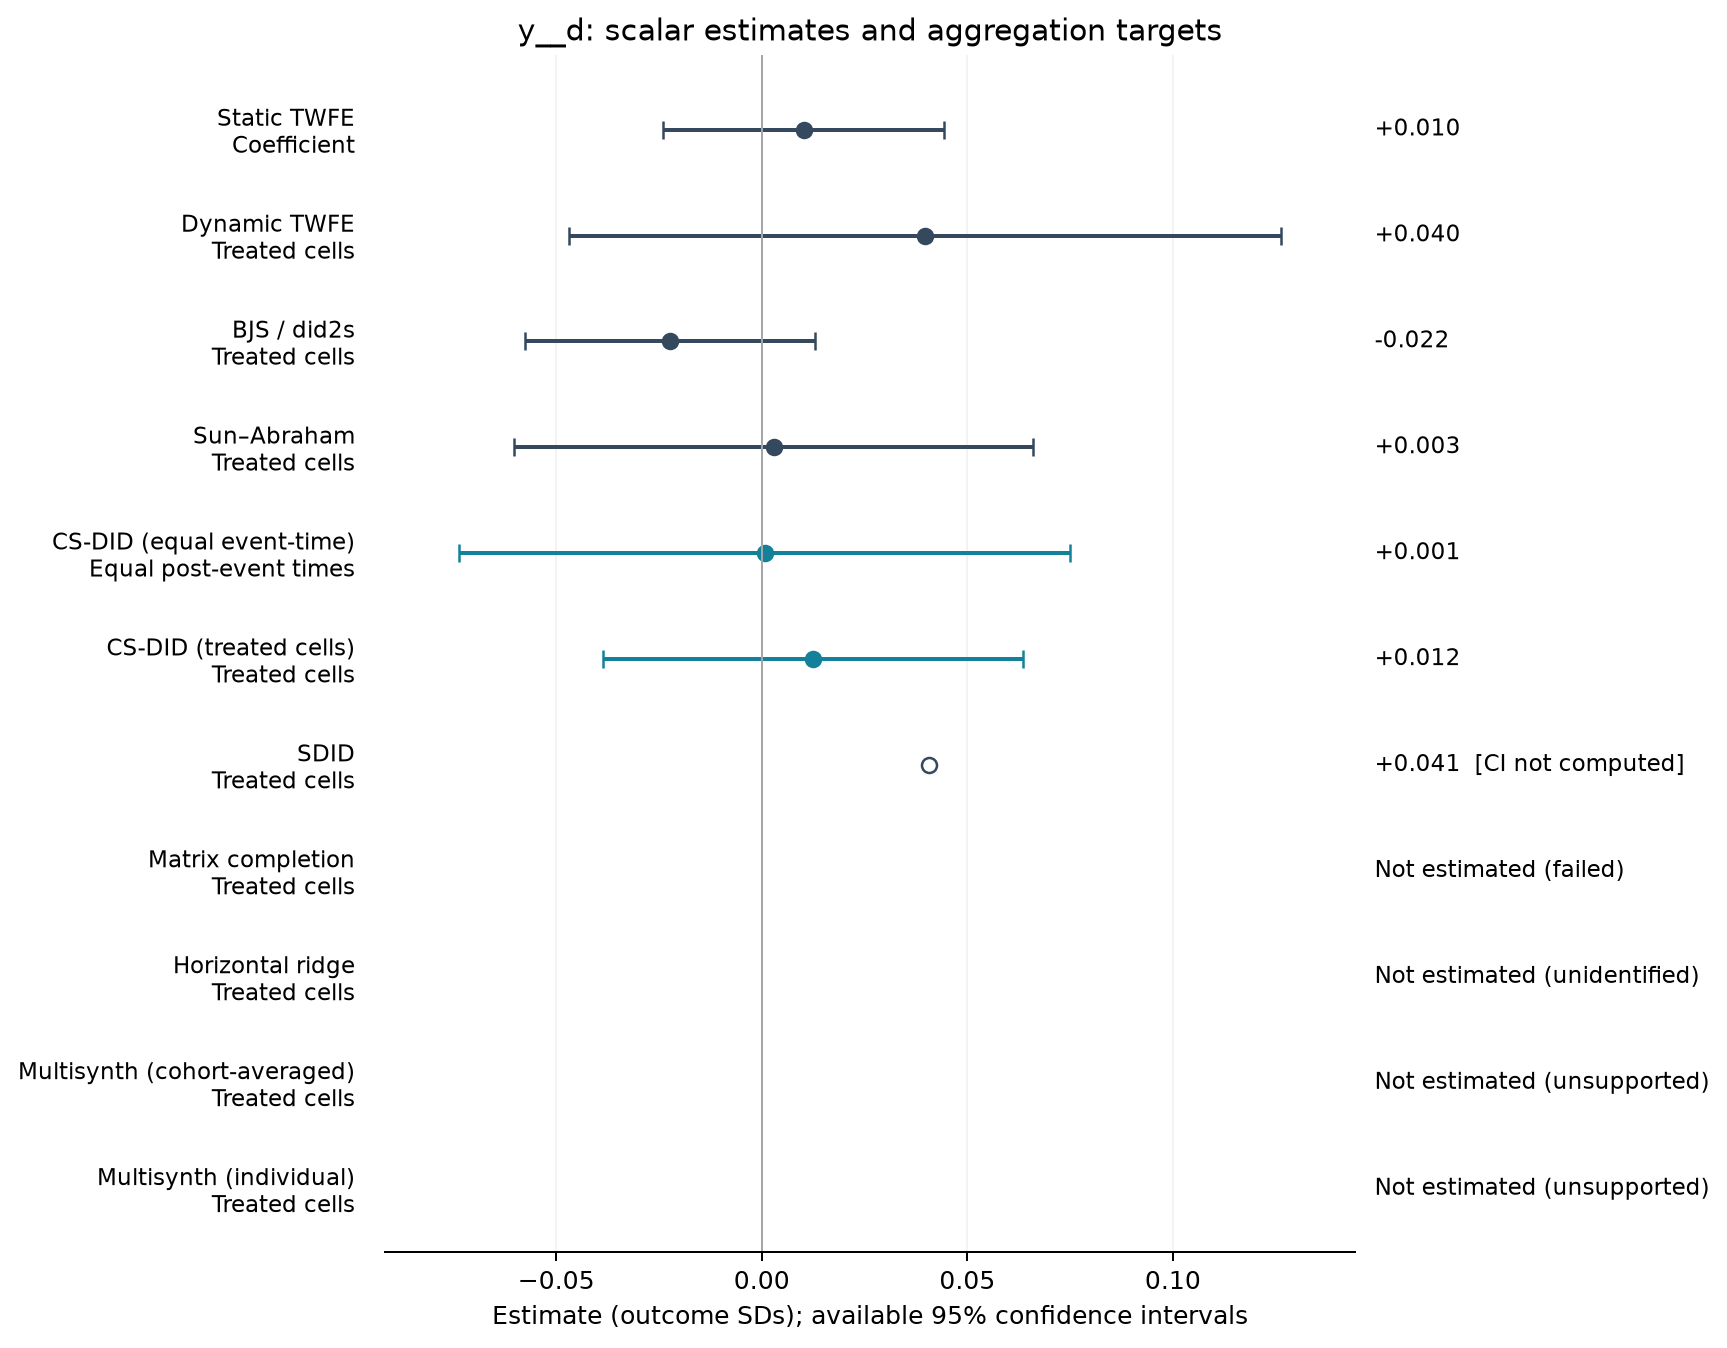
Estimate comparison
| Estimator | Estimate (SDs) | SE | 95% CI | Averaging |
|---|---|---|---|---|
| Static TWFE | 0.010 | 0.017 | [-0.024, 0.044] | Coefficient |
| Dynamic TWFE | 0.040 | 0.044 | [-0.047, 0.126] | Treated cells |
| BJS / did2s | -0.022 | 0.018 | [-0.058, 0.013] | Treated cells |
| Sun–Abraham | 0.003 | 0.032 | [-0.060, 0.066] | Treated cells |
| CS-DID (equal event-time) | 0.001 | 0.038 | [-0.074, 0.075] | Equal post-event times |
| CS-DID (treated cells) | 0.012 | 0.026 | [-0.039, 0.064] | Treated cells |
| SDID | 0.041 | — | — | Treated cells |
Event studies
Periods −10 to +10; pointwise 95% intervals where available.