Leadership in Social Movements — expanded estimators
Archive index · Regression tests · Results & settings (JSON) · Methods & code
Dippel and Heblich (2021), AER. https://doi.org/10.1257/aer.20191137
2 specifications. Effects are in outcome standard deviations; intervals are 95%.
Treatment adoption

S10-P001: seeded sample of 100 of 255 eligible units. Purple untreated; yellow treated; white unobserved.
German-language newspaper presence
5,334 observations · 255 units · 255 clusters · 57 treated / 198 control units.
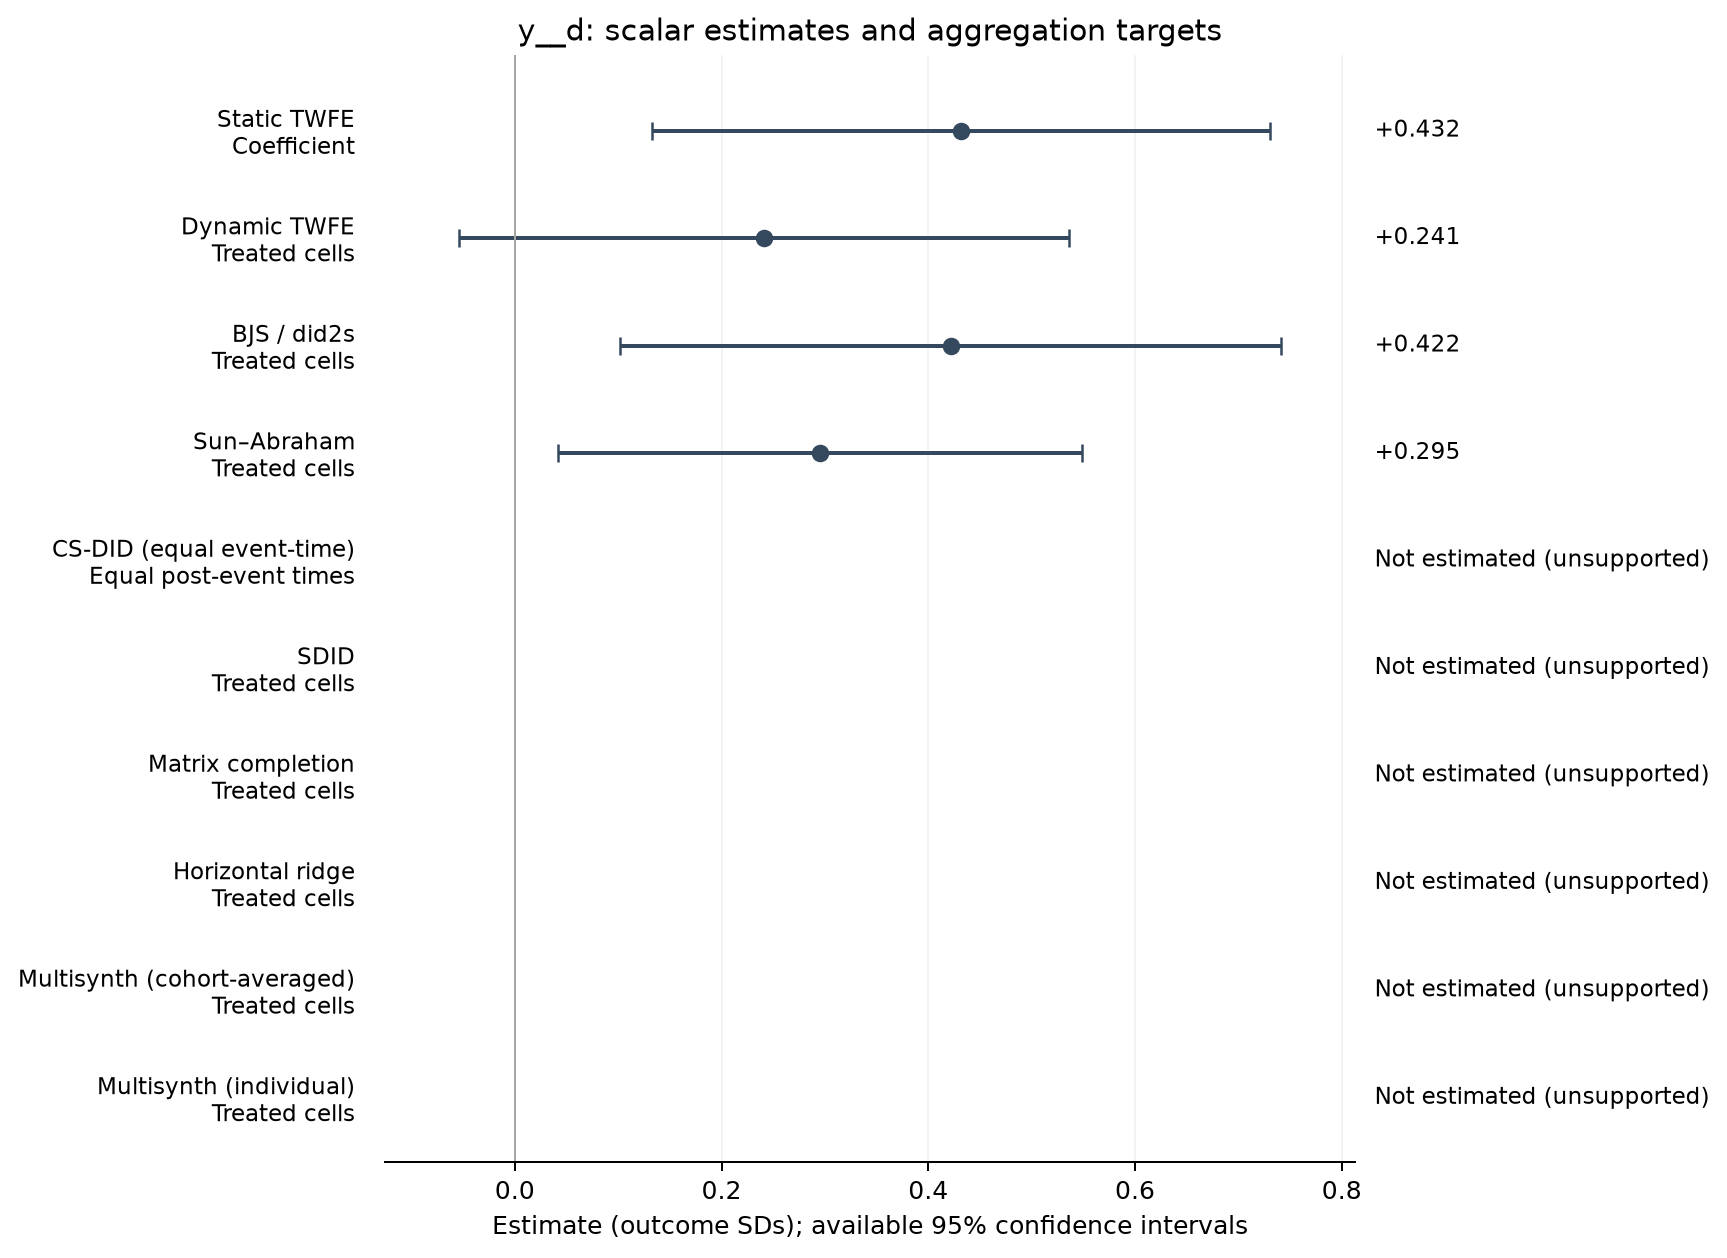
Estimate comparison
| Estimator | Estimate (SDs) | SE | 95% CI | Averaging |
|---|---|---|---|---|
| Static TWFE | 0.432 | 0.152 | [0.133, 0.731] | Coefficient |
| Dynamic TWFE | 0.241 | 0.150 | [-0.054, 0.536] | Treated cells |
| BJS / did2s | 0.422 | 0.162 | [0.102, 0.741] | Treated cells |
| Sun–Abraham | 0.295 | 0.129 | [0.041, 0.549] | Treated cells |
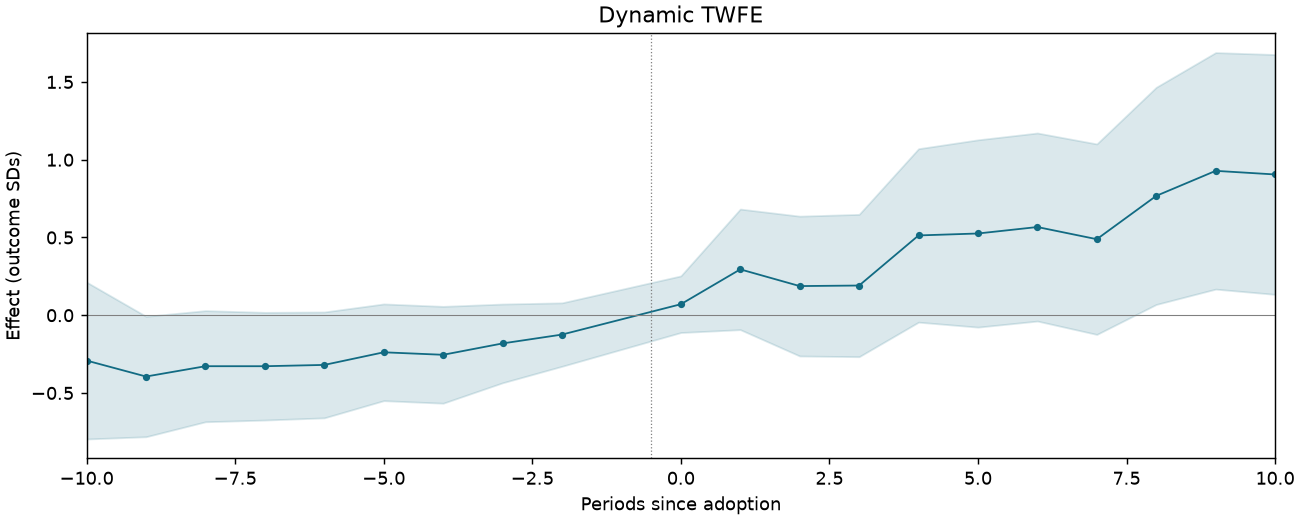
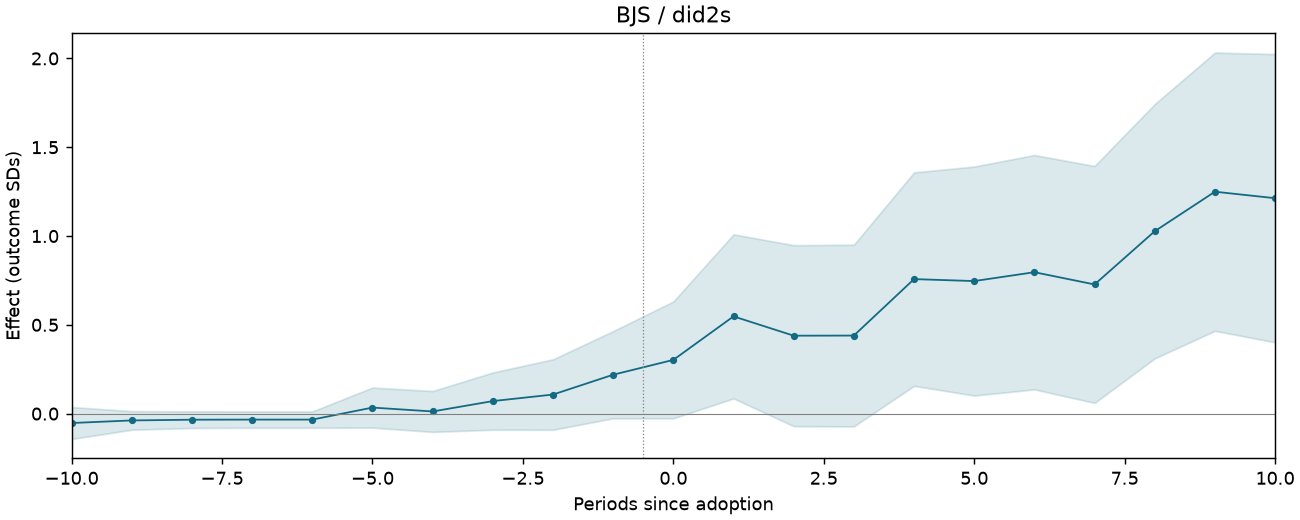
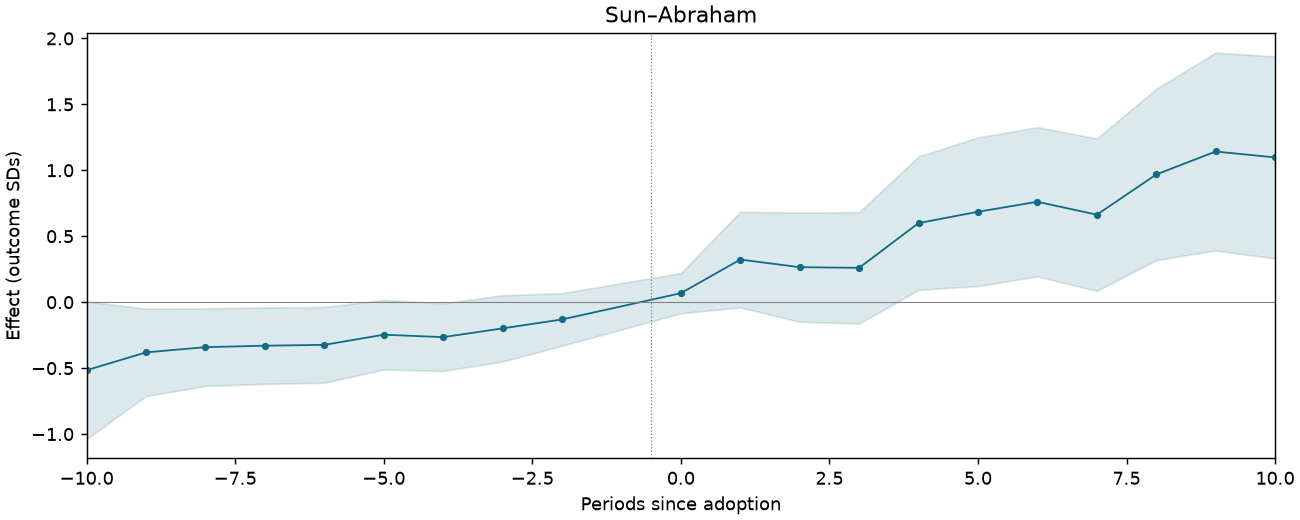
Event studies
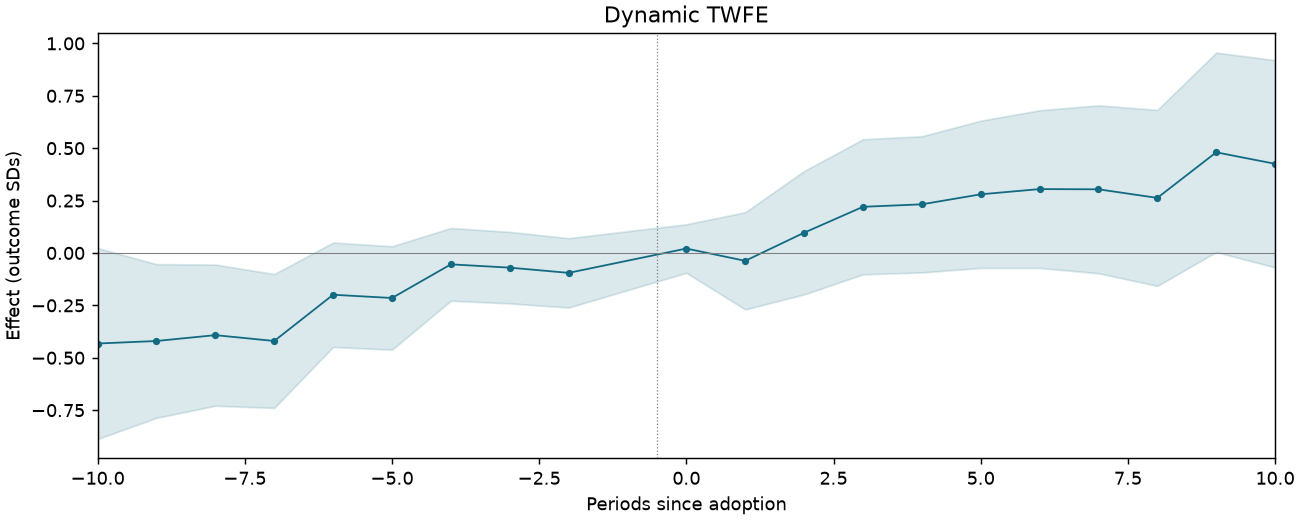
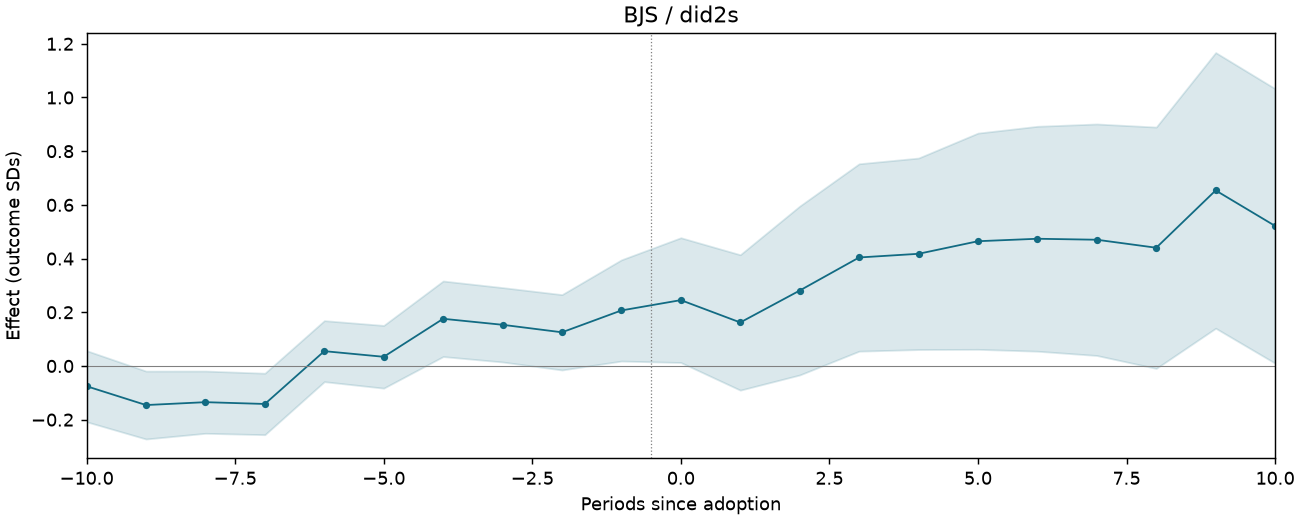
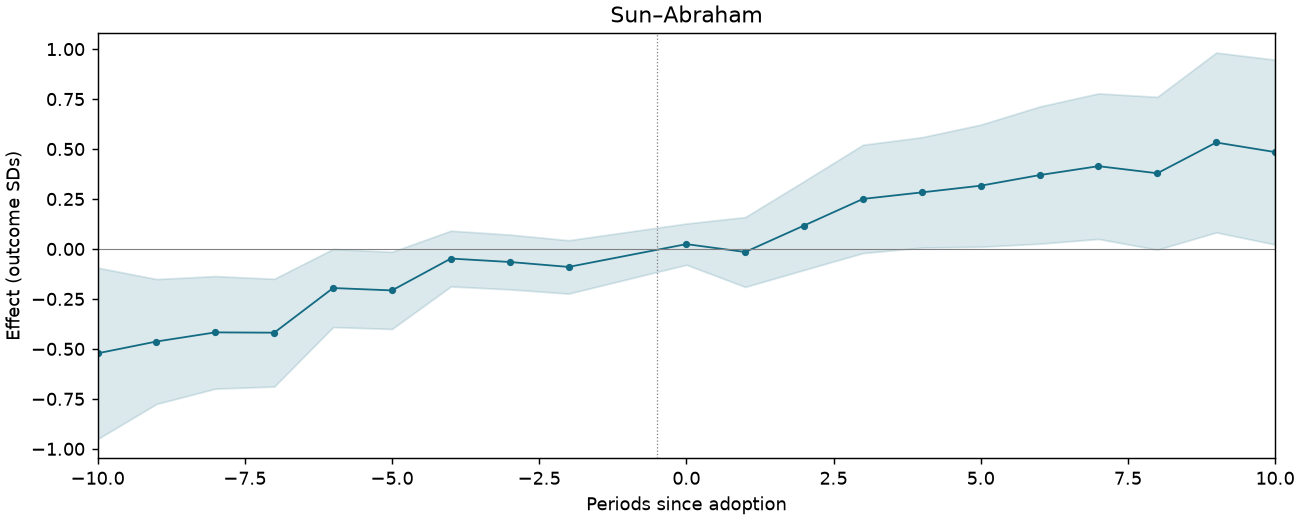
Periods −10 to +10; pointwise 95% intervals where available.
Turner Society presence
5,334 observations · 255 units · 255 clusters · 57 treated / 198 control units.
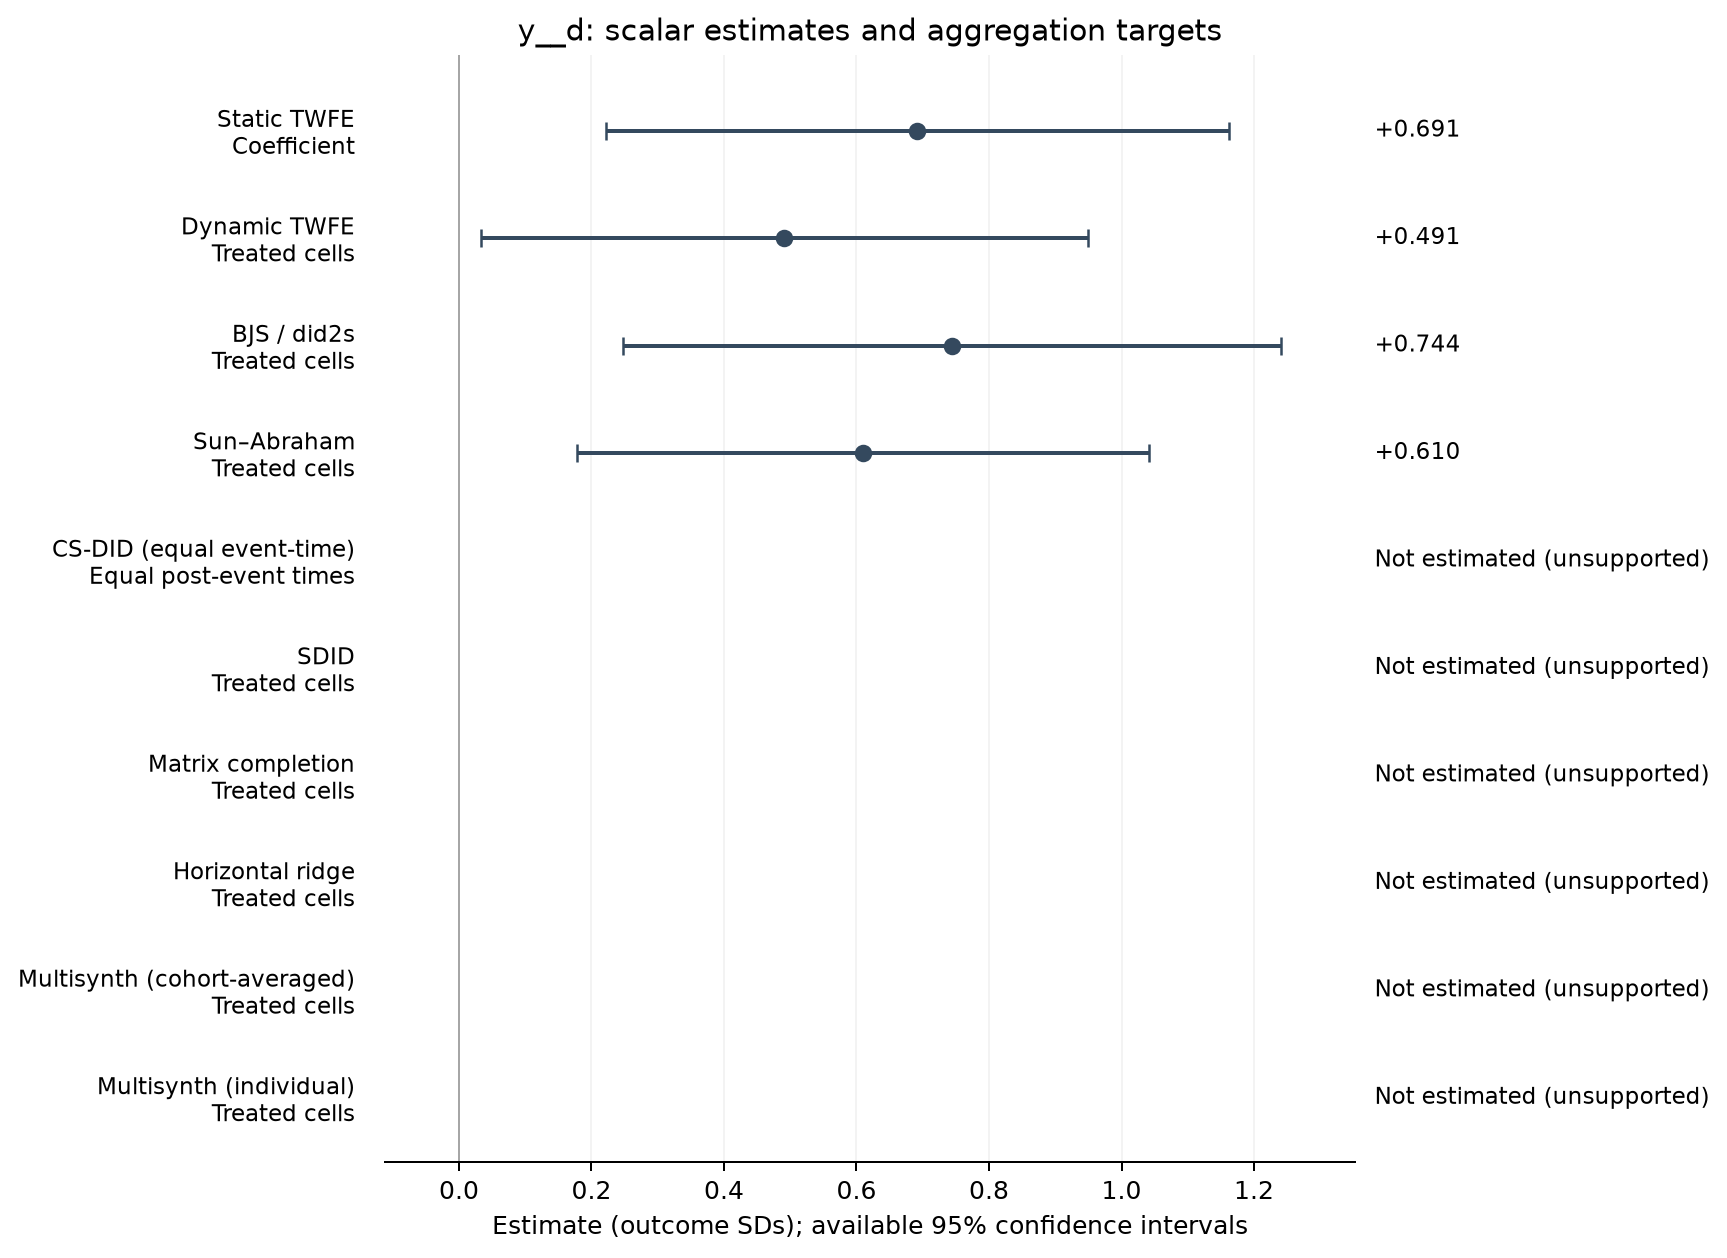
Estimate comparison
| Estimator | Estimate (SDs) | SE | 95% CI | Averaging |
|---|---|---|---|---|
| Static TWFE | 0.691 | 0.239 | [0.221, 1.162] | Coefficient |
| Dynamic TWFE | 0.491 | 0.233 | [0.033, 0.949] | Treated cells |
| BJS / did2s | 0.744 | 0.252 | [0.247, 1.241] | Treated cells |
| Sun–Abraham | 0.610 | 0.219 | [0.178, 1.042] | Treated cells |
Event studies
Periods −10 to +10; pointwise 95% intervals where available.