Vertical Integration Supplier Behavior and Quality Upgrading — expanded estimators
Archive index · Regression tests · Results & settings (JSON) · Methods & code
Hansman et al. (2020), JPE. https://doi.org/10.1086/708818
7 specifications. Effects are in outcome standard deviations; intervals are 95%.
Treatment adoption

S09-P007: seeded sample of 100 of 820 eligible units. Purple untreated; yellow treated; white unobserved.
HHLT-T5-PA-C1-QUANTITY
205,126 observations · 12,244 units · 1,028 clusters · 8 treated / 12,236 control units.
Estimate comparison
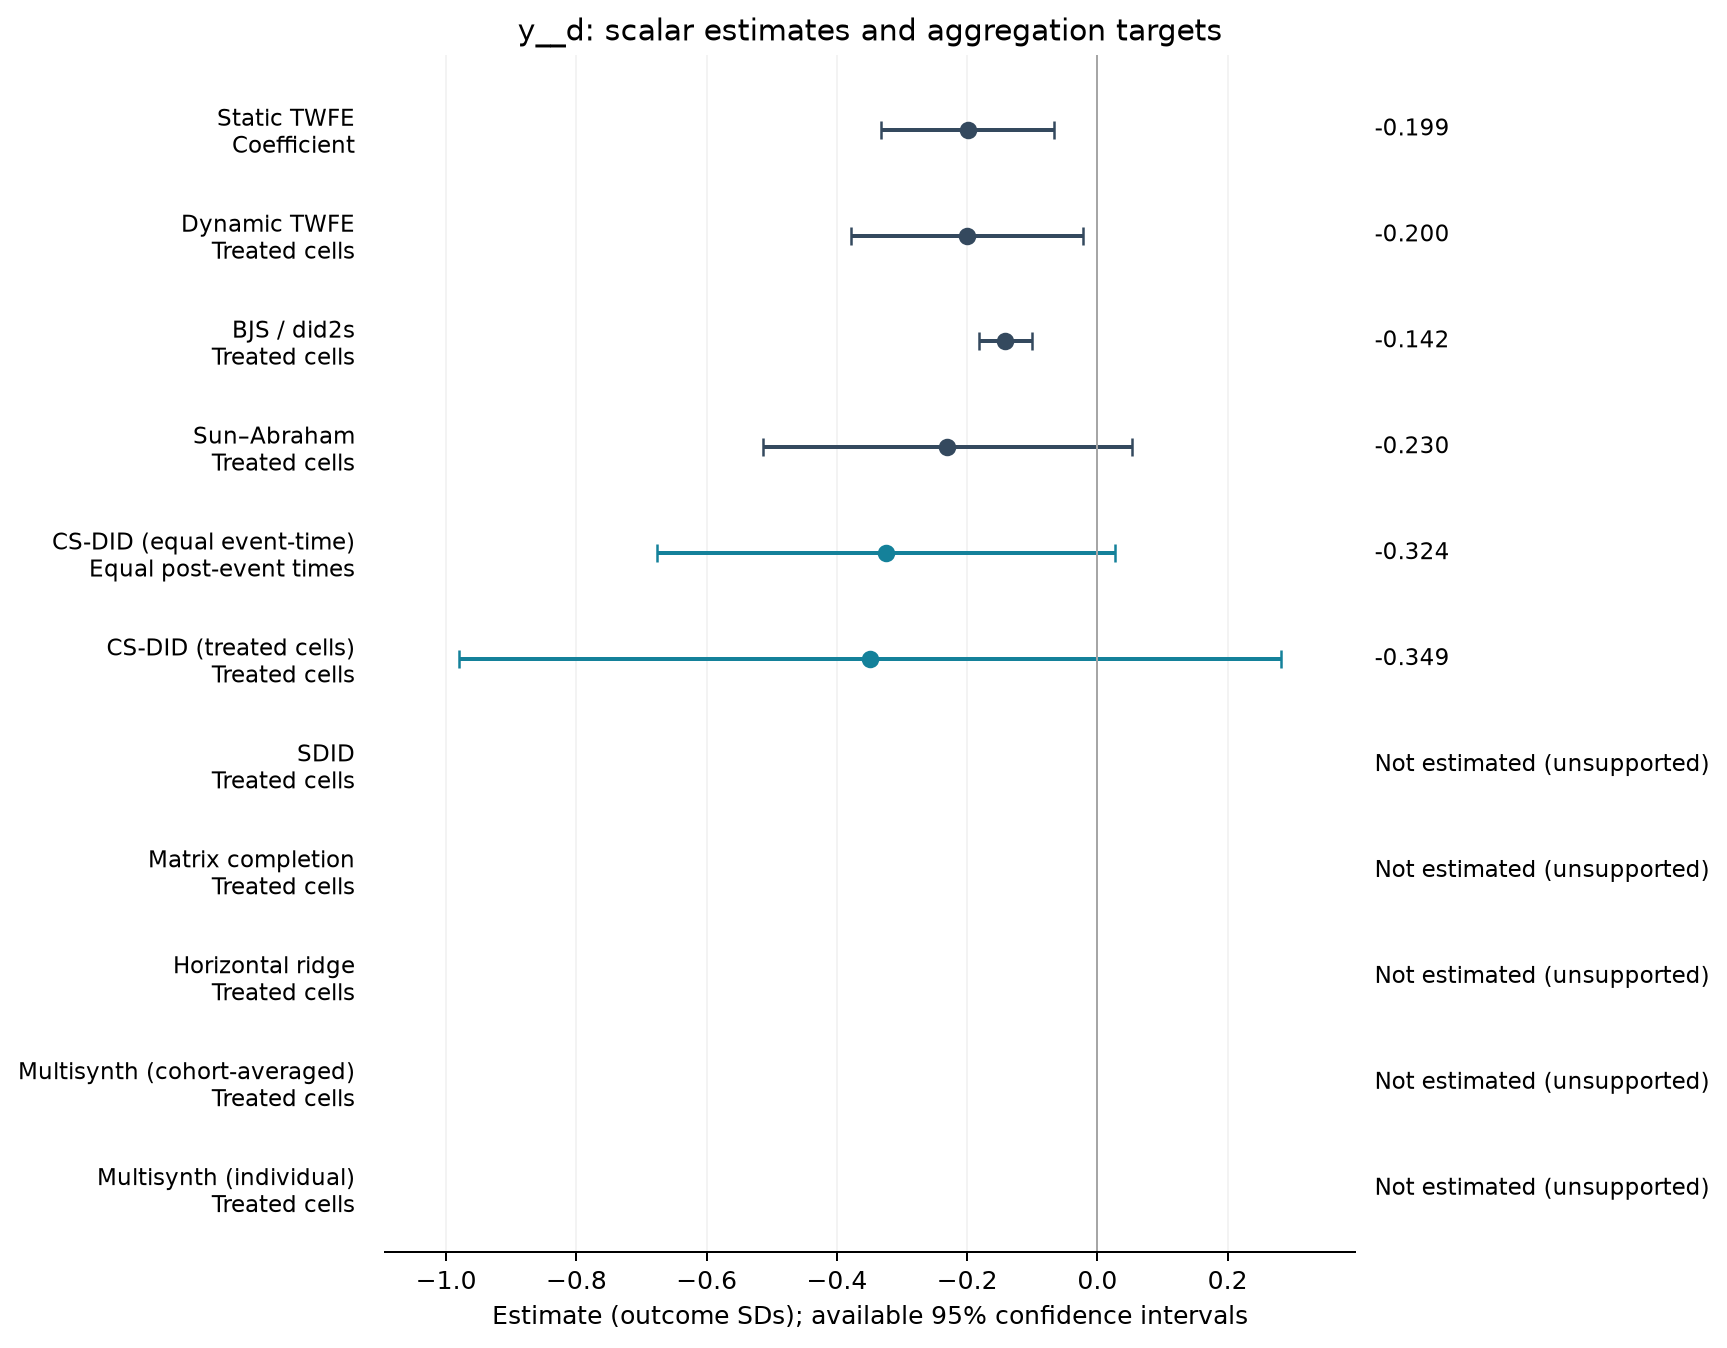
| Estimator | Estimate (SDs) | SE | 95% CI | Averaging |
|---|---|---|---|---|
| Static TWFE | -0.199 | 0.068 | [-0.332, -0.066] | Coefficient |
| Dynamic TWFE | -0.200 | 0.091 | [-0.379, -0.022] | Treated cells |
| BJS / did2s | -0.142 | 0.021 | [-0.182, -0.101] | Treated cells |
| Sun–Abraham | -0.230 | 0.145 | [-0.514, 0.054] | Treated cells |
| CS-DID (equal event-time) | -0.324 | 0.179 | [-0.676, 0.027] | Equal post-event times |
| CS-DID (treated cells) | -0.349 | 0.322 | [-0.980, 0.282] | Treated cells |
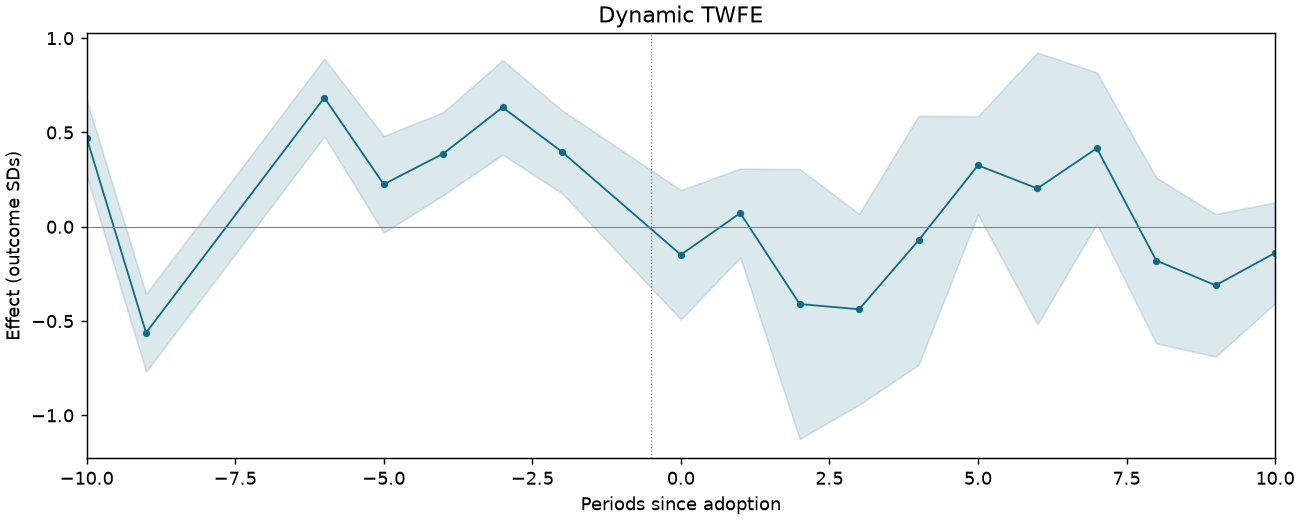
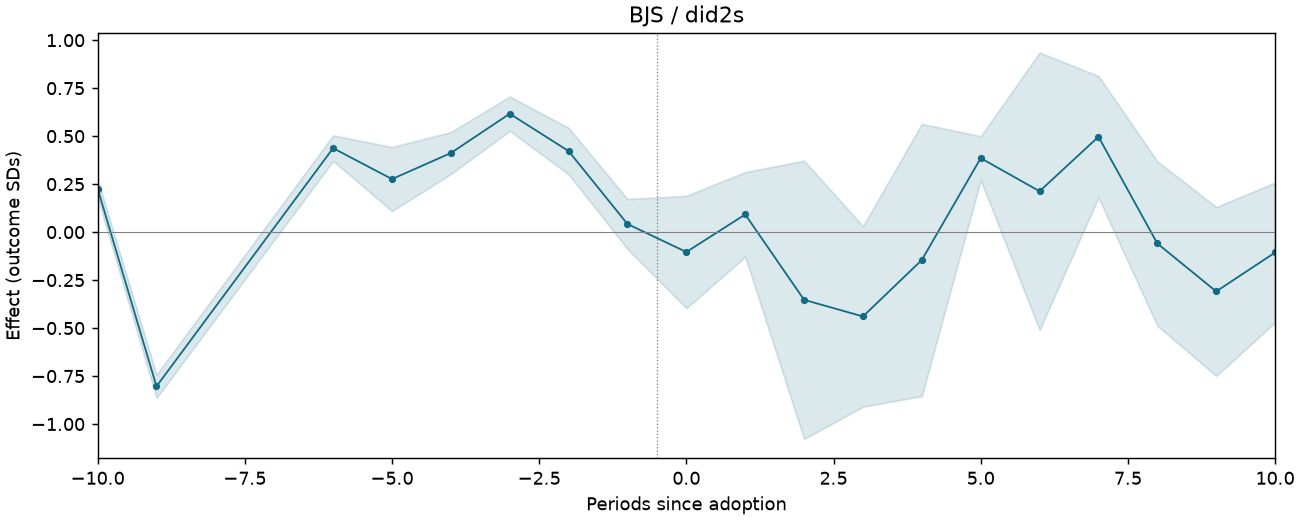
Event studies
Periods −10 to +10; pointwise 95% intervals where available.
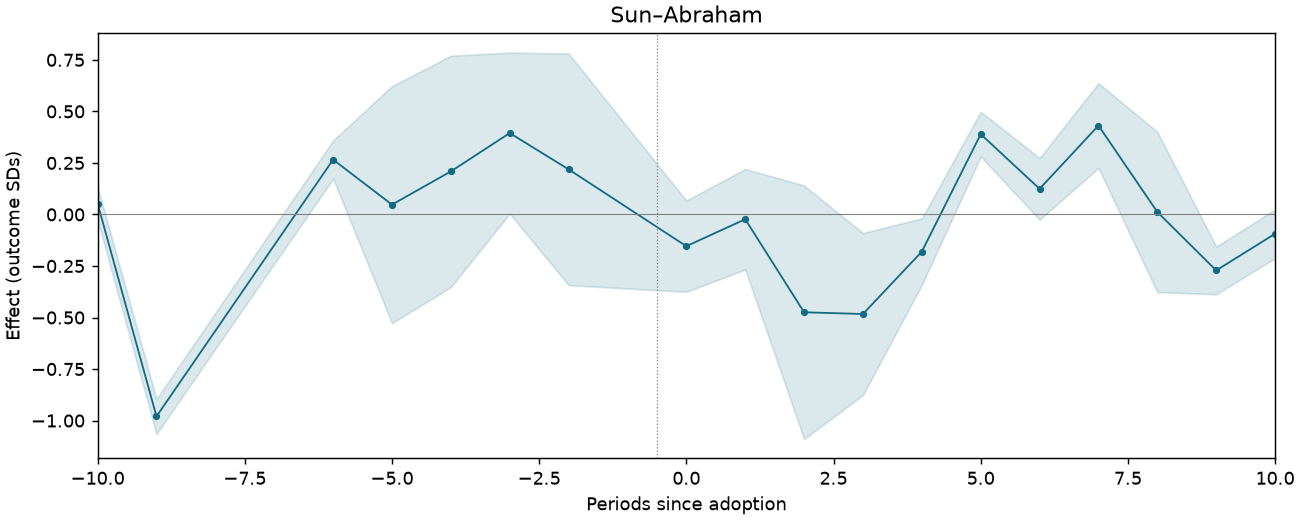
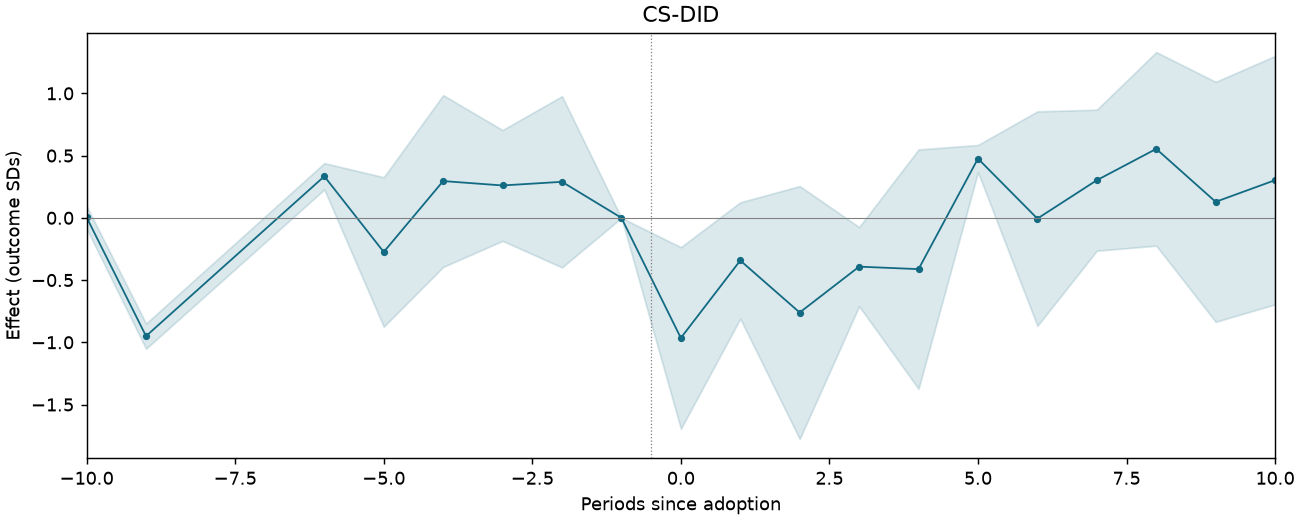
HHLT-T5-PA-C2-DISTANCE
90,618 observations · 7,782 units · 936 clusters · 5 treated / 7,777 control units.
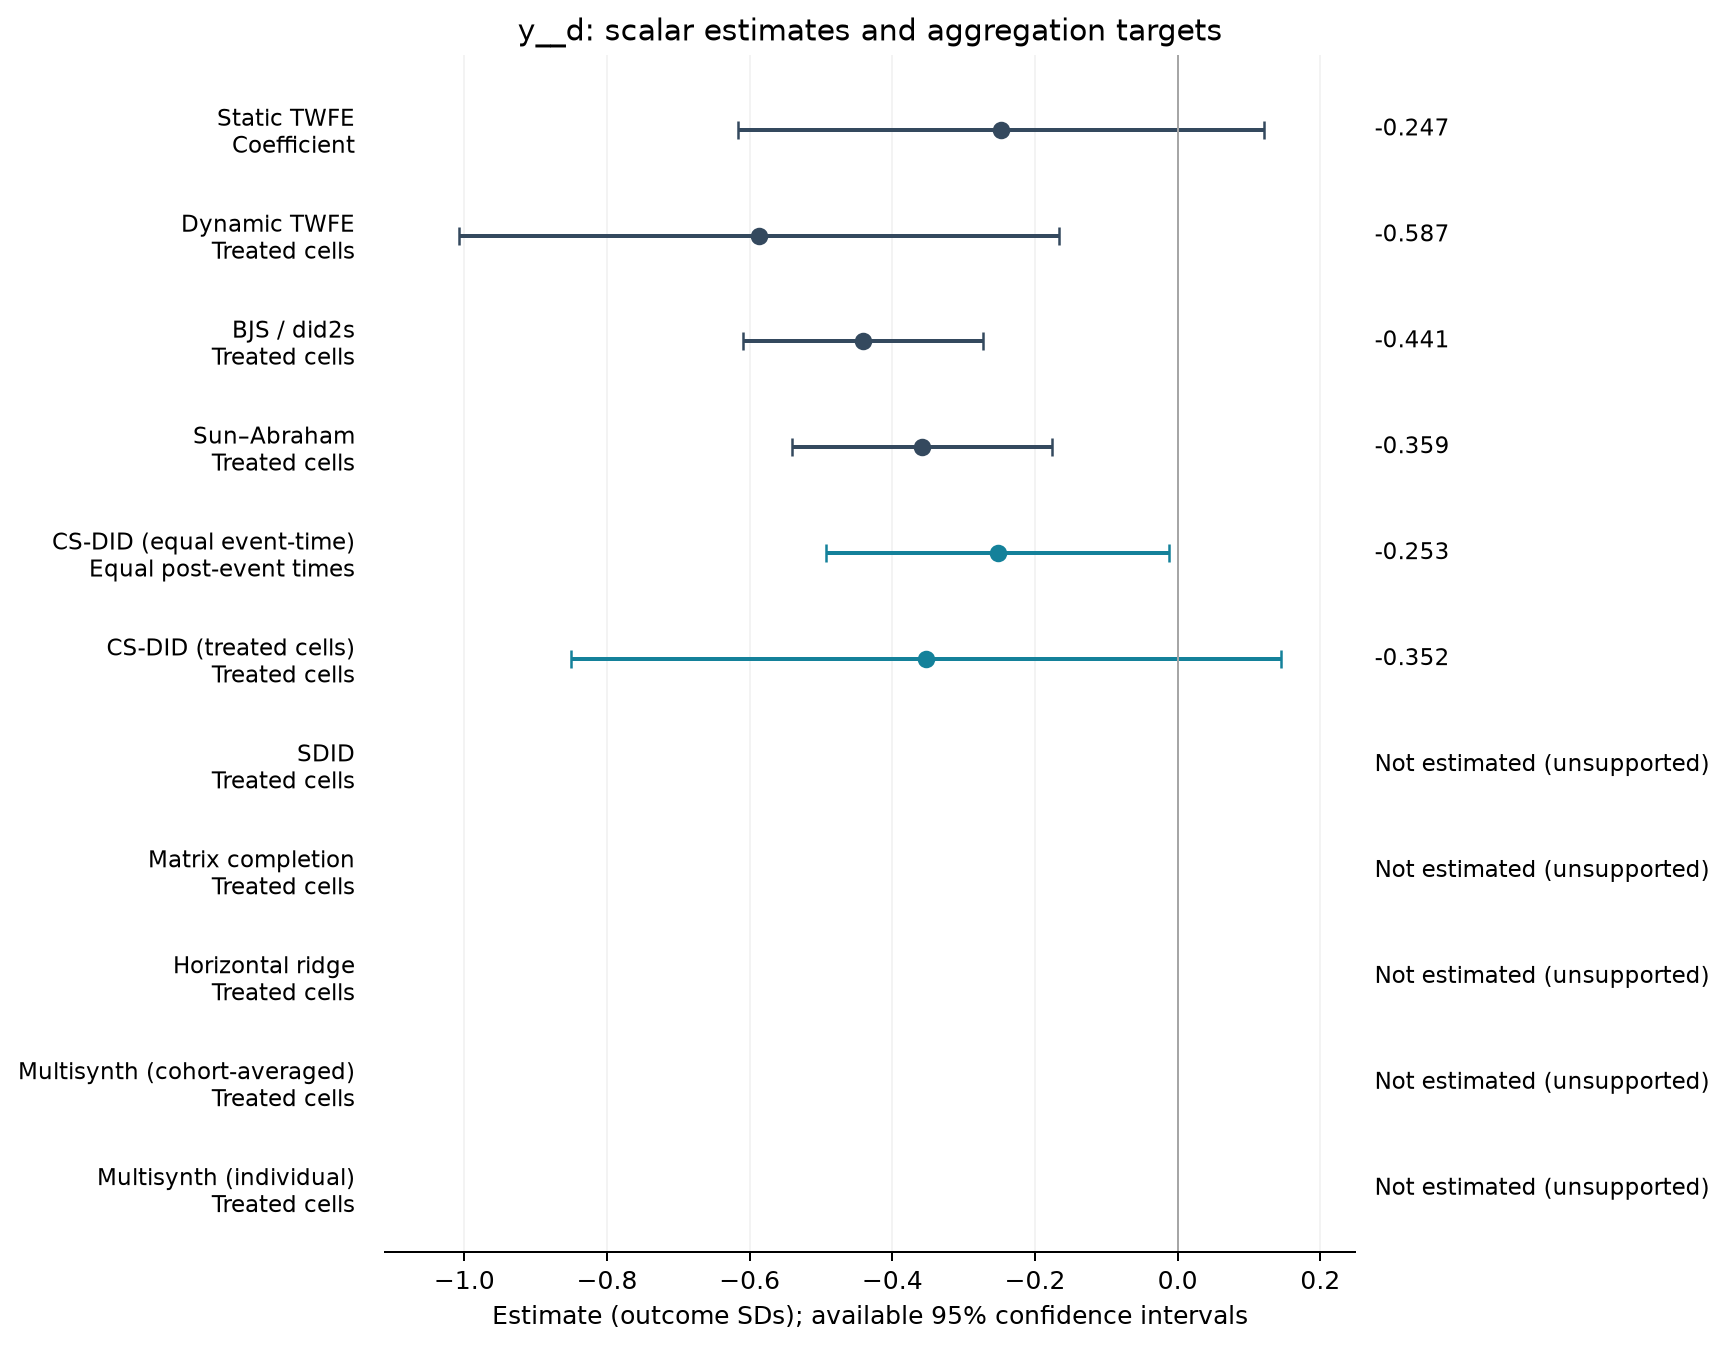
Estimate comparison
| Estimator | Estimate (SDs) | SE | 95% CI | Averaging |
|---|---|---|---|---|
| Static TWFE | -0.247 | 0.188 | [-0.616, 0.122] | Coefficient |
| Dynamic TWFE | -0.587 | 0.214 | [-1.007, -0.166] | Treated cells |
| BJS / did2s | -0.441 | 0.086 | [-0.609, -0.273] | Treated cells |
| Sun–Abraham | -0.359 | 0.093 | [-0.541, -0.176] | Treated cells |
| CS-DID (equal event-time) | -0.253 | 0.123 | [-0.493, -0.012] | Equal post-event times |
| CS-DID (treated cells) | -0.352 | 0.254 | [-0.850, 0.145] | Treated cells |
Event studies
Periods −10 to +10; pointwise 95% intervals where available.
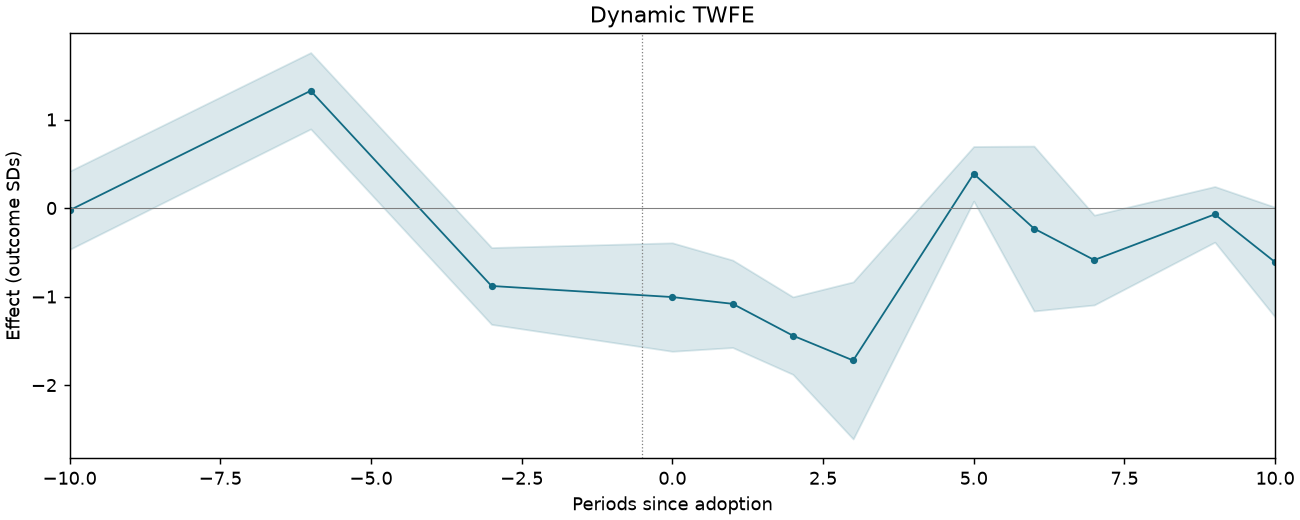
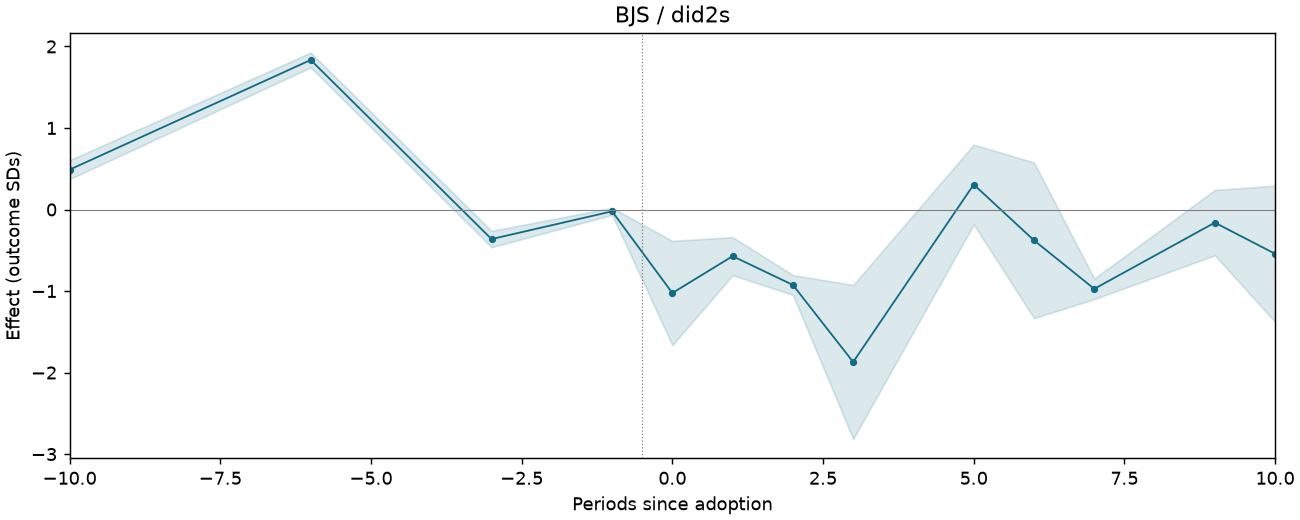
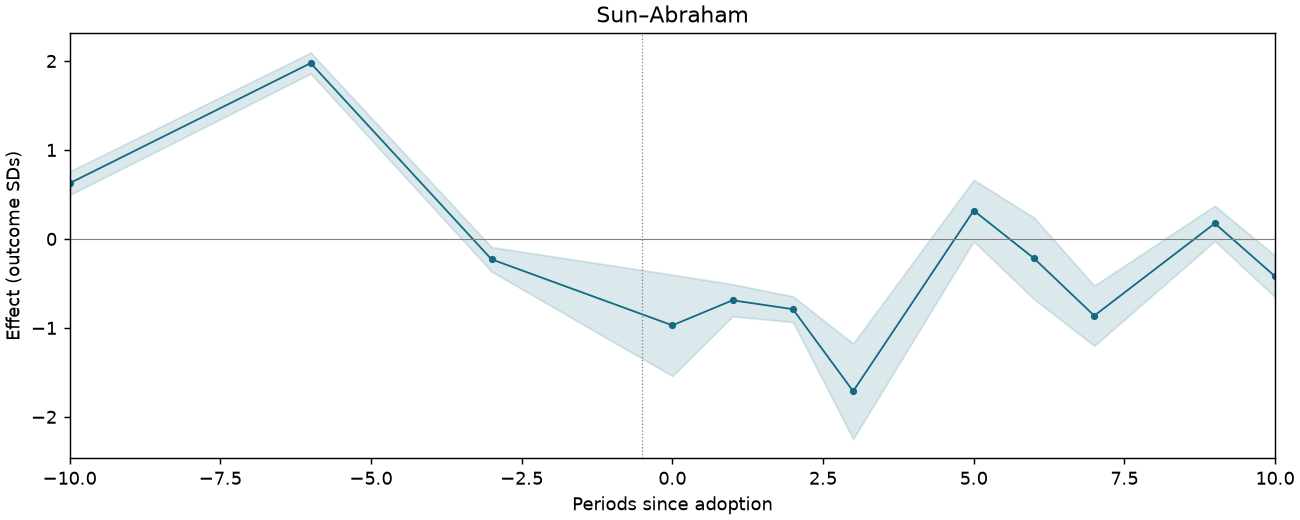
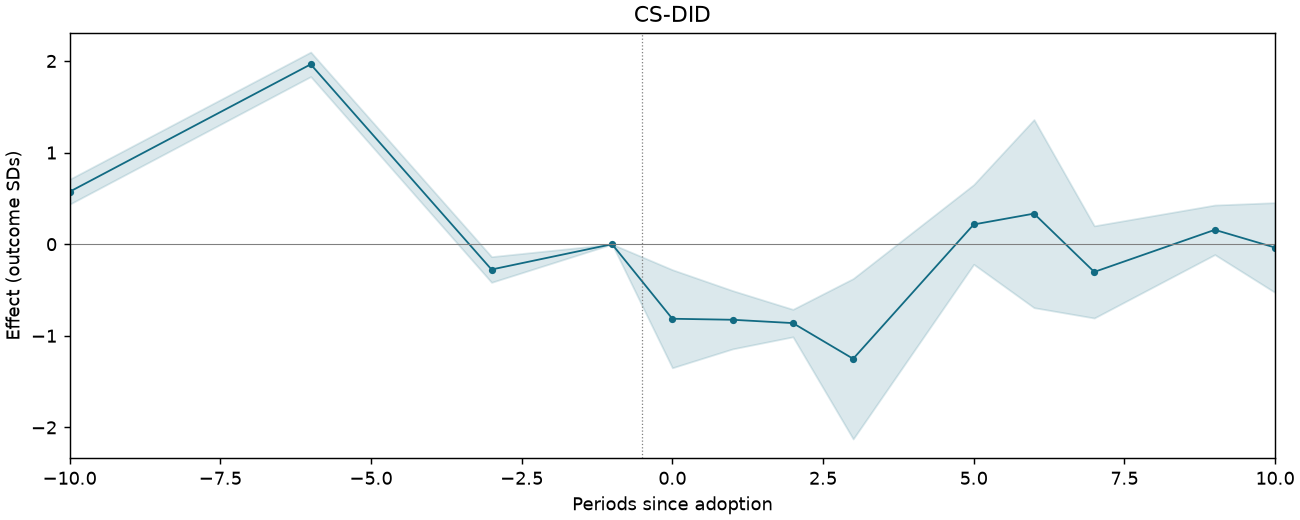
HHLT-T5-PA-C3-TIMESEA
103,870 observations · 8,623 units · 947 clusters · 6 treated / 8,617 control units.
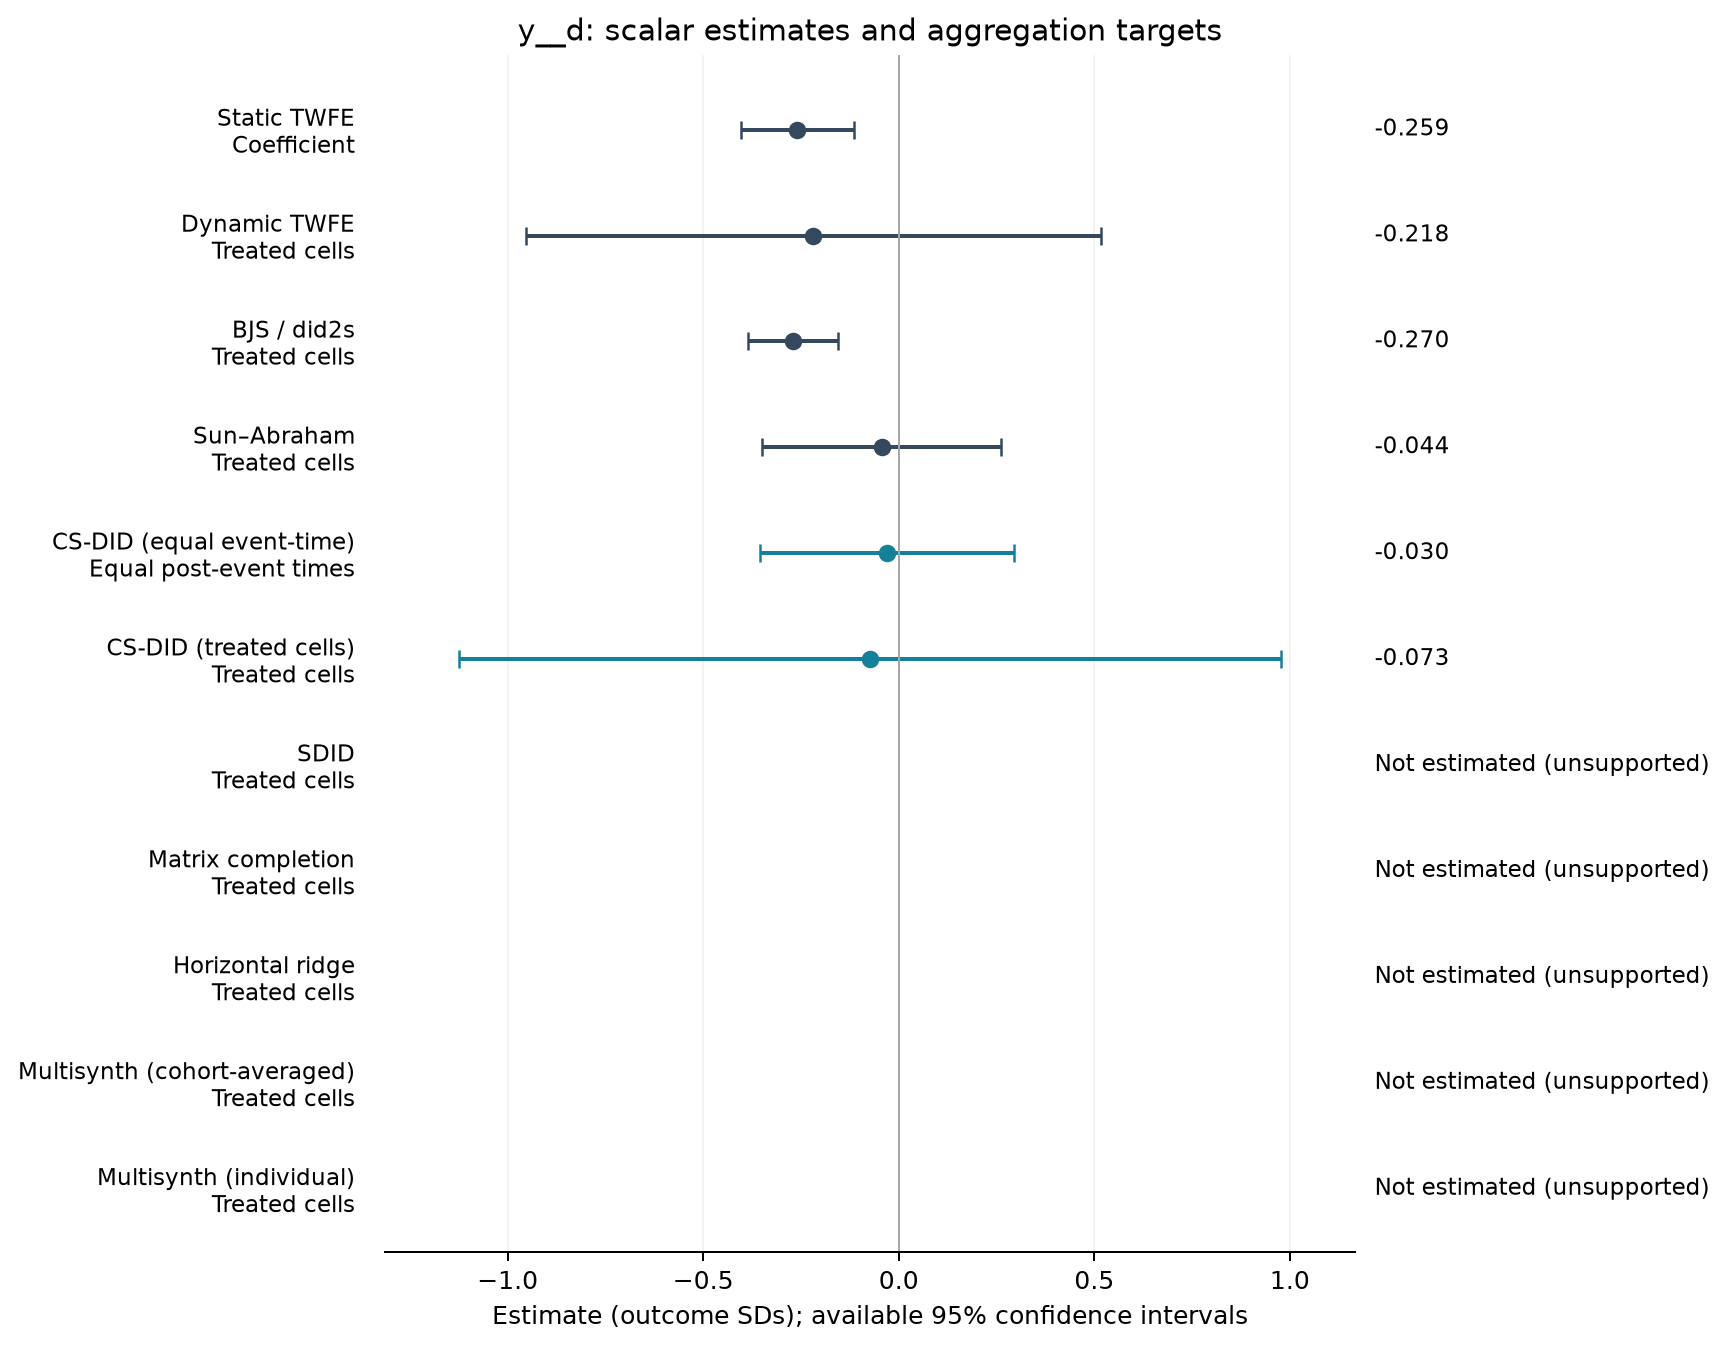
Estimate comparison
| Estimator | Estimate (SDs) | SE | 95% CI | Averaging |
|---|---|---|---|---|
| Static TWFE | -0.259 | 0.074 | [-0.404, -0.114] | Coefficient |
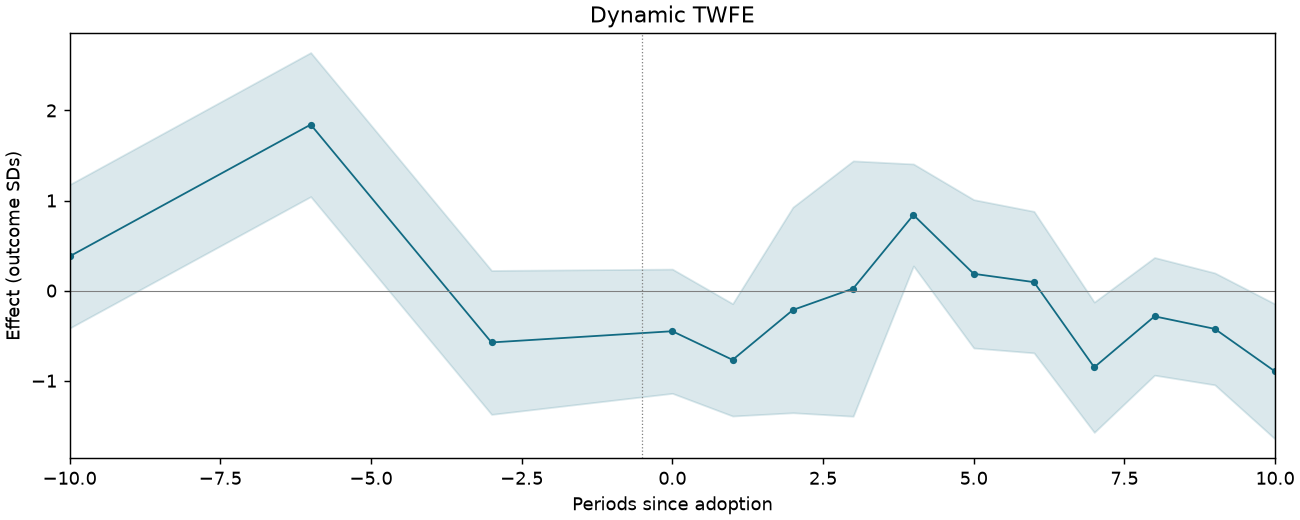
| Dynamic TWFE | -0.218 | 0.375 | [-0.953, 0.517] | Treated cells |
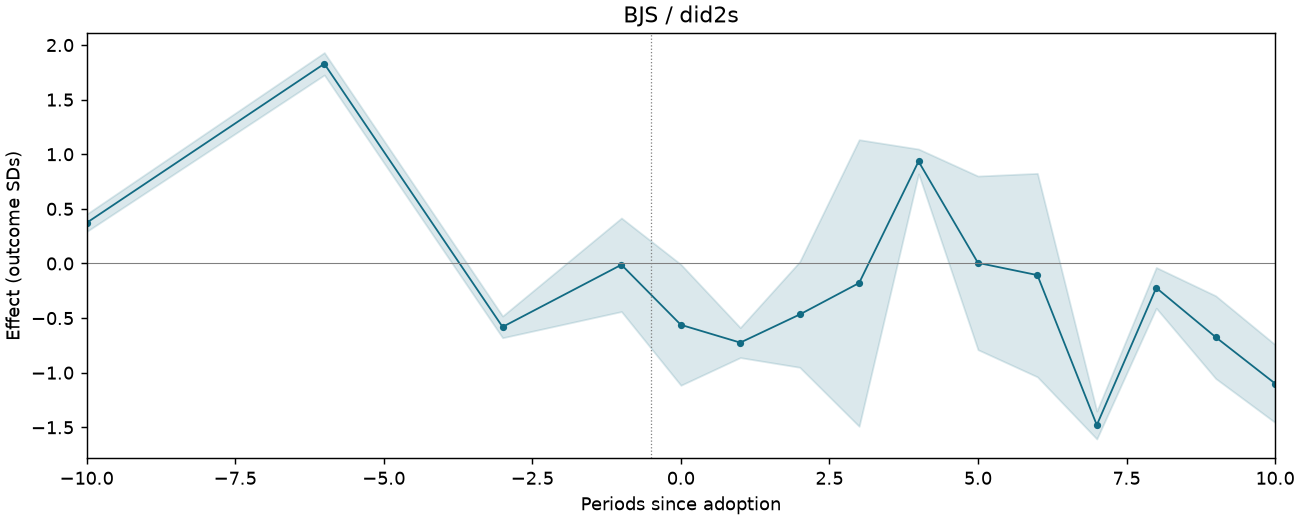
| BJS / did2s | -0.270 | 0.058 | [-0.384, -0.156] | Treated cells |
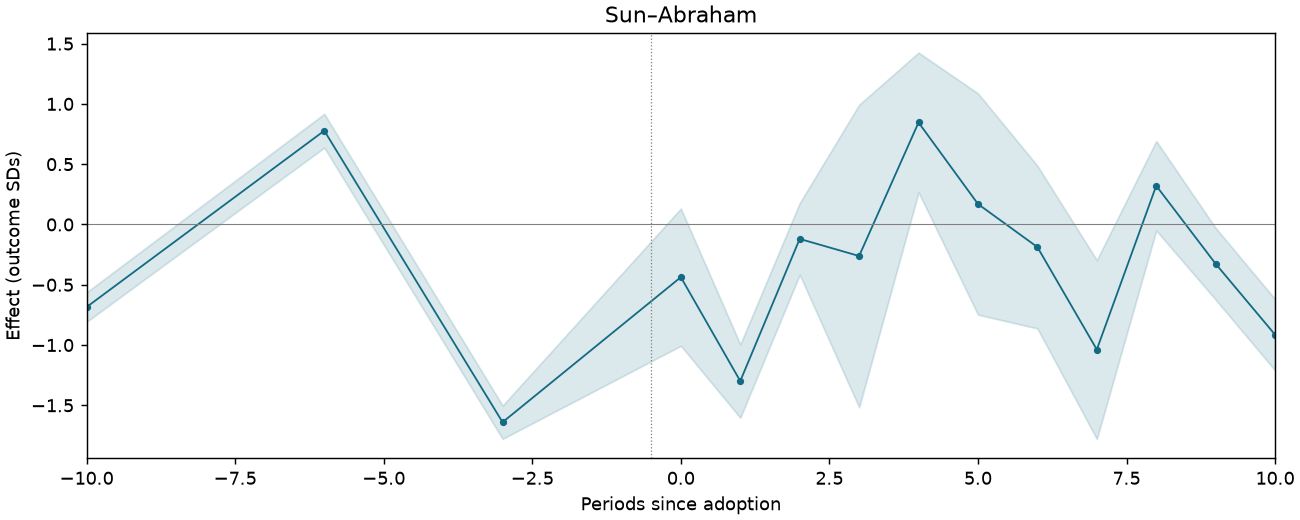
| Sun–Abraham | -0.044 | 0.156 | [-0.350, 0.263] | Treated cells |
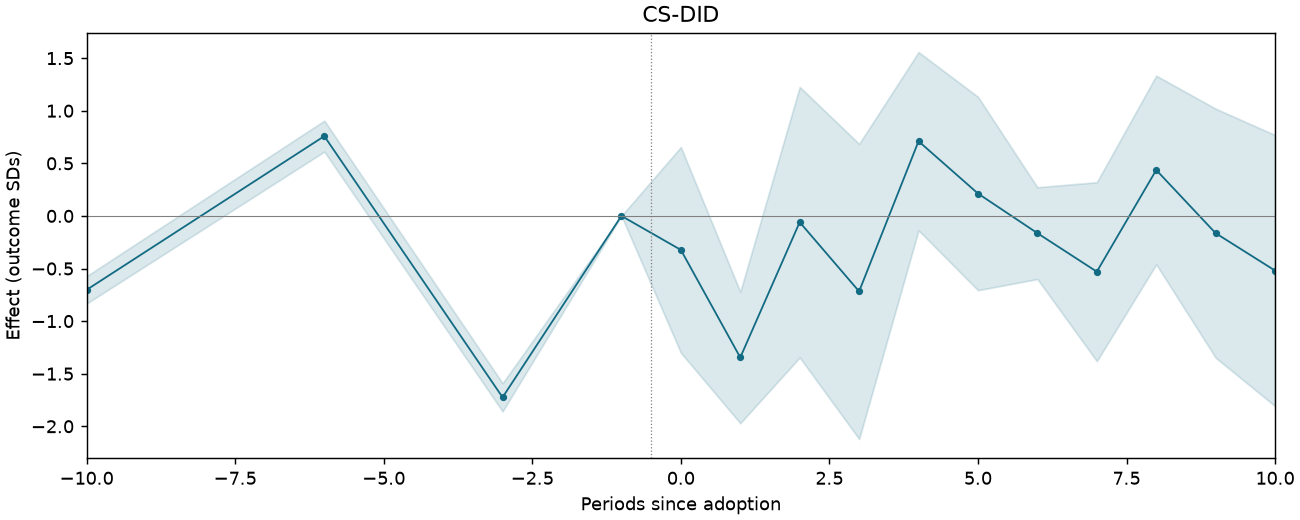
| CS-DID (equal event-time) | -0.030 | 0.165 | [-0.354, 0.294] | Equal post-event times |
| CS-DID (treated cells) | -0.073 | 0.536 | [-1.124, 0.978] | Treated cells |
Event studies
Periods −10 to +10; pointwise 95% intervals where available.
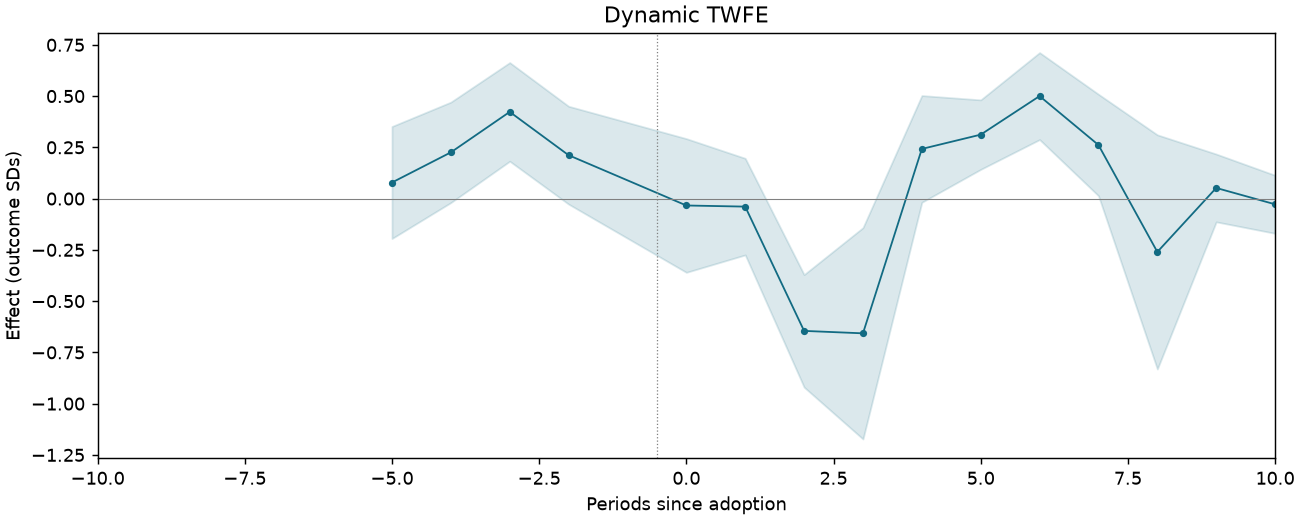
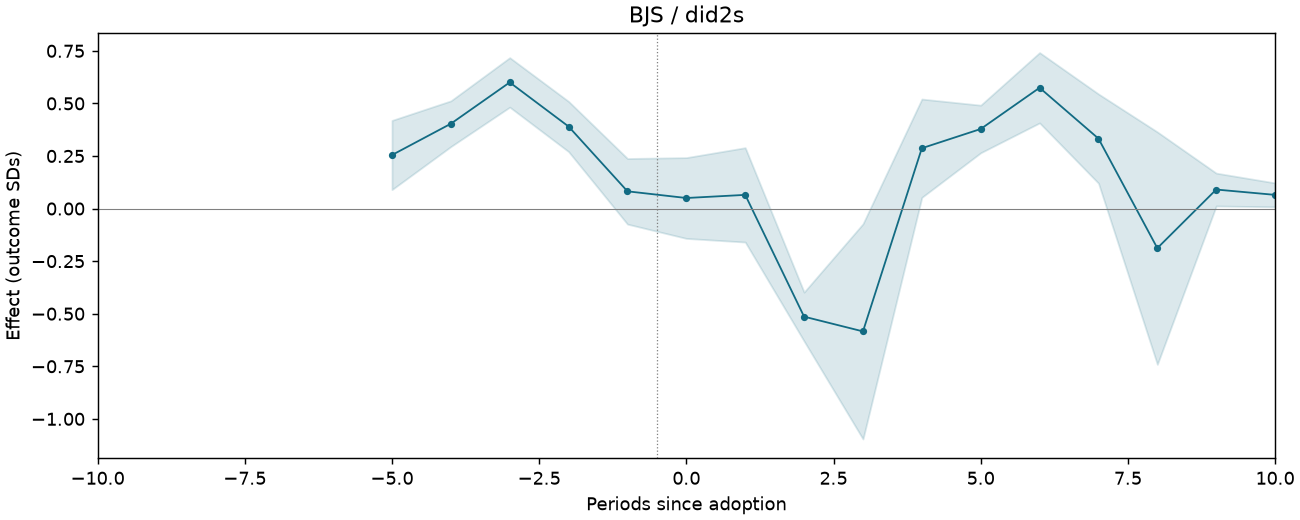
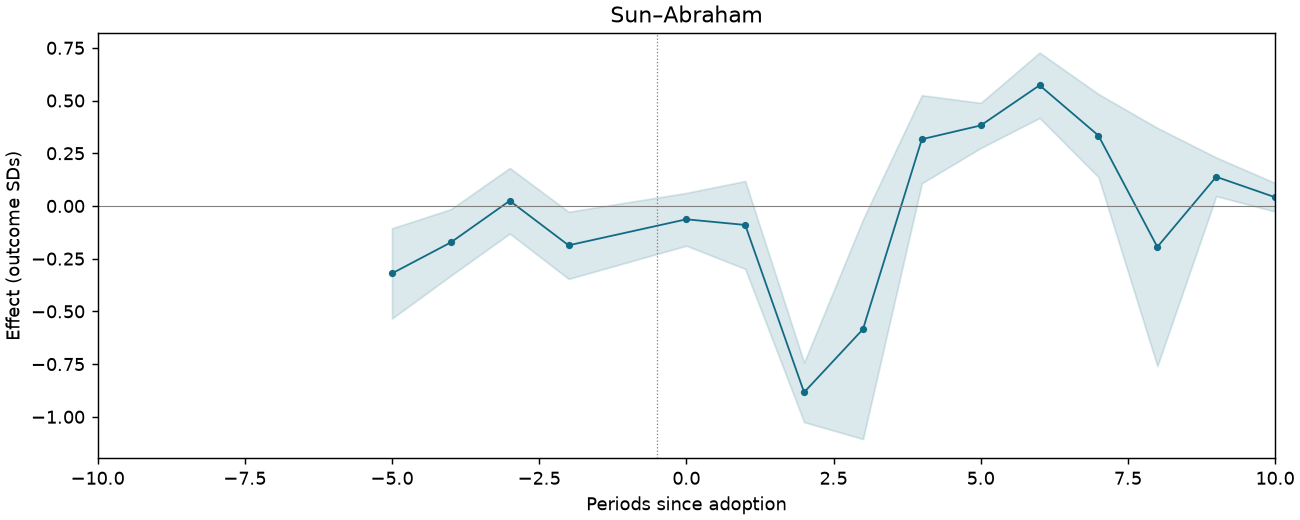
HHLT-T5-PB-C1-QUANTITY
218,915 observations · 12,429 units · 1,030 clusters · 5 treated / 12,424 control units.
Estimate comparison
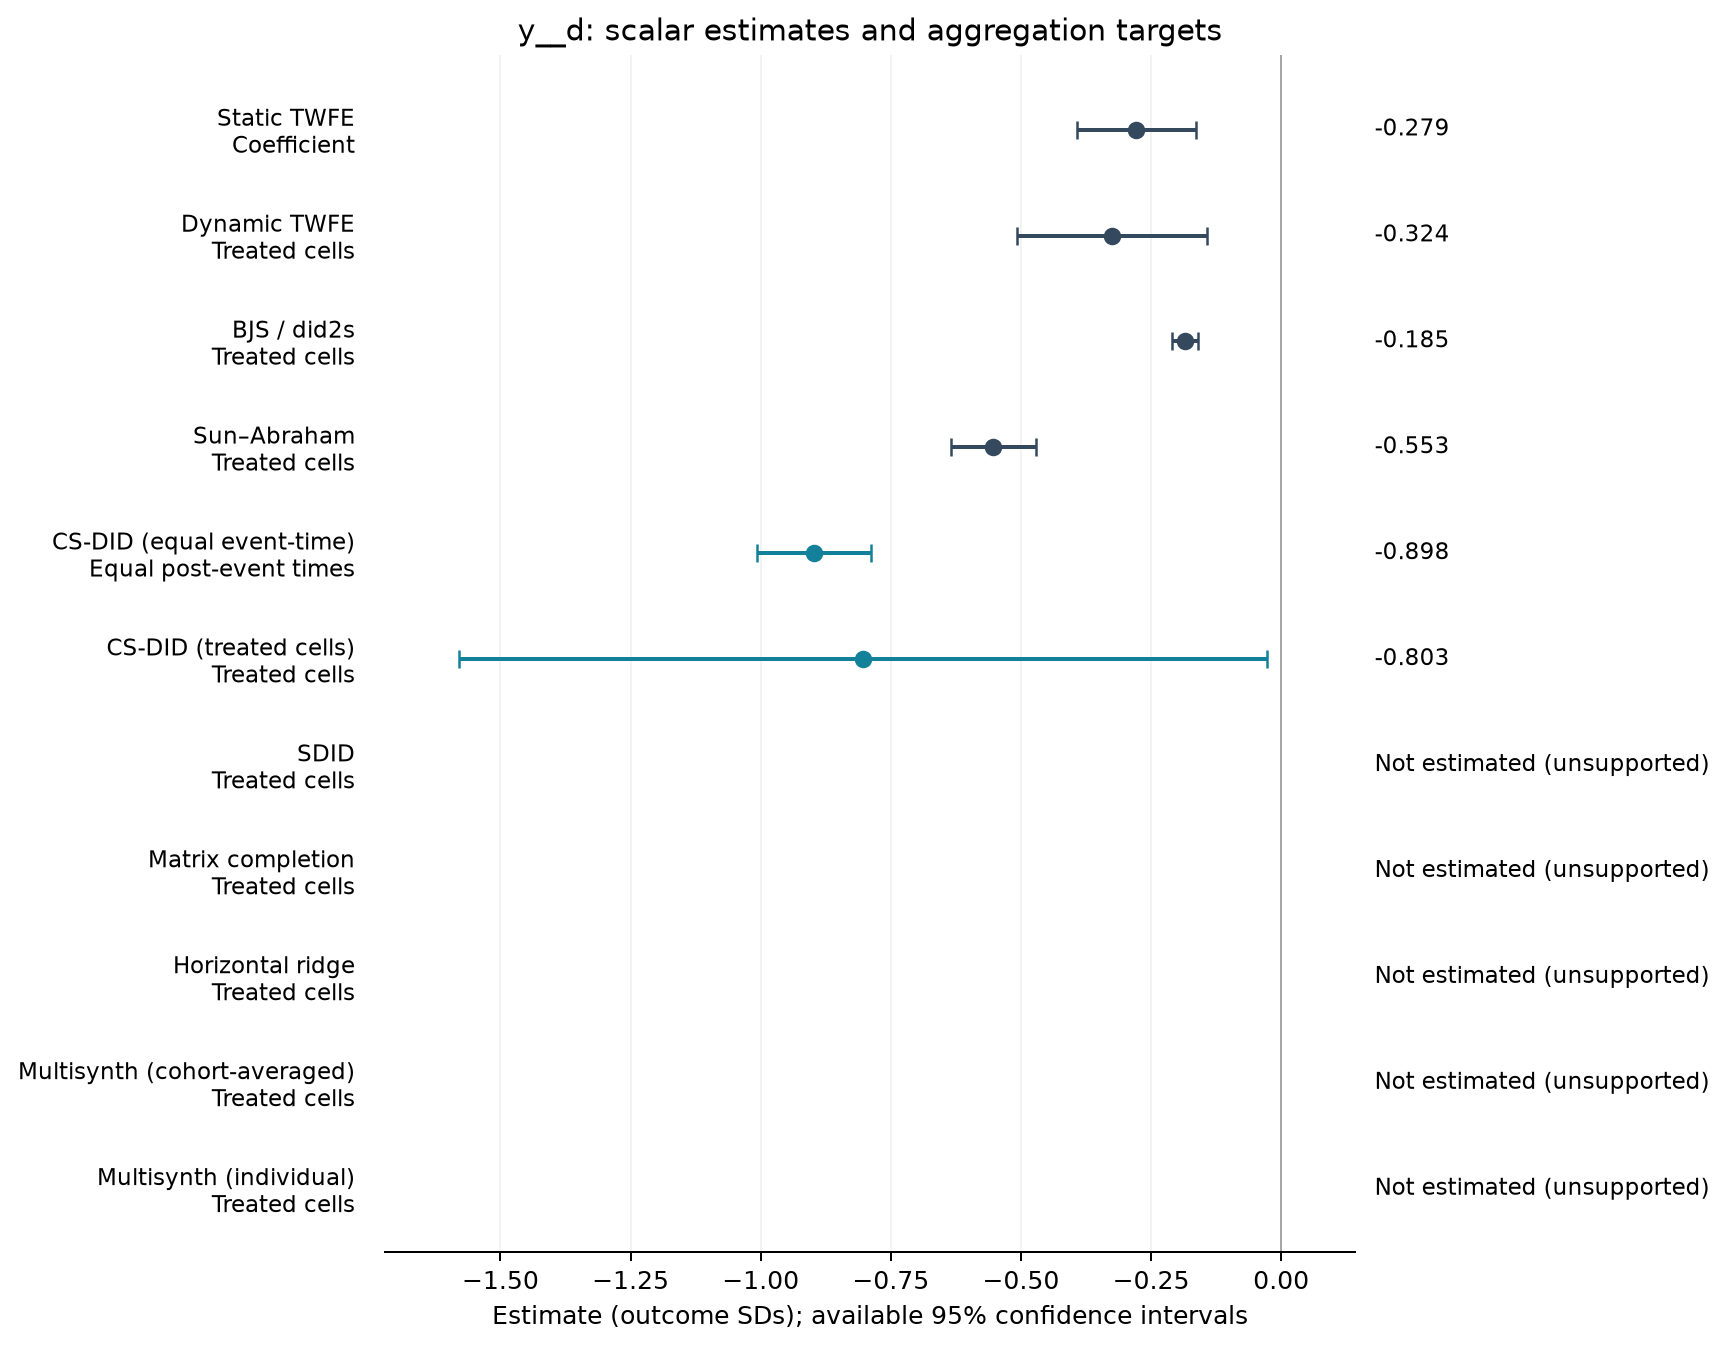
| Estimator | Estimate (SDs) | SE | 95% CI | Averaging |
|---|---|---|---|---|
| Static TWFE | -0.279 | 0.058 | [-0.393, -0.164] | Coefficient |
| Dynamic TWFE | -0.324 | 0.093 | [-0.507, -0.142] | Treated cells |
| BJS / did2s | -0.185 | 0.013 | [-0.210, -0.160] | Treated cells |
| Sun–Abraham | -0.553 | 0.041 | [-0.635, -0.472] | Treated cells |
| CS-DID (equal event-time) | -0.898 | 0.056 | [-1.008, -0.788] | Equal post-event times |
| CS-DID (treated cells) | -0.803 | 0.396 | [-1.580, -0.026] | Treated cells |
Event studies
Periods −10 to +10; pointwise 95% intervals where available.
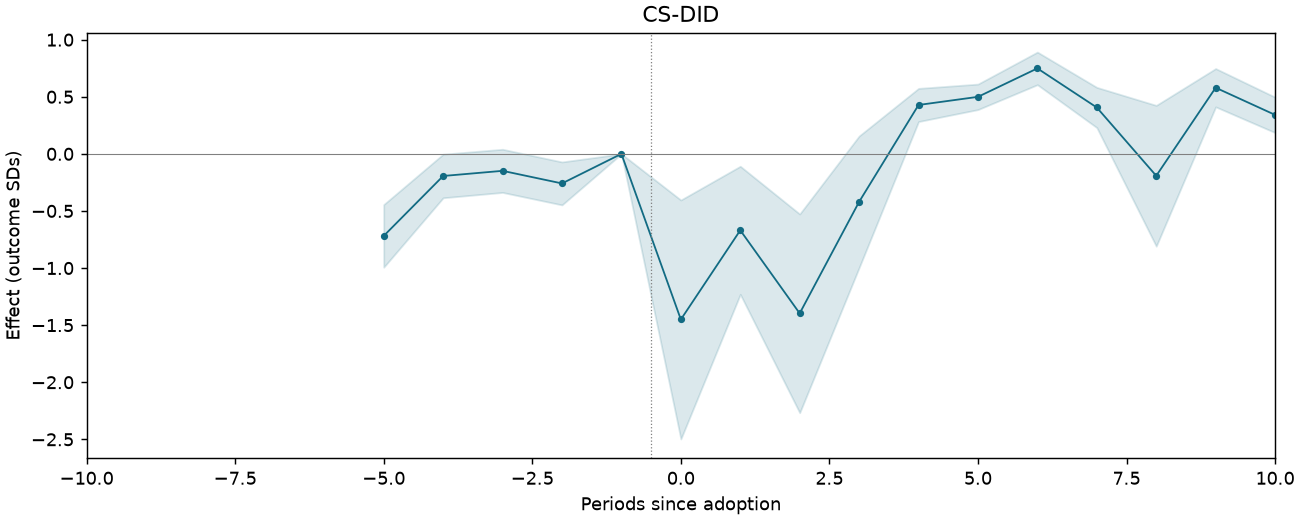
HHLT-T5-PB-C2-DISTANCE
96,966 observations · 7,939 units · 942 clusters · 4 treated / 7,935 control units.
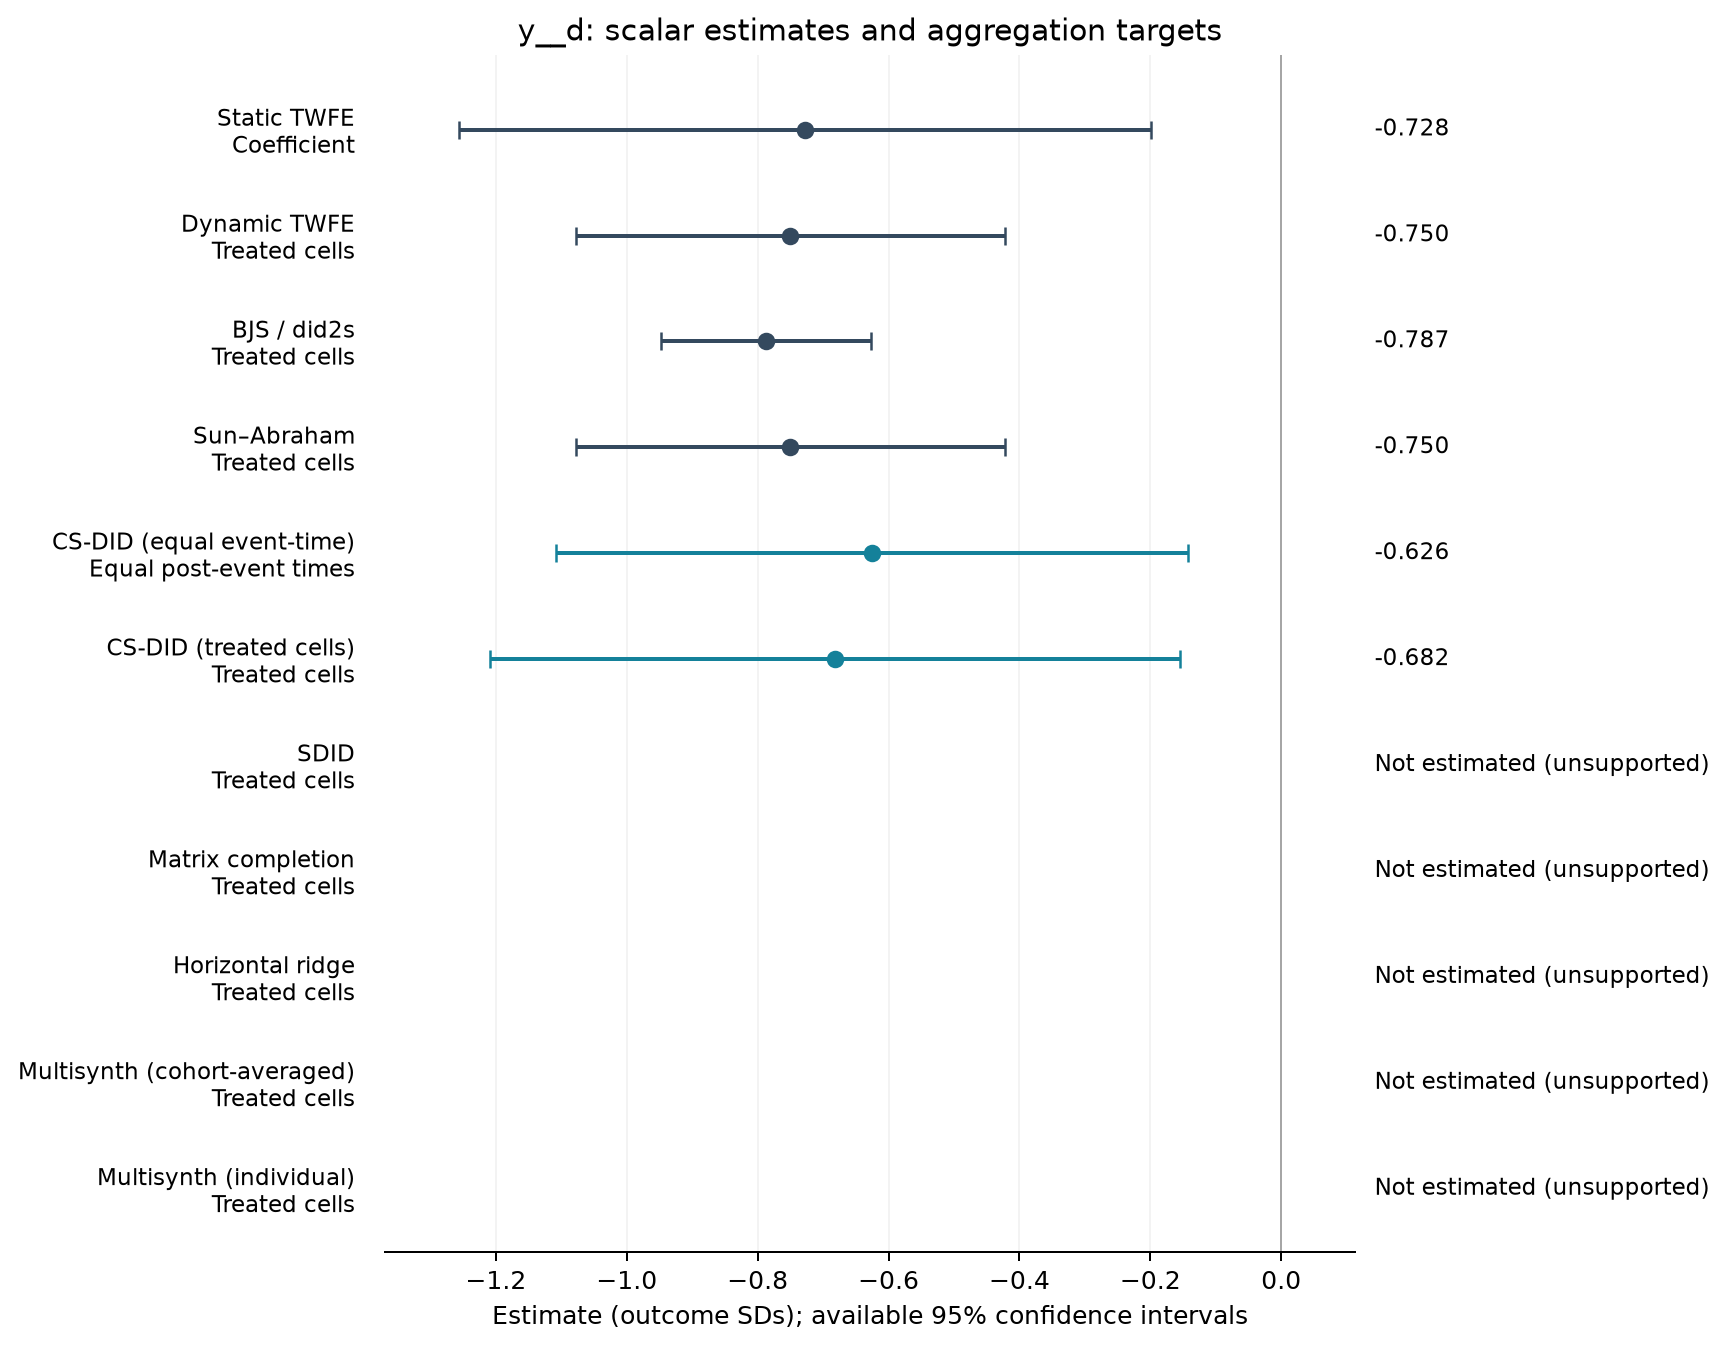
Estimate comparison
| Estimator | Estimate (SDs) | SE | 95% CI | Averaging |
|---|---|---|---|---|
| Static TWFE | -0.728 | 0.269 | [-1.256, -0.200] | Coefficient |
| Dynamic TWFE | -0.750 | 0.167 | [-1.078, -0.422] | Treated cells |
| BJS / did2s | -0.787 | 0.082 | [-0.947, -0.627] | Treated cells |
| Sun–Abraham | -0.750 | 0.167 | [-1.078, -0.422] | Treated cells |
| CS-DID (equal event-time) | -0.626 | 0.246 | [-1.109, -0.143] | Equal post-event times |
| CS-DID (treated cells) | -0.682 | 0.269 | [-1.209, -0.155] | Treated cells |
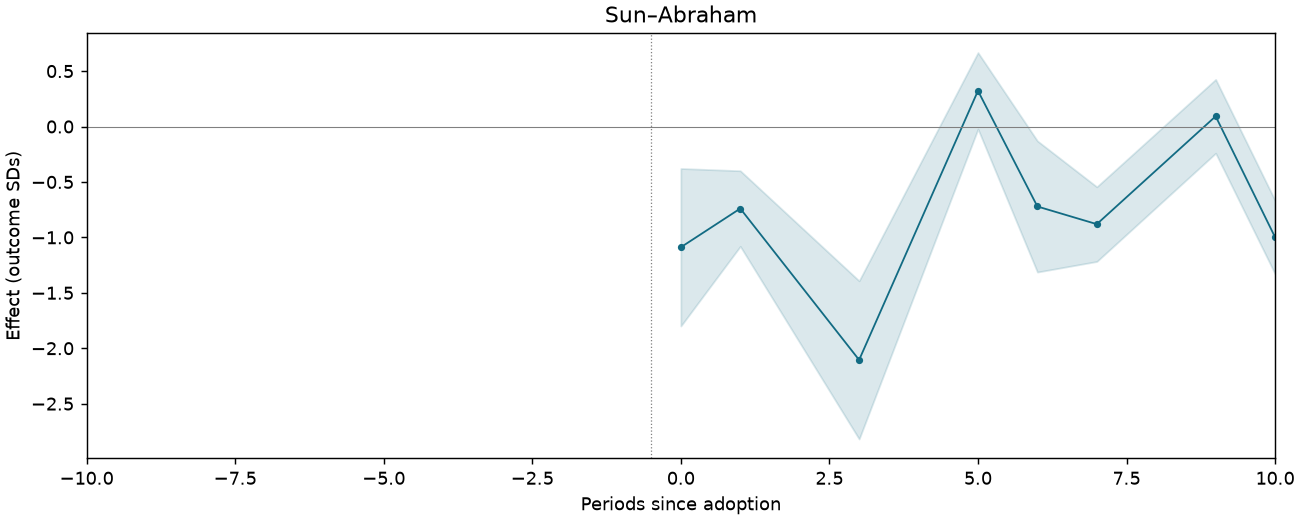
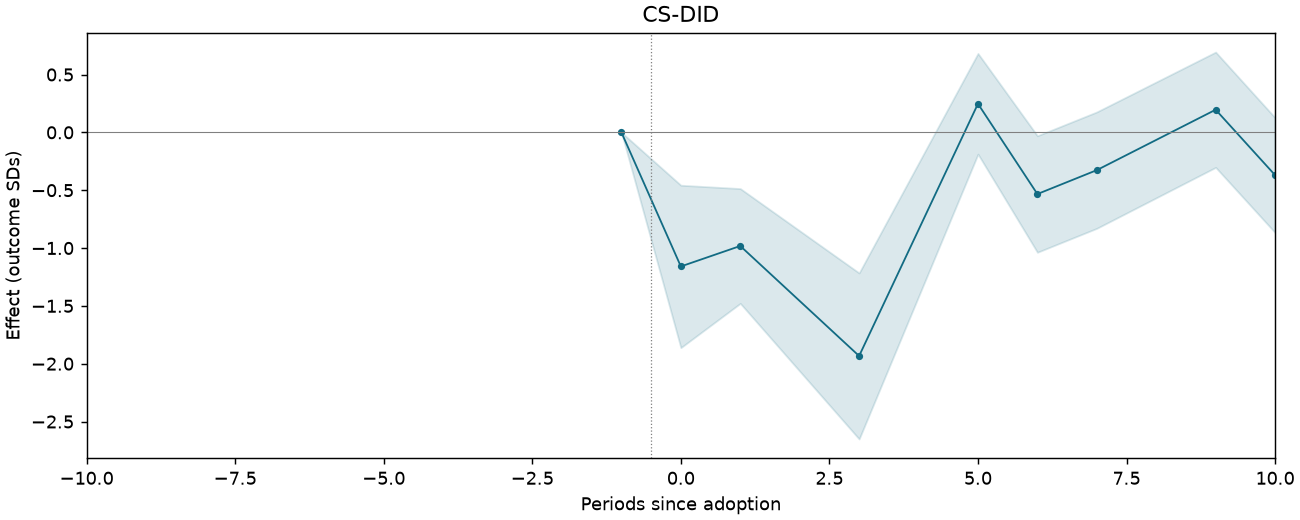
Event studies
Periods −10 to +10; pointwise 95% intervals where available.
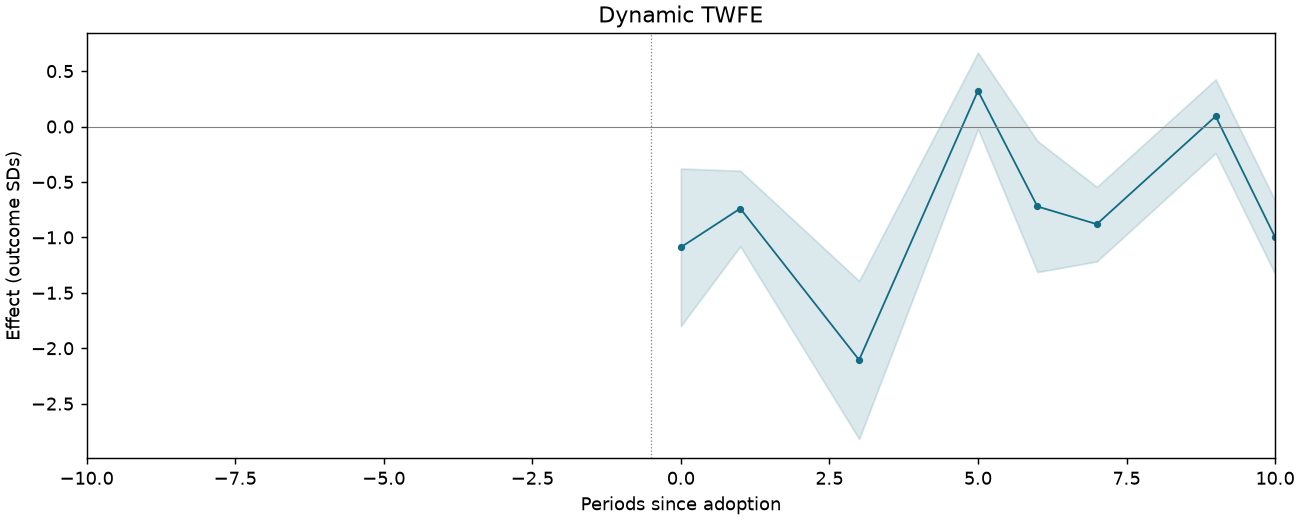
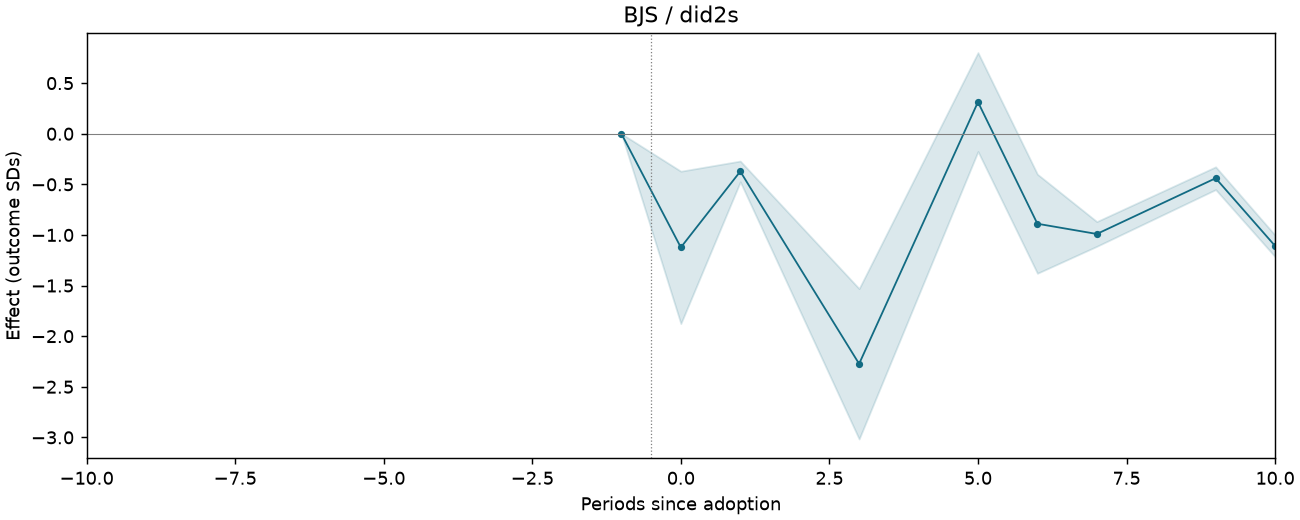
HHLT-T5-PB-C3-TIMESEA
110,998 observations · 8,784 units · 951 clusters · 4 treated / 8,780 control units.
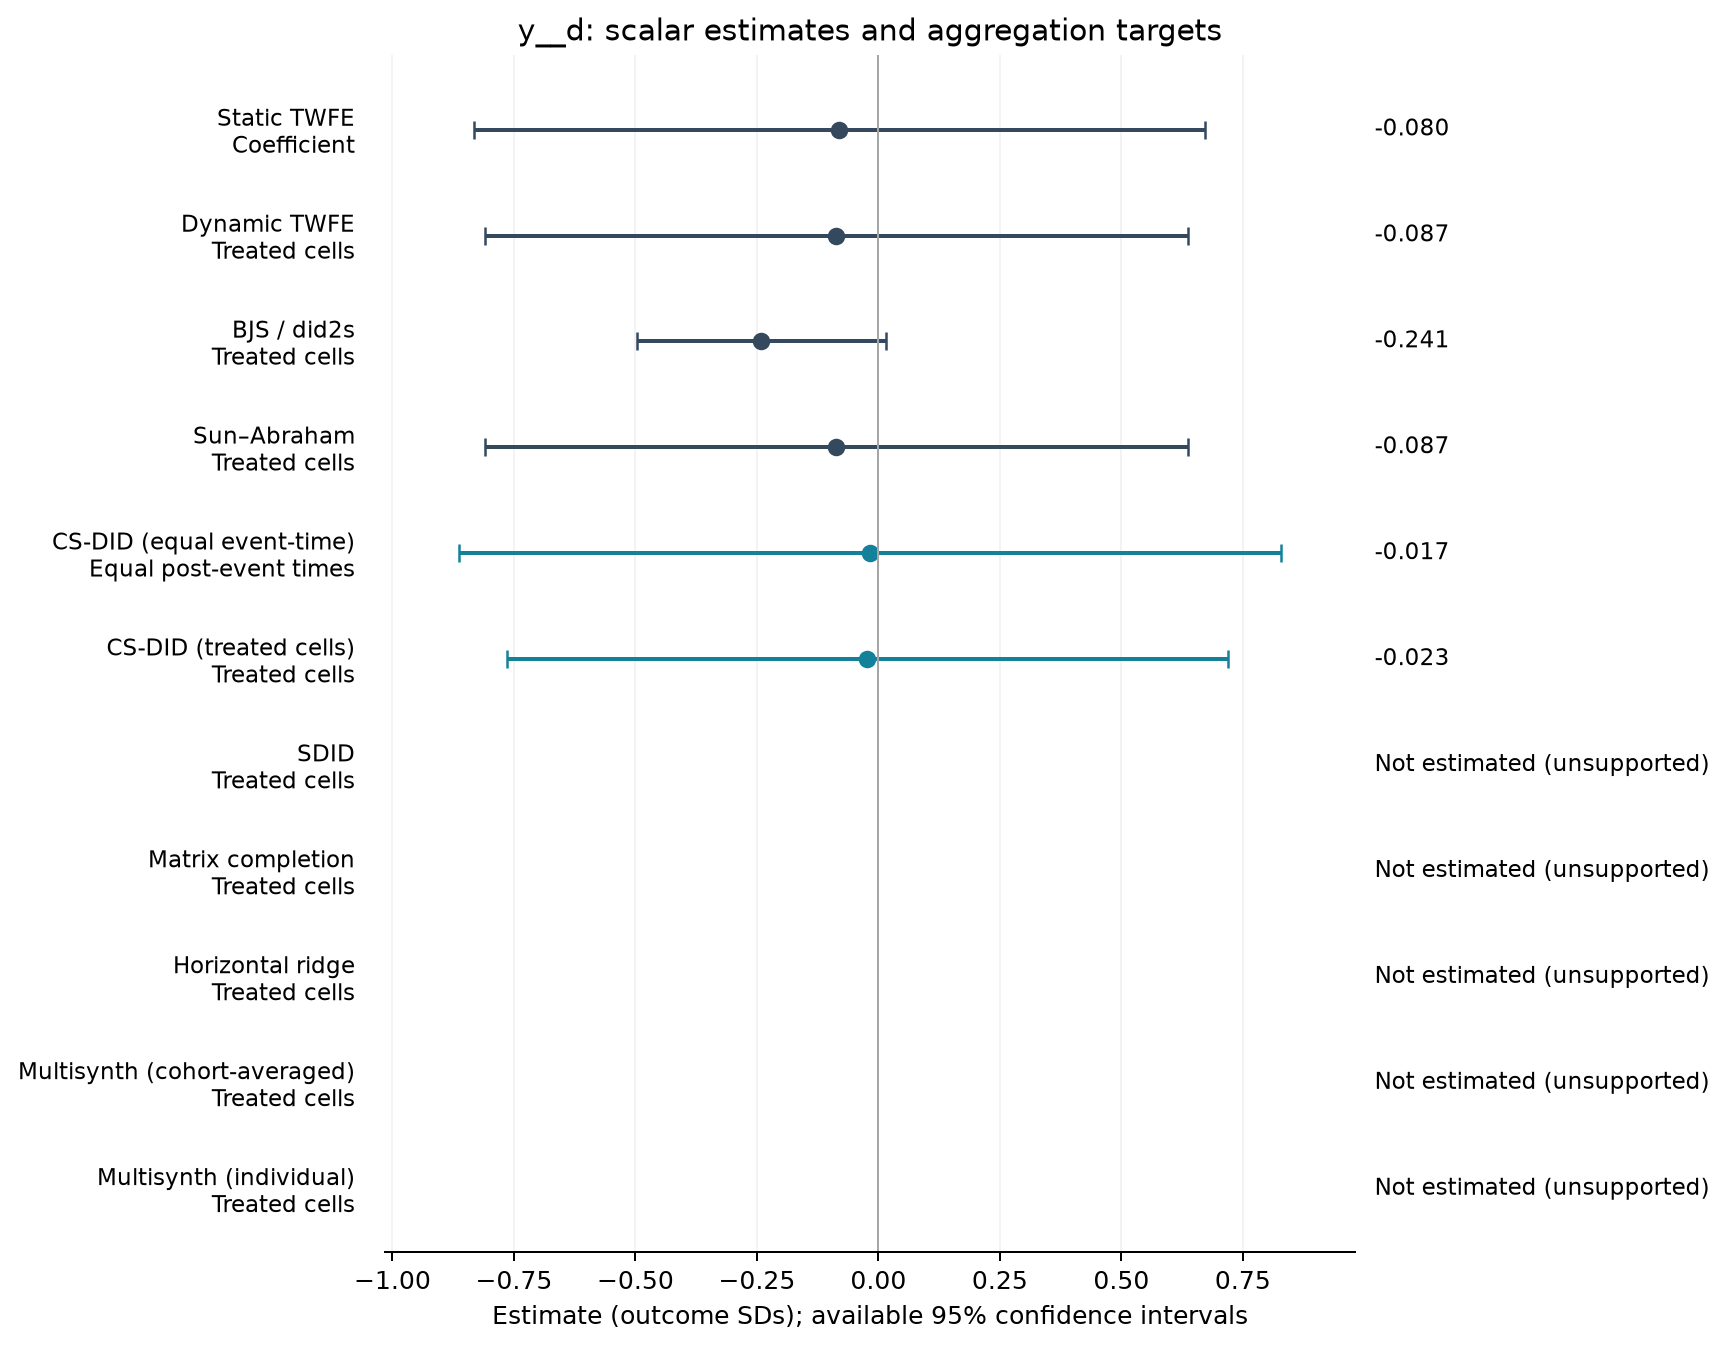
Estimate comparison
| Estimator | Estimate (SDs) | SE | 95% CI | Averaging |
|---|---|---|---|---|
| Static TWFE | -0.080 | 0.383 | [-0.832, 0.672] | Coefficient |
| Dynamic TWFE | -0.087 | 0.369 | [-0.810, 0.637] | Treated cells |
| BJS / did2s | -0.241 | 0.130 | [-0.497, 0.015] | Treated cells |
| Sun–Abraham | -0.087 | 0.369 | [-0.810, 0.637] | Treated cells |
| CS-DID (equal event-time) | -0.017 | 0.432 | [-0.863, 0.829] | Equal post-event times |
| CS-DID (treated cells) | -0.023 | 0.379 | [-0.765, 0.720] | Treated cells |
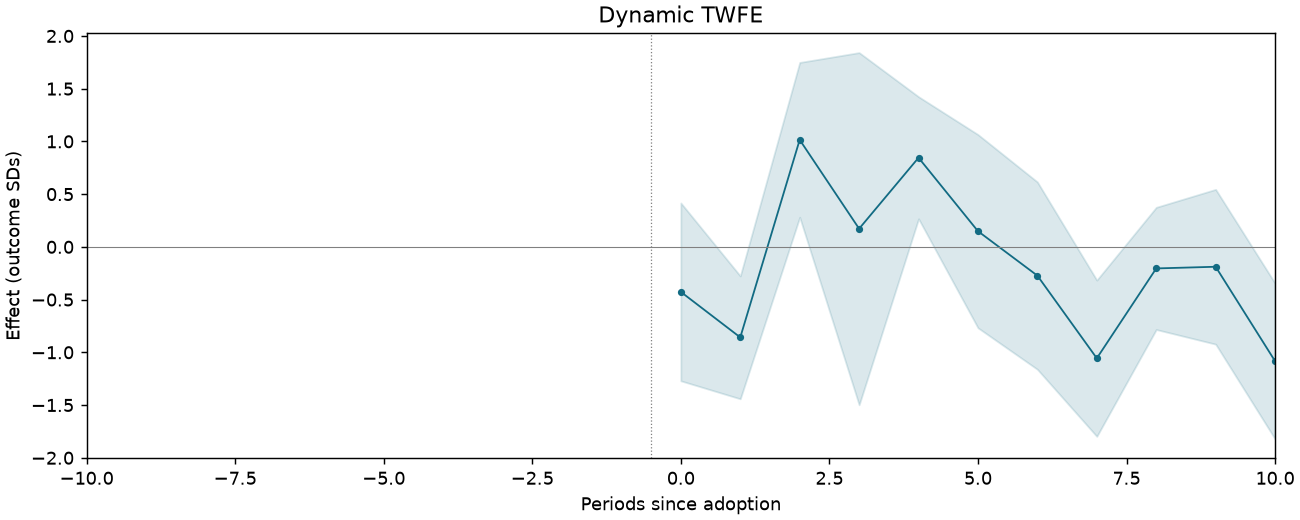
Event studies
Periods −10 to +10; pointwise 95% intervals where available.
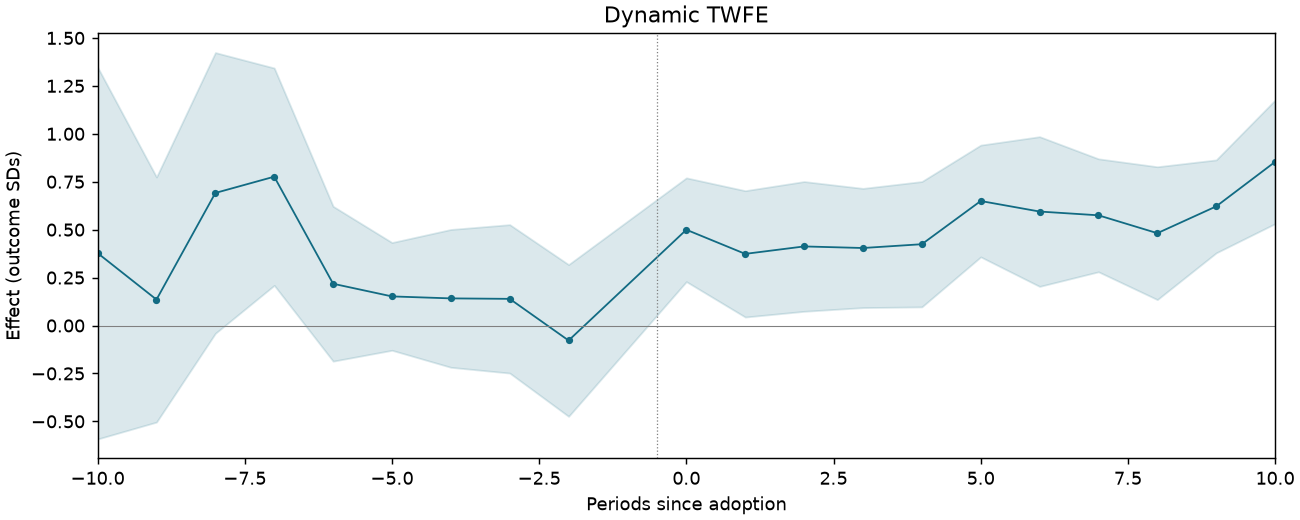
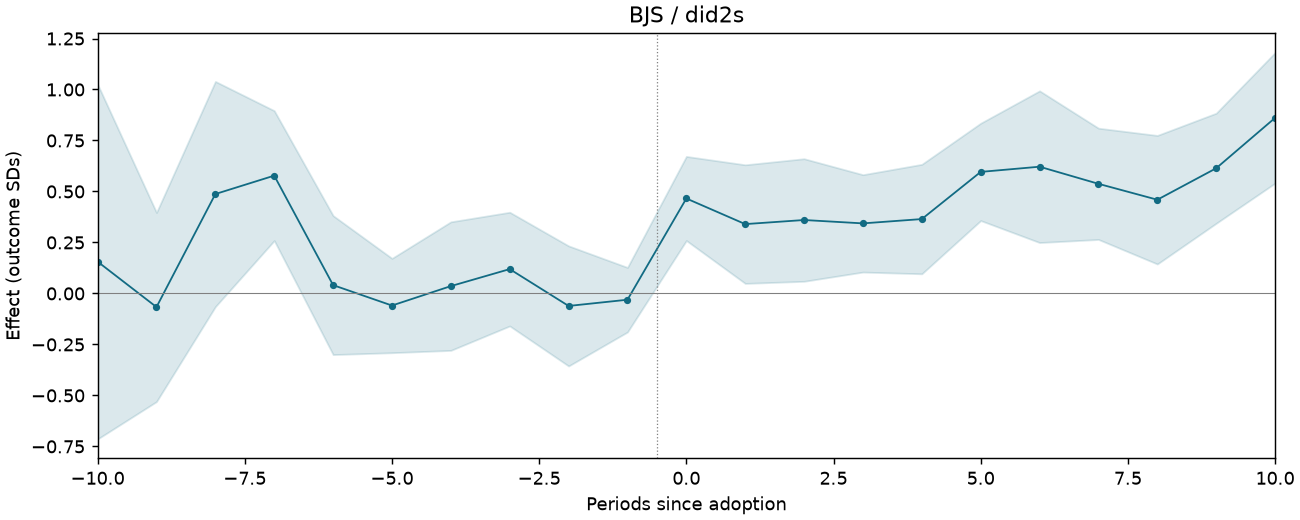
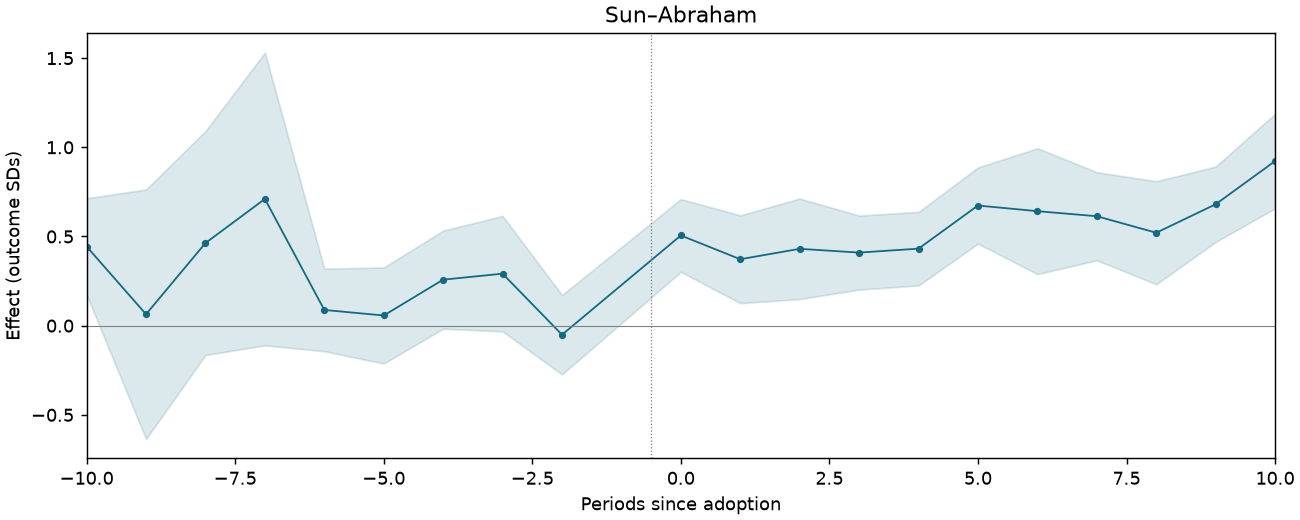
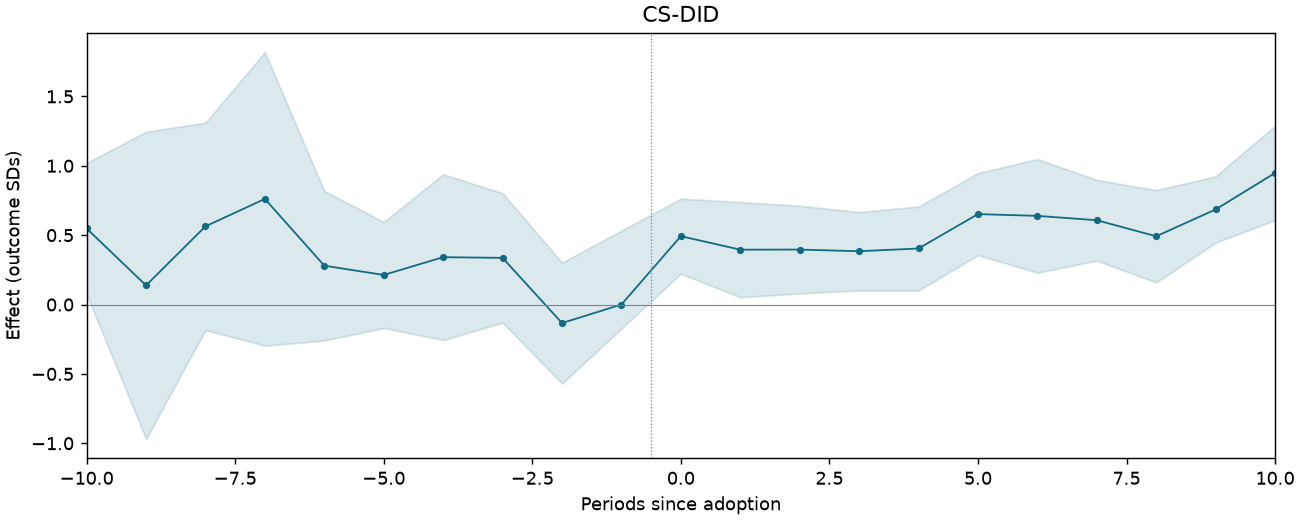
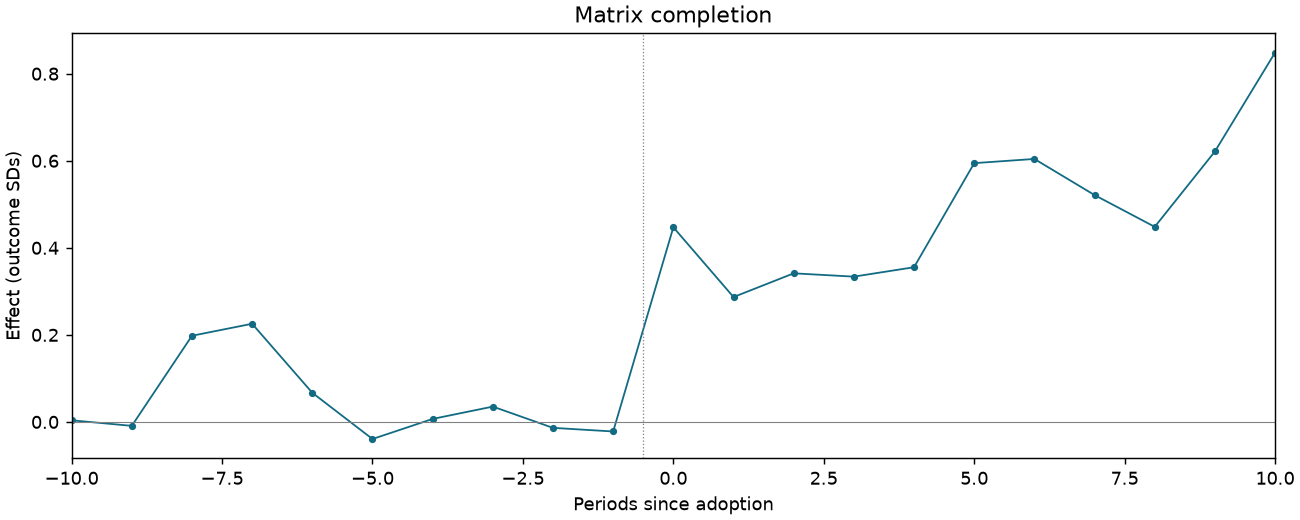
HHLT-T5-PC-C1-TRIPS
9,742 observations · 820 units · 820 clusters · 47 treated / 773 control units.
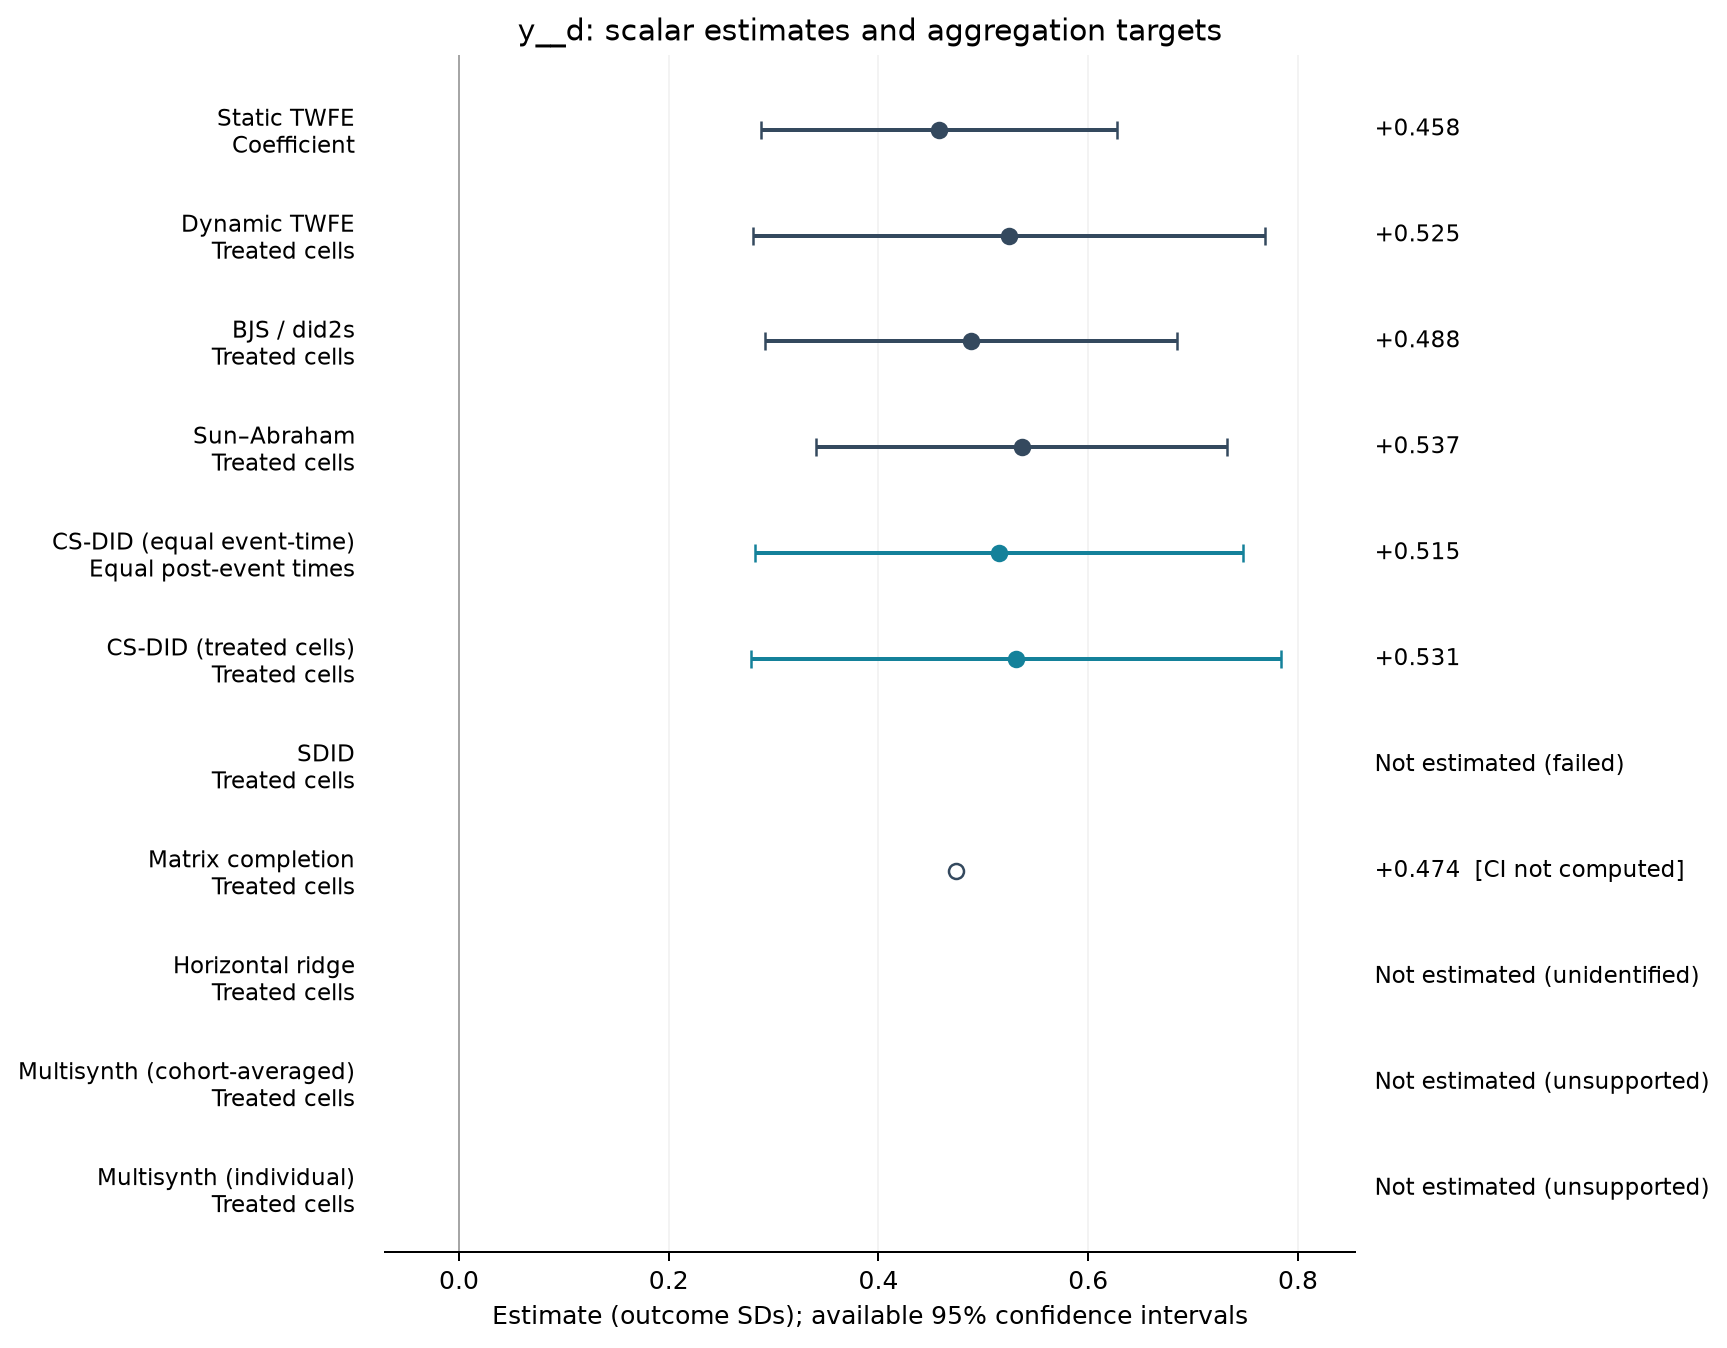
Estimate comparison
| Estimator | Estimate (SDs) | SE | 95% CI | Averaging |
|---|---|---|---|---|
| Static TWFE | 0.458 | 0.087 | [0.288, 0.628] | Coefficient |
| Dynamic TWFE | 0.525 | 0.125 | [0.280, 0.769] | Treated cells |
| BJS / did2s | 0.488 | 0.100 | [0.292, 0.685] | Treated cells |
| Sun–Abraham | 0.537 | 0.100 | [0.341, 0.733] | Treated cells |
| CS-DID (equal event-time) | 0.515 | 0.119 | [0.283, 0.748] | Equal post-event times |
| CS-DID (treated cells) | 0.531 | 0.129 | [0.278, 0.784] | Treated cells |
| Matrix completion | 0.474 | — | — | Treated cells |
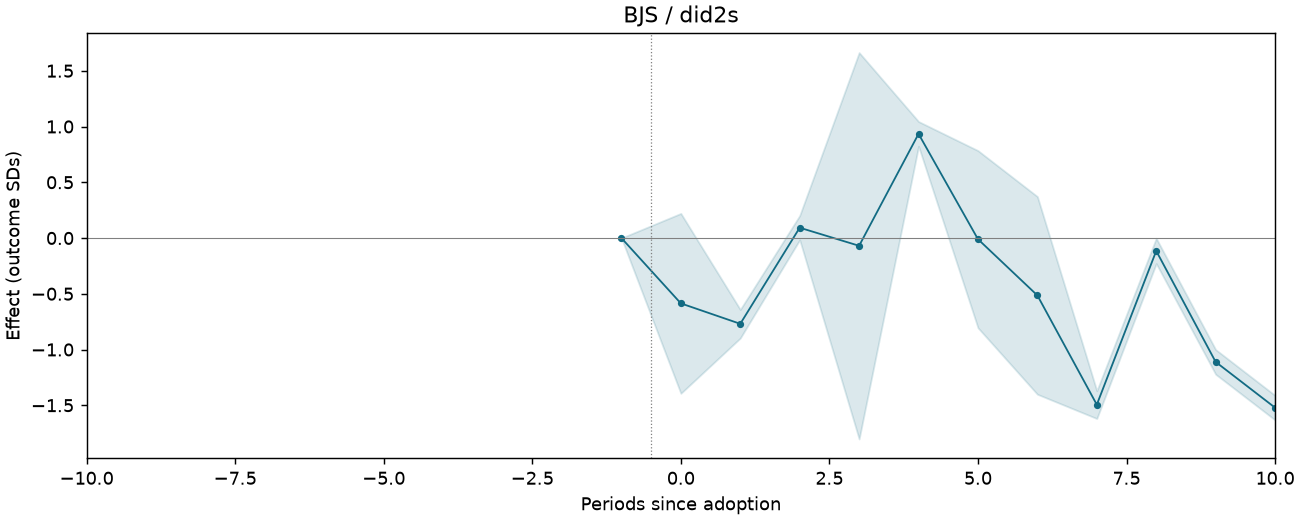
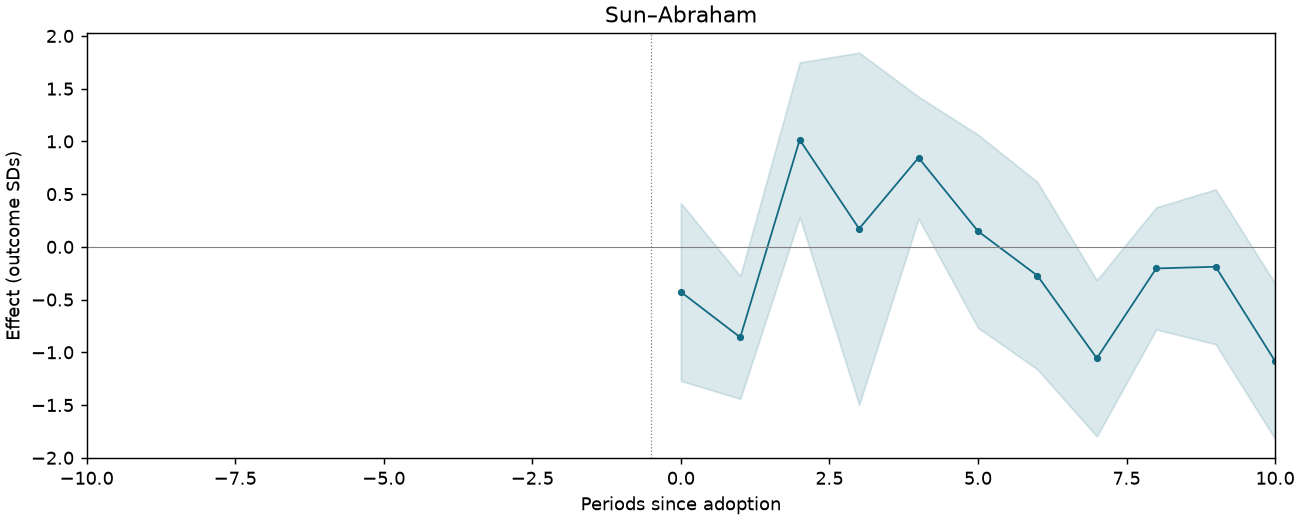
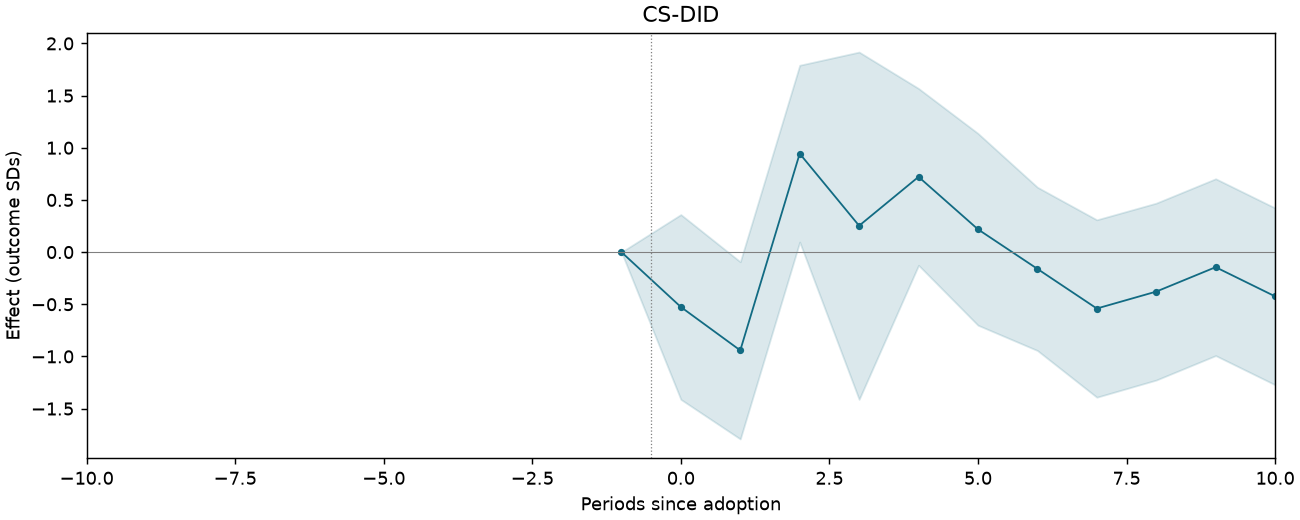
Event studies
Periods −10 to +10; pointwise 95% intervals where available.