Railroads of the Raj — expanded estimators
Archive index · Regression tests · Results & settings (JSON) · Methods & code
Donaldson (2018), AER. https://doi.org/10.1257/aer.20101199
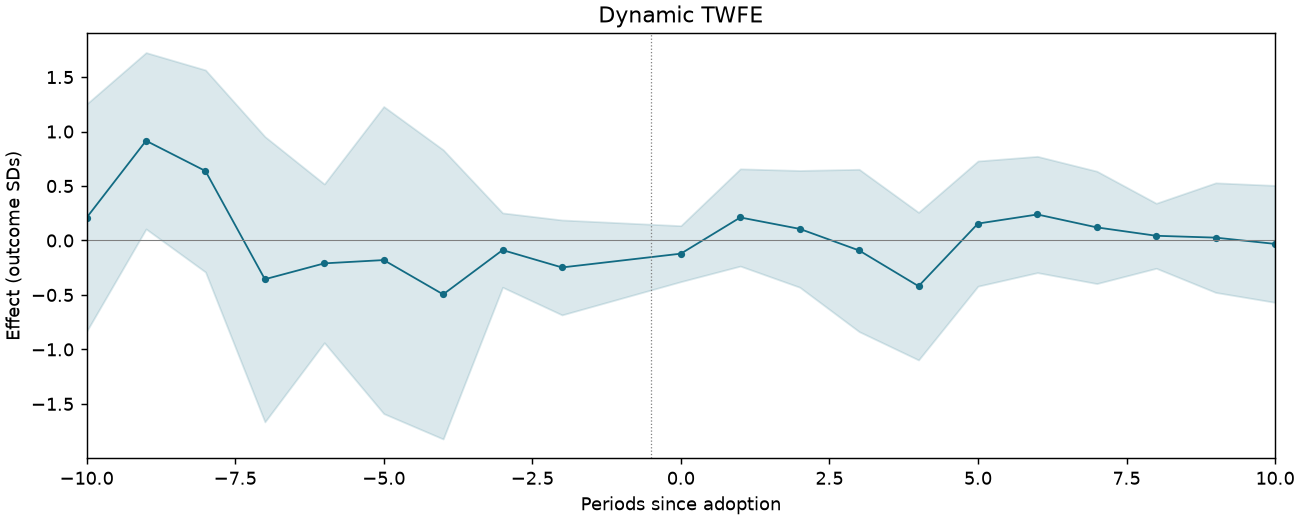
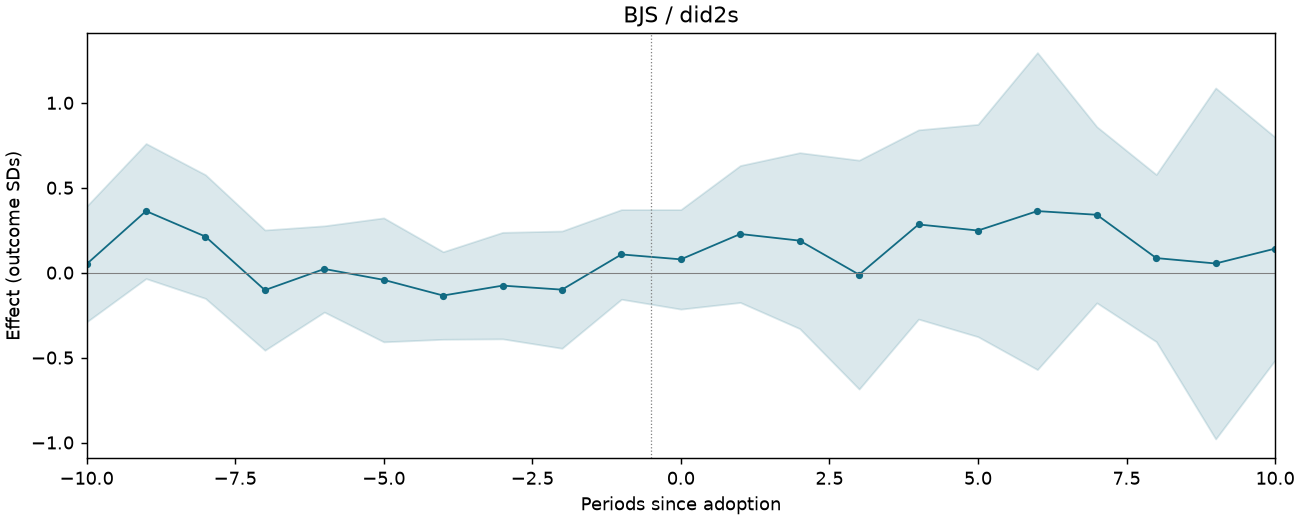
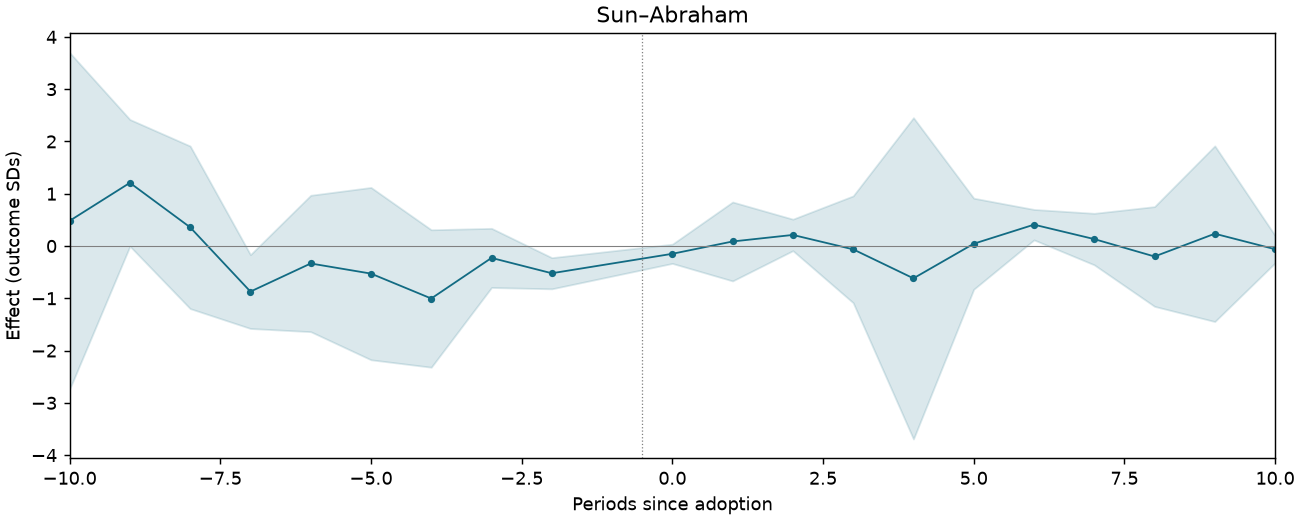
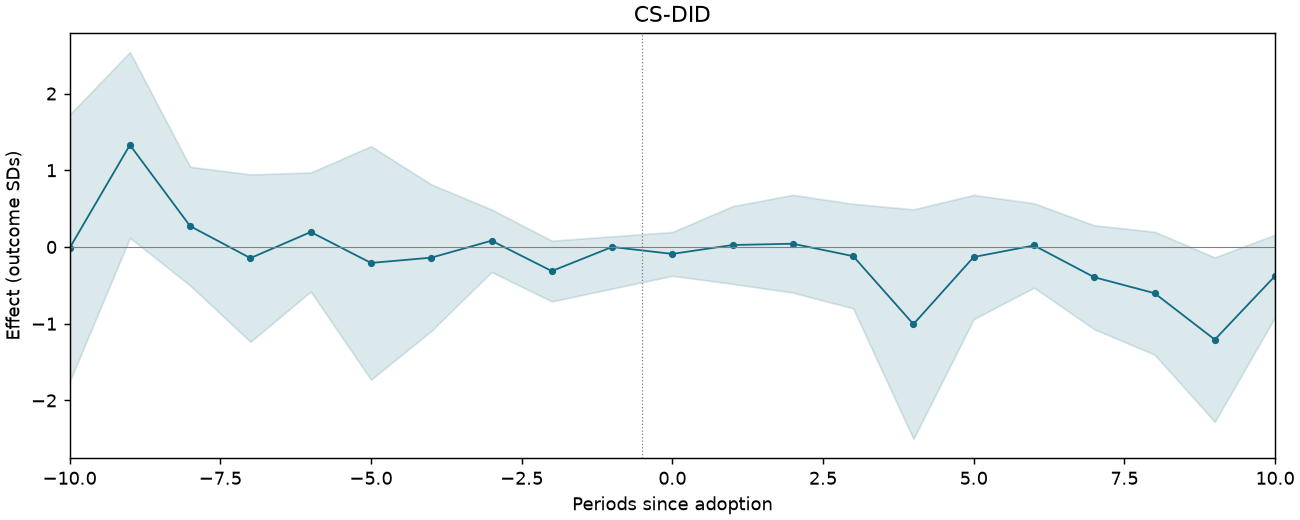
1 specification. Effects are in outcome standard deviations; intervals are 95%.
Treatment adoption

S06-P001: seeded sample of 9 of 9 eligible units. Purple untreated; yellow treated; white unobserved.
Log real agricultural income per acre
278 observations · 9 units · 9 clusters · 6 treated / 3 control units.
Estimate comparison
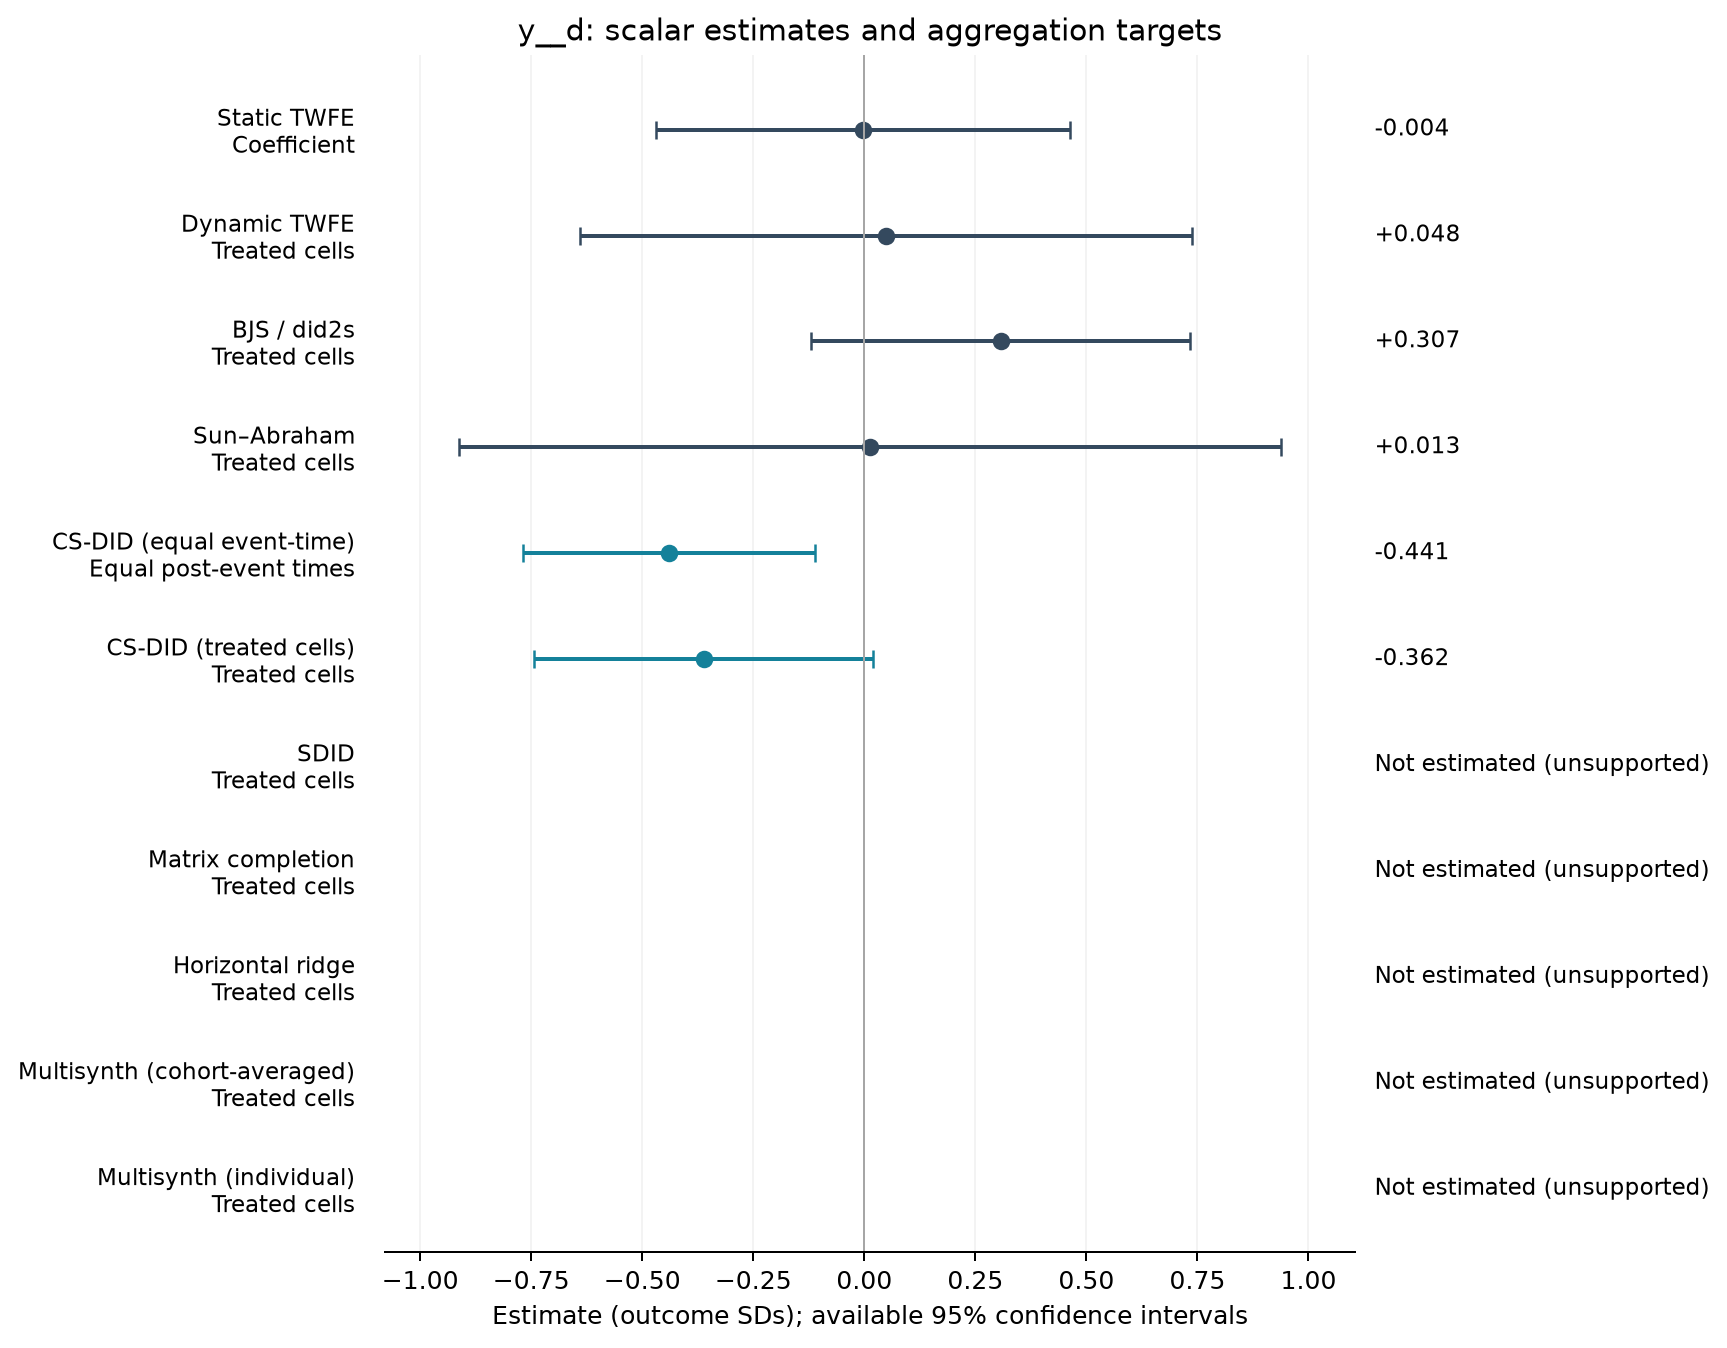
| Estimator | Estimate (SDs) | SE | 95% CI | Averaging |
|---|---|---|---|---|
| Static TWFE | -0.004 | 0.202 | [-0.470, 0.463] | Coefficient |
| Dynamic TWFE | 0.048 | 0.299 | [-0.641, 0.737] | Treated cells |
| BJS / did2s | 0.307 | 0.185 | [-0.120, 0.733] | Treated cells |
| Sun–Abraham | 0.013 | 0.401 | [-0.913, 0.939] | Treated cells |
| CS-DID (equal event-time) | -0.441 | 0.168 | [-0.769, -0.112] | Equal post-event times |
| CS-DID (treated cells) | -0.362 | 0.195 | [-0.743, 0.020] | Treated cells |
Event studies
Periods −10 to +10; pointwise 95% intervals where available.