Do Government Audits Reduce Corruption? — expanded estimators
Archive index · Regression tests · Results & settings (JSON) · Methods & code
Avis et al. (2018), JPE. https://doi.org/10.1086/699209
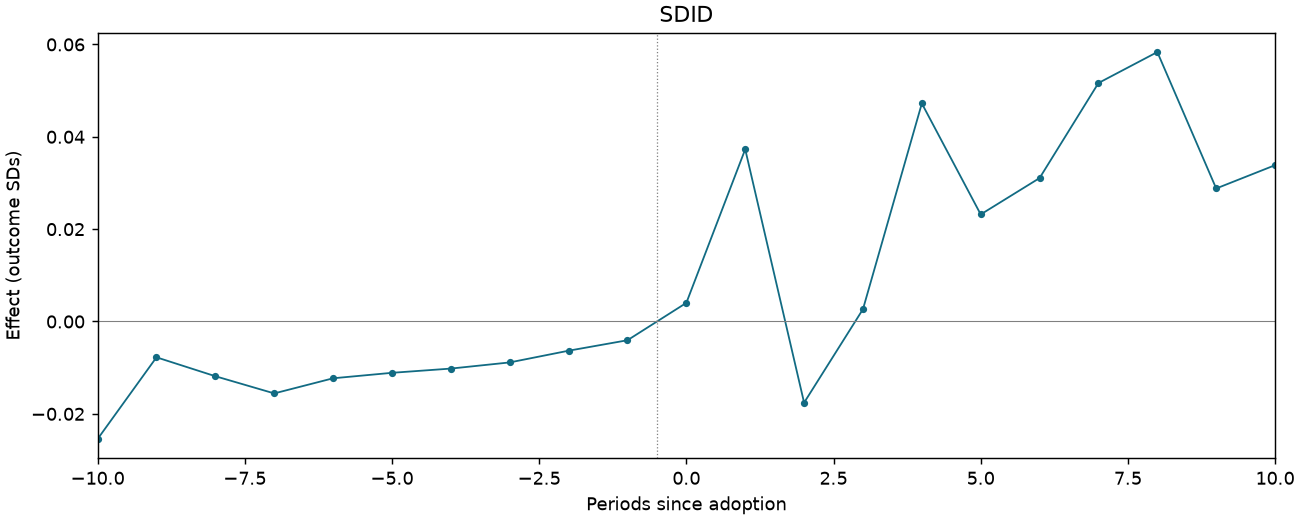
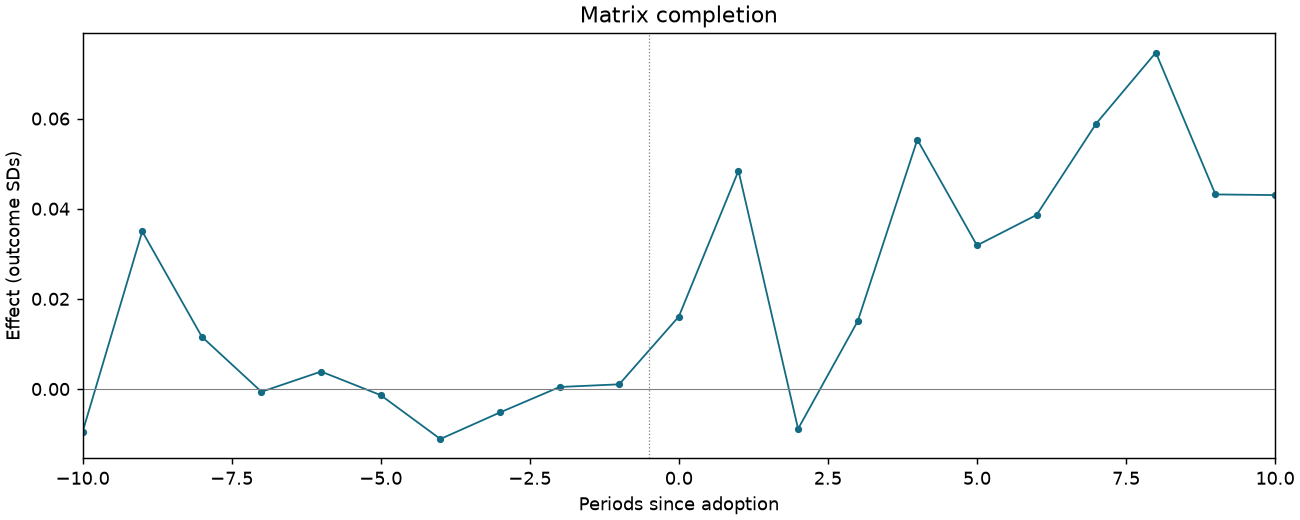
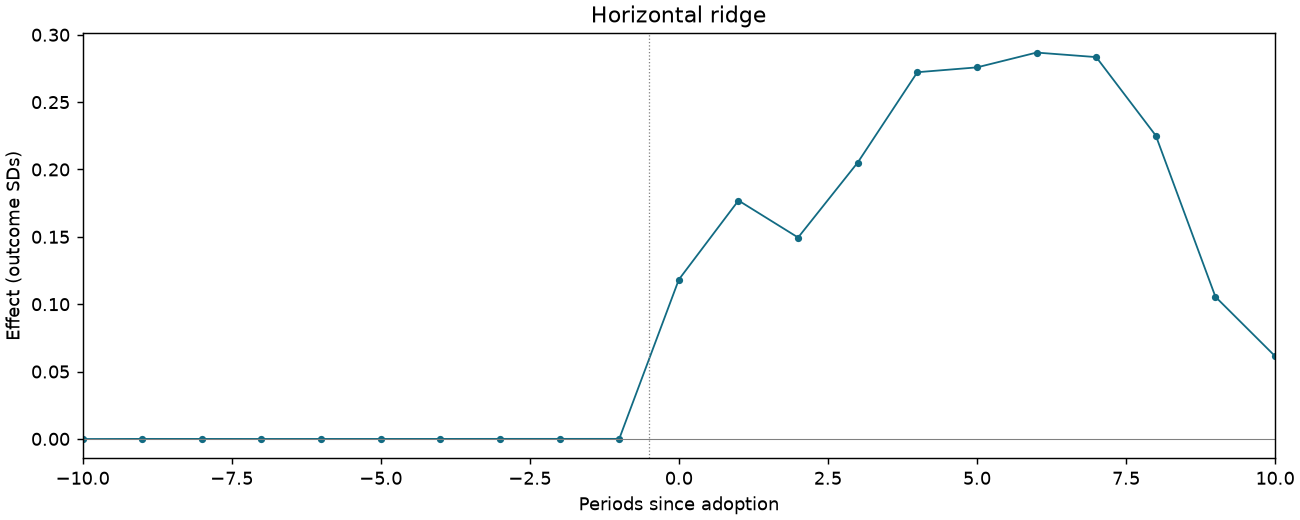
3 specifications. Effects are in outcome standard deviations; intervals are 95%.
Treatment adoption

S05-P001: seeded sample of 100 of 5,174 eligible units. Purple untreated; yellow treated; white unobserved.
AUDITS-T4-C1-CRACKDOWN
67,262 observations · 5,174 units · 5,174 clusters · 1,651 treated / 3,523 control units.
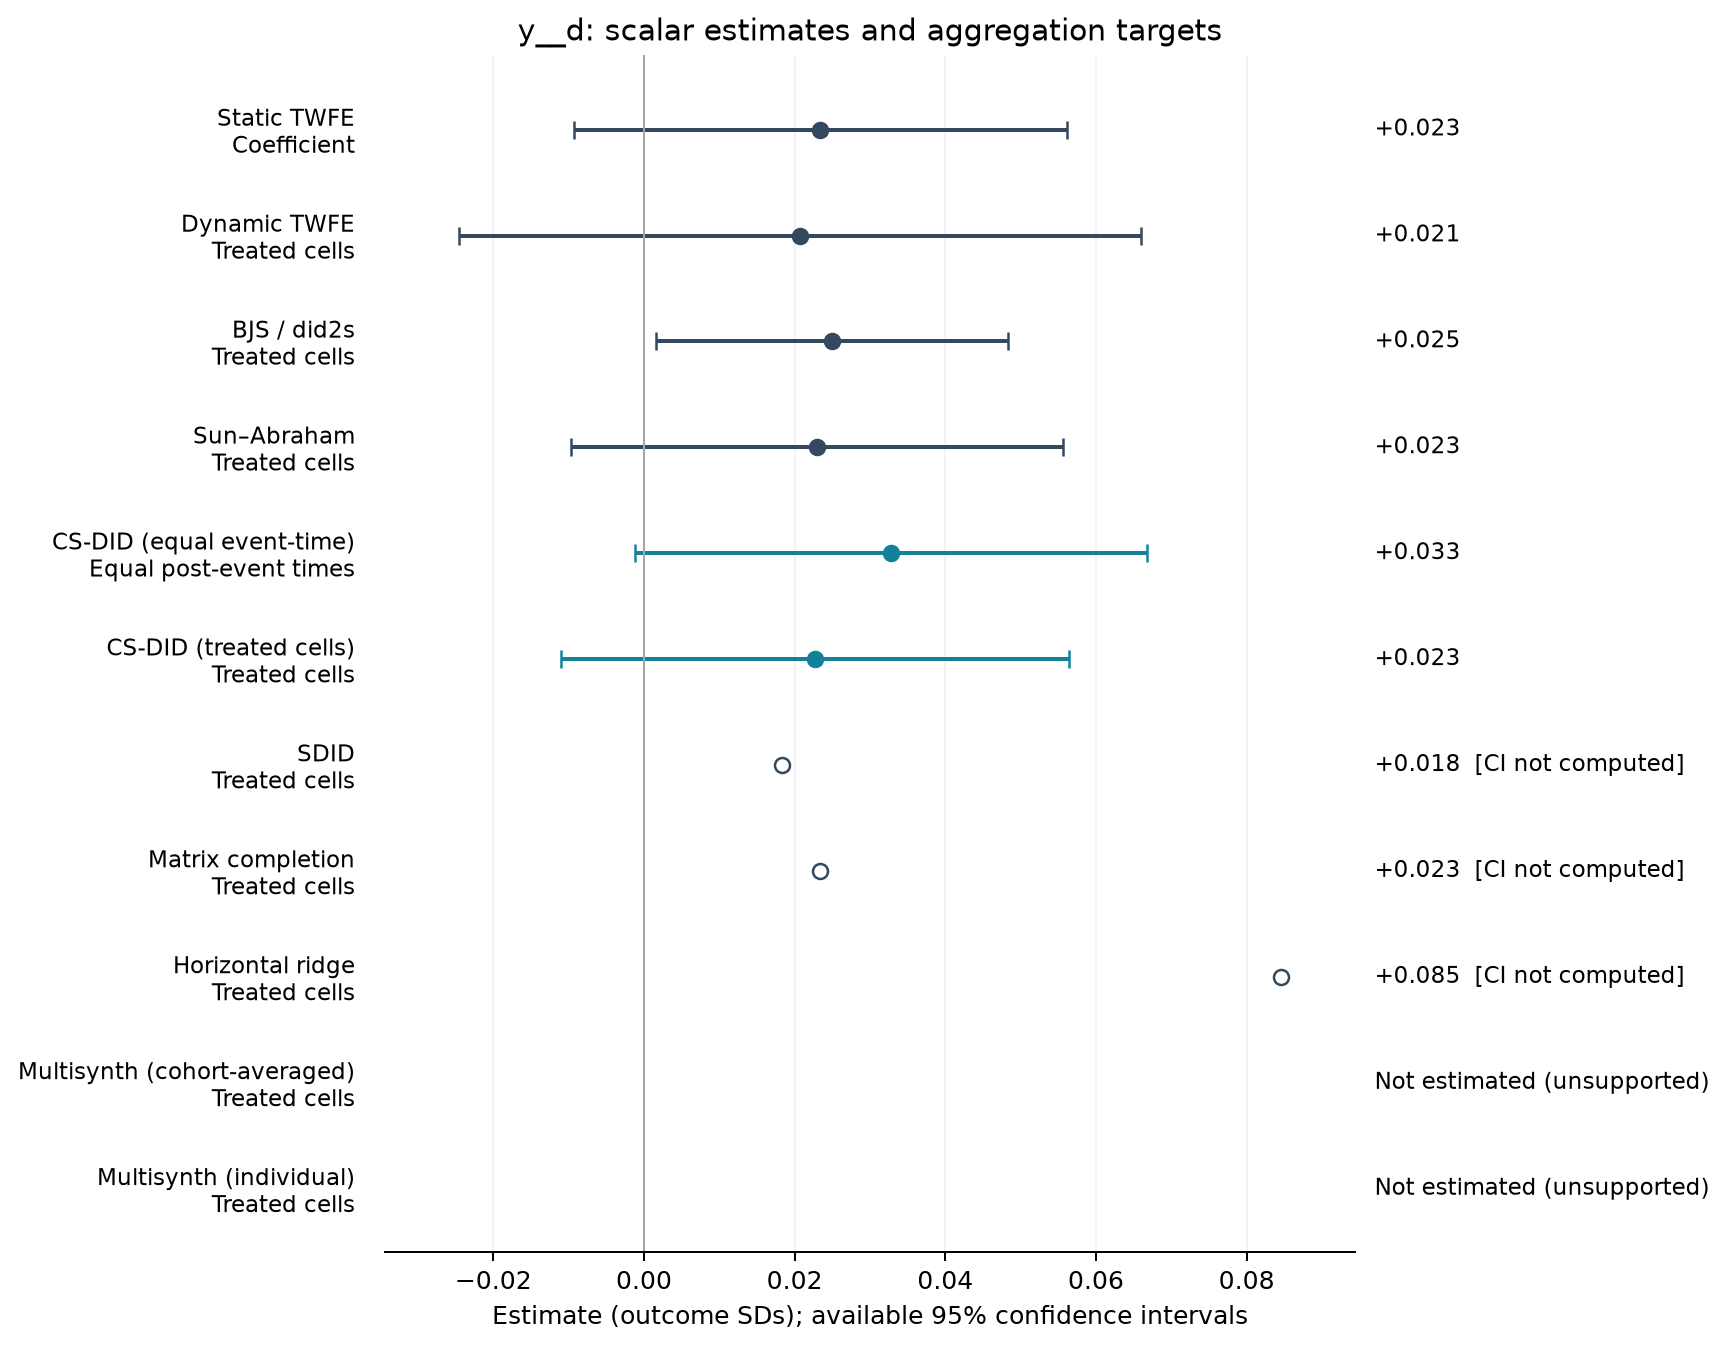
Estimate comparison
| Estimator | Estimate (SDs) | SE | 95% CI | Averaging |
|---|---|---|---|---|
| Static TWFE | 0.023 | 0.017 | [-0.009, 0.056] | Coefficient |
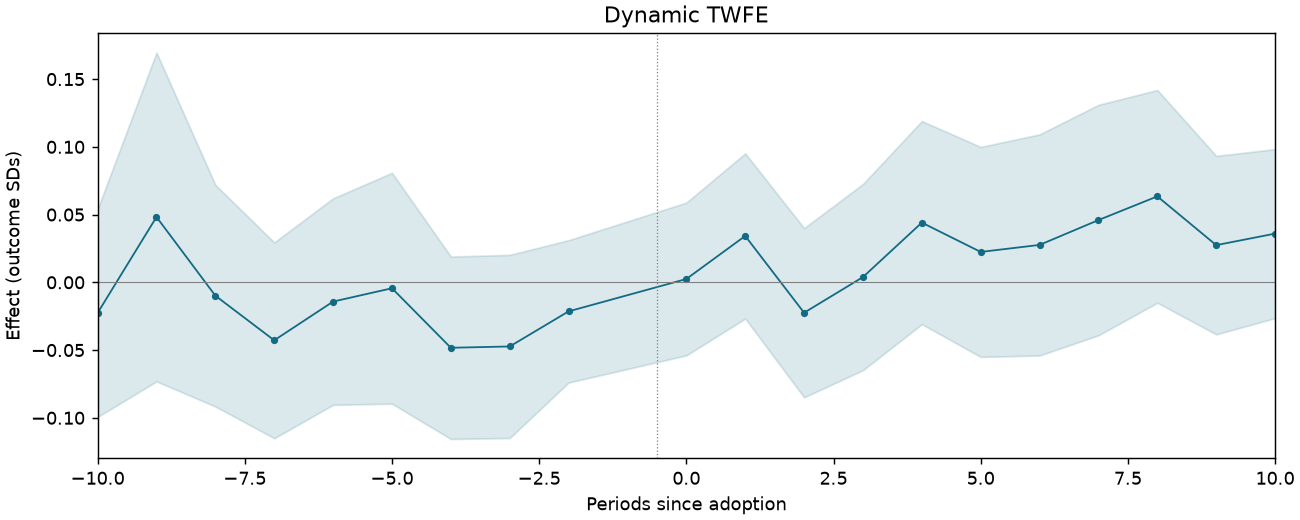
| Dynamic TWFE | 0.021 | 0.023 | [-0.025, 0.066] | Treated cells |
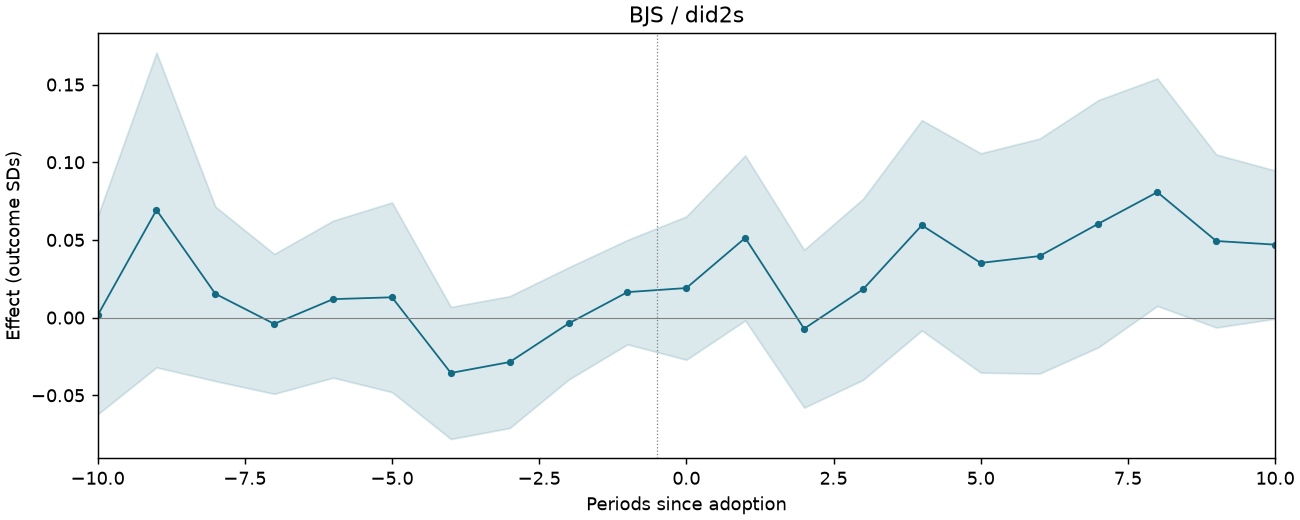
| BJS / did2s | 0.025 | 0.012 | [0.002, 0.048] | Treated cells |
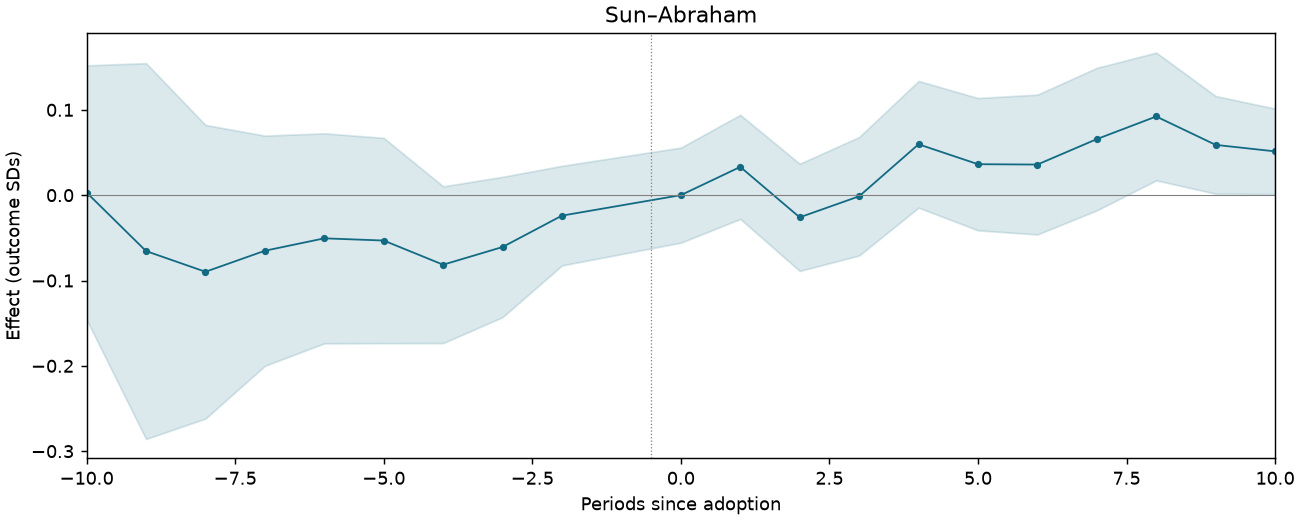
| Sun–Abraham | 0.023 | 0.017 | [-0.010, 0.056] | Treated cells |
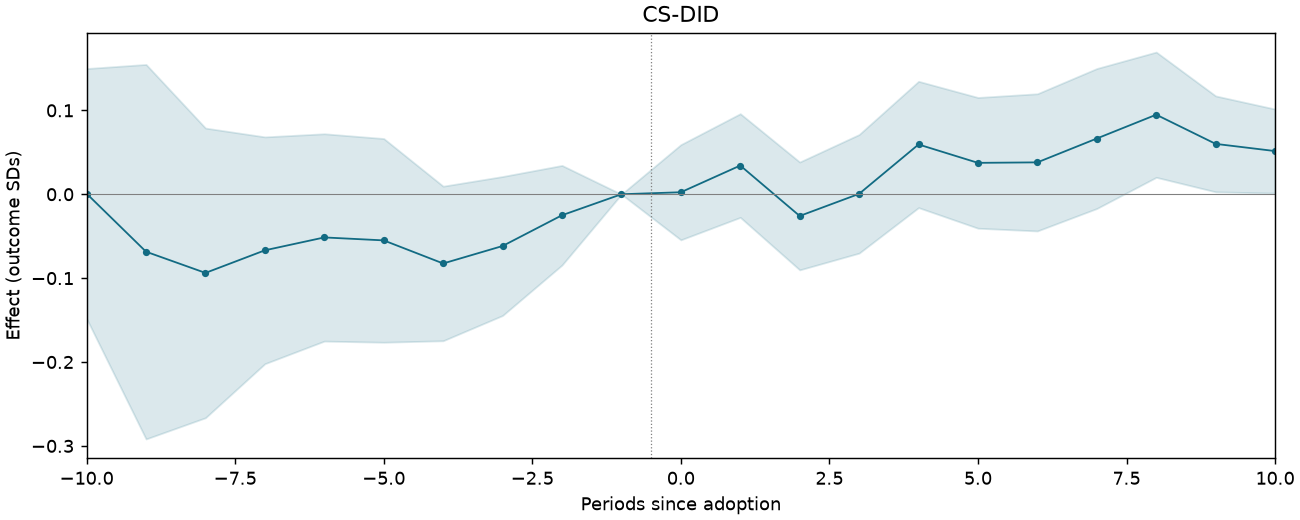
| CS-DID (equal event-time) | 0.033 | 0.017 | [-0.001, 0.067] | Equal post-event times |
| CS-DID (treated cells) | 0.023 | 0.017 | [-0.011, 0.056] | Treated cells |
| SDID | 0.018 | — | — | Treated cells |
| Matrix completion | 0.023 | — | — | Treated cells |
| Horizontal ridge | 0.085 | — | — | Treated cells |
Event studies
Periods −10 to +10; pointwise 95% intervals where available.
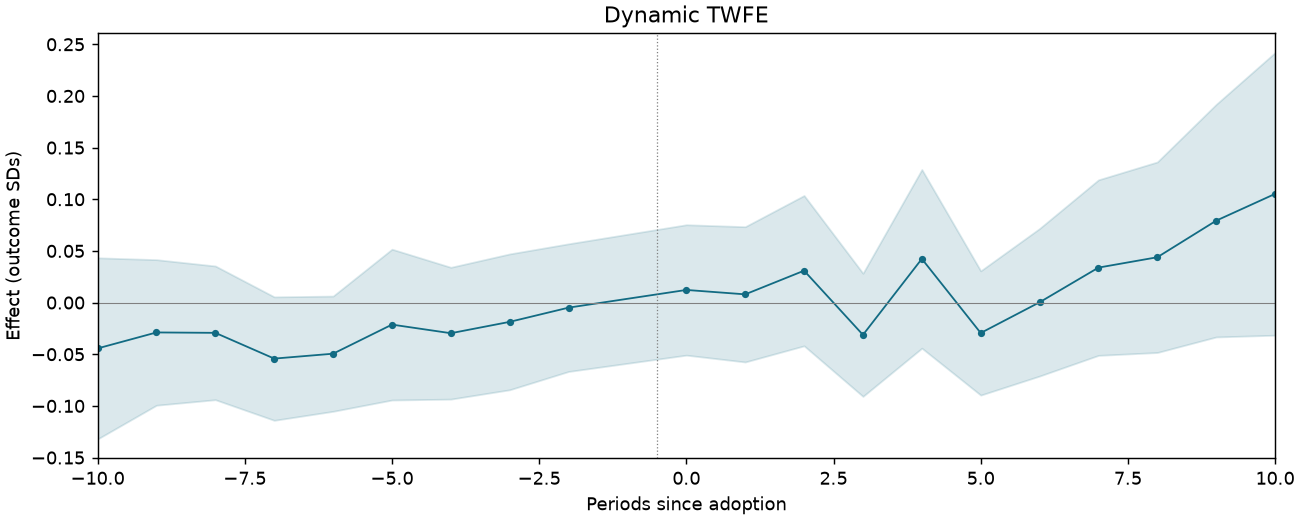
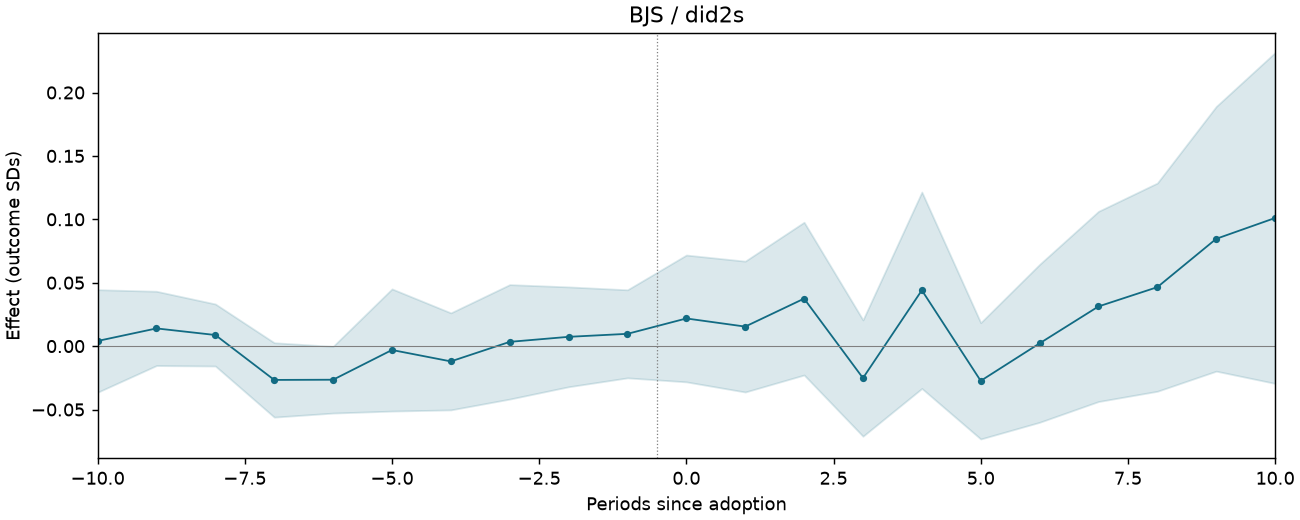
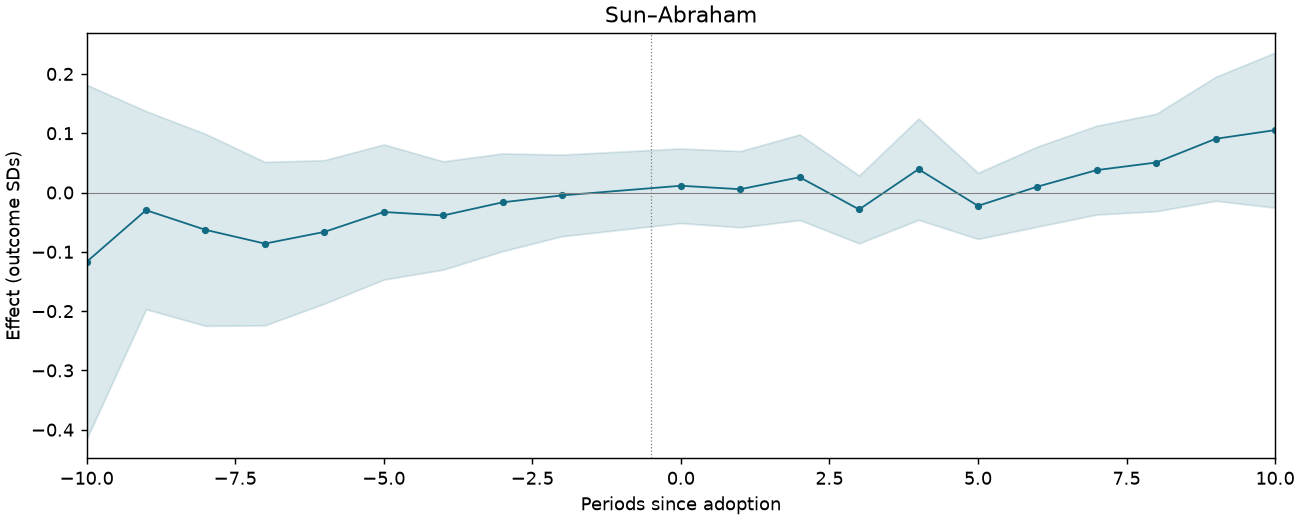
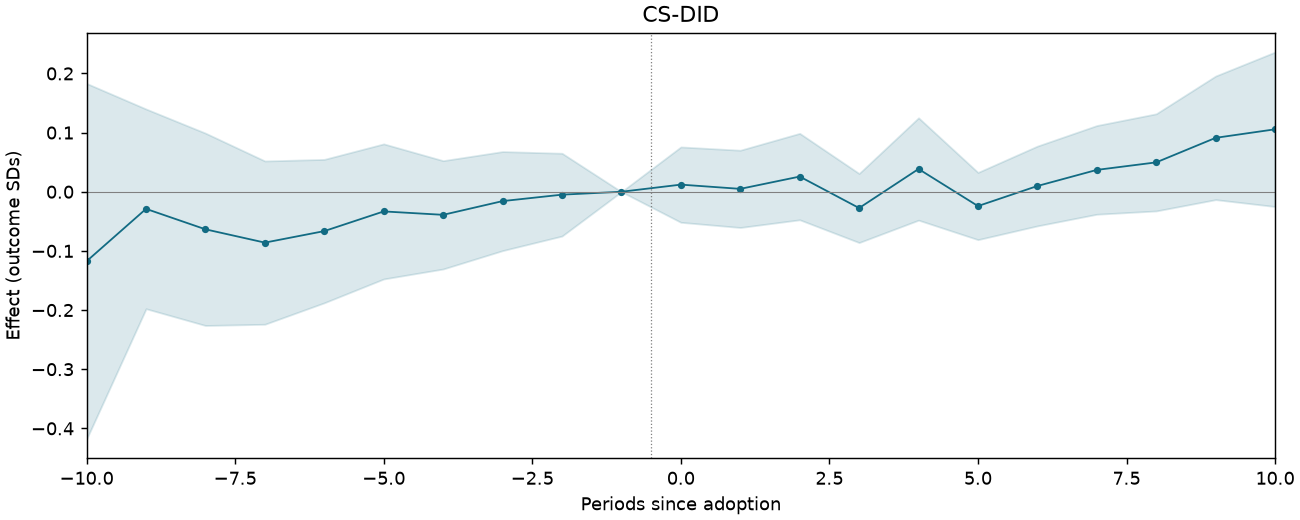
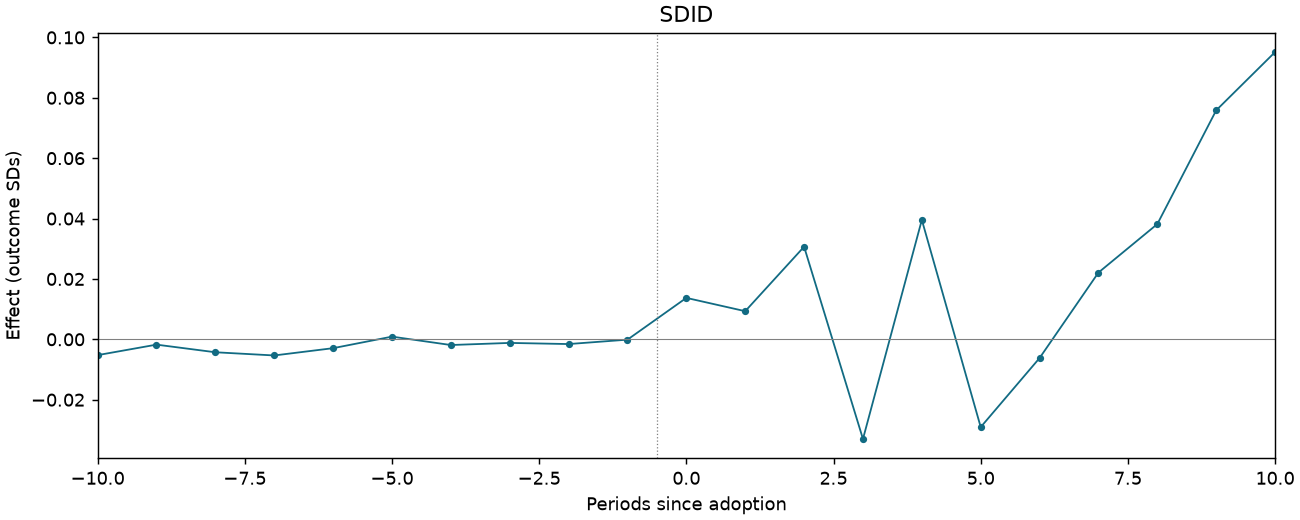
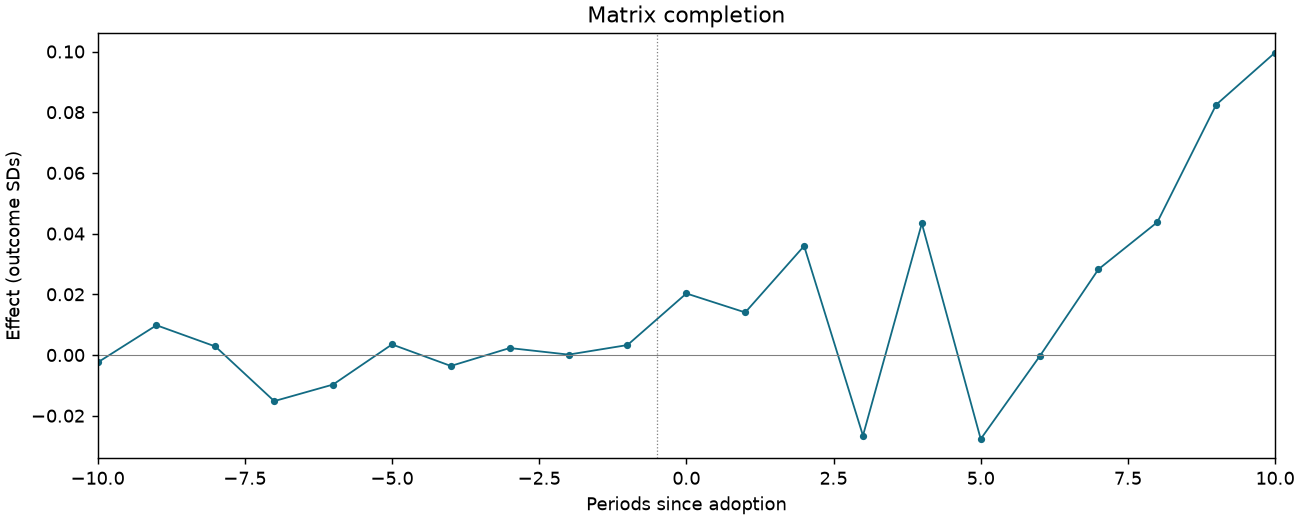
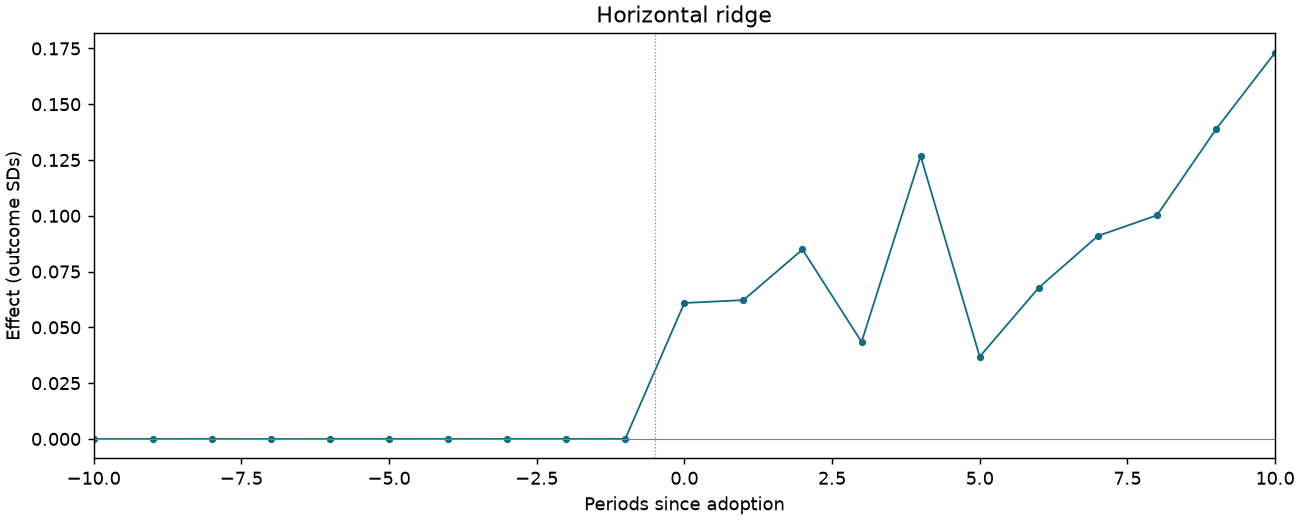
AUDITS-T4-C3-CONVICTION
67,262 observations · 5,174 units · 5,174 clusters · 1,651 treated / 3,523 control units.
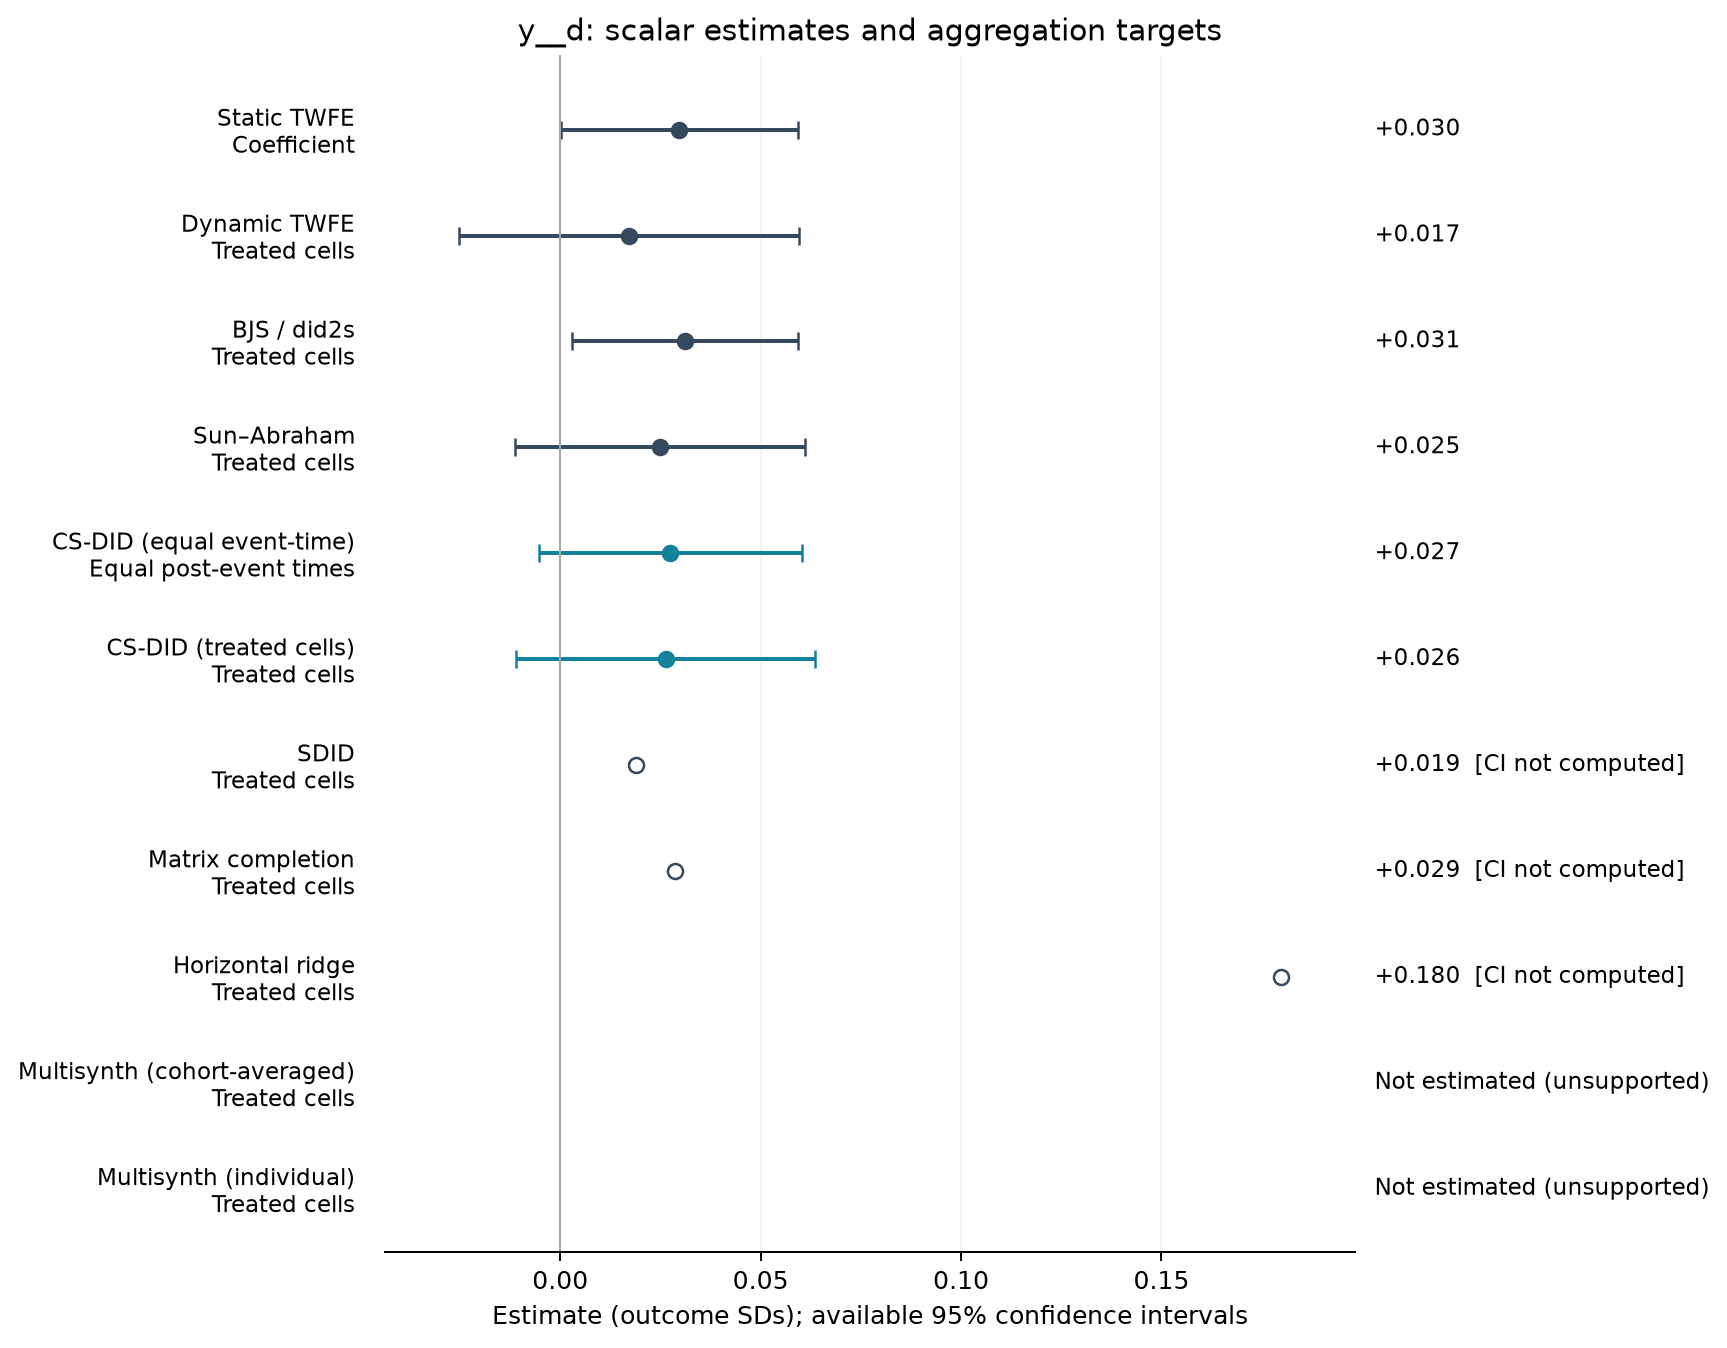
Estimate comparison
| Estimator | Estimate (SDs) | SE | 95% CI | Averaging |
|---|---|---|---|---|
| Static TWFE | 0.030 | 0.015 | [0.000, 0.059] | Coefficient |
| Dynamic TWFE | 0.017 | 0.022 | [-0.025, 0.060] | Treated cells |
| BJS / did2s | 0.031 | 0.014 | [0.003, 0.059] | Treated cells |
| Sun–Abraham | 0.025 | 0.018 | [-0.011, 0.061] | Treated cells |
| CS-DID (equal event-time) | 0.027 | 0.017 | [-0.005, 0.060] | Equal post-event times |
| CS-DID (treated cells) | 0.026 | 0.019 | [-0.011, 0.064] | Treated cells |
| SDID | 0.019 | — | — | Treated cells |
| Matrix completion | 0.029 | — | — | Treated cells |
| Horizontal ridge | 0.180 | — | — | Treated cells |
Event studies
Periods −10 to +10; pointwise 95% intervals where available.
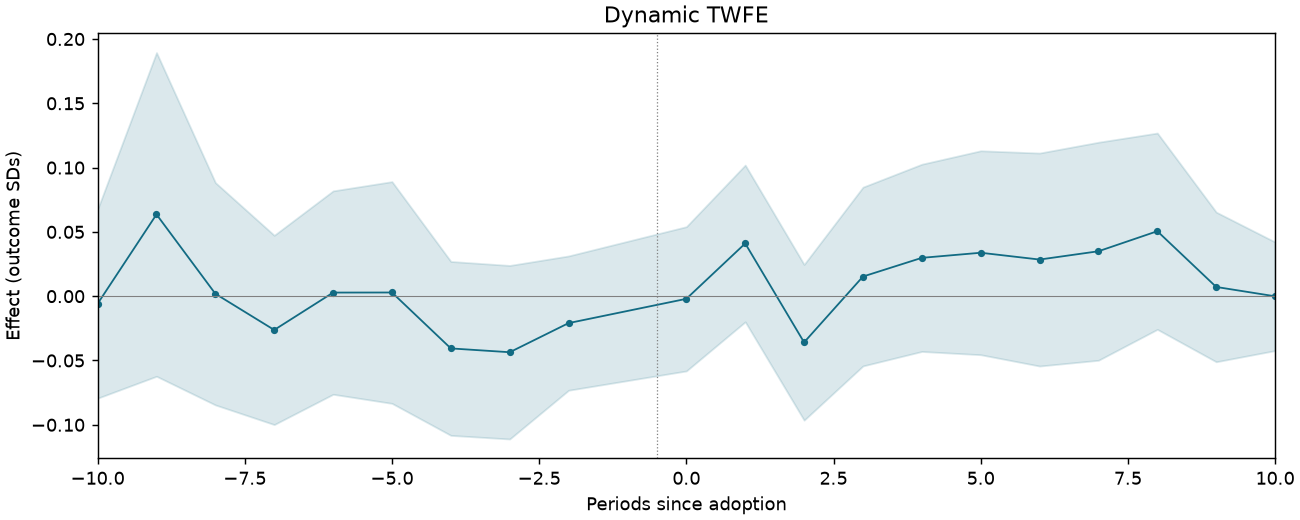
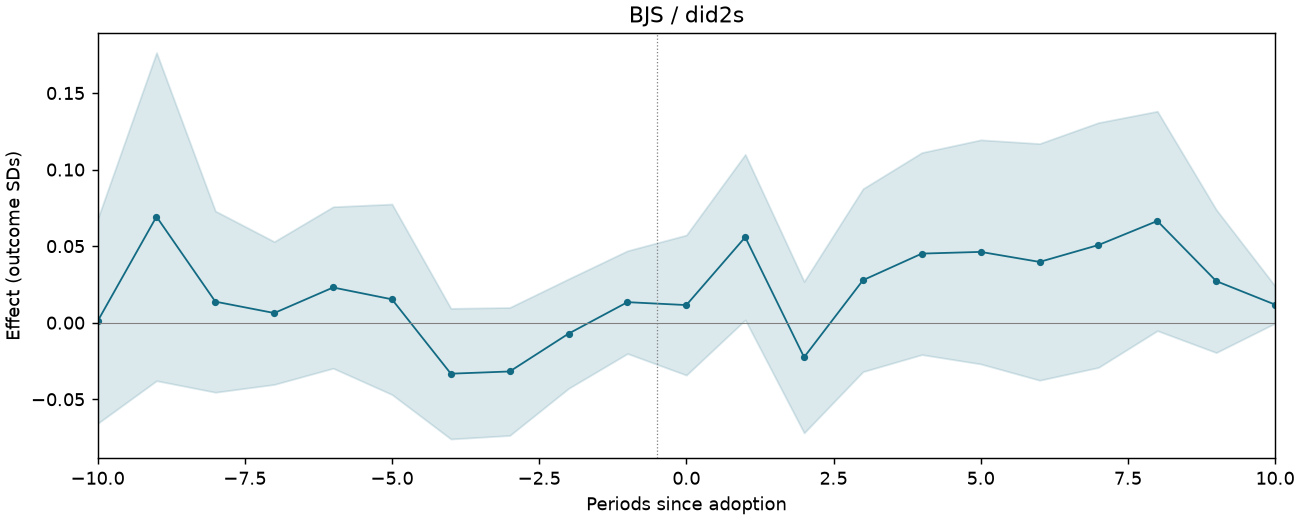
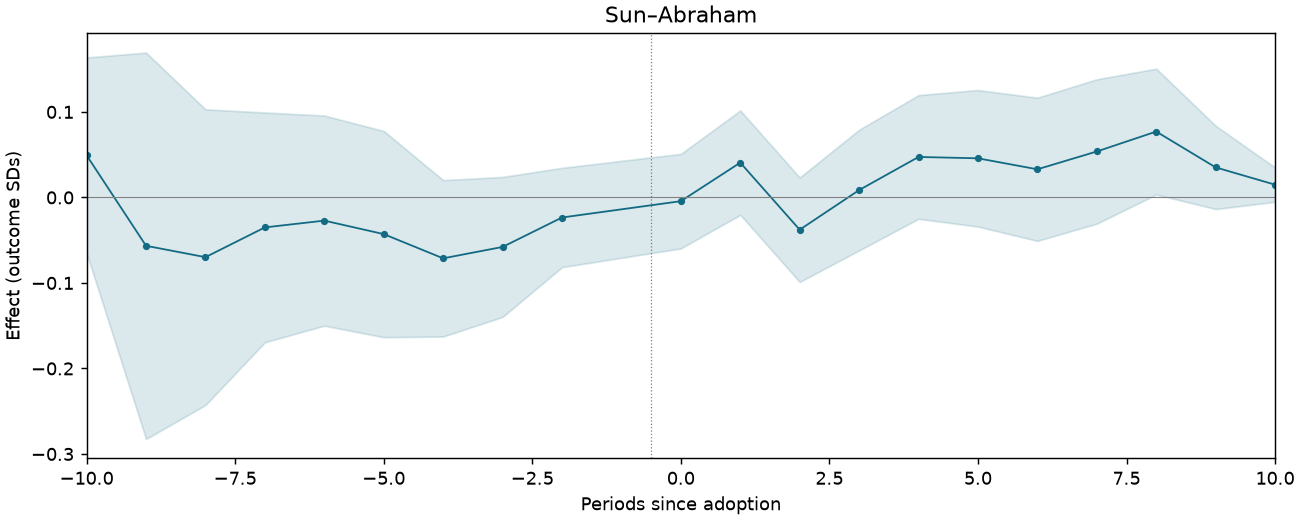
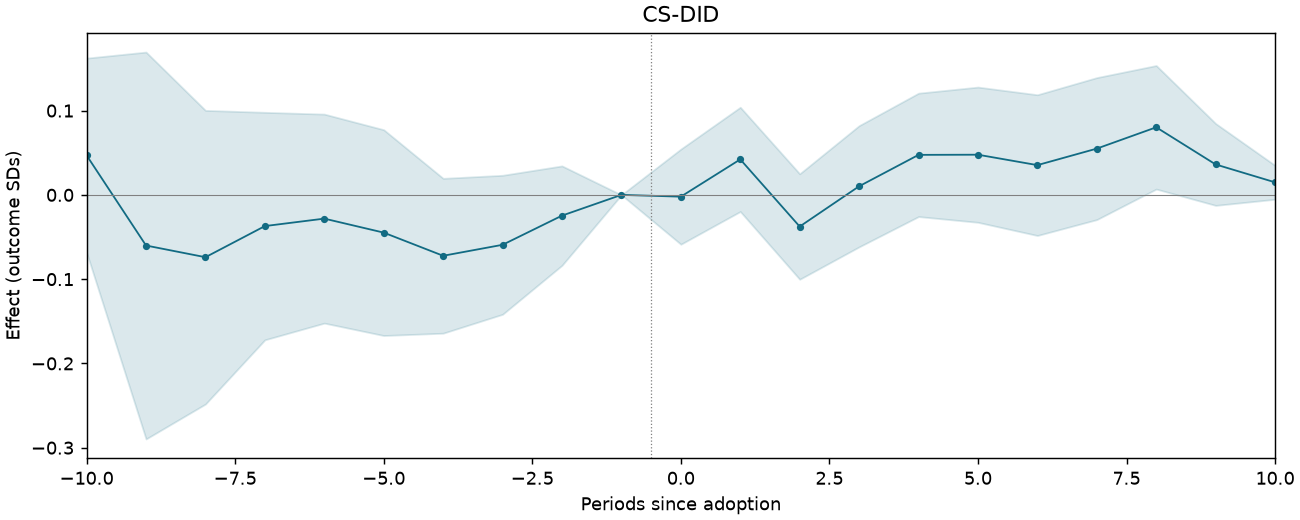
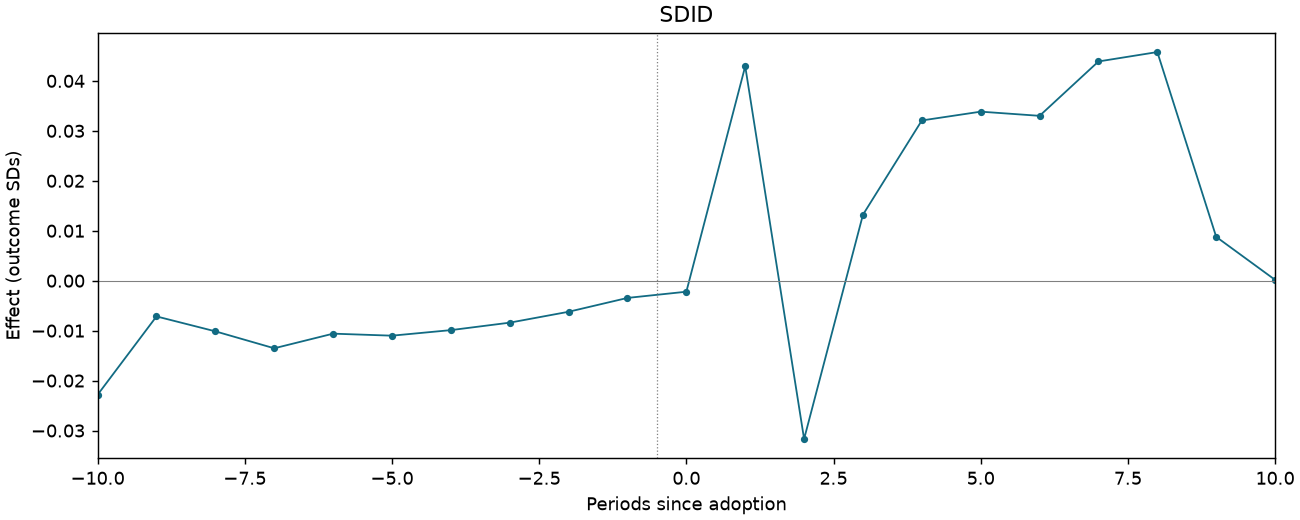
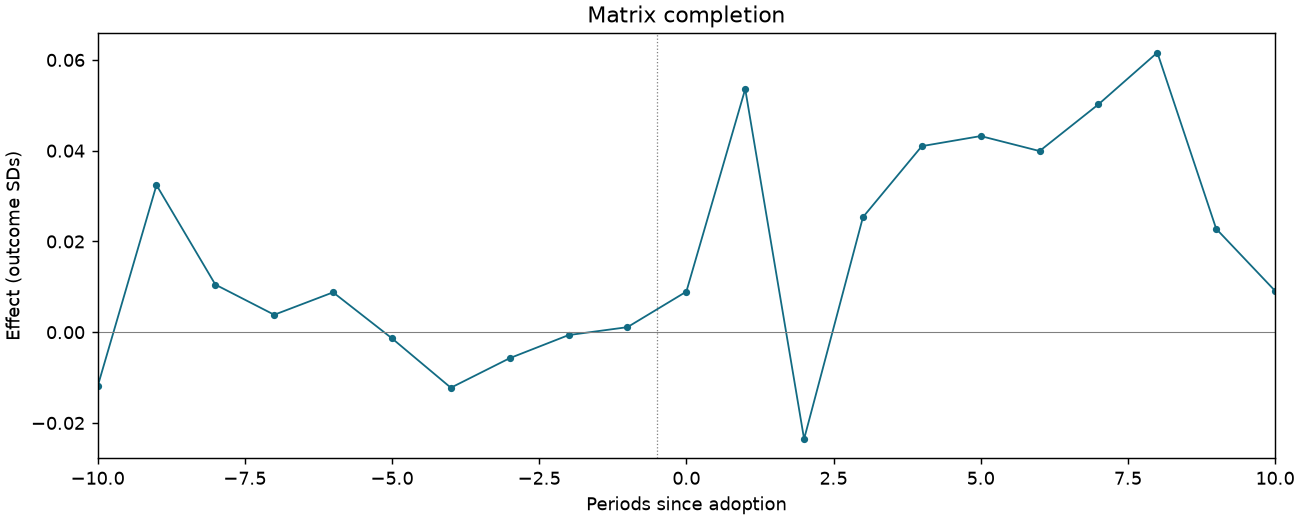
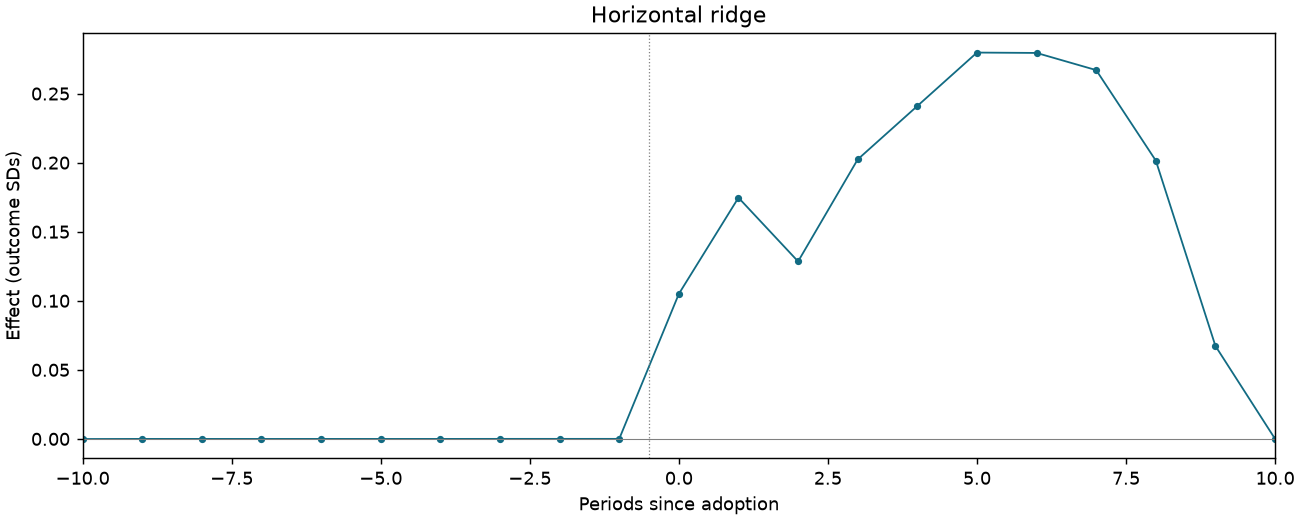
AUDITS-T4-C5-LEGAL-ACTION
67,262 observations · 5,174 units · 5,174 clusters · 1,651 treated / 3,523 control units.
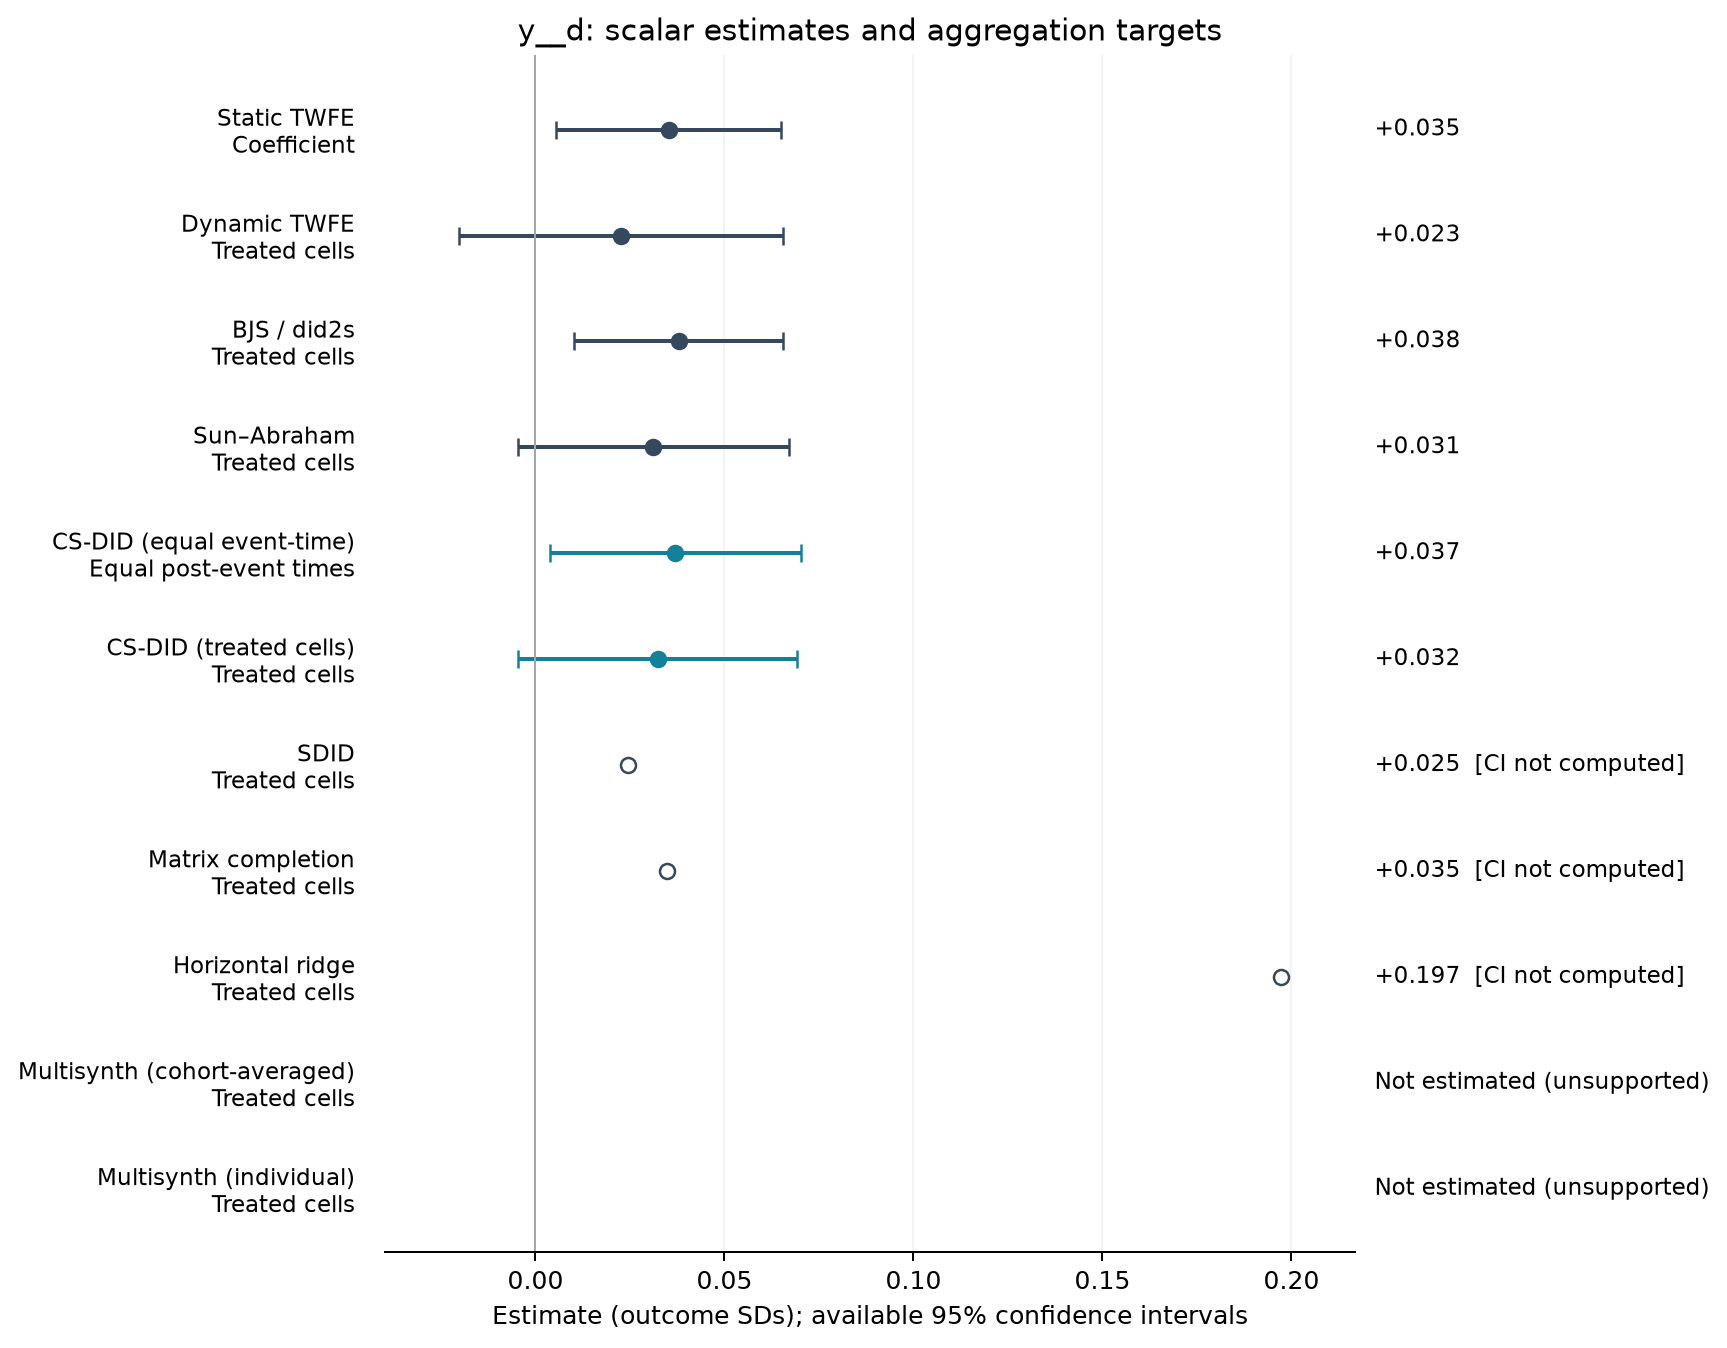
Estimate comparison
| Estimator | Estimate (SDs) | SE | 95% CI | Averaging |
|---|---|---|---|---|
| Static TWFE | 0.035 | 0.015 | [0.005, 0.065] | Coefficient |
| Dynamic TWFE | 0.023 | 0.022 | [-0.020, 0.066] | Treated cells |
| BJS / did2s | 0.038 | 0.014 | [0.010, 0.066] | Treated cells |
| Sun–Abraham | 0.031 | 0.018 | [-0.005, 0.067] | Treated cells |
| CS-DID (equal event-time) | 0.037 | 0.017 | [0.004, 0.070] | Equal post-event times |
| CS-DID (treated cells) | 0.032 | 0.019 | [-0.005, 0.069] | Treated cells |
| SDID | 0.025 | — | — | Treated cells |
| Matrix completion | 0.035 | — | — | Treated cells |
| Horizontal ridge | 0.197 | — | — | Treated cells |
Event studies
Periods −10 to +10; pointwise 95% intervals where available.