Market Integration Demand and the Growth of Firms — expanded estimators
Archive index · Regression tests · Results & settings (JSON) · Methods & code
Jensen and Miller (2018), AER. https://doi.org/10.1257/aer.20161965
7 specifications. Effects are in outcome standard deviations; intervals are 95%.
Treatment adoption

S04-P001: seeded sample of 100 of 142 eligible units. Purple untreated; yellow treated; white unobserved.
Auditor Assessment
1,522 observations · 142 units · 142 clusters · 105 treated / 37 control units.
Estimate comparison
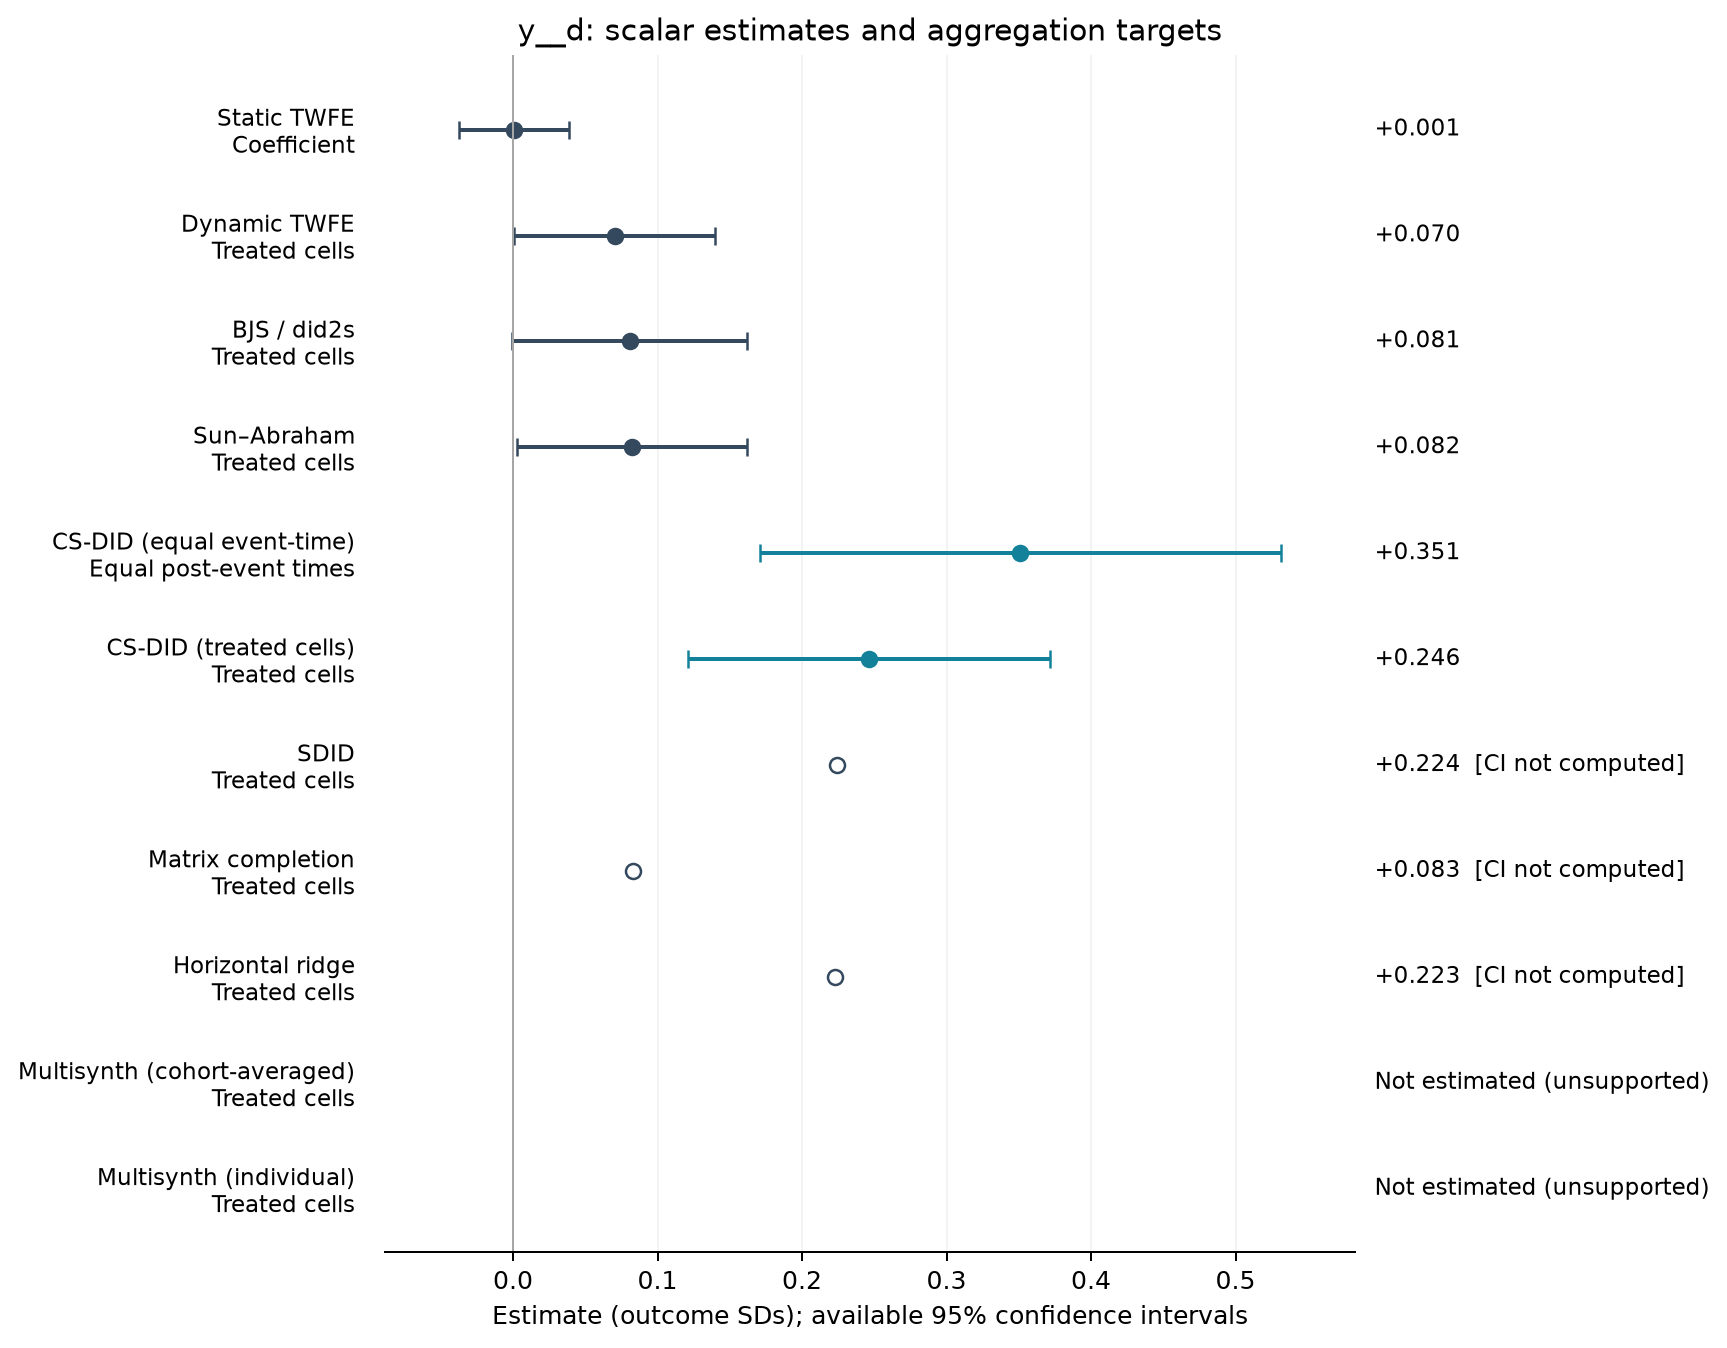
| Estimator | Estimate (SDs) | SE | 95% CI | Averaging |
|---|---|---|---|---|
| Static TWFE | 0.001 | 0.019 | [-0.037, 0.039] | Coefficient |
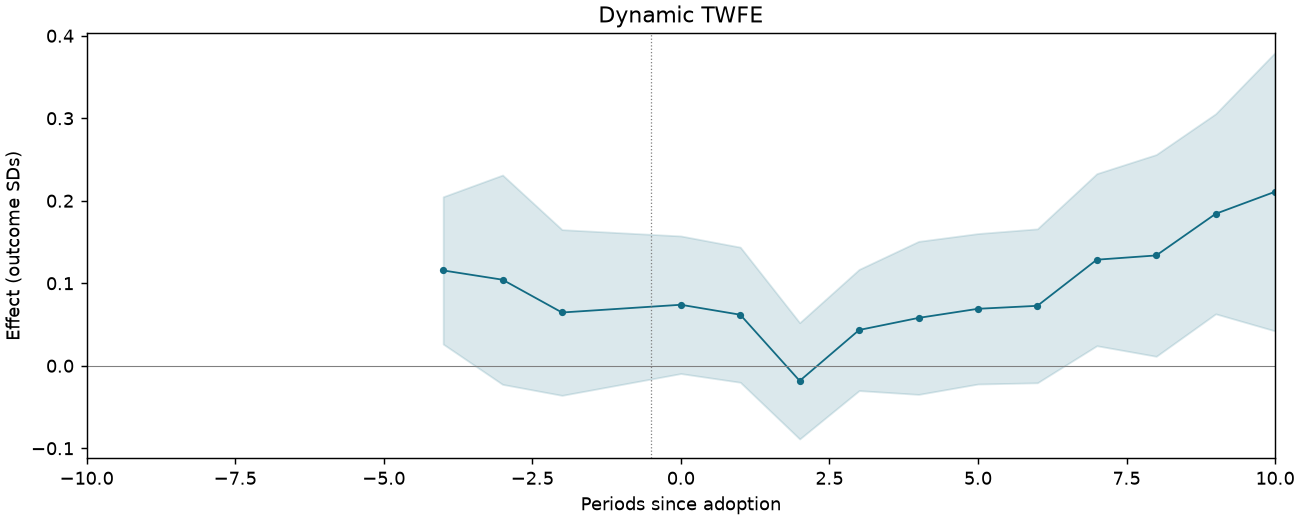
| Dynamic TWFE | 0.070 | 0.035 | [0.001, 0.140] | Treated cells |
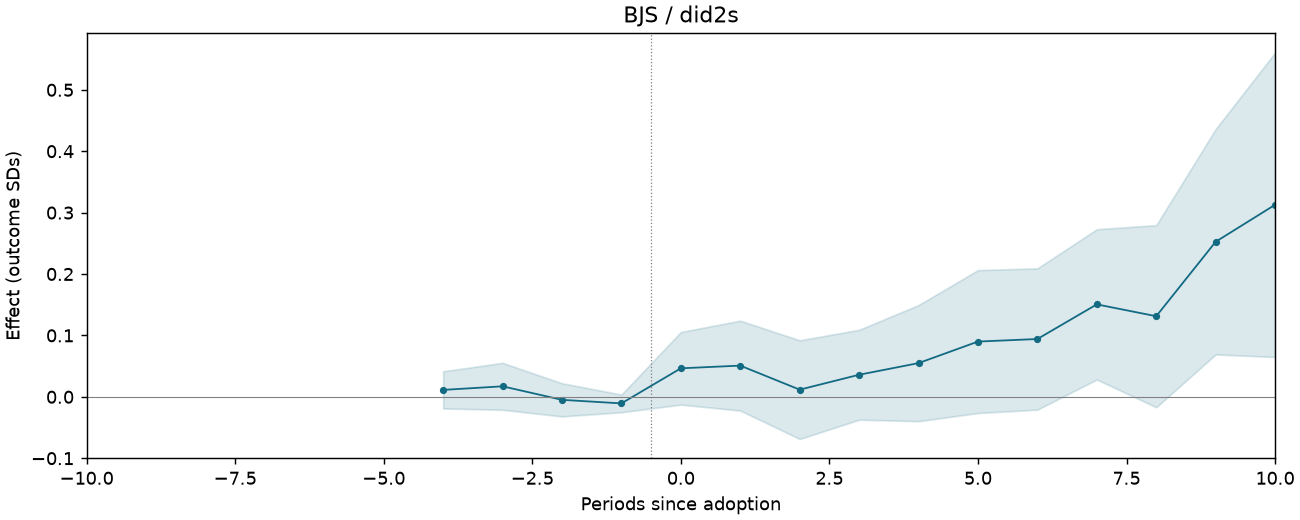
| BJS / did2s | 0.081 | 0.041 | [-0.000, 0.162] | Treated cells |
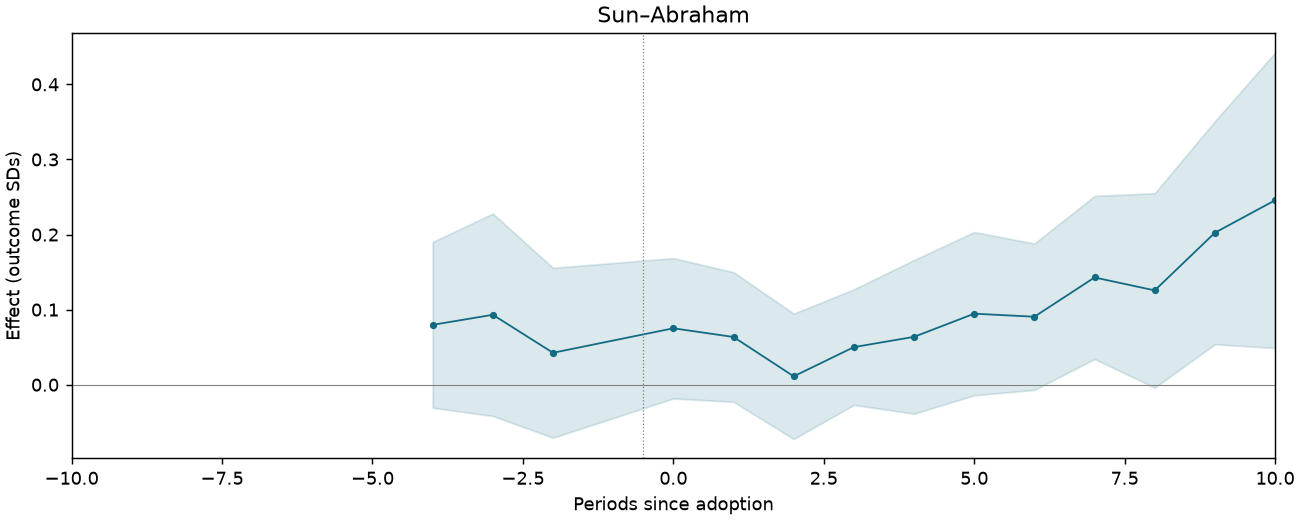
| Sun–Abraham | 0.082 | 0.040 | [0.002, 0.162] | Treated cells |
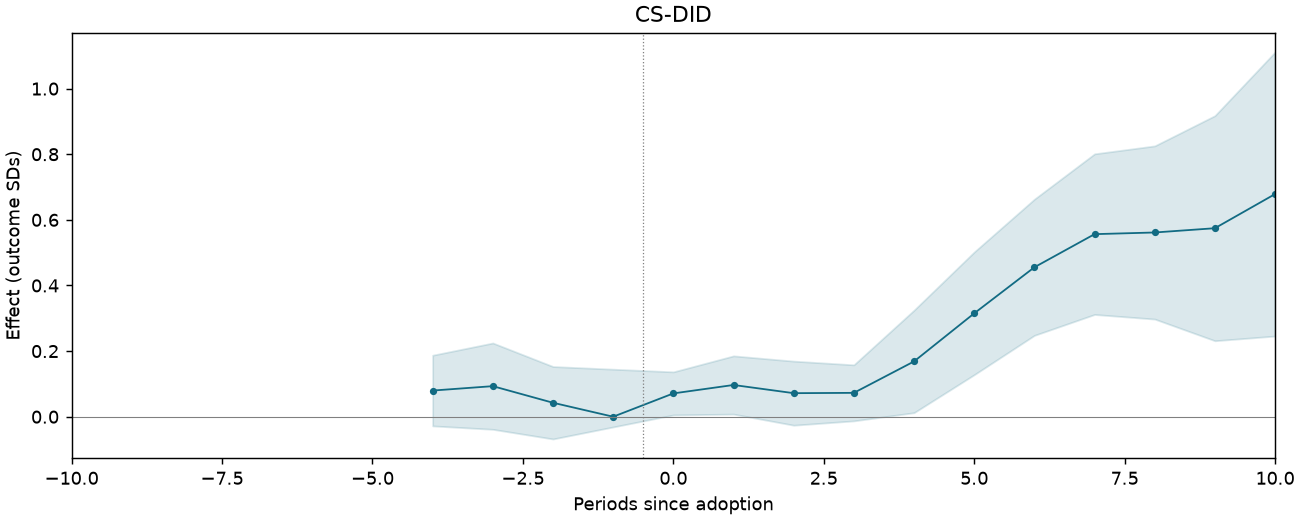
| CS-DID (equal event-time) | 0.351 | 0.092 | [0.171, 0.532] | Equal post-event times |
| CS-DID (treated cells) | 0.246 | 0.064 | [0.121, 0.372] | Treated cells |
| SDID | 0.224 | — | — | Treated cells |
| Matrix completion | 0.083 | — | — | Treated cells |
| Horizontal ridge | 0.223 | — | — | Treated cells |
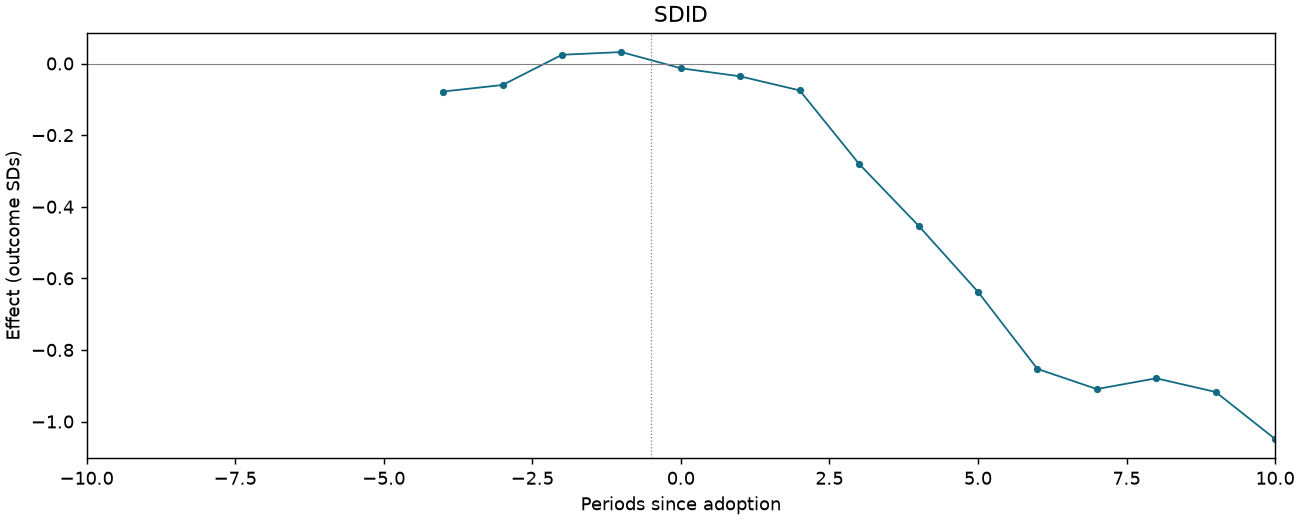
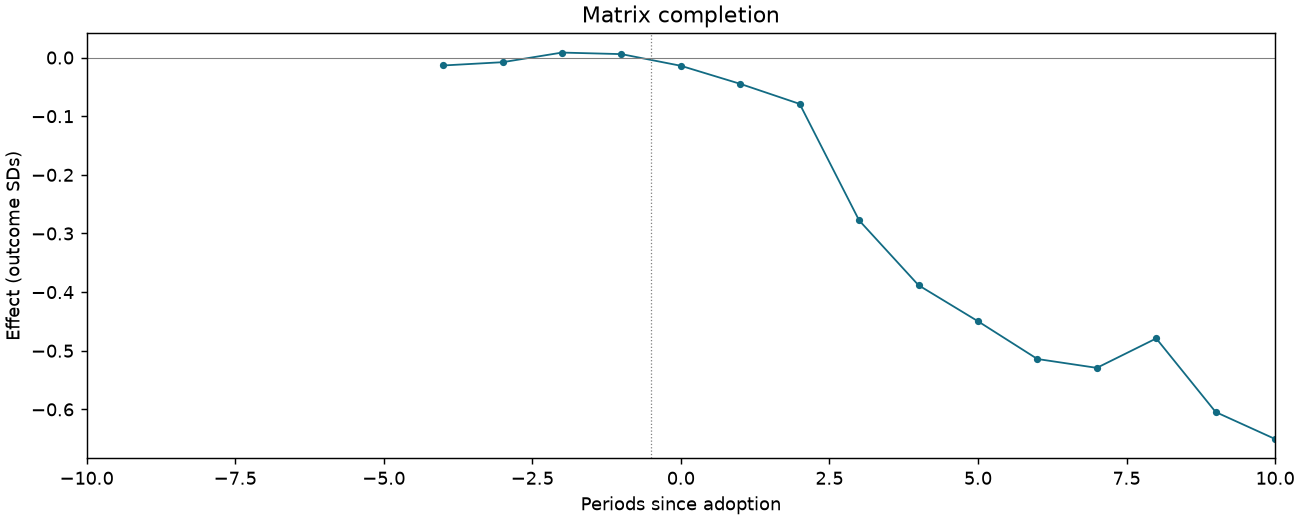
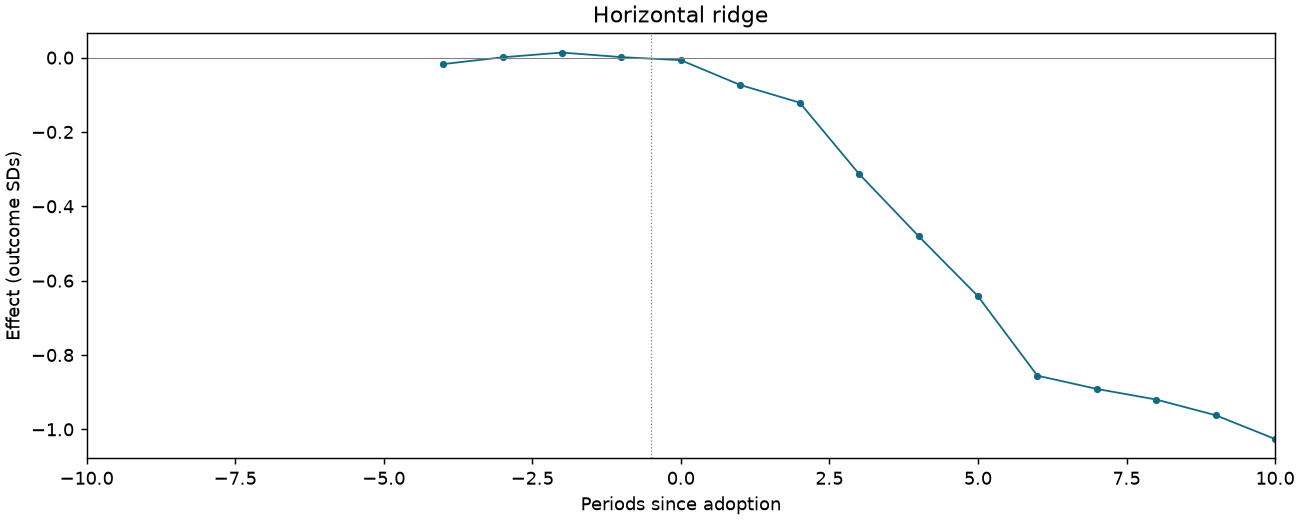
Event studies
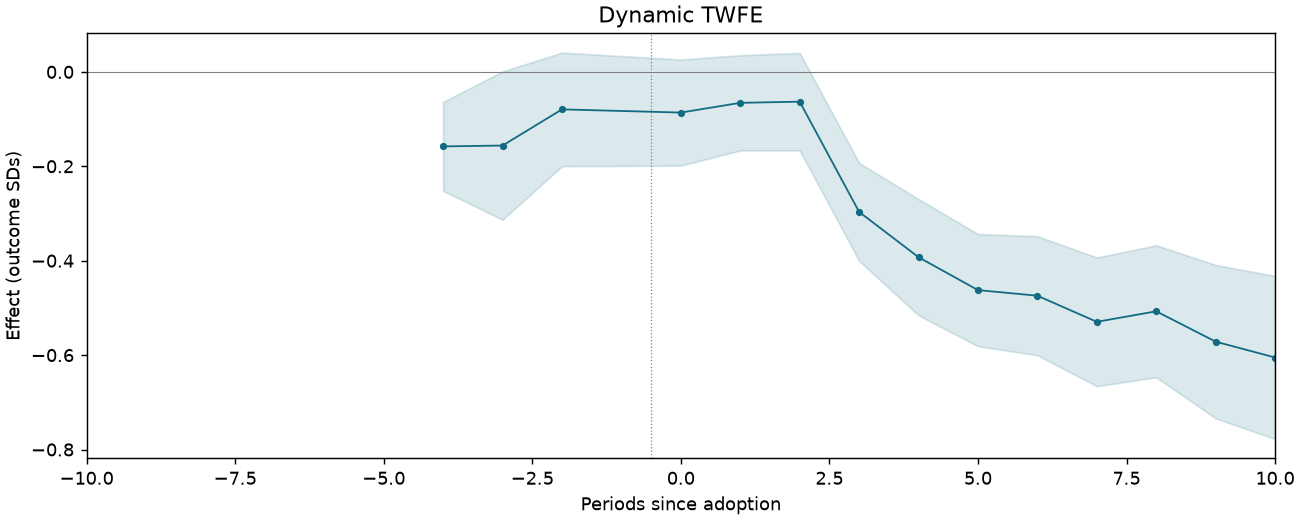
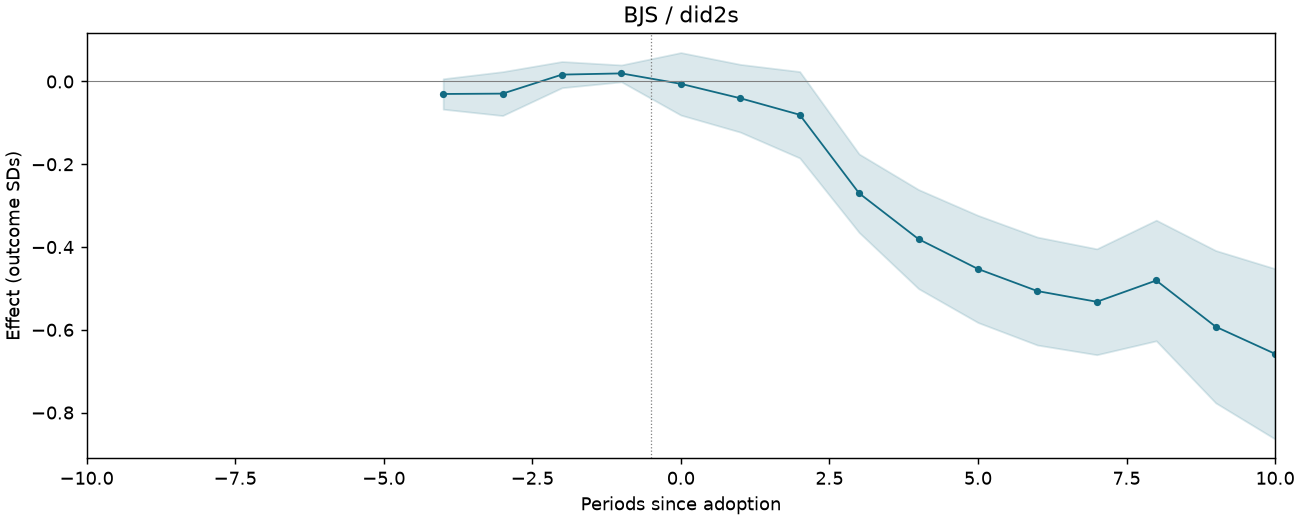
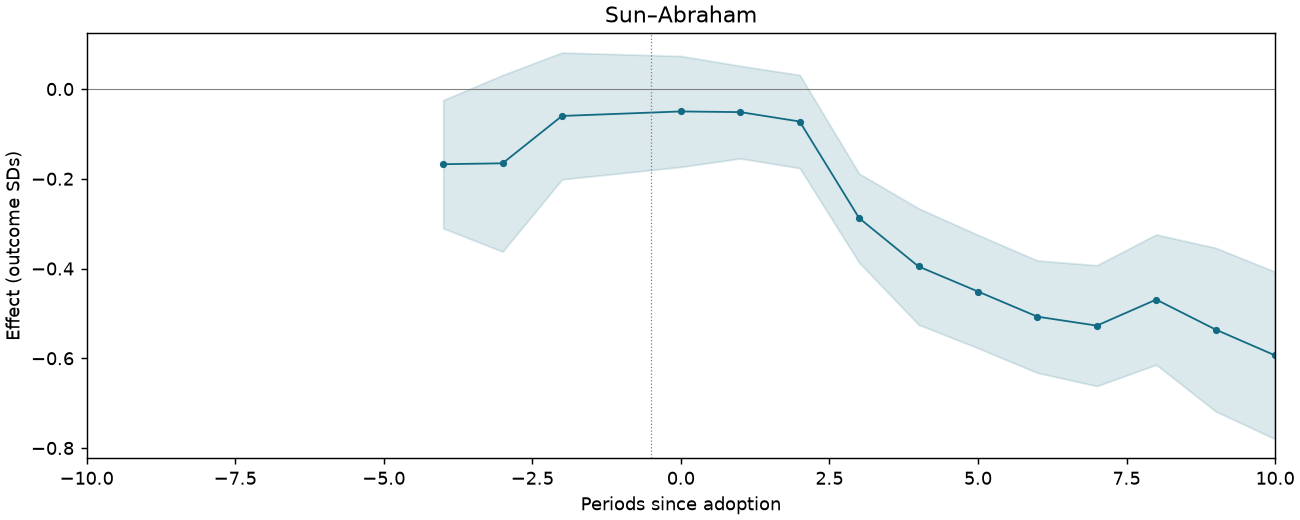
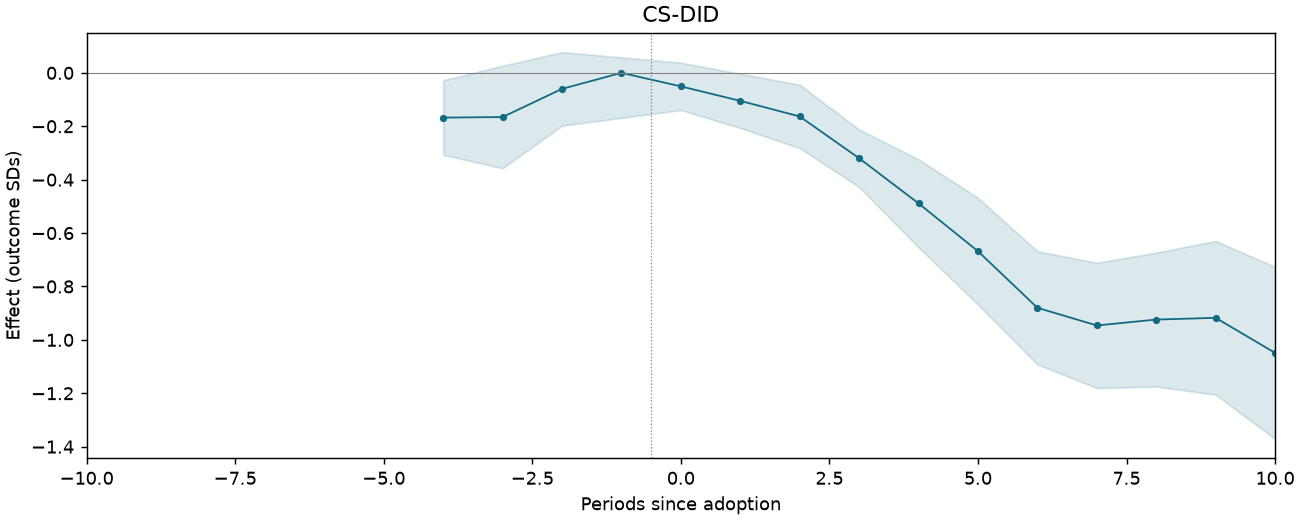
Periods −10 to +10; pointwise 95% intervals where available.
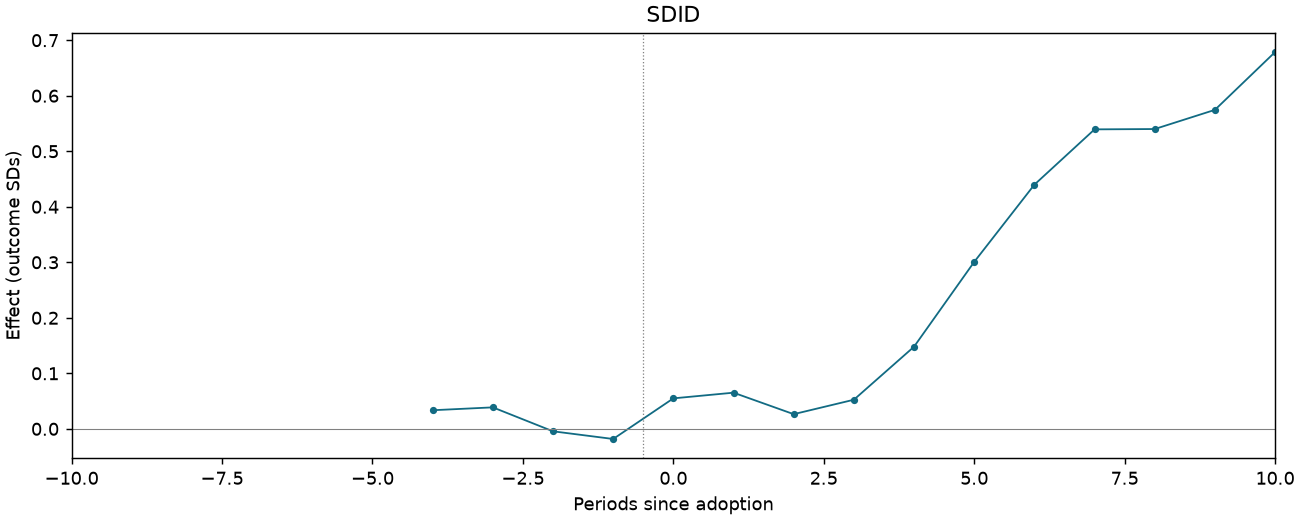
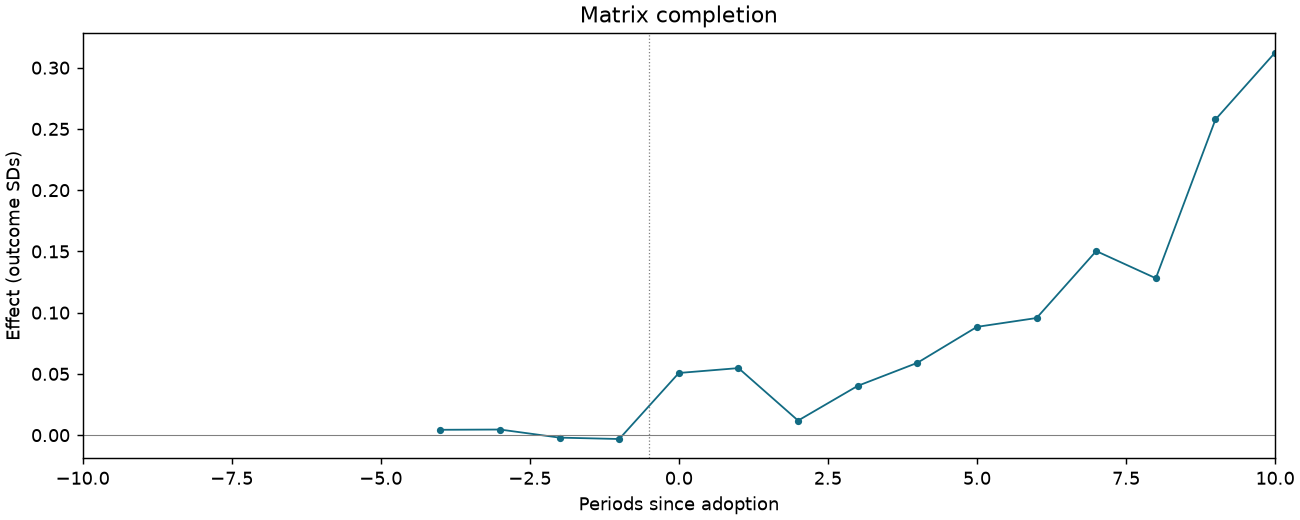
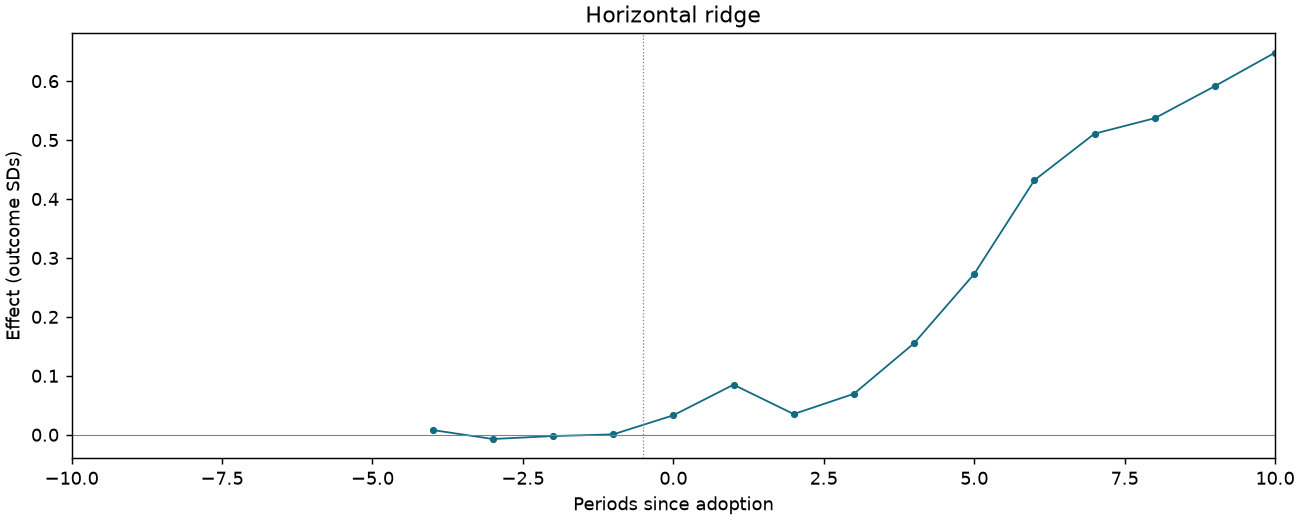
Labor Value per Boat
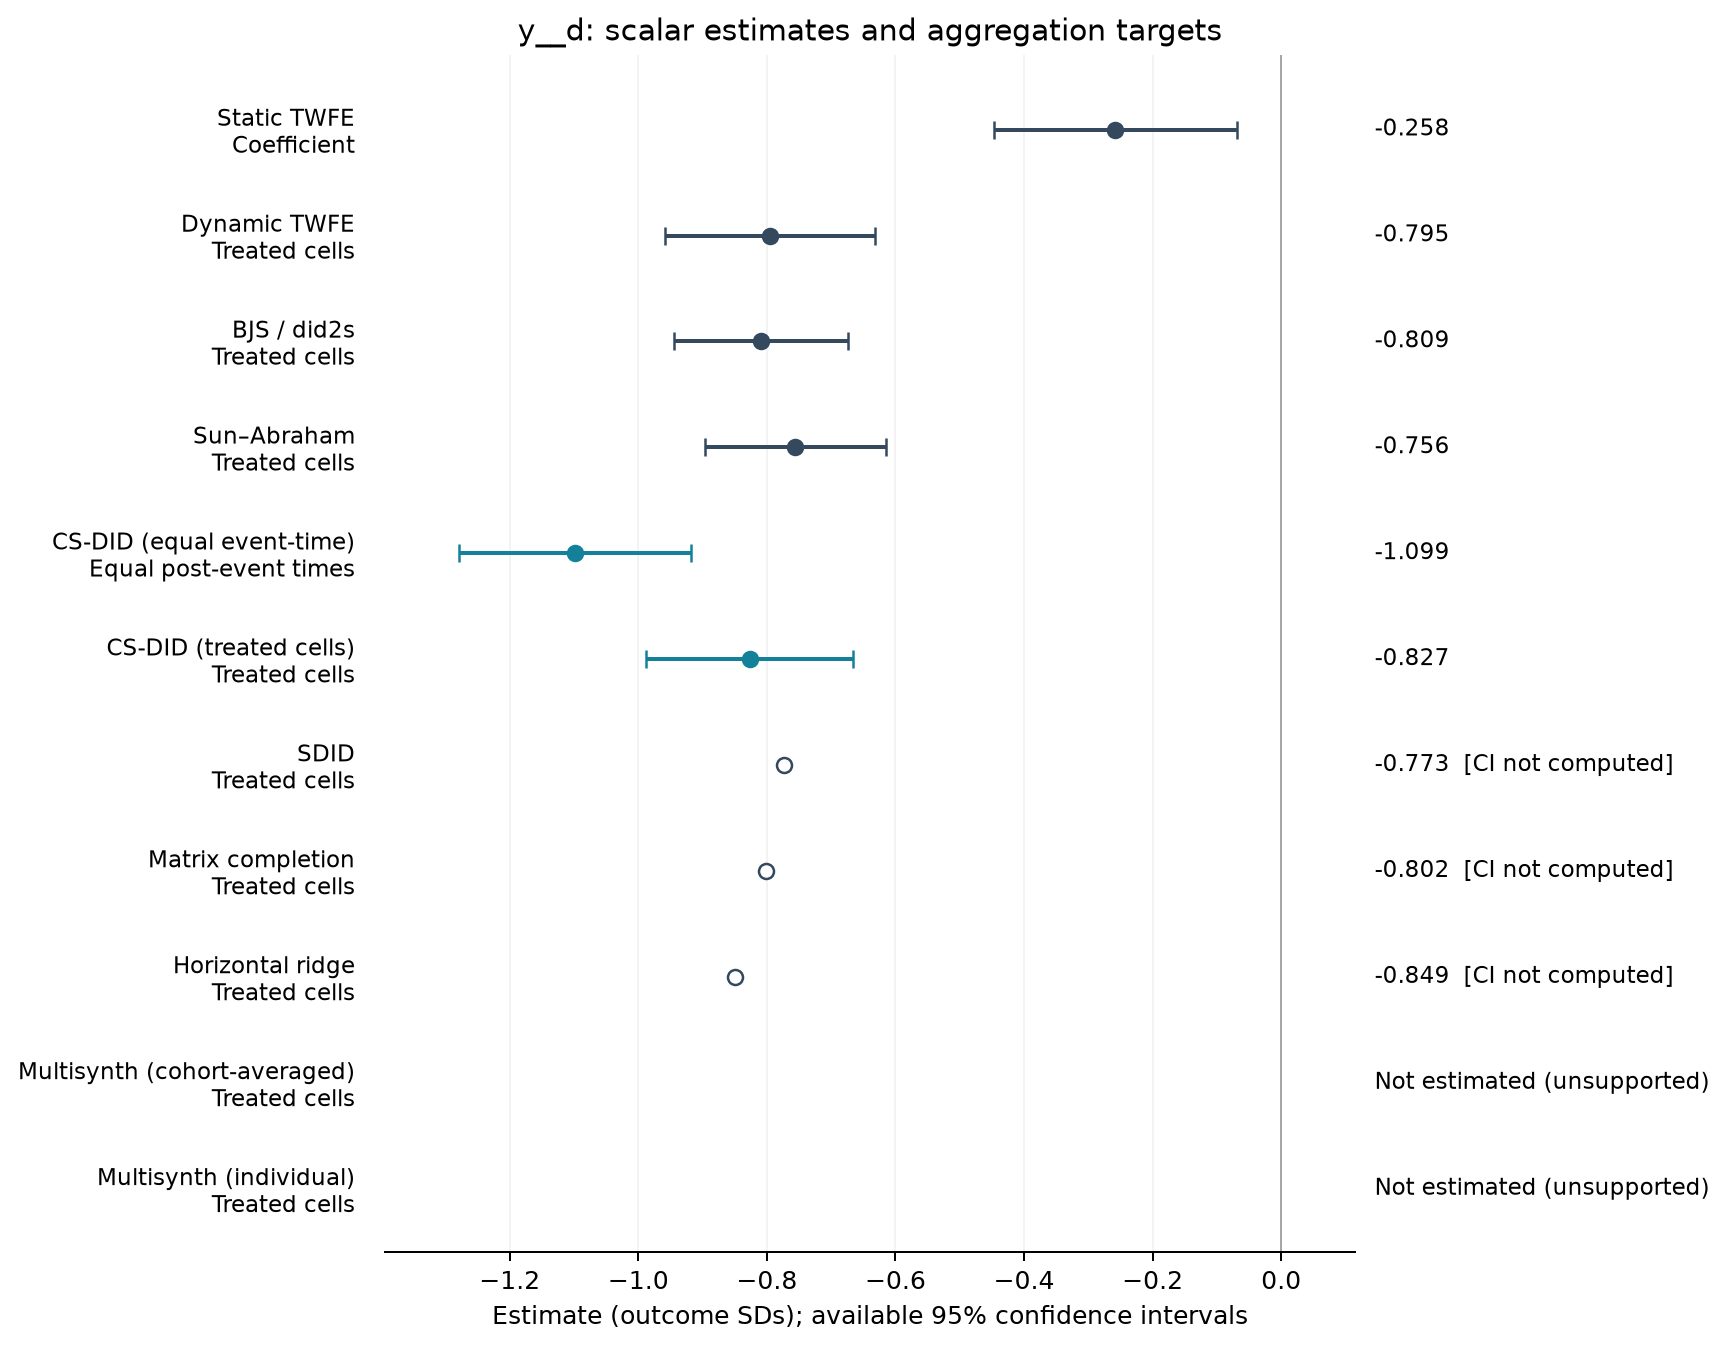
1,519 observations · 142 units · 142 clusters · 105 treated / 37 control units.
Estimate comparison
| Estimator | Estimate (SDs) | SE | 95% CI | Averaging |
|---|---|---|---|---|
| Static TWFE | -0.258 | 0.096 | [-0.447, -0.069] | Coefficient |
| Dynamic TWFE | -0.795 | 0.083 | [-0.958, -0.631] | Treated cells |
| BJS / did2s | -0.809 | 0.069 | [-0.945, -0.673] | Treated cells |
| Sun–Abraham | -0.756 | 0.071 | [-0.896, -0.615] | Treated cells |
| CS-DID (equal event-time) | -1.099 | 0.092 | [-1.279, -0.918] | Equal post-event times |
| CS-DID (treated cells) | -0.827 | 0.082 | [-0.987, -0.666] | Treated cells |
| SDID | -0.773 | — | — | Treated cells |
| Matrix completion | -0.802 | — | — | Treated cells |
| Horizontal ridge | -0.849 | — | — | Treated cells |
Event studies
Periods −10 to +10; pointwise 95% intervals where available.
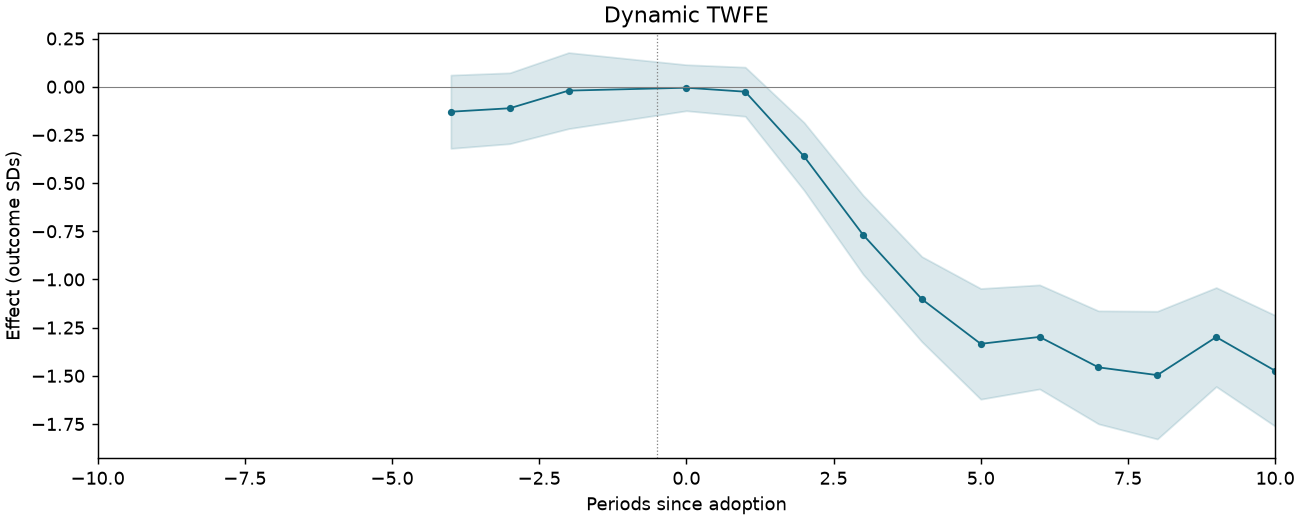
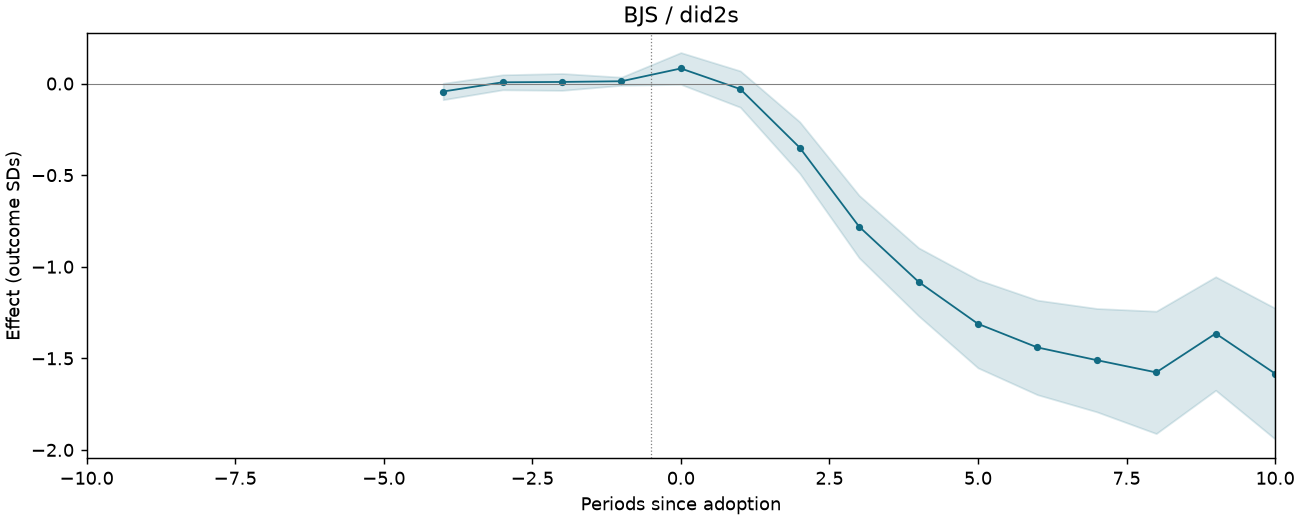
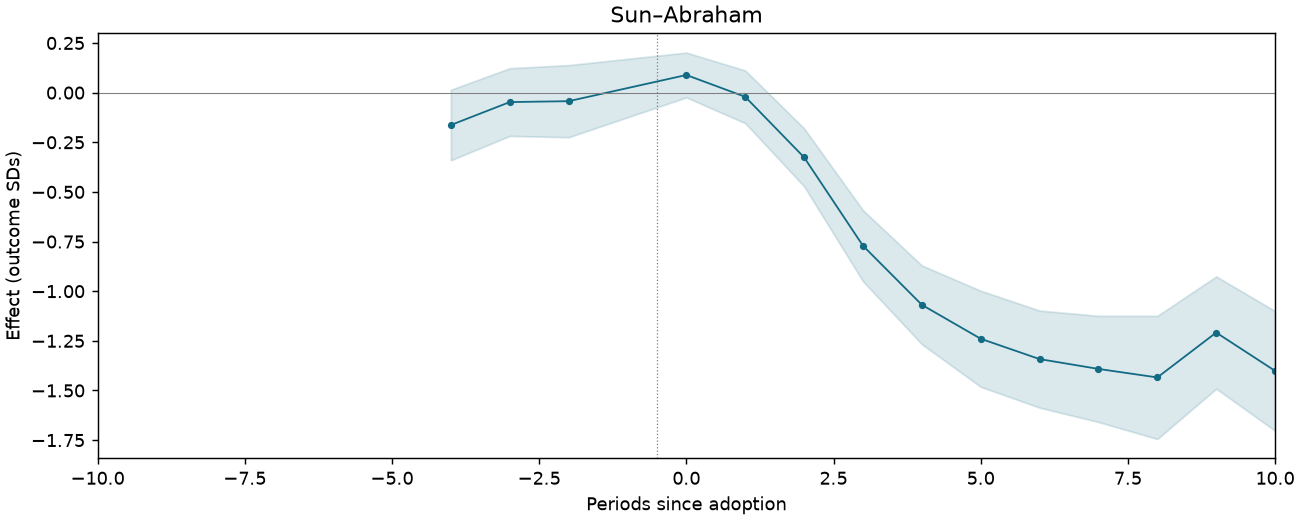
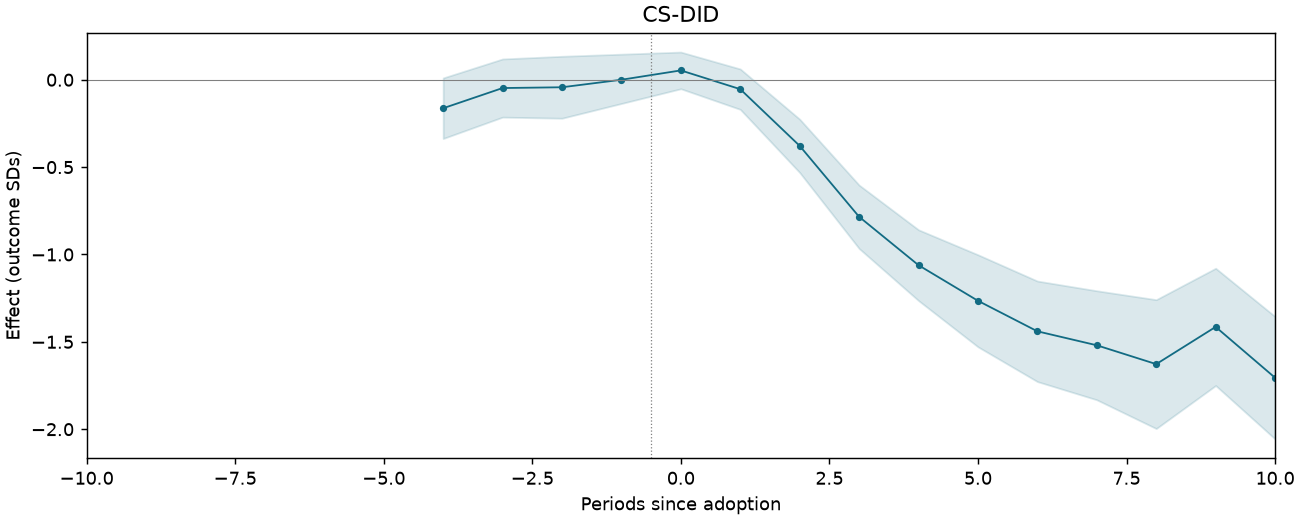
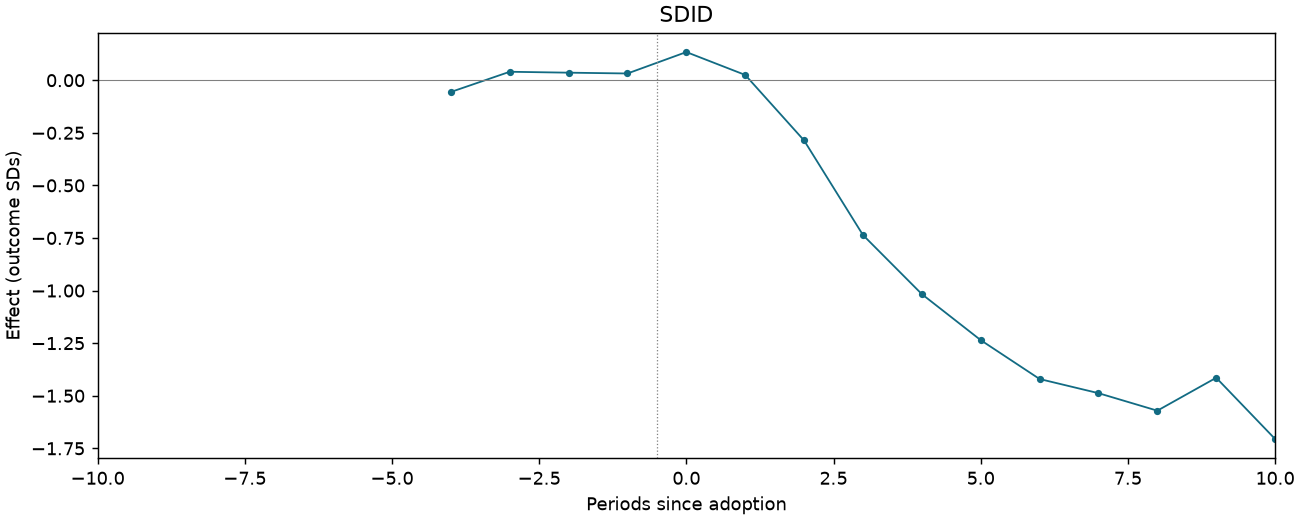
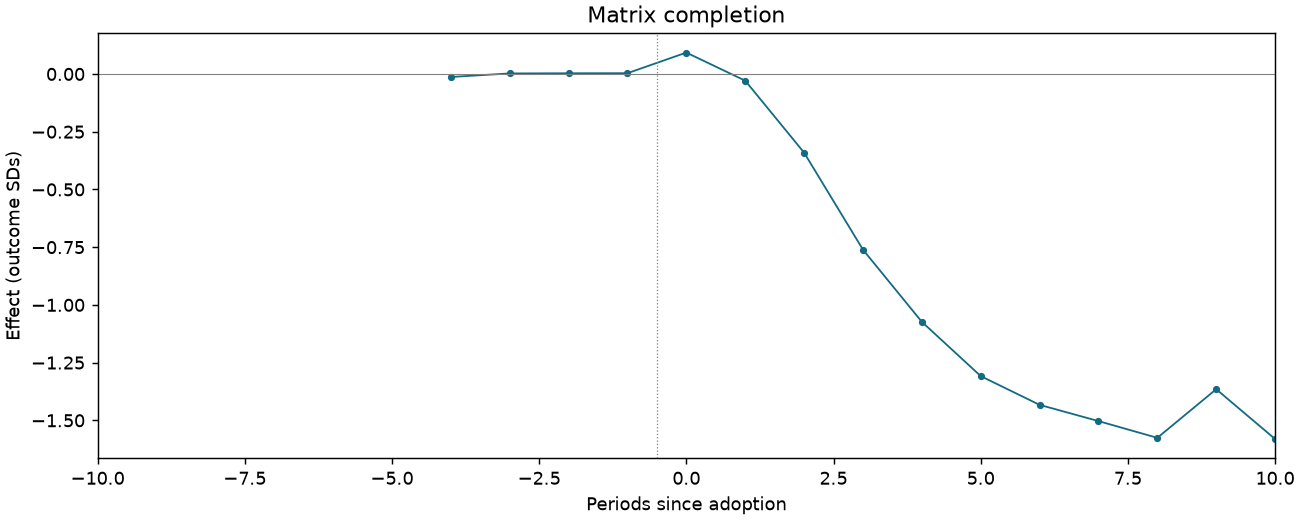
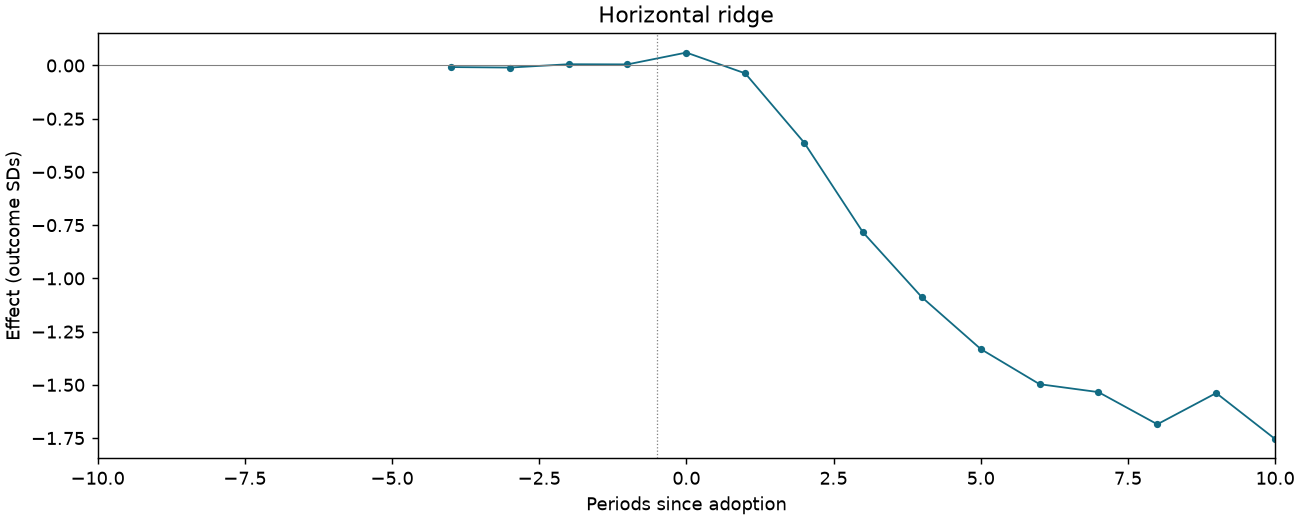
Material Value per Boat
1,522 observations · 142 units · 142 clusters · 105 treated / 37 control units.
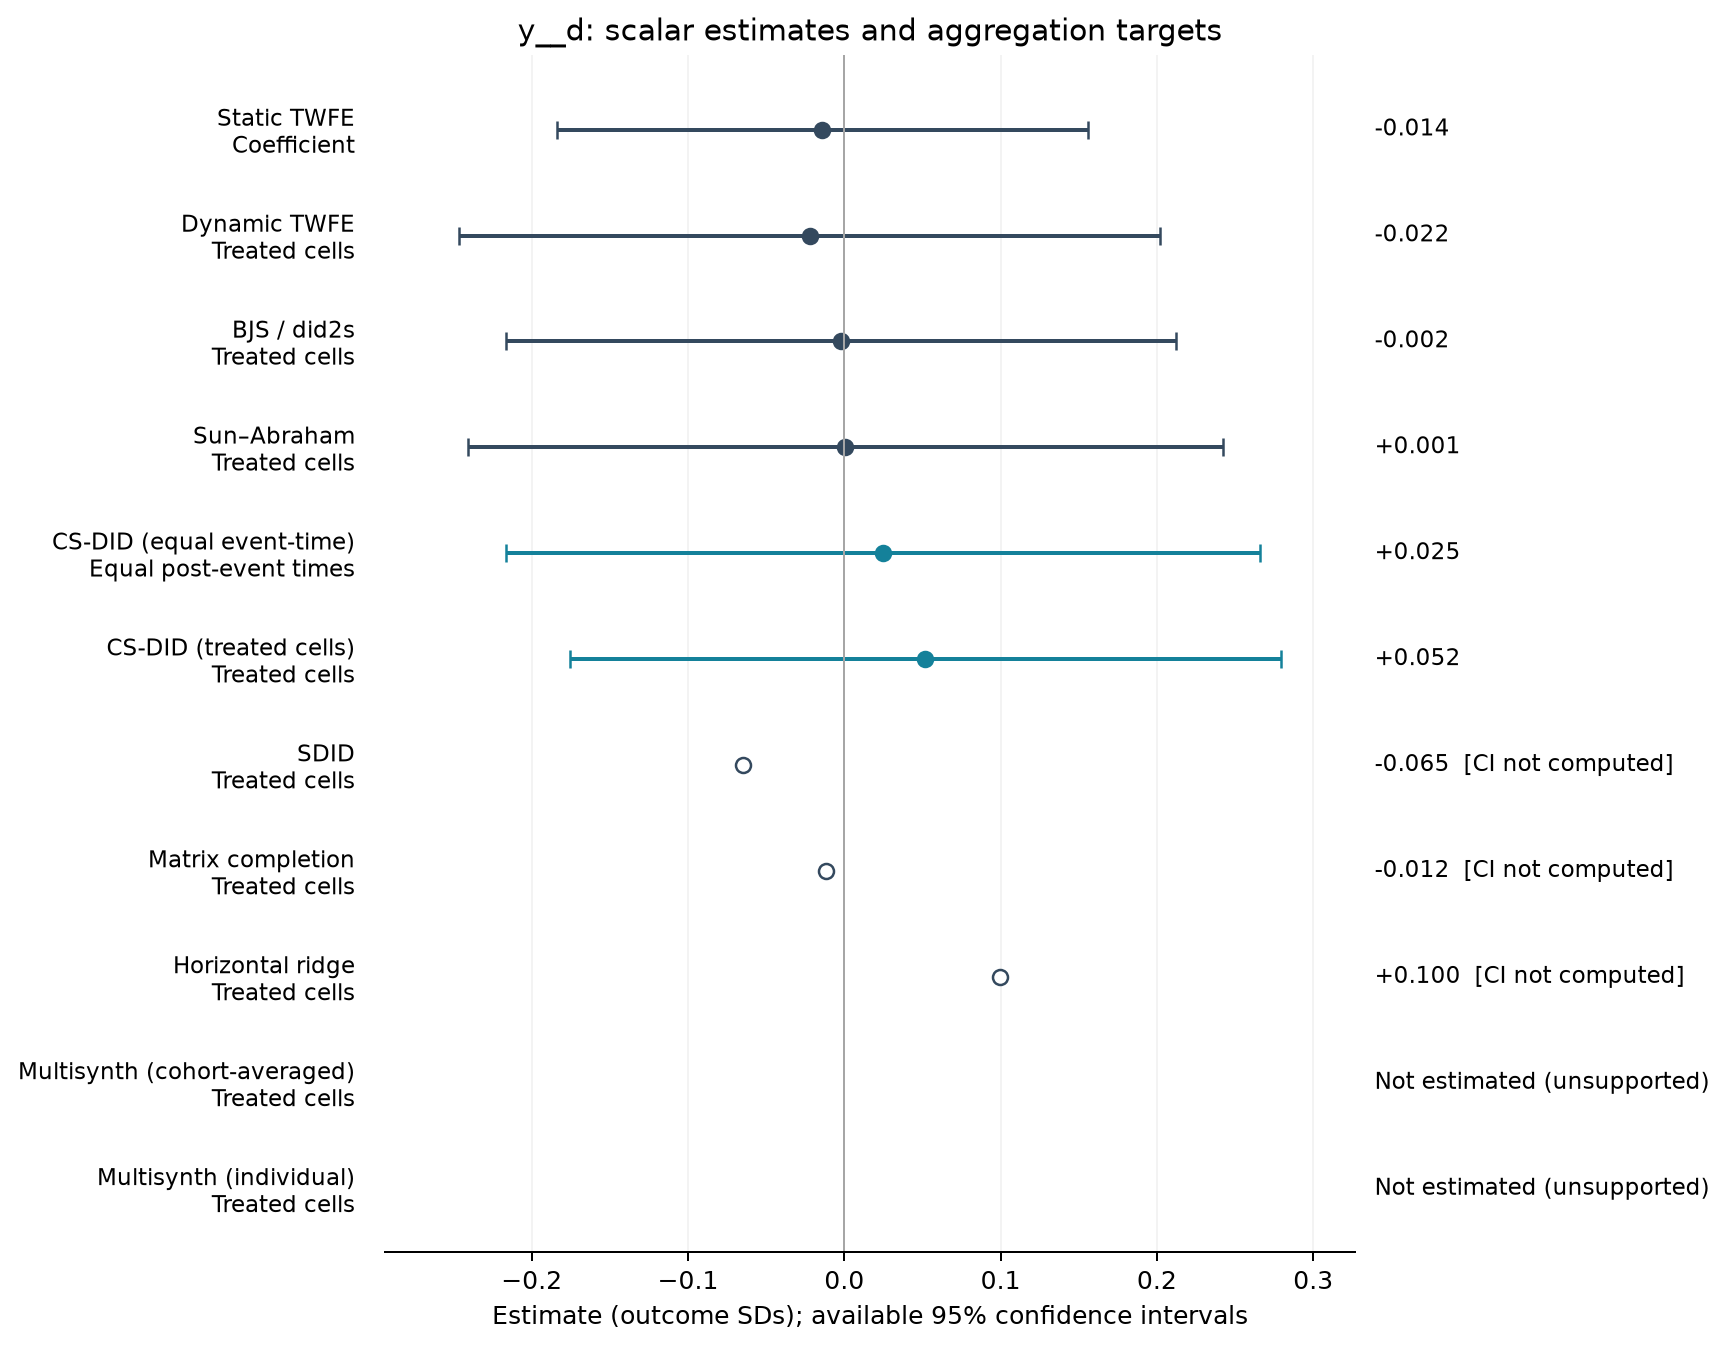
Estimate comparison
| Estimator | Estimate (SDs) | SE | 95% CI | Averaging |
|---|---|---|---|---|
| Static TWFE | -0.014 | 0.086 | [-0.184, 0.156] | Coefficient |
| Dynamic TWFE | -0.022 | 0.113 | [-0.246, 0.202] | Treated cells |
| BJS / did2s | -0.002 | 0.108 | [-0.217, 0.212] | Treated cells |
| Sun–Abraham | 0.001 | 0.122 | [-0.241, 0.242] | Treated cells |
| CS-DID (equal event-time) | 0.025 | 0.123 | [-0.217, 0.266] | Equal post-event times |
| CS-DID (treated cells) | 0.052 | 0.116 | [-0.176, 0.280] | Treated cells |
| SDID | -0.065 | — | — | Treated cells |
| Matrix completion | -0.012 | — | — | Treated cells |
| Horizontal ridge | 0.100 | — | — | Treated cells |
Event studies
Periods −10 to +10; pointwise 95% intervals where available.
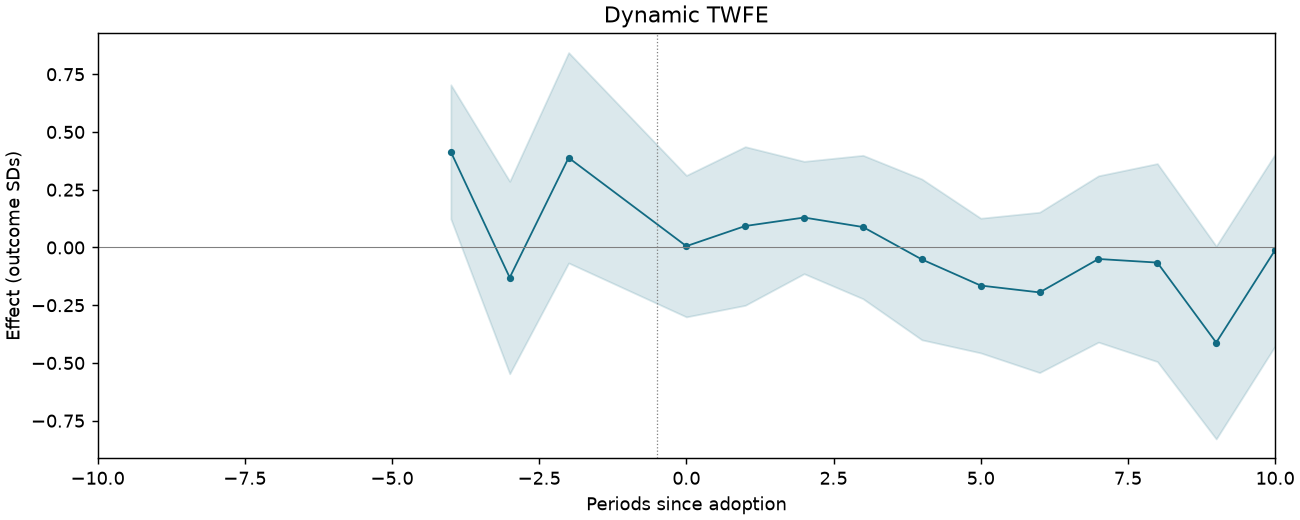
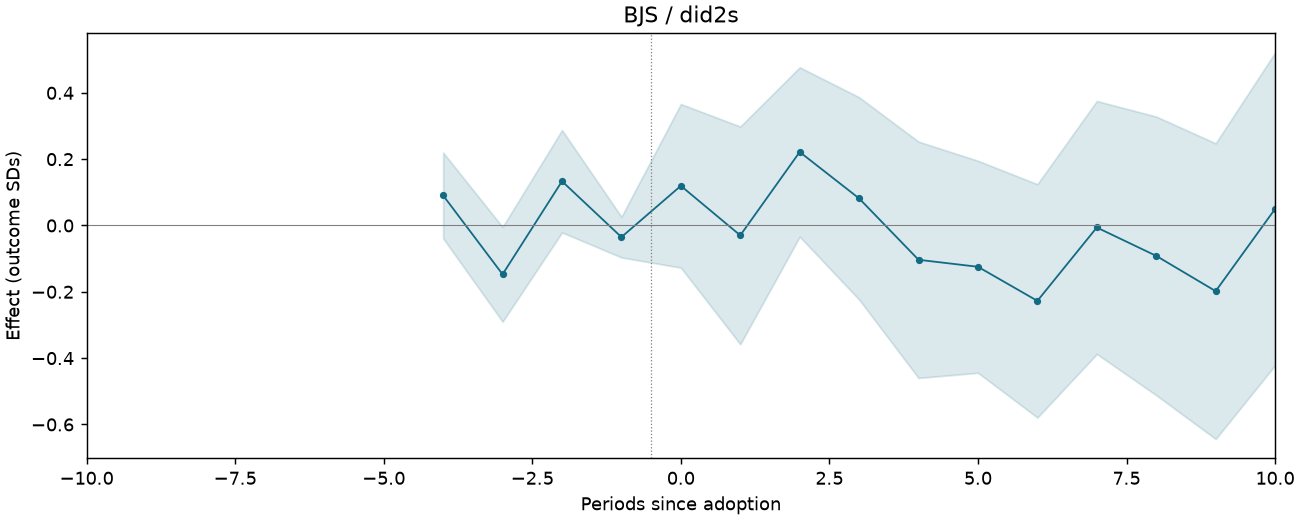
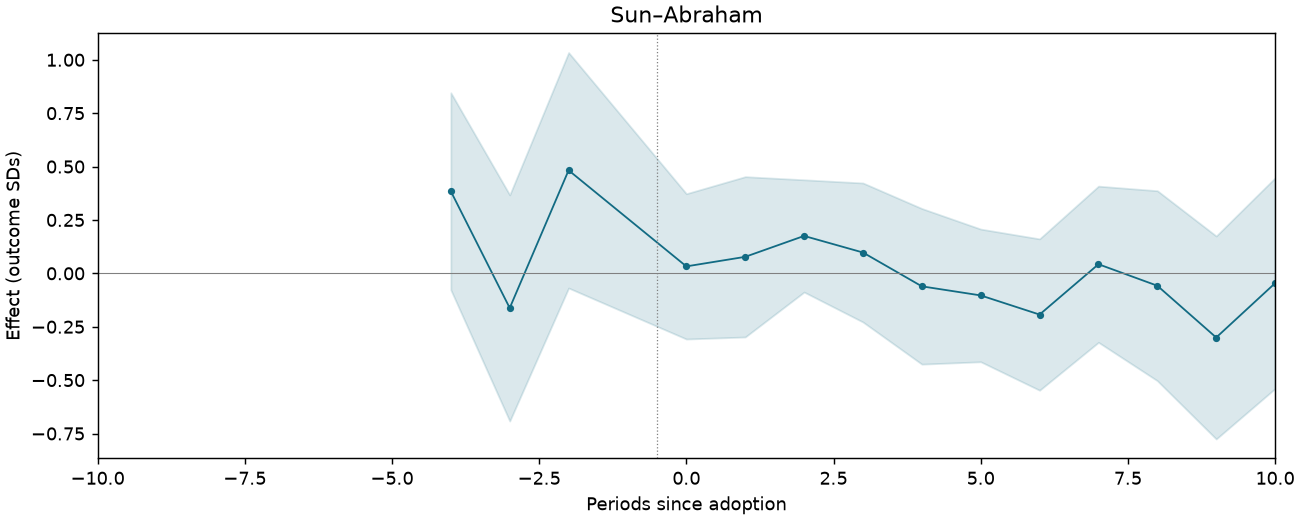
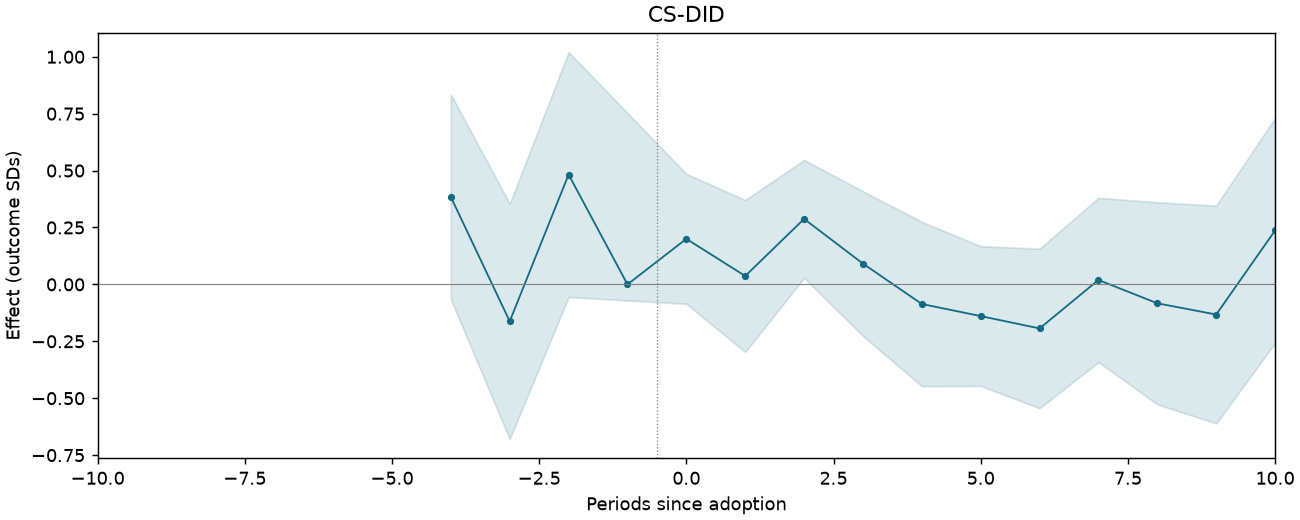
Variable Costs per Boat
1,519 observations · 142 units · 142 clusters · 105 treated / 37 control units.
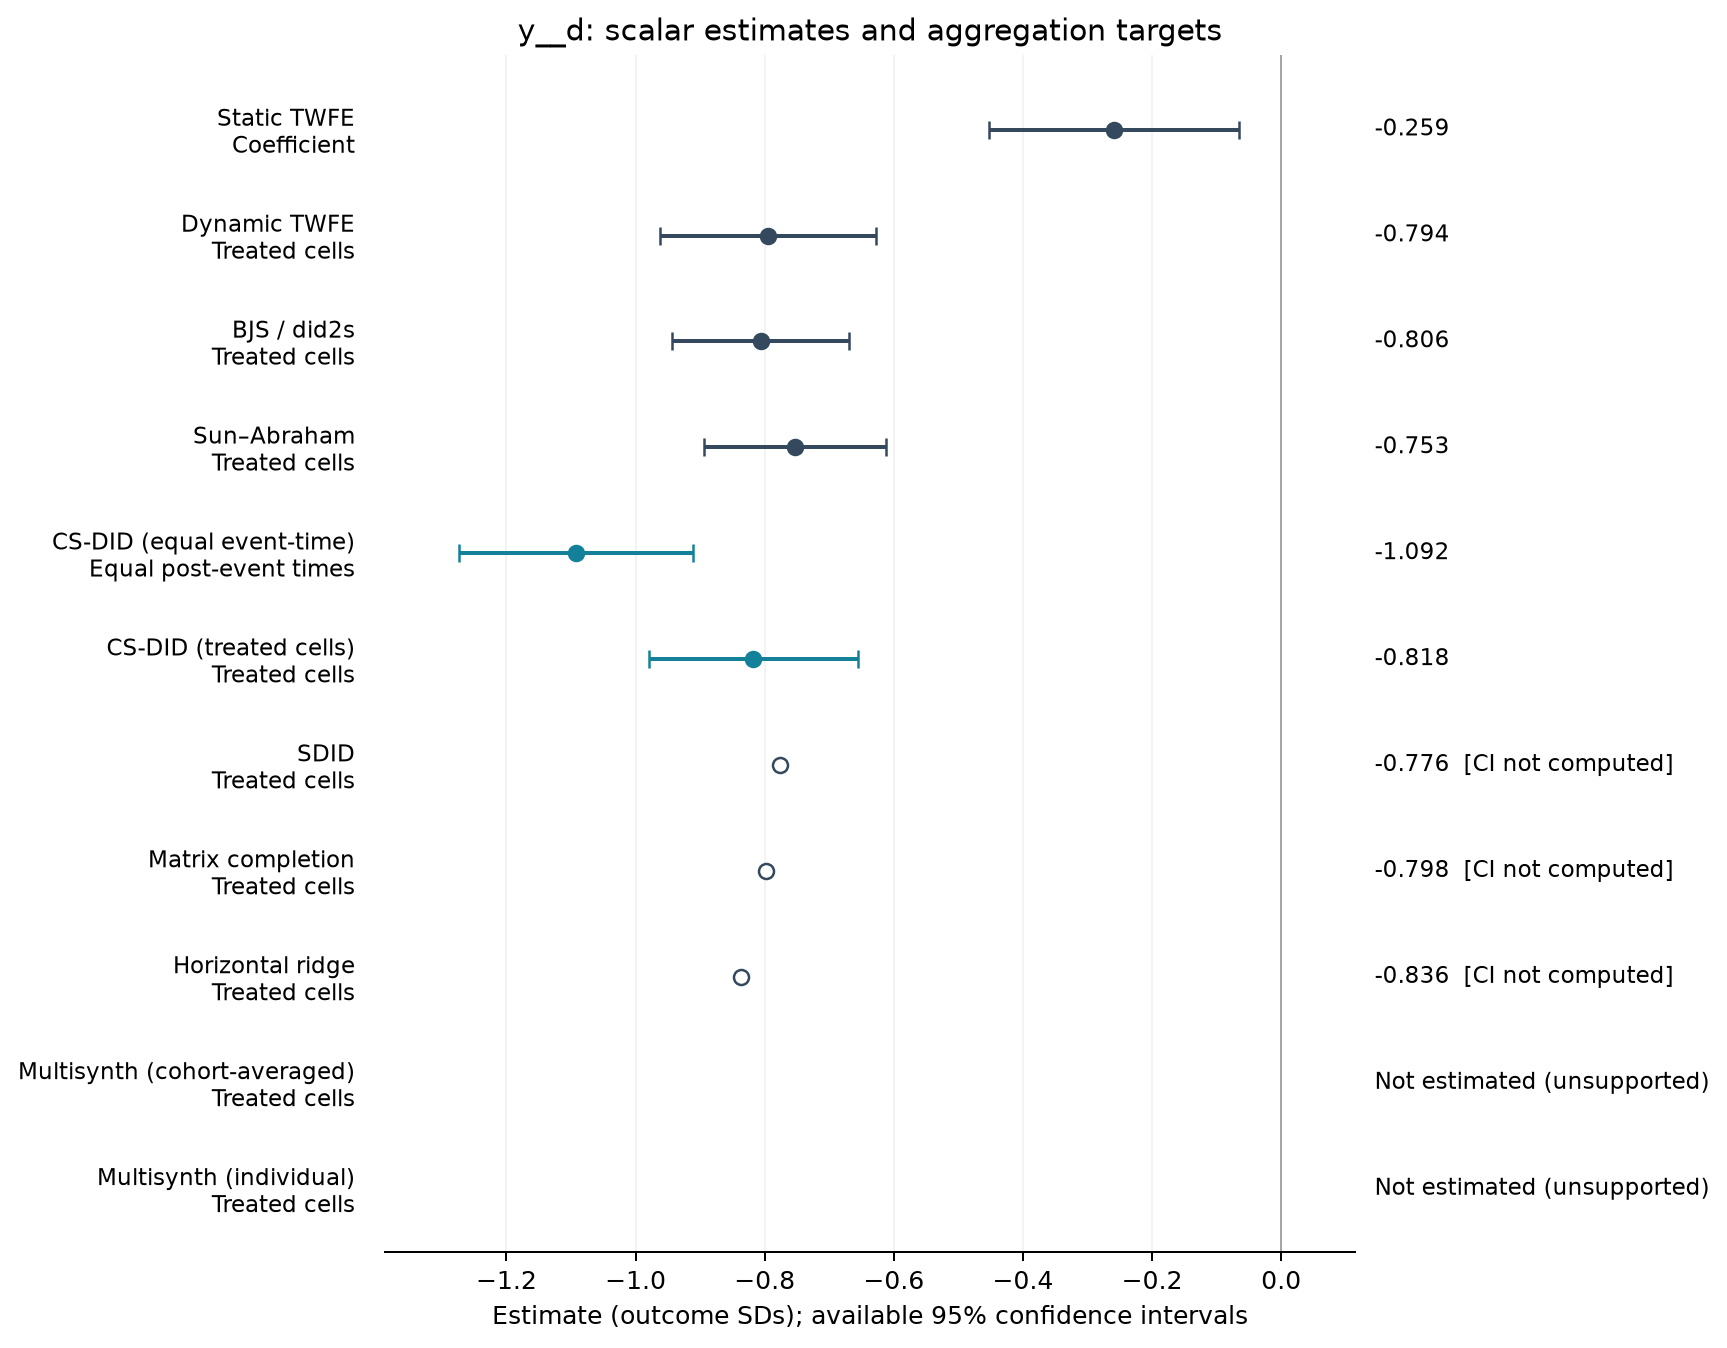
Estimate comparison
| Estimator | Estimate (SDs) | SE | 95% CI | Averaging |
|---|---|---|---|---|
| Static TWFE | -0.259 | 0.098 | [-0.452, -0.066] | Coefficient |
| Dynamic TWFE | -0.794 | 0.084 | [-0.961, -0.627] | Treated cells |
| BJS / did2s | -0.806 | 0.069 | [-0.944, -0.669] | Treated cells |
| Sun–Abraham | -0.753 | 0.071 | [-0.894, -0.612] | Treated cells |
| CS-DID (equal event-time) | -1.092 | 0.093 | [-1.273, -0.910] | Equal post-event times |
| CS-DID (treated cells) | -0.818 | 0.083 | [-0.980, -0.656] | Treated cells |
| SDID | -0.776 | — | — | Treated cells |
| Matrix completion | -0.798 | — | — | Treated cells |
| Horizontal ridge | -0.836 | — | — | Treated cells |
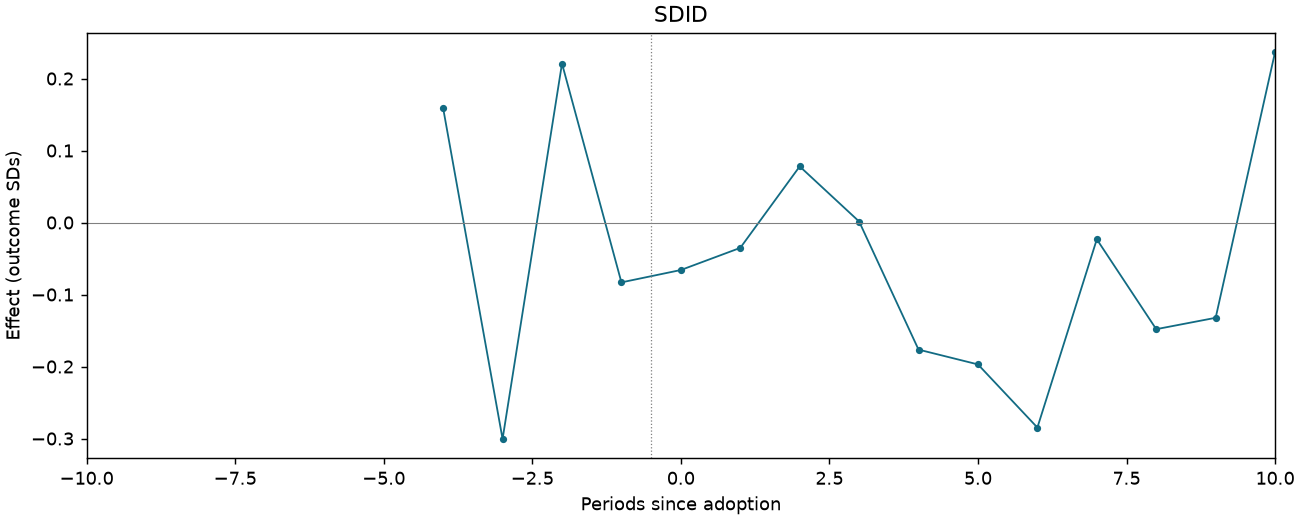
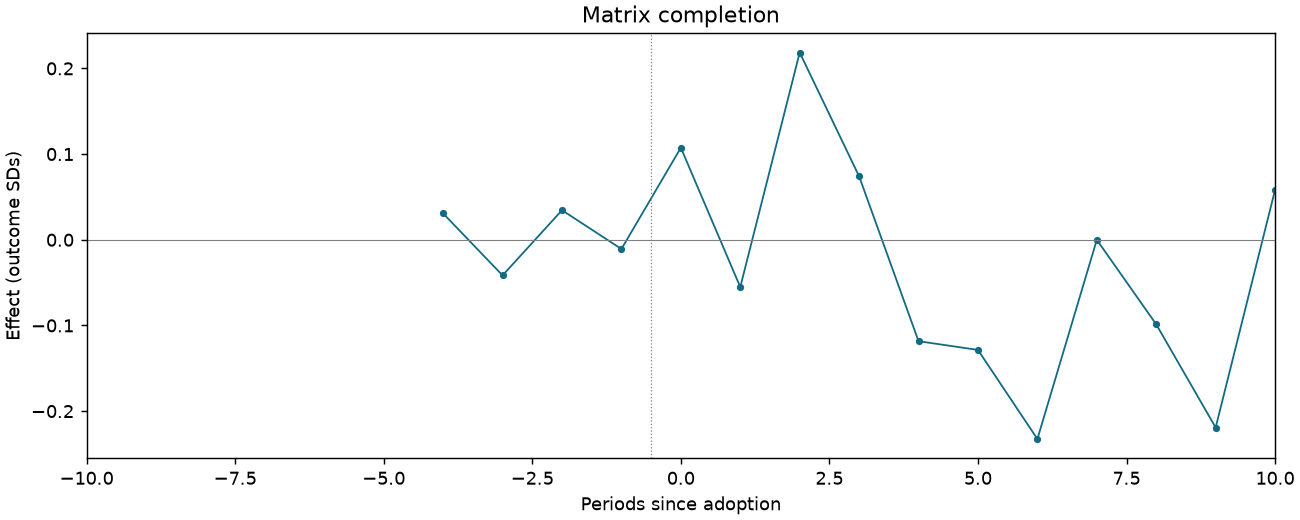
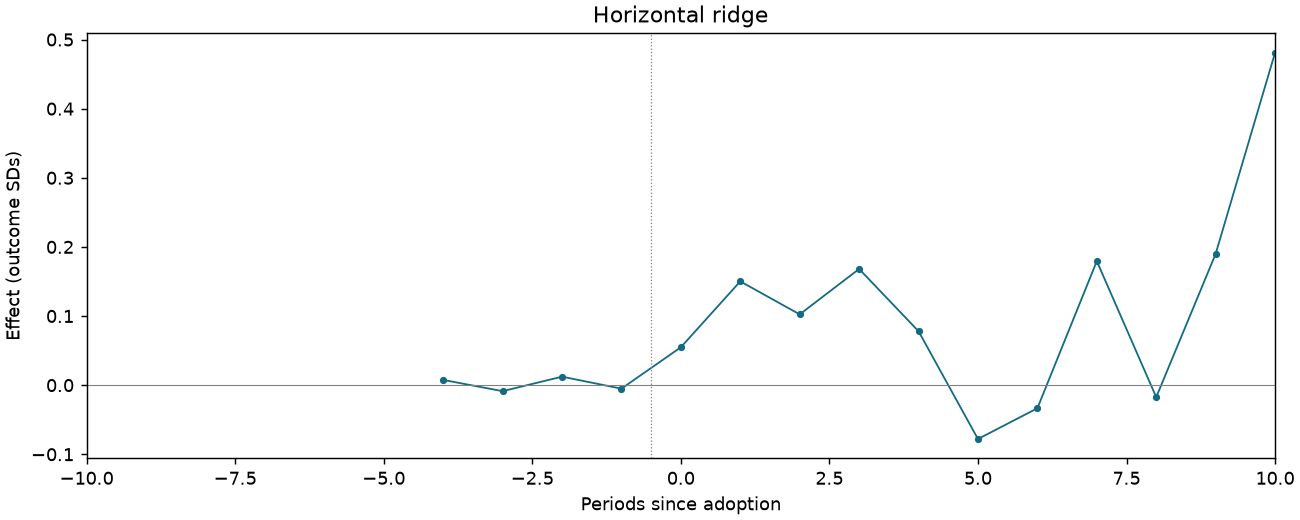
Event studies
Periods −10 to +10; pointwise 95% intervals where available.
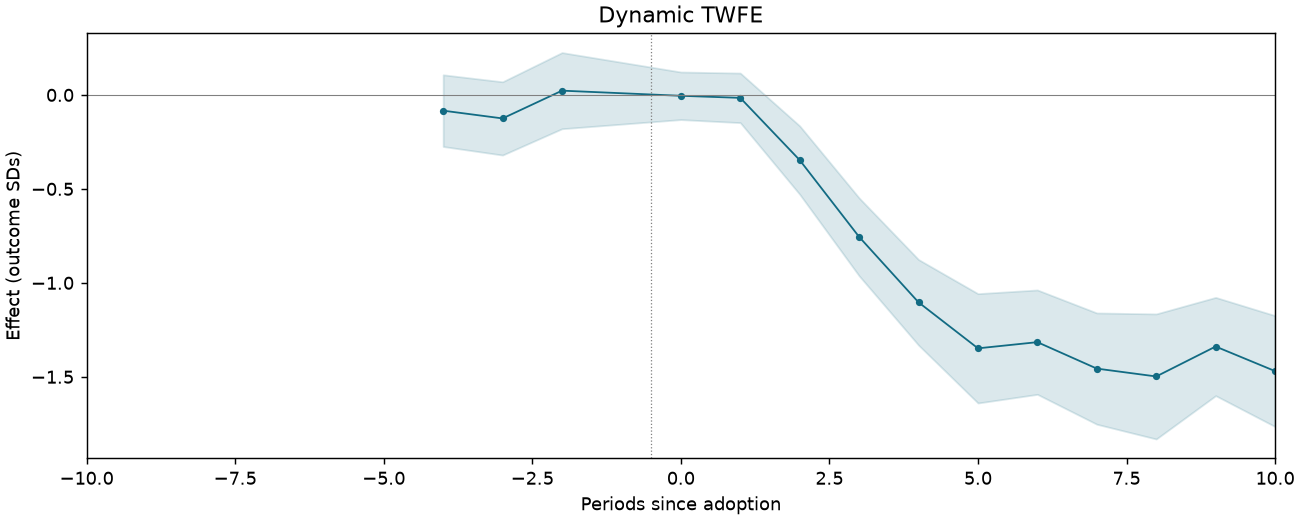
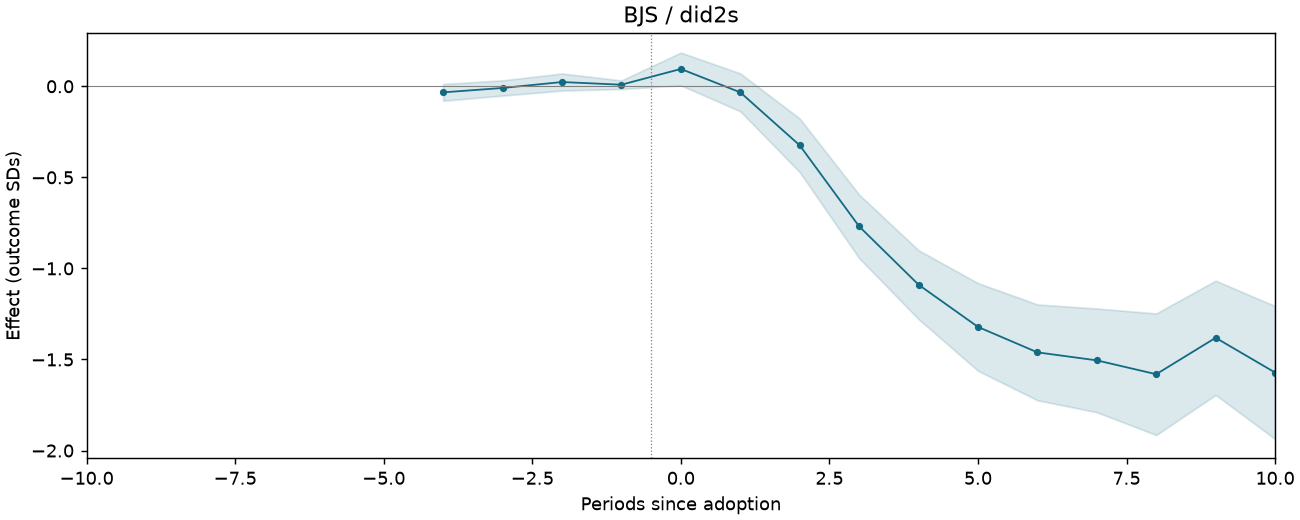
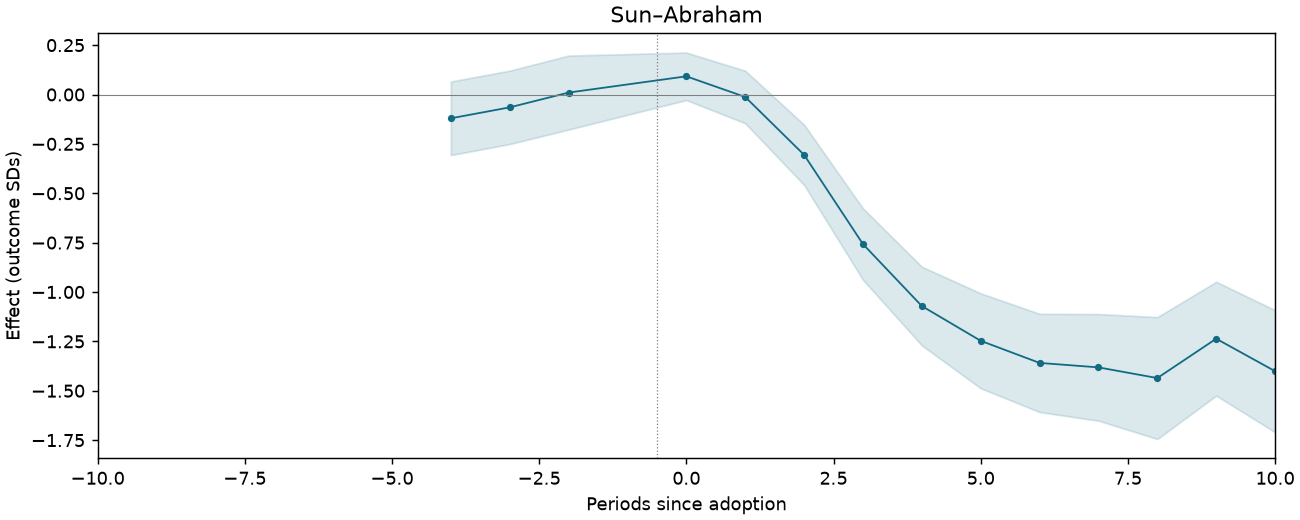
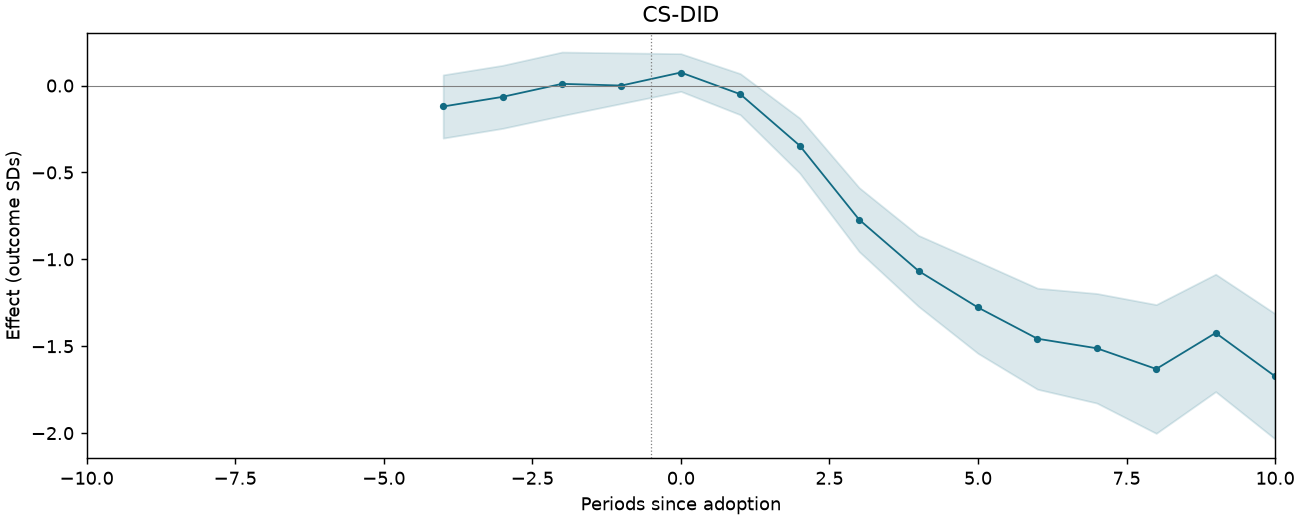
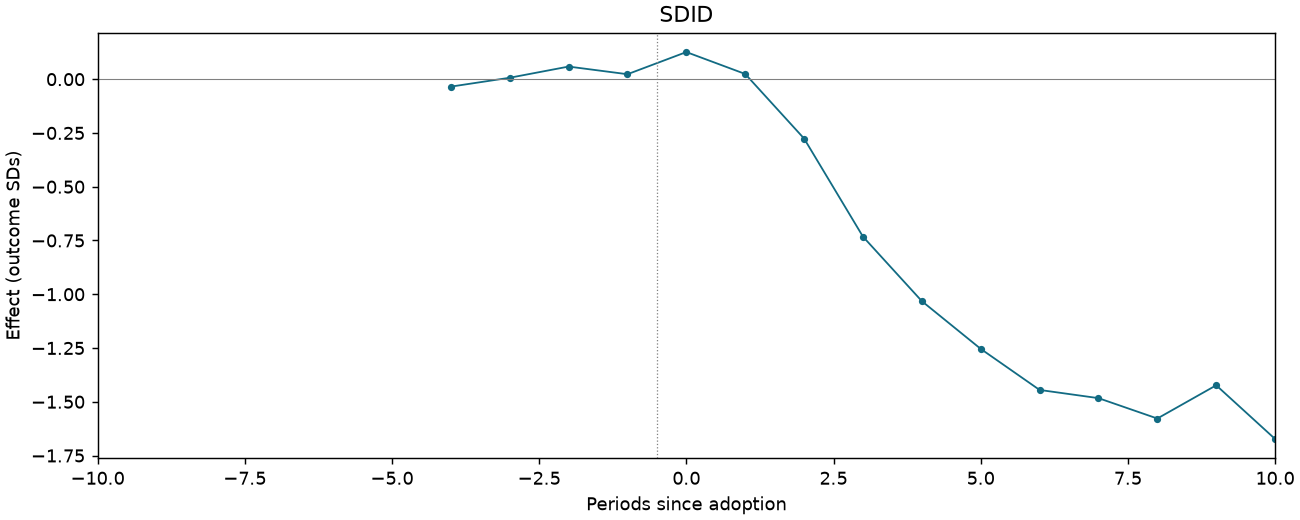
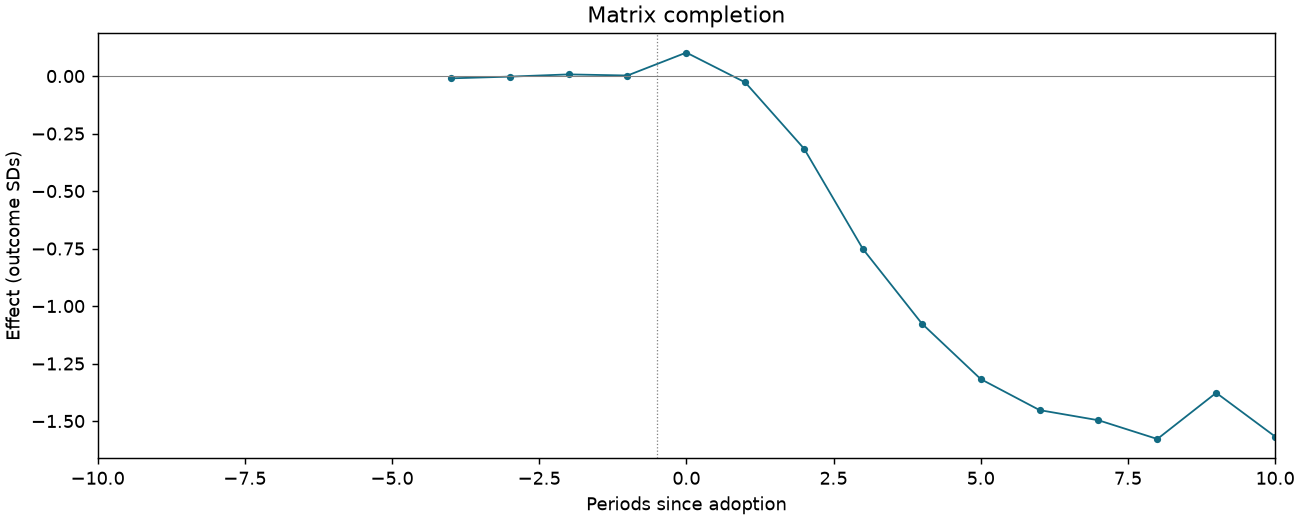
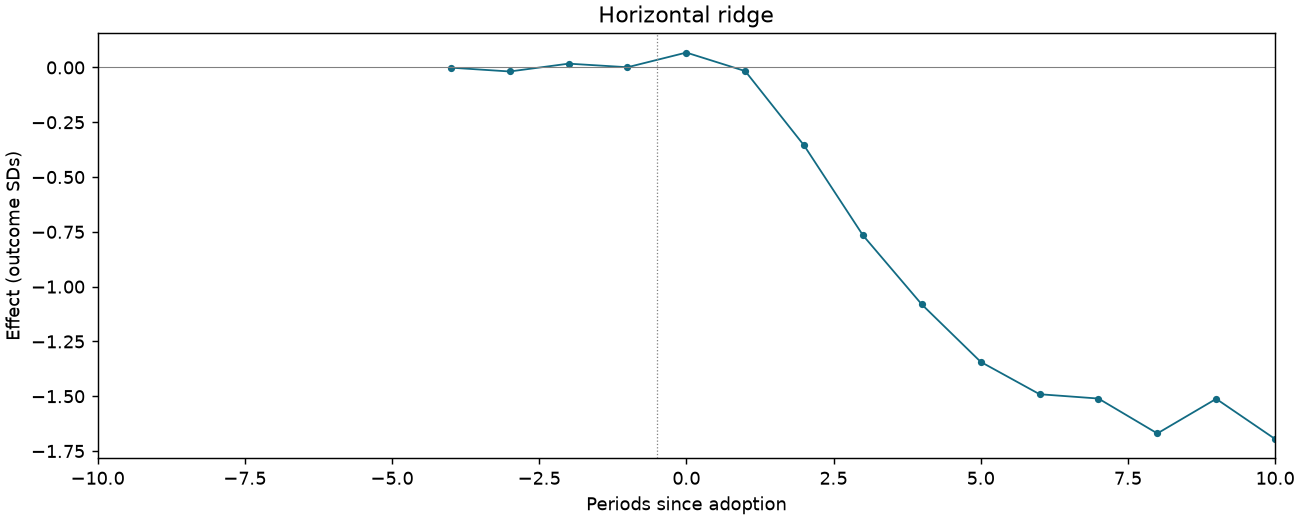
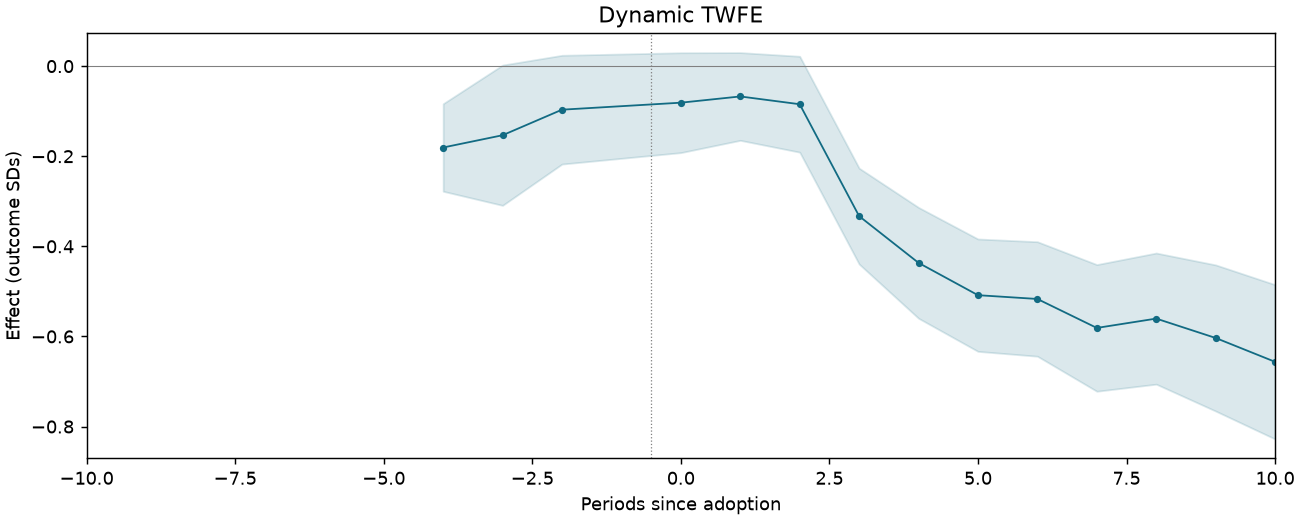
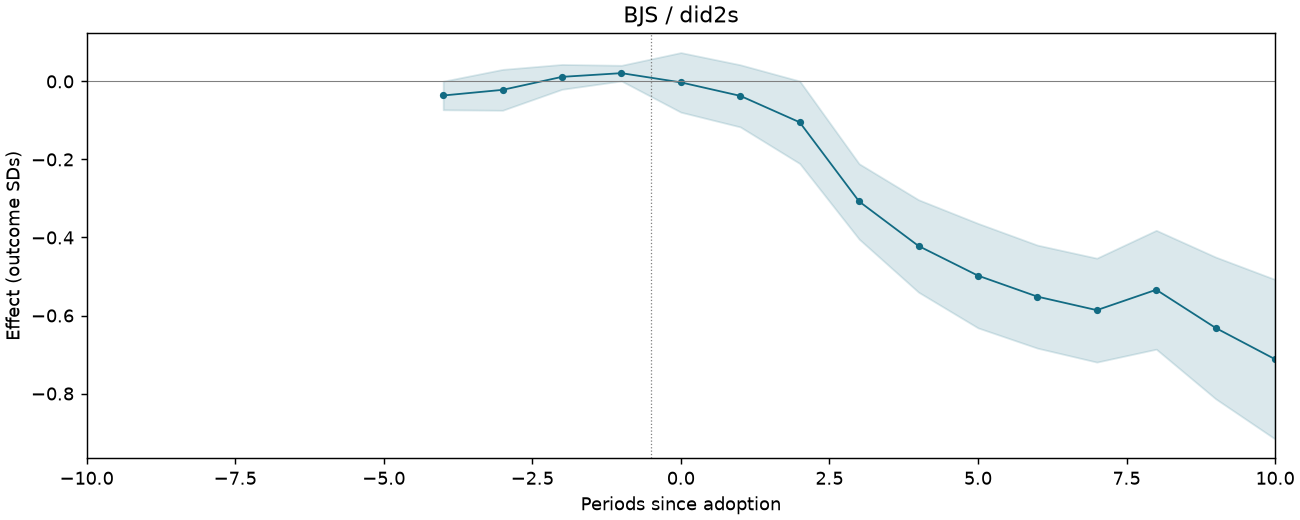
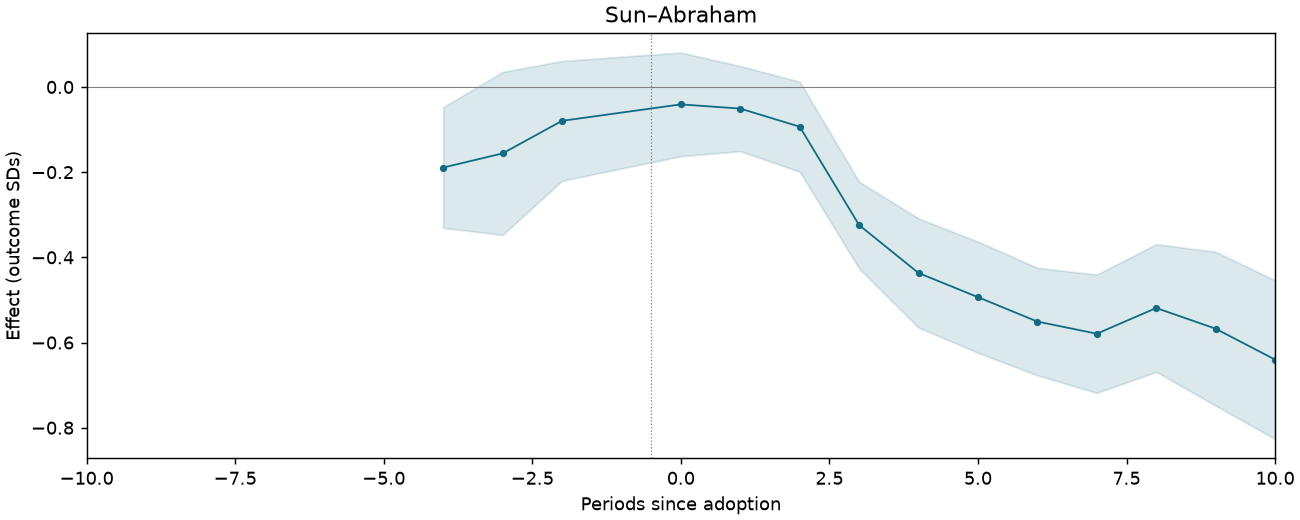
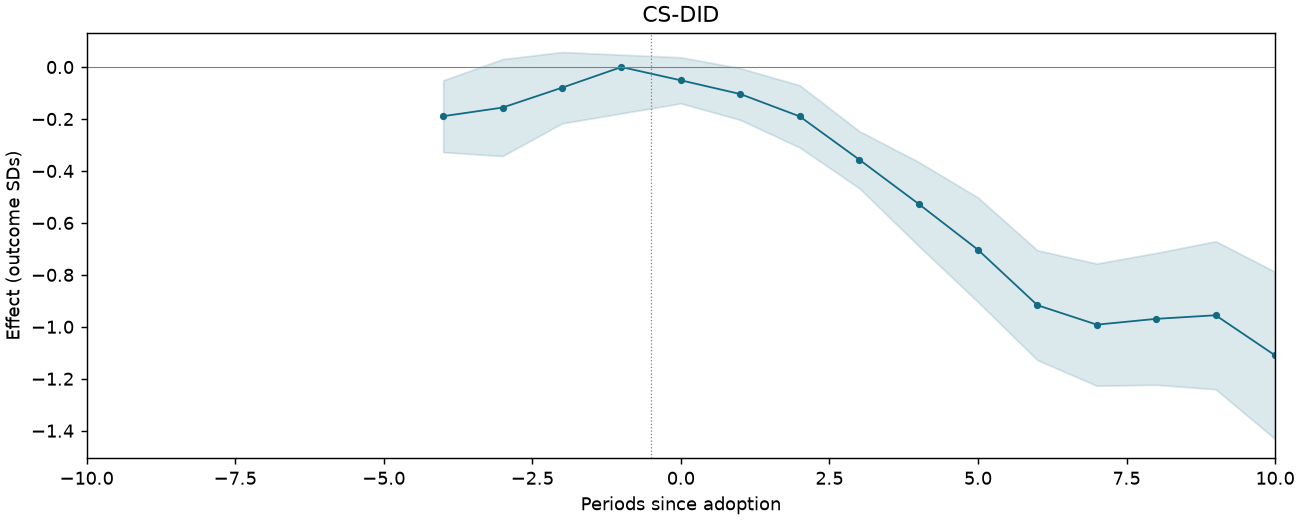
Labor Value per Boat-Year
1,519 observations · 142 units · 142 clusters · 105 treated / 37 control units.
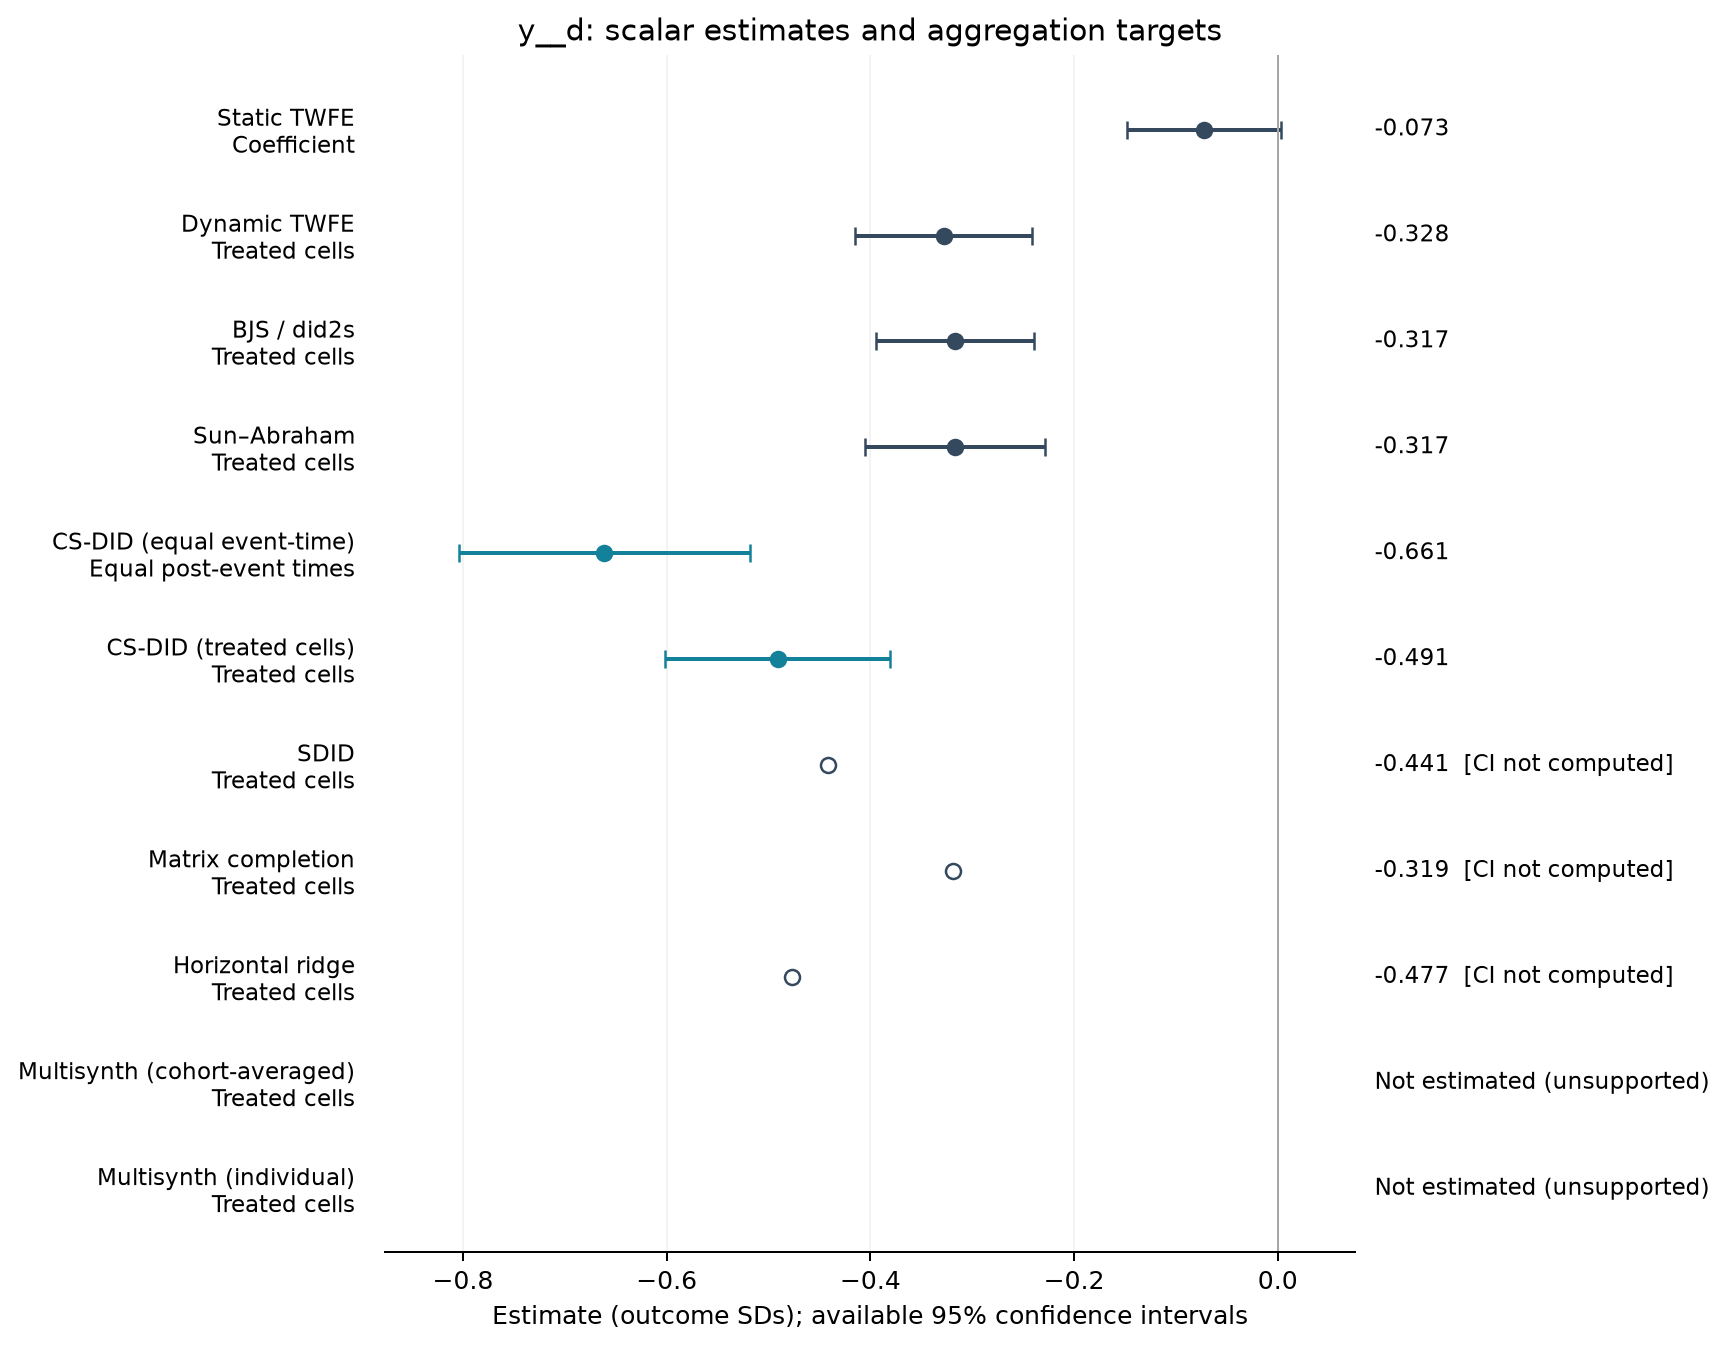
Estimate comparison
| Estimator | Estimate (SDs) | SE | 95% CI | Averaging |
|---|---|---|---|---|
| Static TWFE | -0.073 | 0.038 | [-0.148, 0.003] | Coefficient |
| Dynamic TWFE | -0.328 | 0.044 | [-0.415, -0.241] | Treated cells |
| BJS / did2s | -0.317 | 0.039 | [-0.394, -0.239] | Treated cells |
| Sun–Abraham | -0.317 | 0.045 | [-0.405, -0.229] | Treated cells |
| CS-DID (equal event-time) | -0.661 | 0.073 | [-0.804, -0.519] | Equal post-event times |
| CS-DID (treated cells) | -0.491 | 0.056 | [-0.602, -0.380] | Treated cells |
| SDID | -0.441 | — | — | Treated cells |
| Matrix completion | -0.319 | — | — | Treated cells |
| Horizontal ridge | -0.477 | — | — | Treated cells |
Event studies
Periods −10 to +10; pointwise 95% intervals where available.
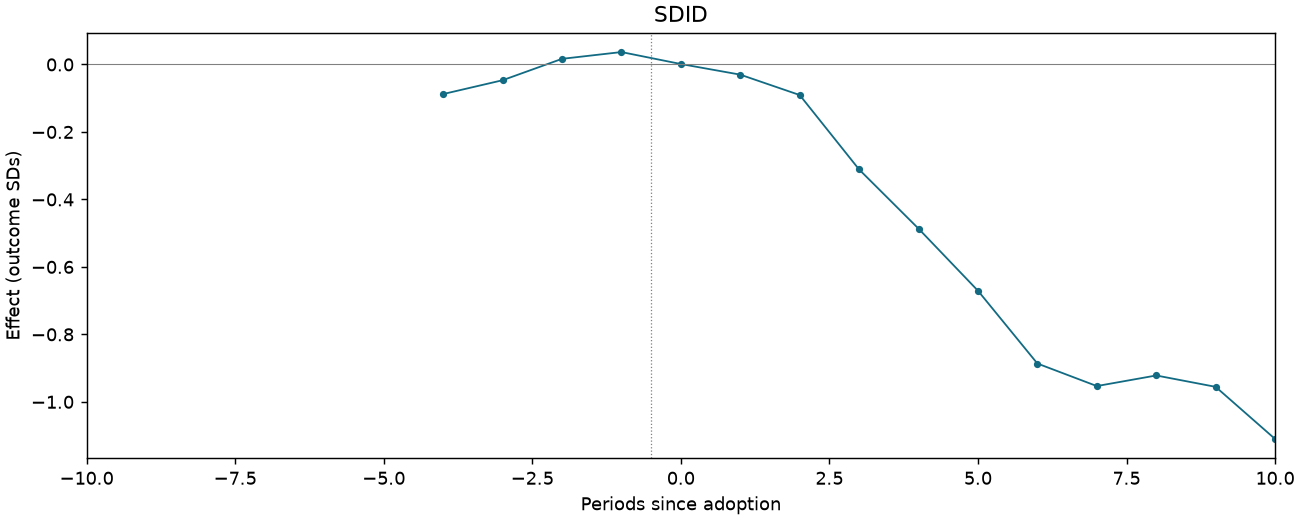
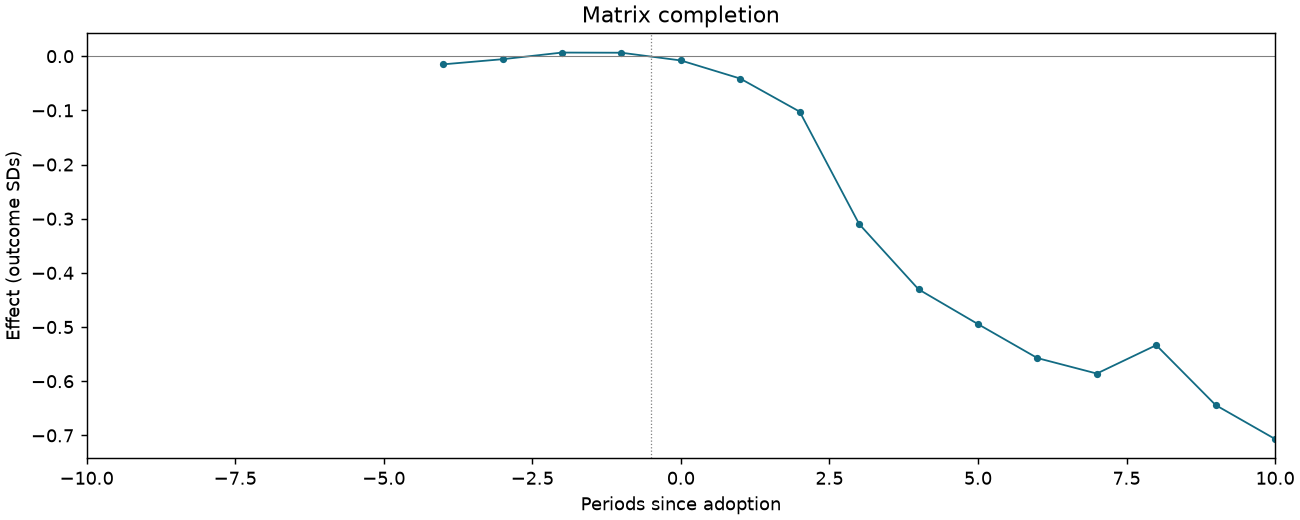
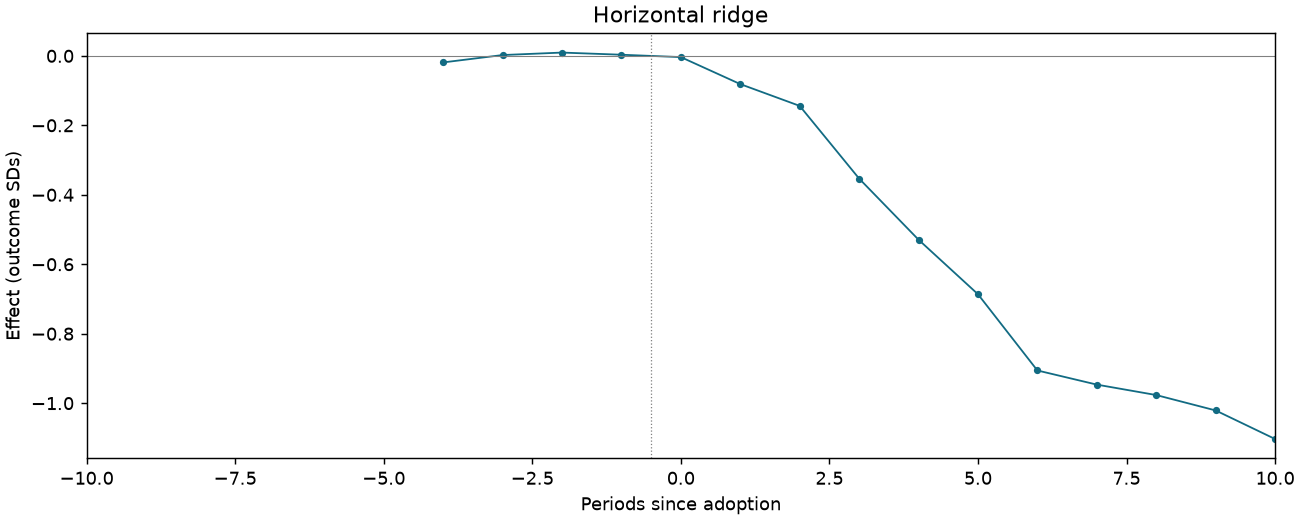
Material Value per Boat-Year
1,522 observations · 142 units · 142 clusters · 105 treated / 37 control units.
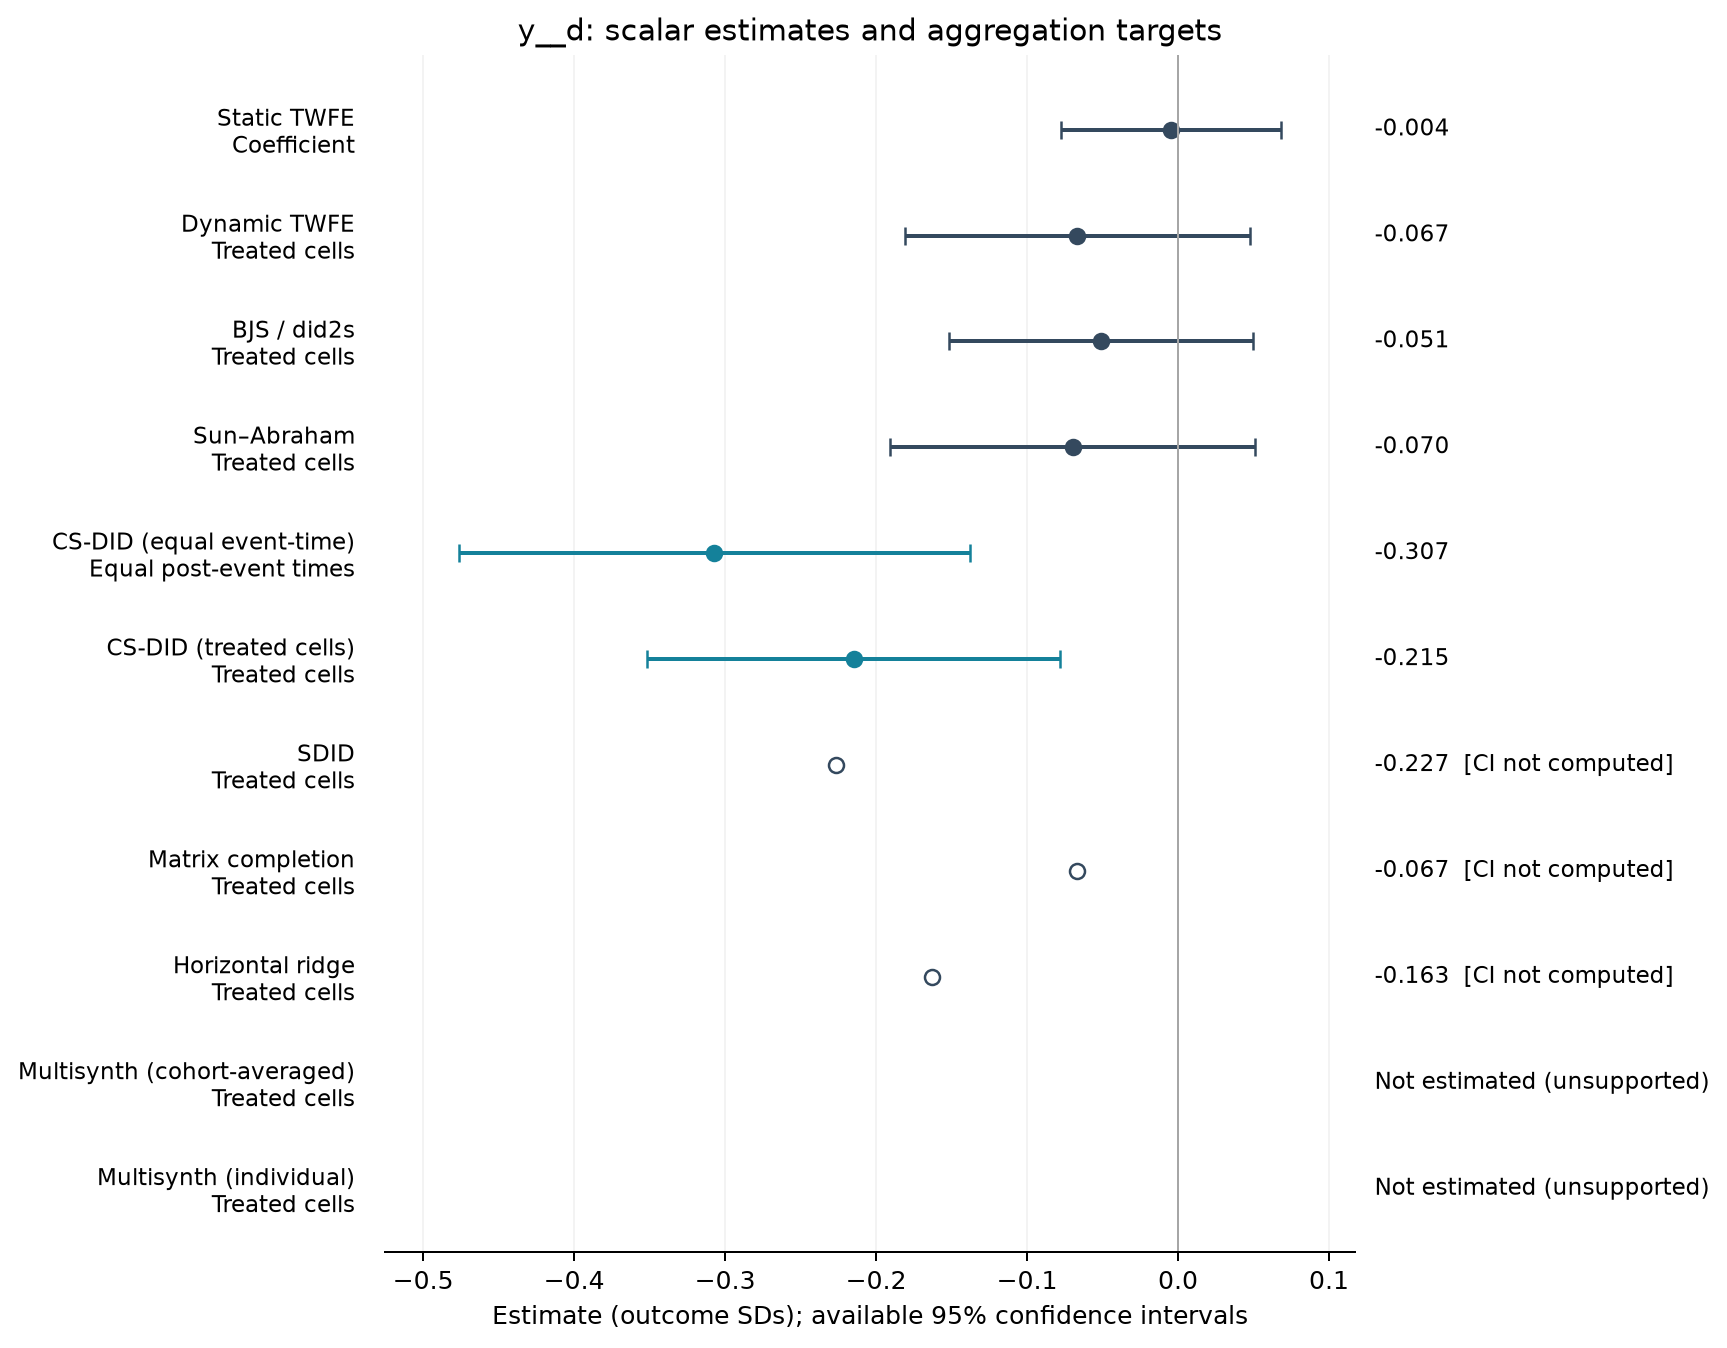
Estimate comparison
| Estimator | Estimate (SDs) | SE | 95% CI | Averaging |
|---|---|---|---|---|
| Static TWFE | -0.004 | 0.037 | [-0.077, 0.068] | Coefficient |
| Dynamic TWFE | -0.067 | 0.058 | [-0.181, 0.047] | Treated cells |
| BJS / did2s | -0.051 | 0.051 | [-0.152, 0.050] | Treated cells |
| Sun–Abraham | -0.070 | 0.061 | [-0.191, 0.051] | Treated cells |
| CS-DID (equal event-time) | -0.307 | 0.086 | [-0.476, -0.138] | Equal post-event times |
| CS-DID (treated cells) | -0.215 | 0.070 | [-0.352, -0.078] | Treated cells |
| SDID | -0.227 | — | — | Treated cells |
| Matrix completion | -0.067 | — | — | Treated cells |
| Horizontal ridge | -0.163 | — | — | Treated cells |
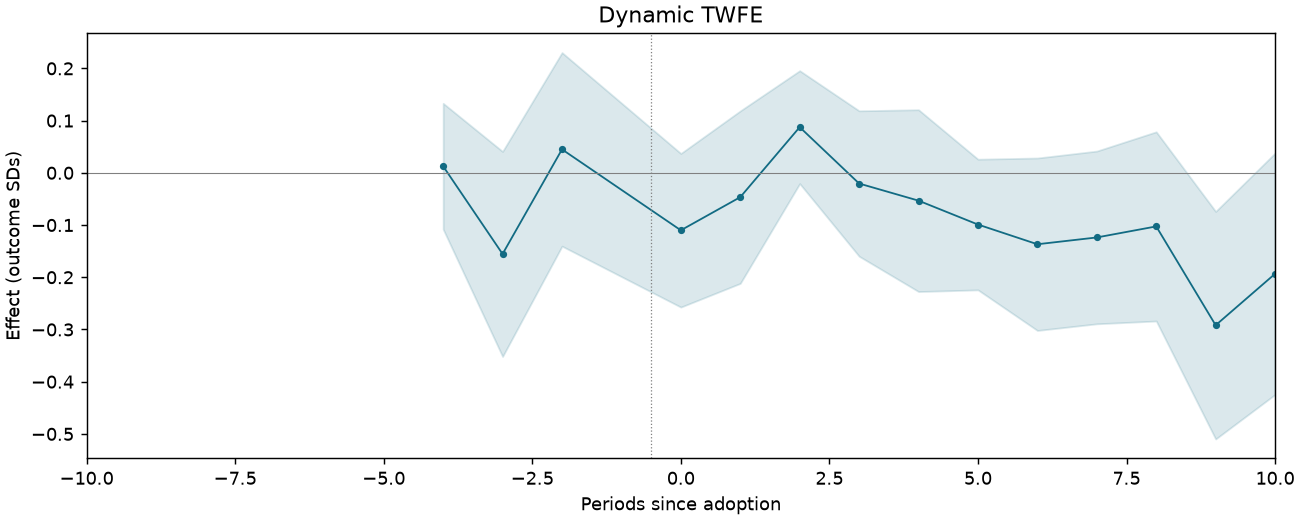
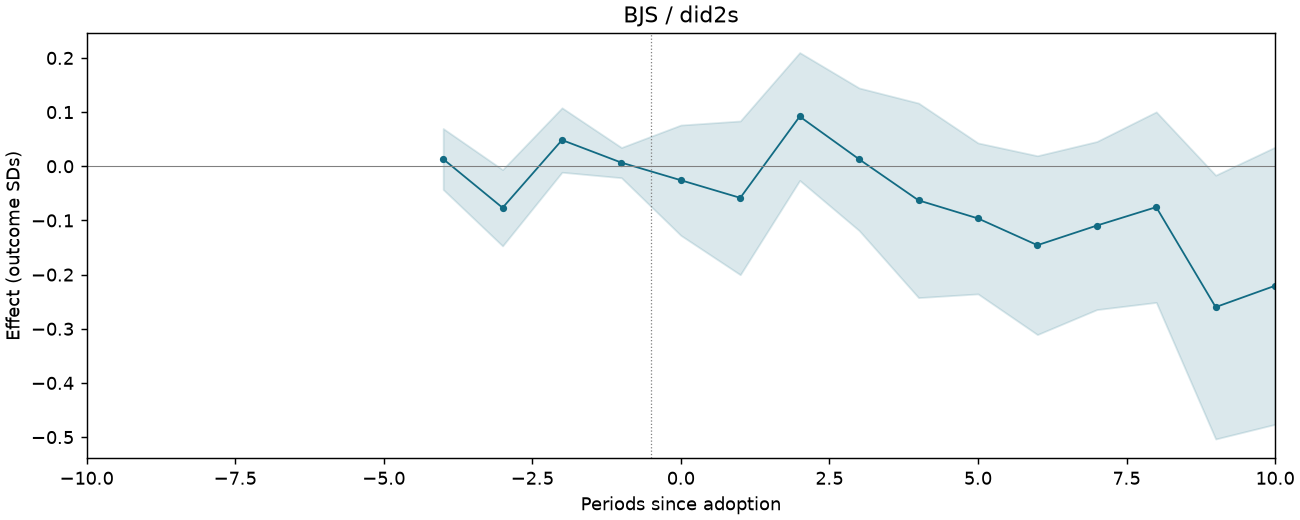
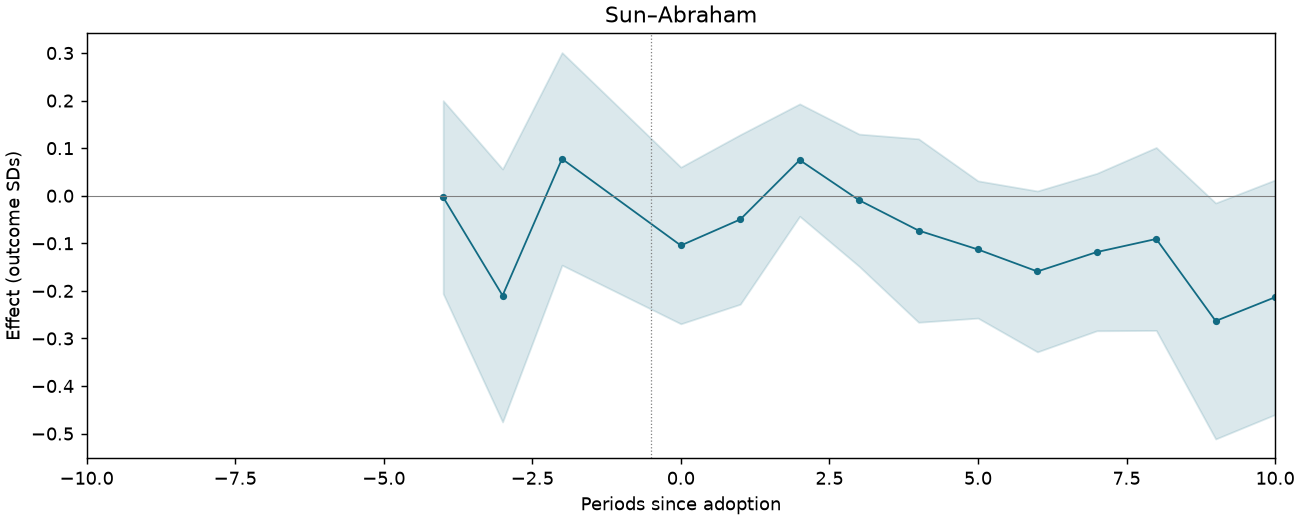
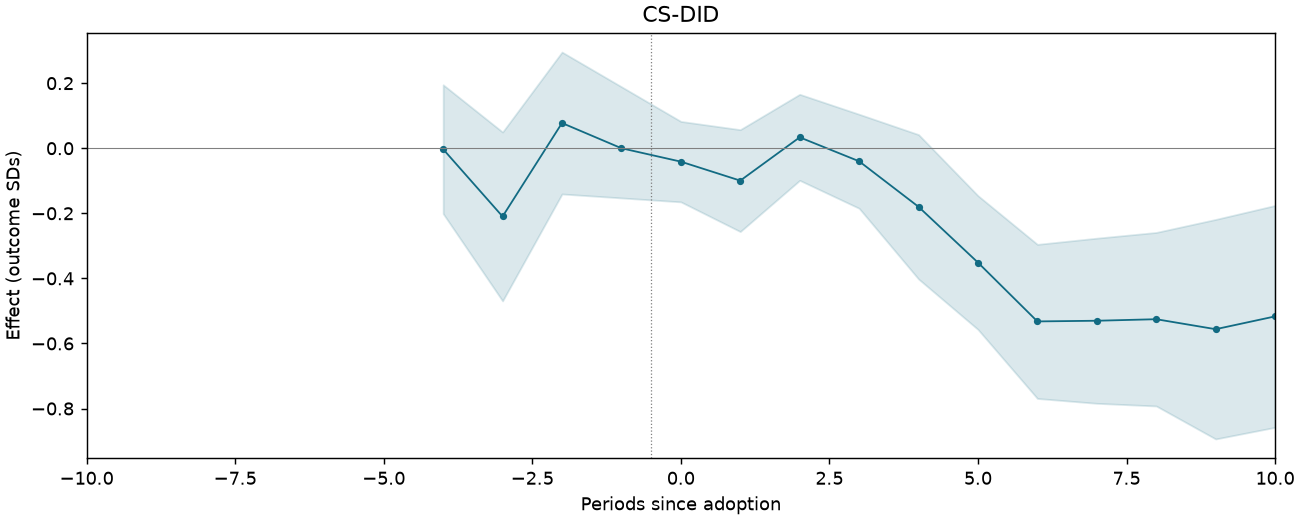
Event studies
Periods −10 to +10; pointwise 95% intervals where available.
Variable Costs per Boat-Year
1,519 observations · 142 units · 142 clusters · 105 treated / 37 control units.
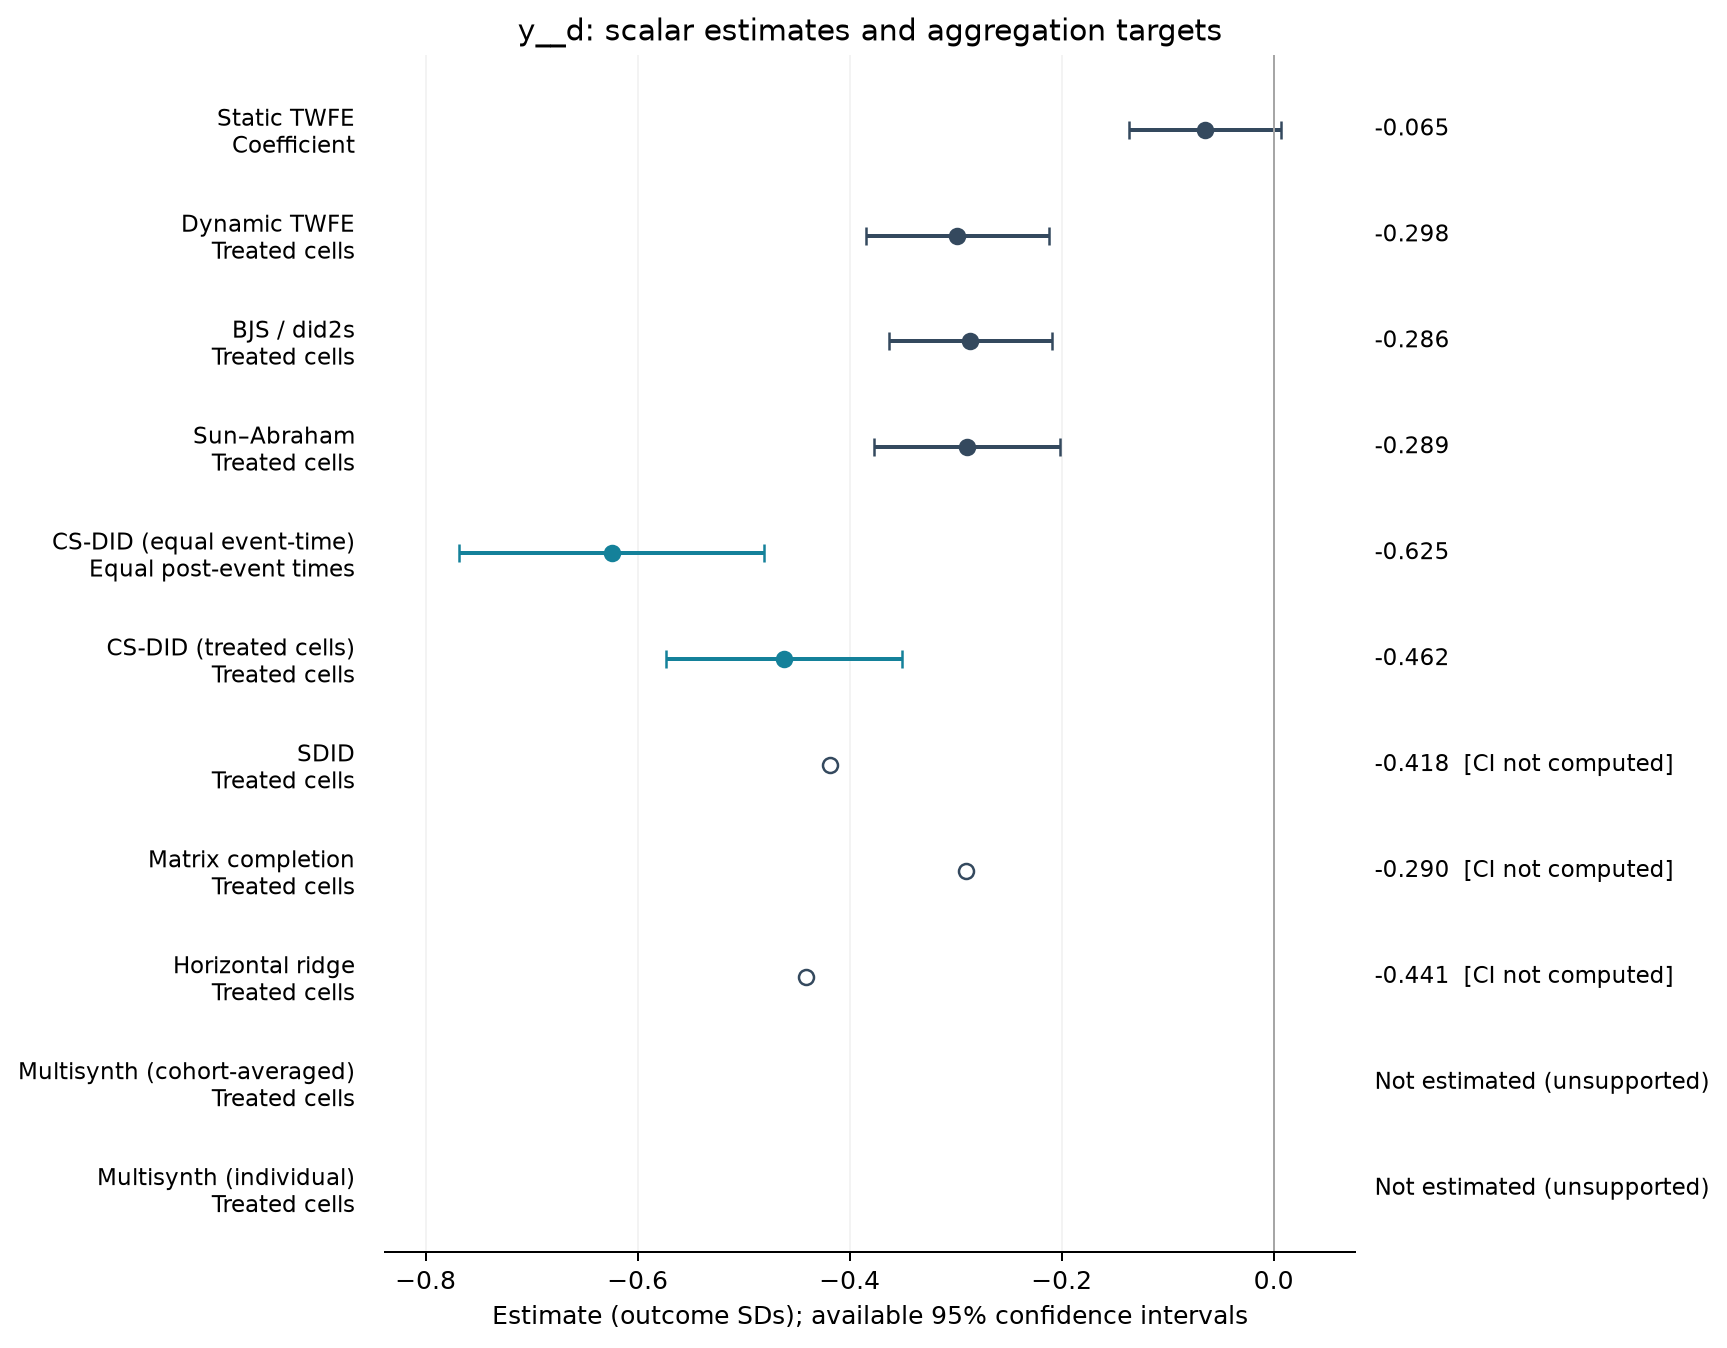
Estimate comparison
| Estimator | Estimate (SDs) | SE | 95% CI | Averaging |
|---|---|---|---|---|
| Static TWFE | -0.065 | 0.036 | [-0.136, 0.007] | Coefficient |
| Dynamic TWFE | -0.298 | 0.044 | [-0.385, -0.212] | Treated cells |
| BJS / did2s | -0.286 | 0.039 | [-0.363, -0.209] | Treated cells |
| Sun–Abraham | -0.289 | 0.044 | [-0.377, -0.201] | Treated cells |
| CS-DID (equal event-time) | -0.625 | 0.073 | [-0.768, -0.481] | Equal post-event times |
| CS-DID (treated cells) | -0.462 | 0.057 | [-0.573, -0.351] | Treated cells |
| SDID | -0.418 | — | — | Treated cells |
| Matrix completion | -0.290 | — | — | Treated cells |
| Horizontal ridge | -0.441 | — | — | Treated cells |
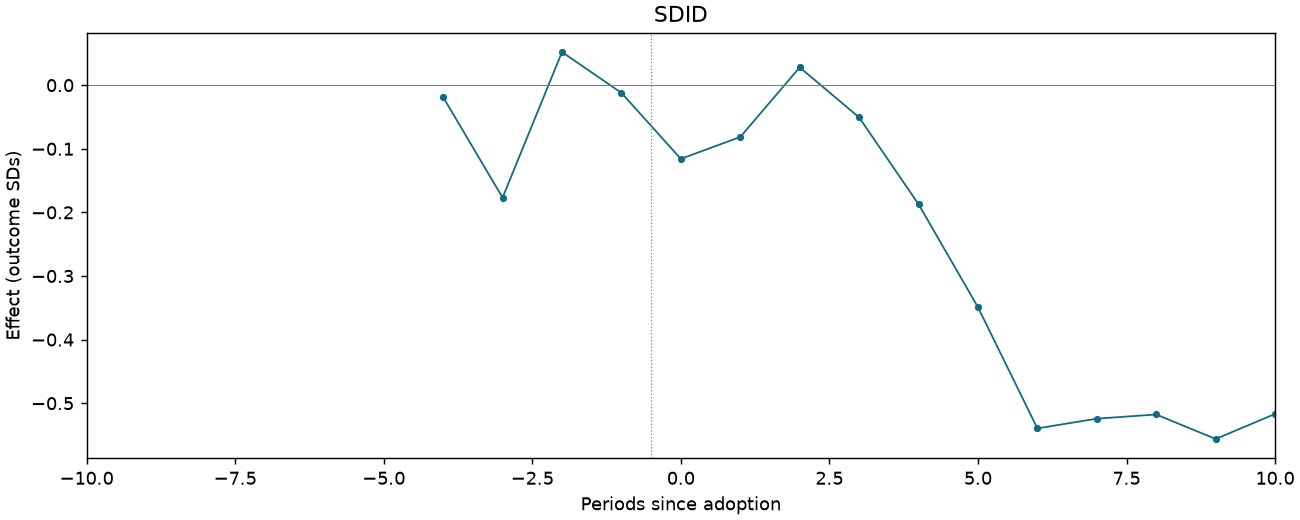
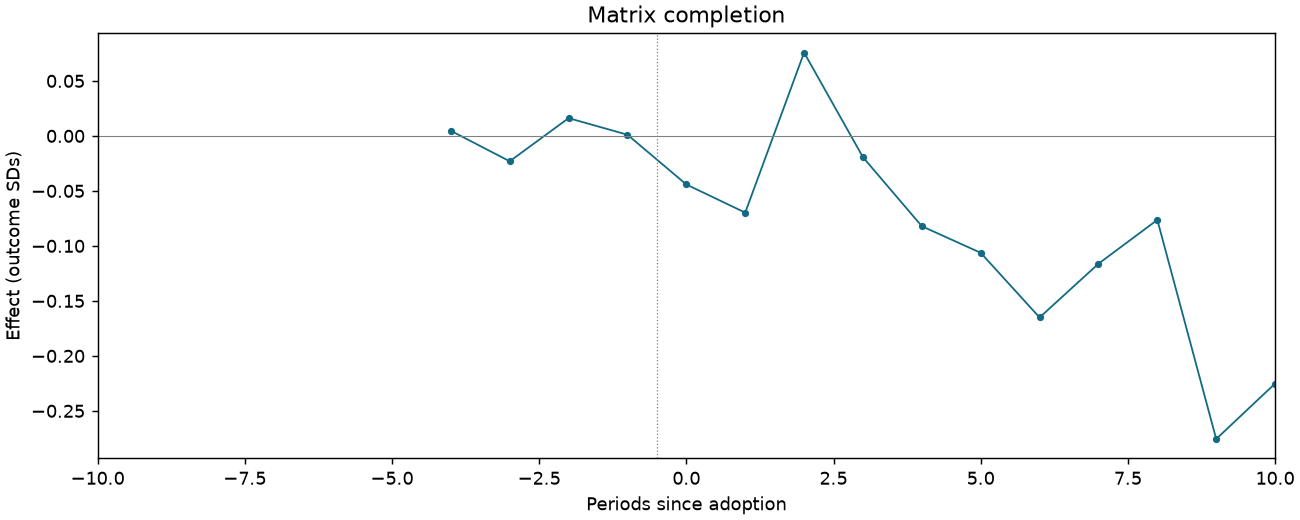
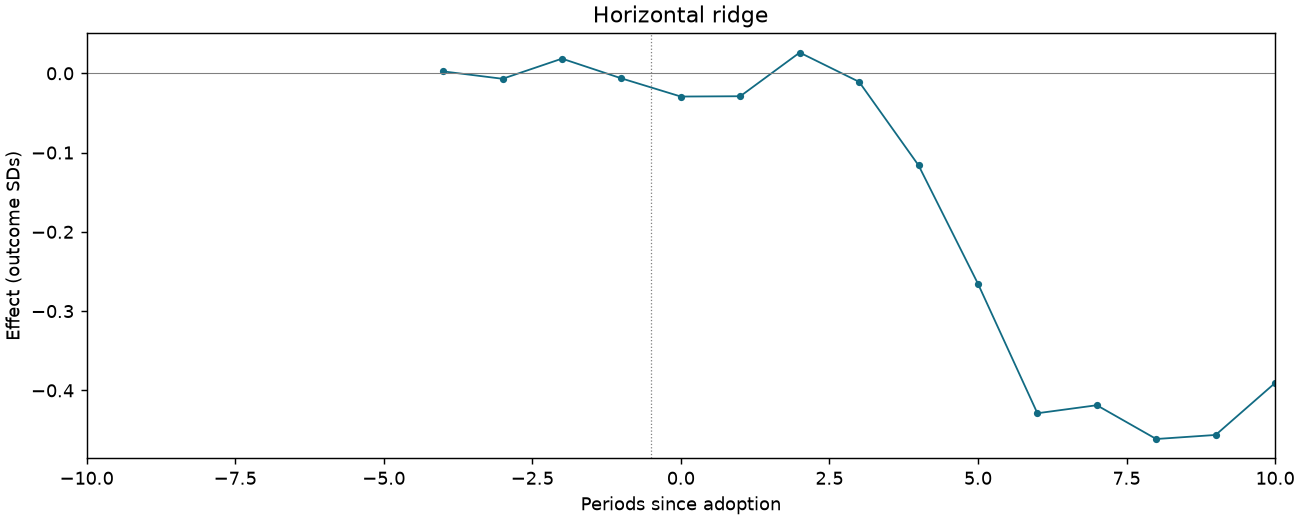
Event studies
Periods −10 to +10; pointwise 95% intervals where available.