Reply: Do Powerful Politicians Really Cause Corporate Downsizing? — expanded estimators
Archive index · Regression tests · Results & settings (JSON) · Methods & code
Cohen et al. (2017), JPE. https://doi.org/10.1086/694203
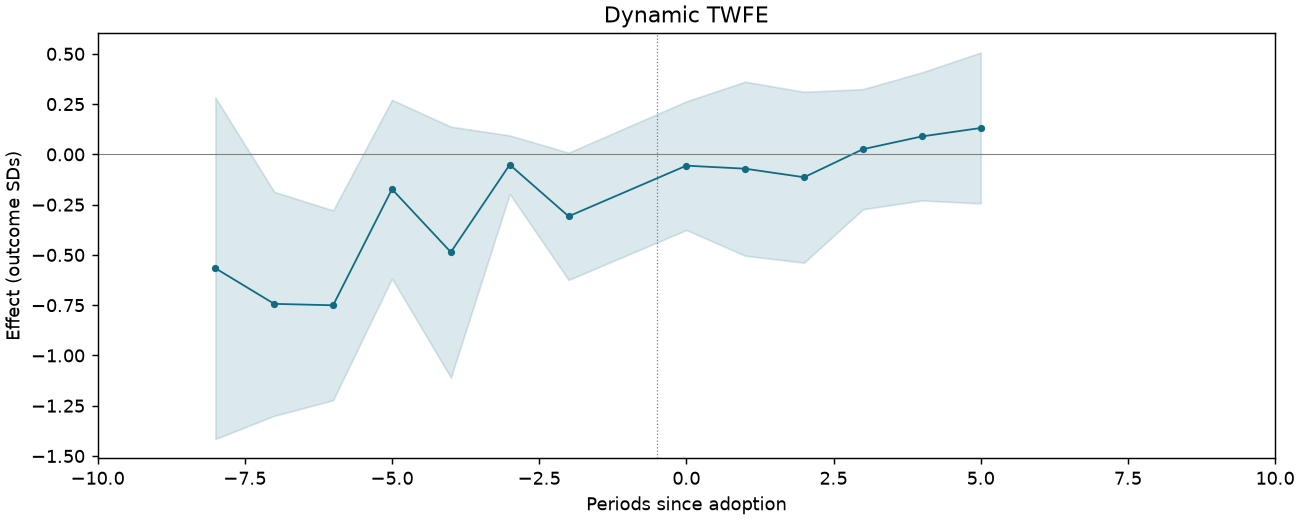
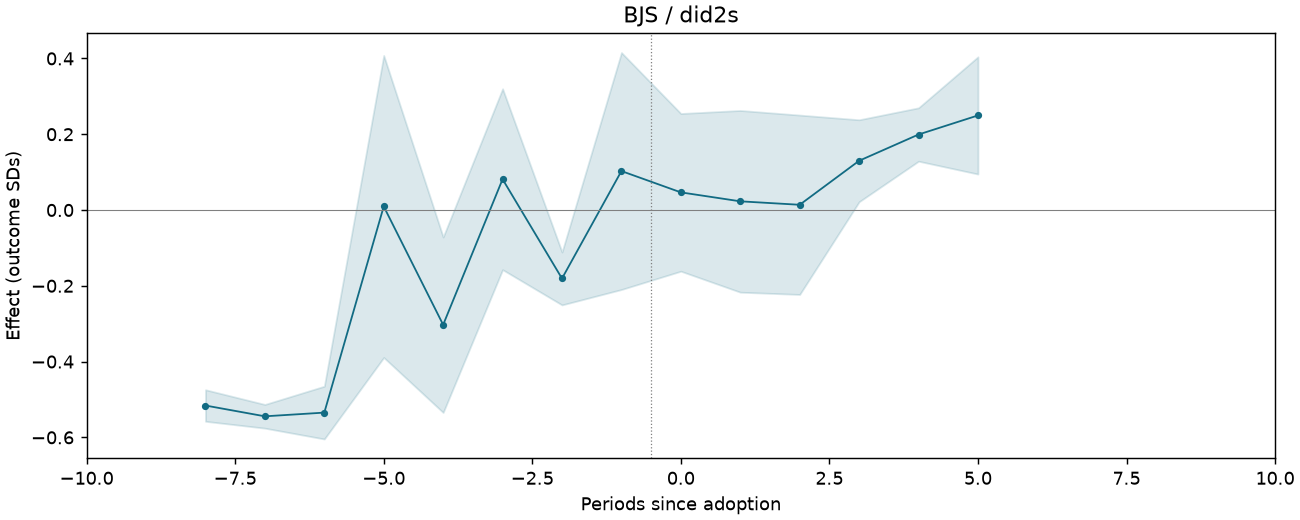
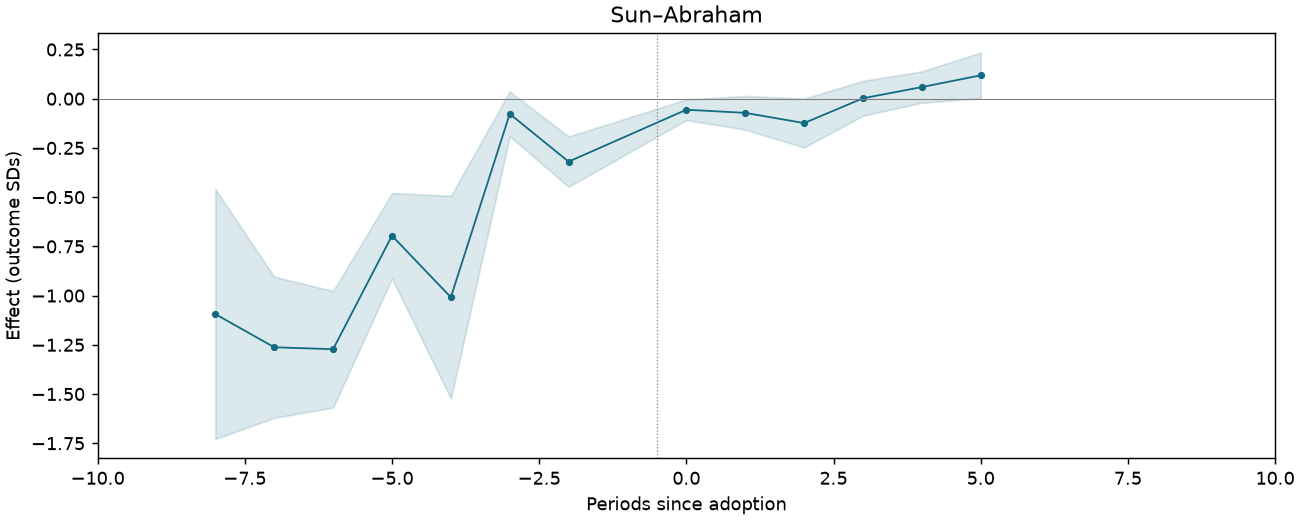
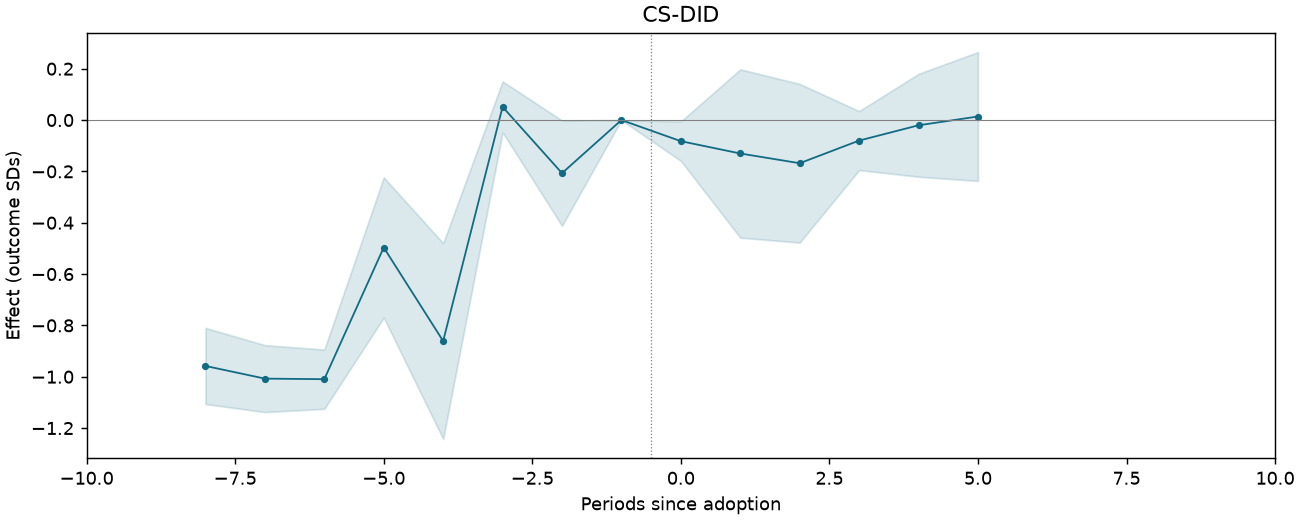
16 specifications. Effects are in outcome standard deviations; intervals are 95%.
Treatment adoption

S03-P013: seeded sample of 100 of 11,515 eligible units. Purple untreated; yellow treated; white unobserved.
PP-REPLY-T1-PA-ALL-CHGEMP
158,820 observations · 14,838 units · 58 clusters · 783 treated / 14,055 control units.
Estimate comparison
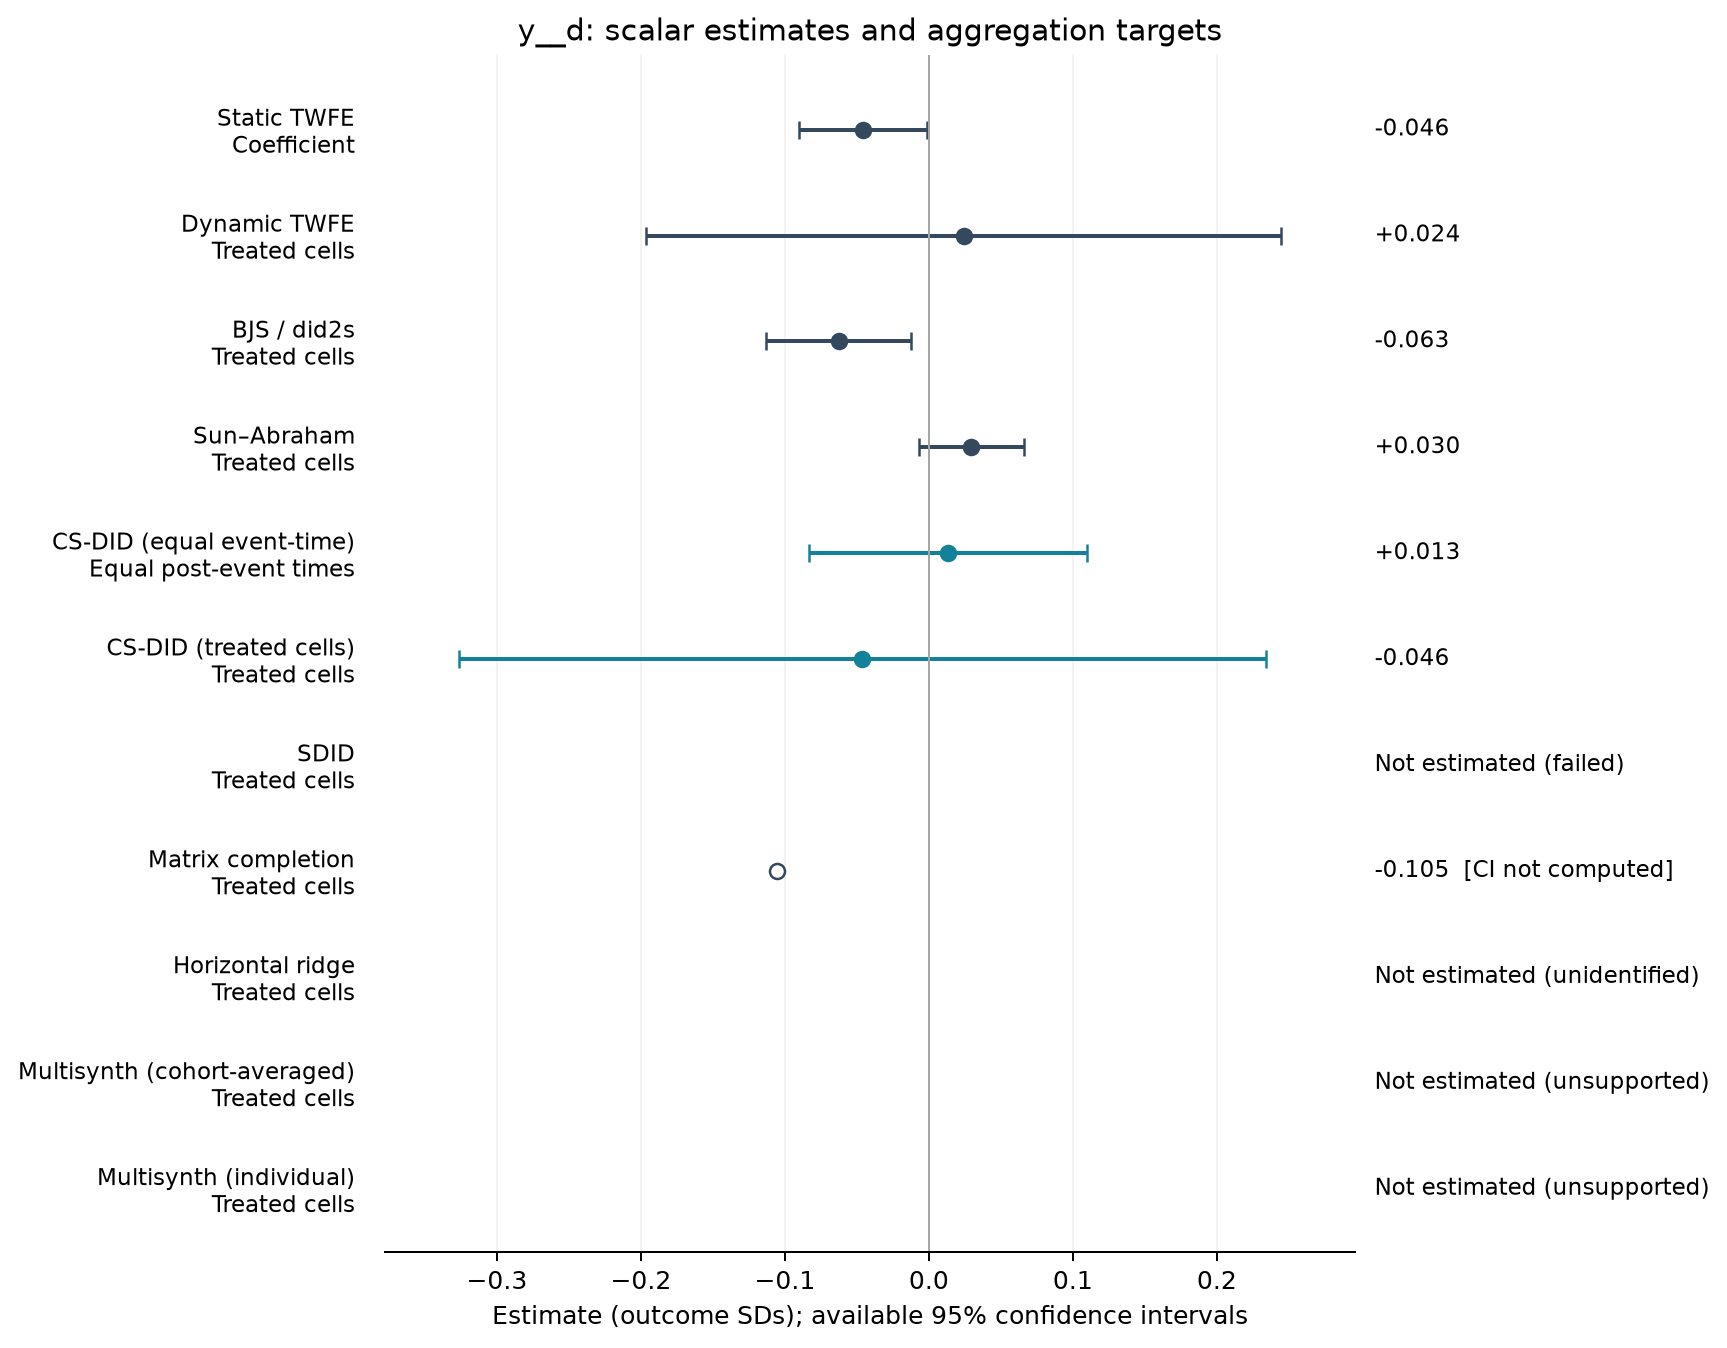
| Estimator | Estimate (SDs) | SE | 95% CI | Averaging |
|---|---|---|---|---|
| Static TWFE | -0.046 | 0.022 | [-0.090, -0.001] | Coefficient |
| Dynamic TWFE | 0.024 | 0.110 | [-0.196, 0.245] | Treated cells |
| BJS / did2s | -0.063 | 0.025 | [-0.113, -0.013] | Treated cells |
| Sun–Abraham | 0.030 | 0.018 | [-0.007, 0.066] | Treated cells |
| CS-DID (equal event-time) | 0.013 | 0.049 | [-0.083, 0.110] | Equal post-event times |
| CS-DID (treated cells) | -0.046 | 0.143 | [-0.326, 0.234] | Treated cells |
| Matrix completion | -0.105 | — | — | Treated cells |
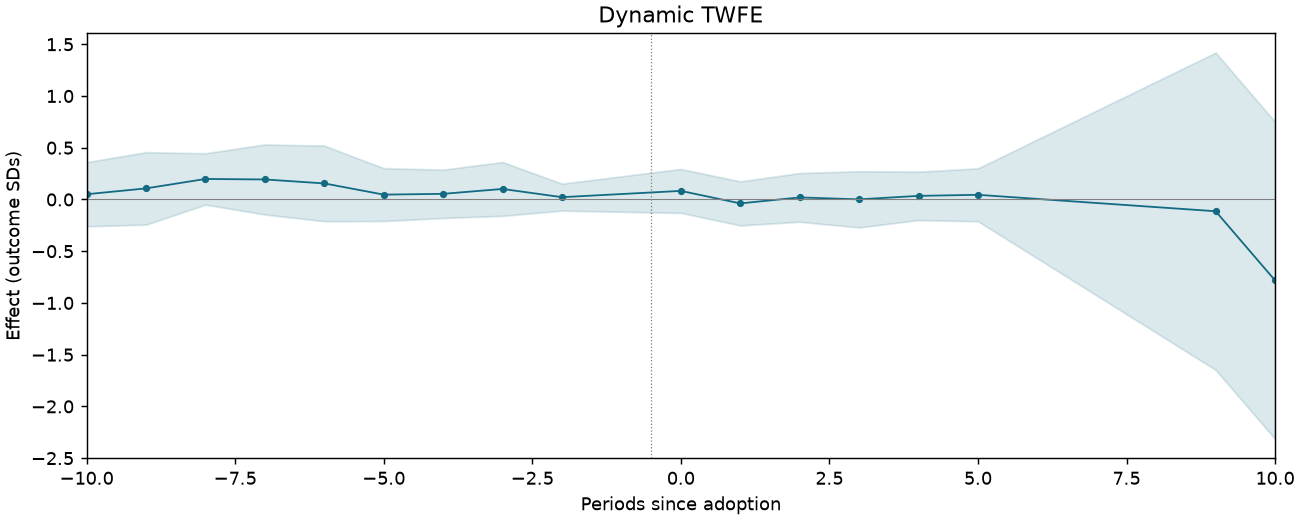
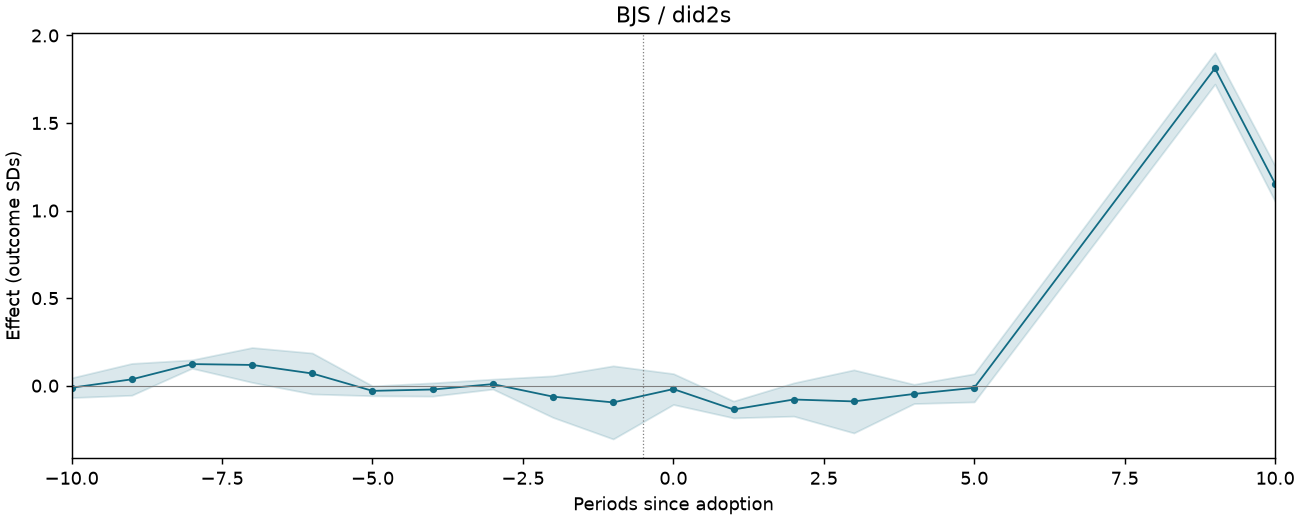
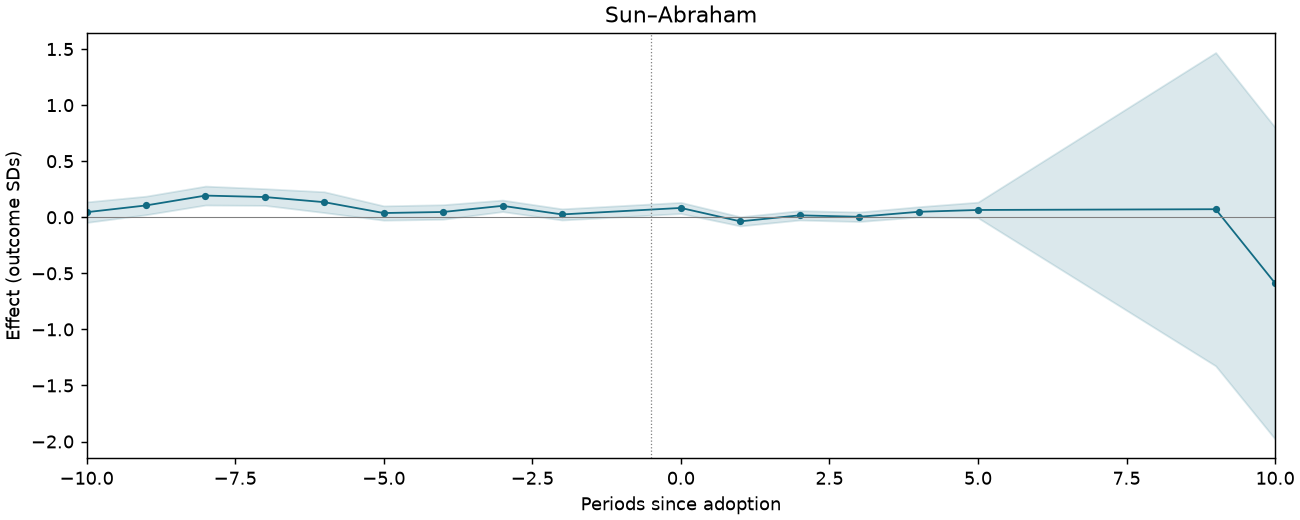
Event studies
Periods −10 to +10; pointwise 95% intervals where available.
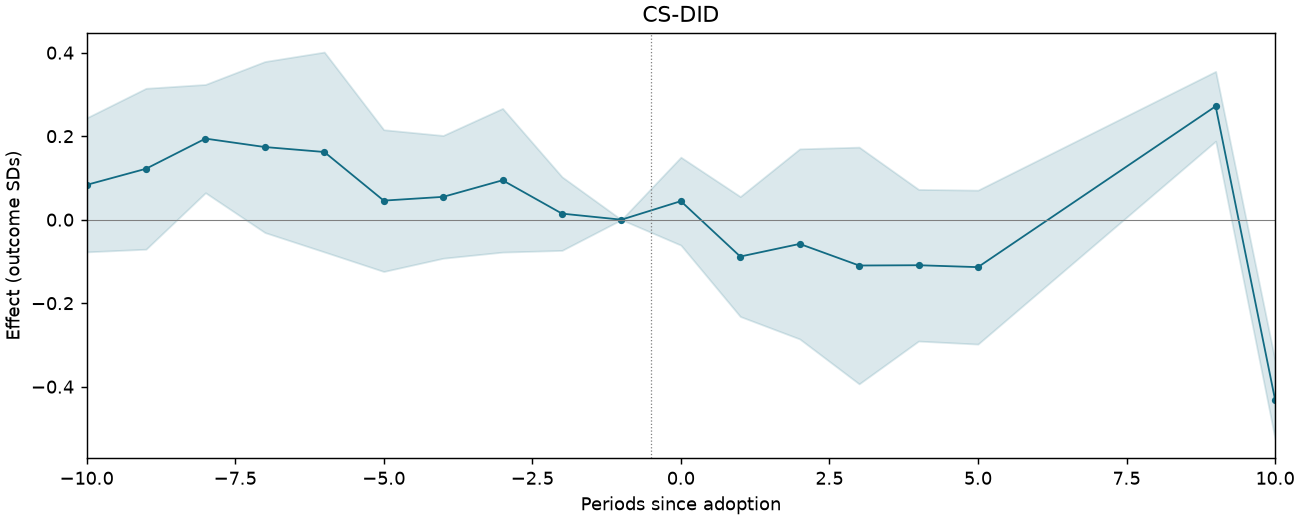
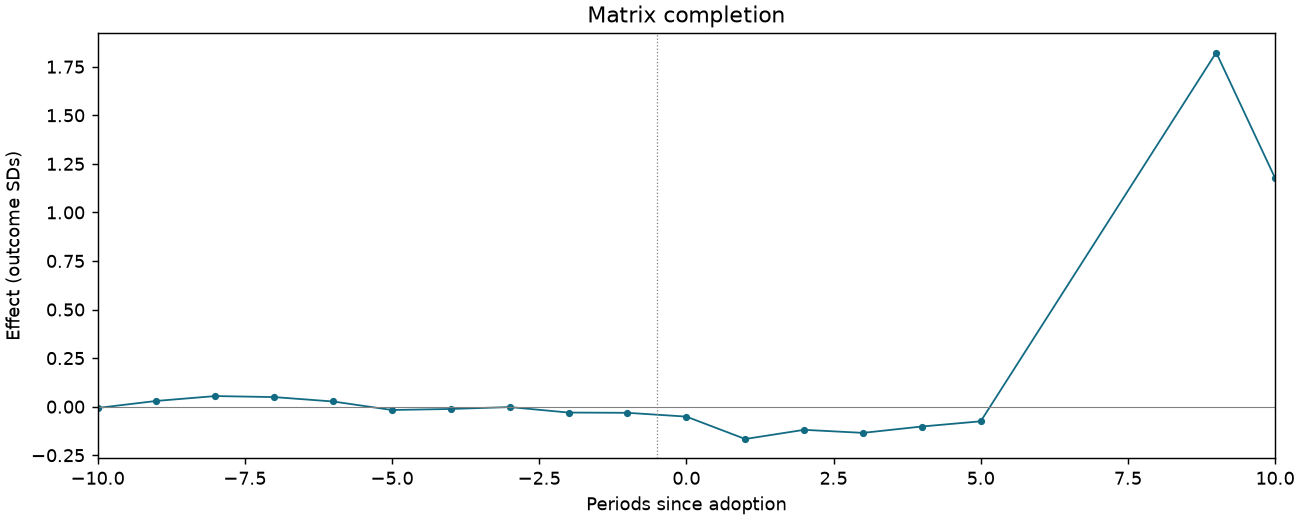
PP-REPLY-T1-PA-ALL-SALESGR
170,643 observations · 15,601 units · 58 clusters · 853 treated / 14,748 control units.
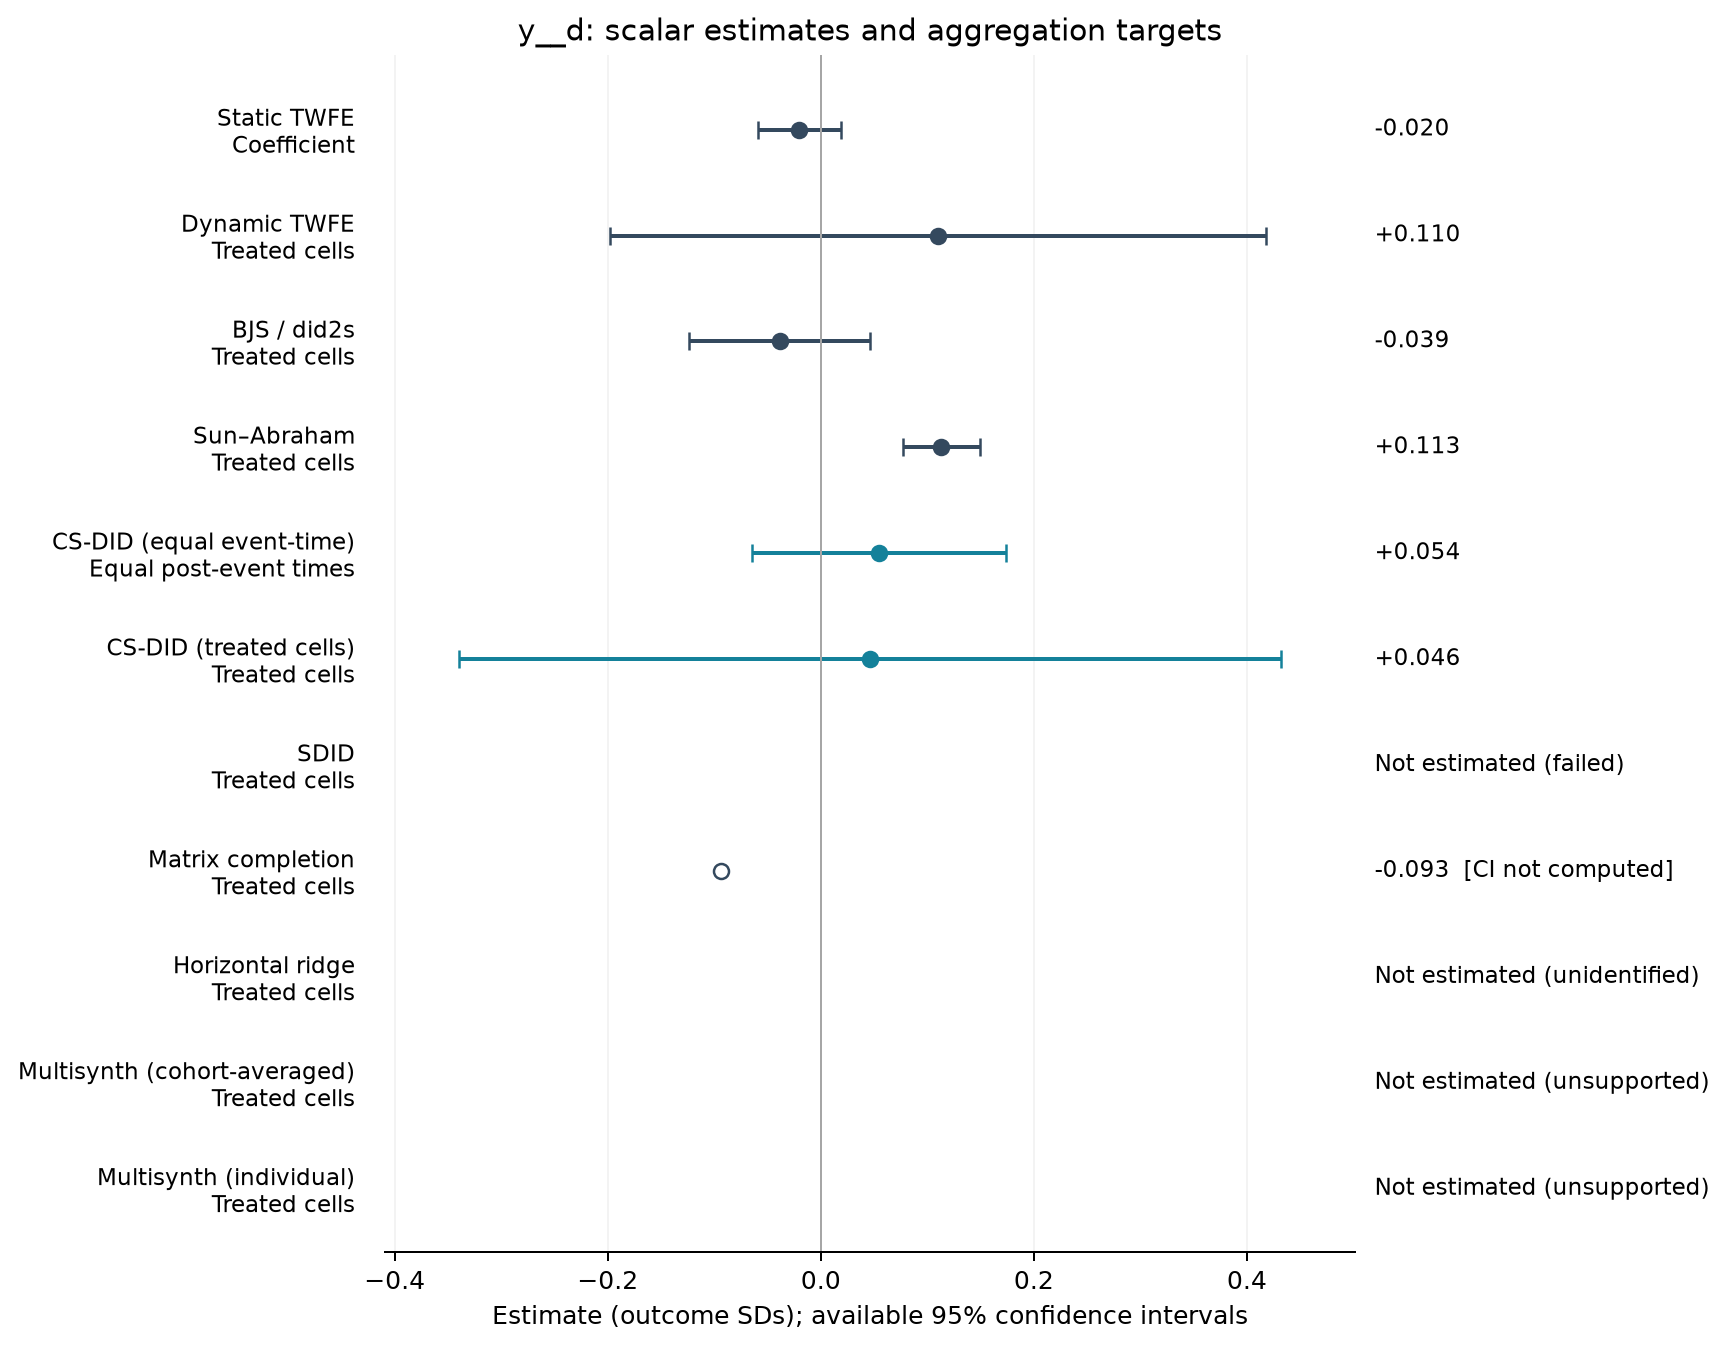
Estimate comparison
| Estimator | Estimate (SDs) | SE | 95% CI | Averaging |
|---|---|---|---|---|
| Static TWFE | -0.020 | 0.019 | [-0.059, 0.019] | Coefficient |
| Dynamic TWFE | 0.110 | 0.154 | [-0.197, 0.418] | Treated cells |
| BJS / did2s | -0.039 | 0.042 | [-0.123, 0.046] | Treated cells |
| Sun–Abraham | 0.113 | 0.018 | [0.077, 0.149] | Treated cells |
| CS-DID (equal event-time) | 0.054 | 0.061 | [-0.065, 0.174] | Equal post-event times |
| CS-DID (treated cells) | 0.046 | 0.197 | [-0.340, 0.432] | Treated cells |
| Matrix completion | -0.093 | — | — | Treated cells |
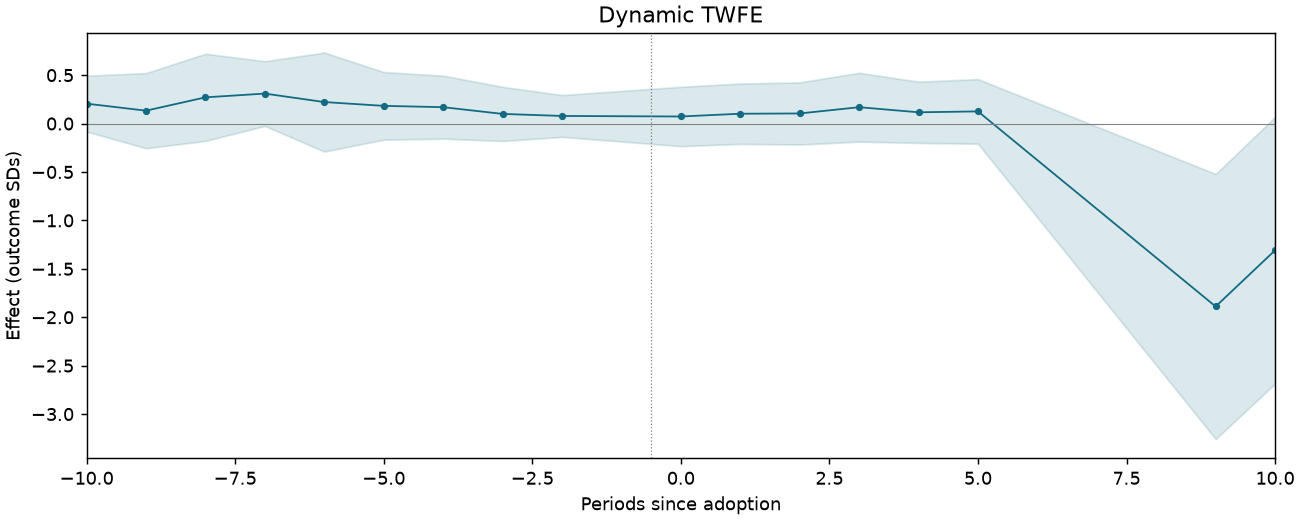
Event studies
Periods −10 to +10; pointwise 95% intervals where available.
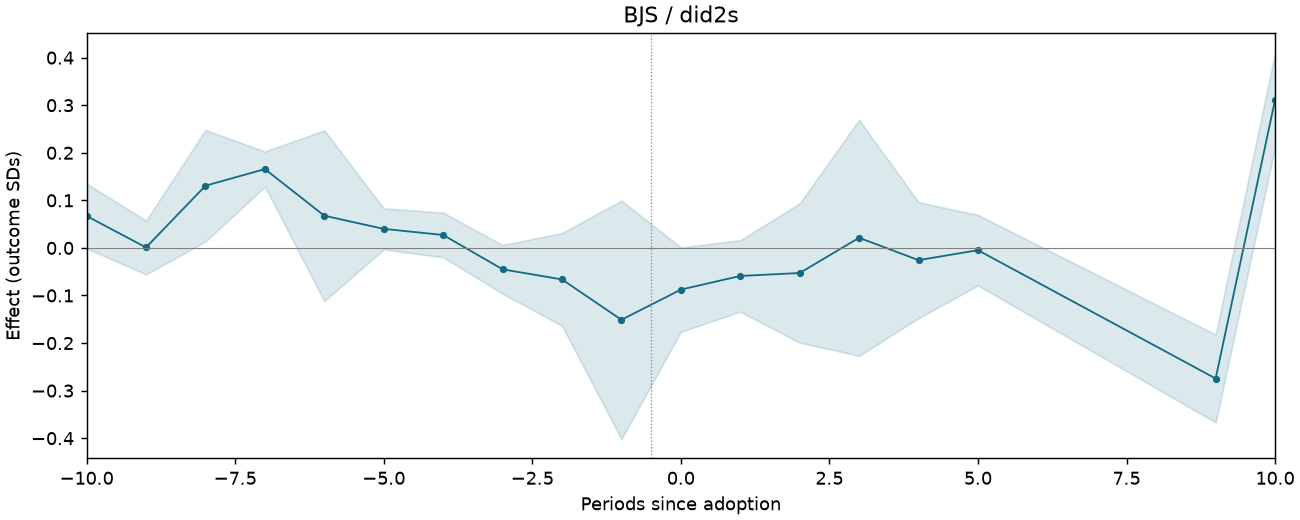
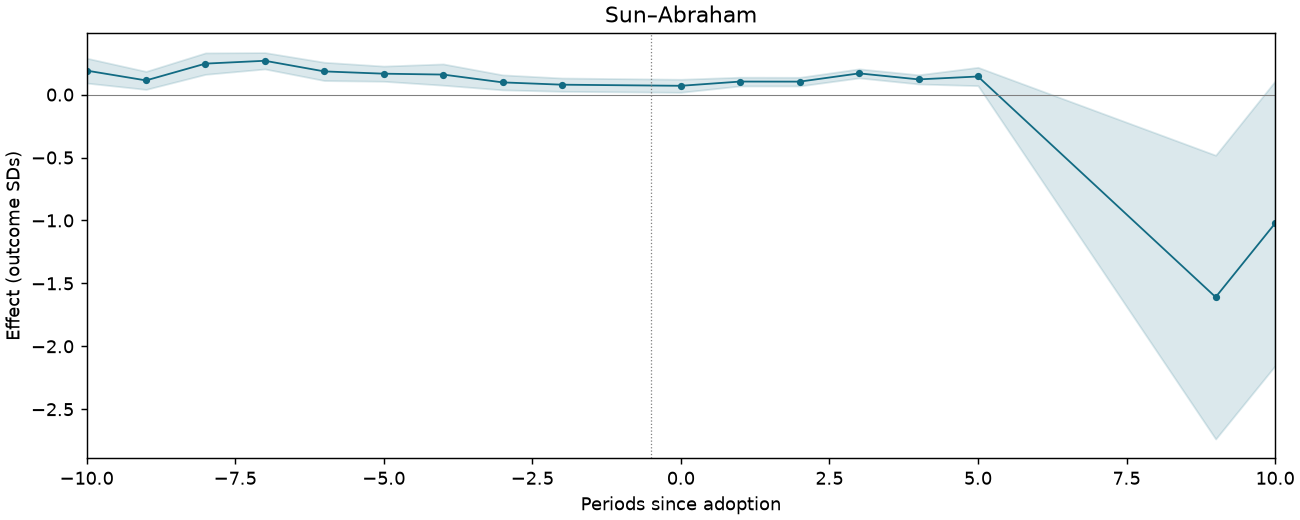
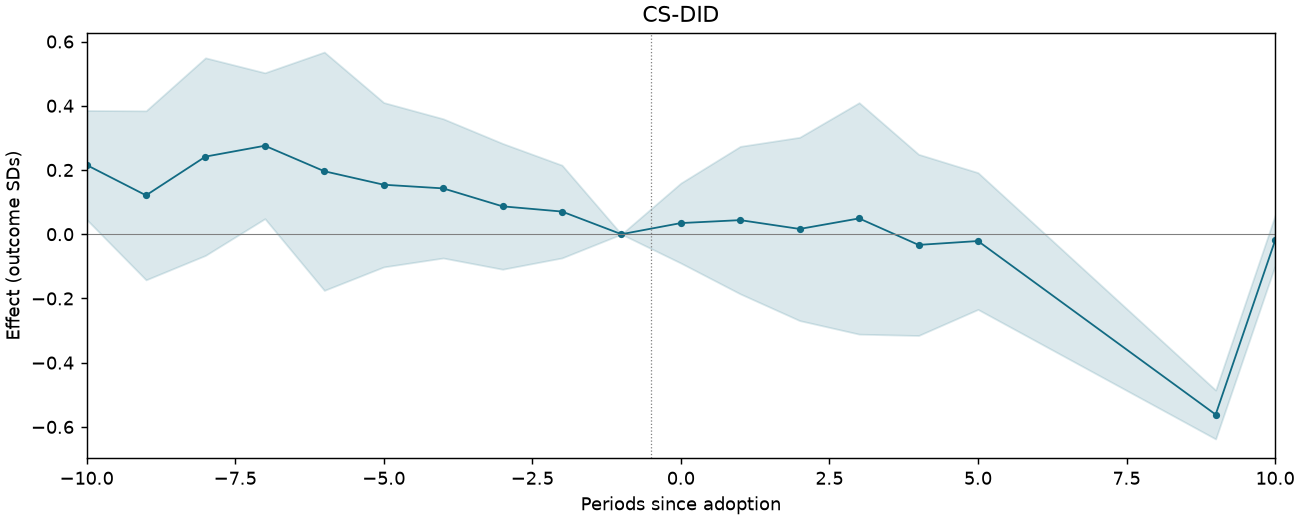
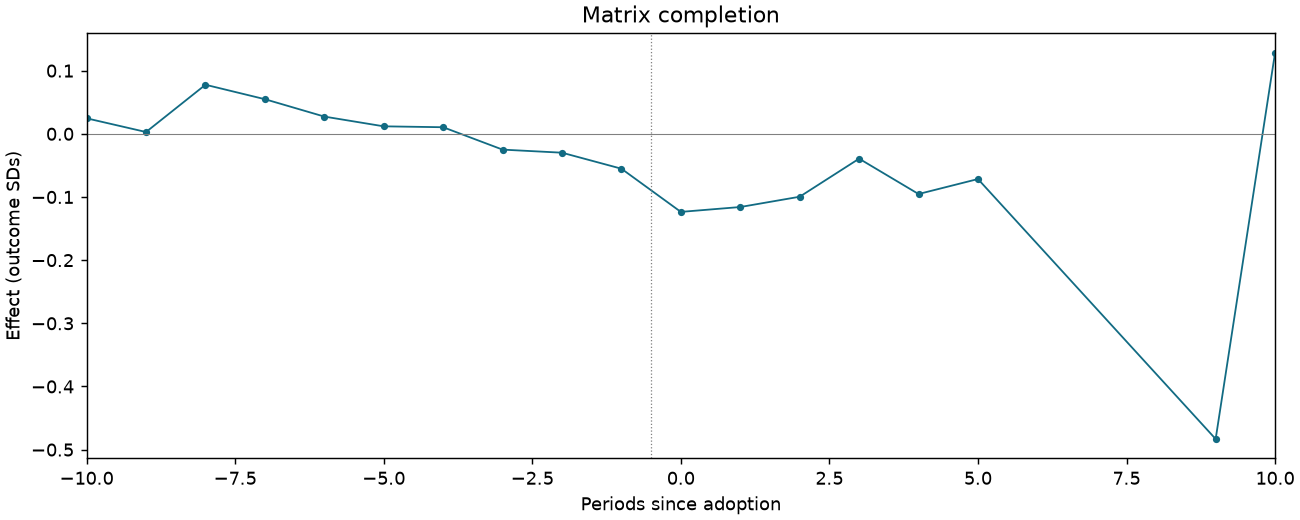
PP-REPLY-T1-PA-NOOIL-CHGEMP
152,549 observations · 14,280 units · 58 clusters · 707 treated / 13,573 control units.
Estimate comparison
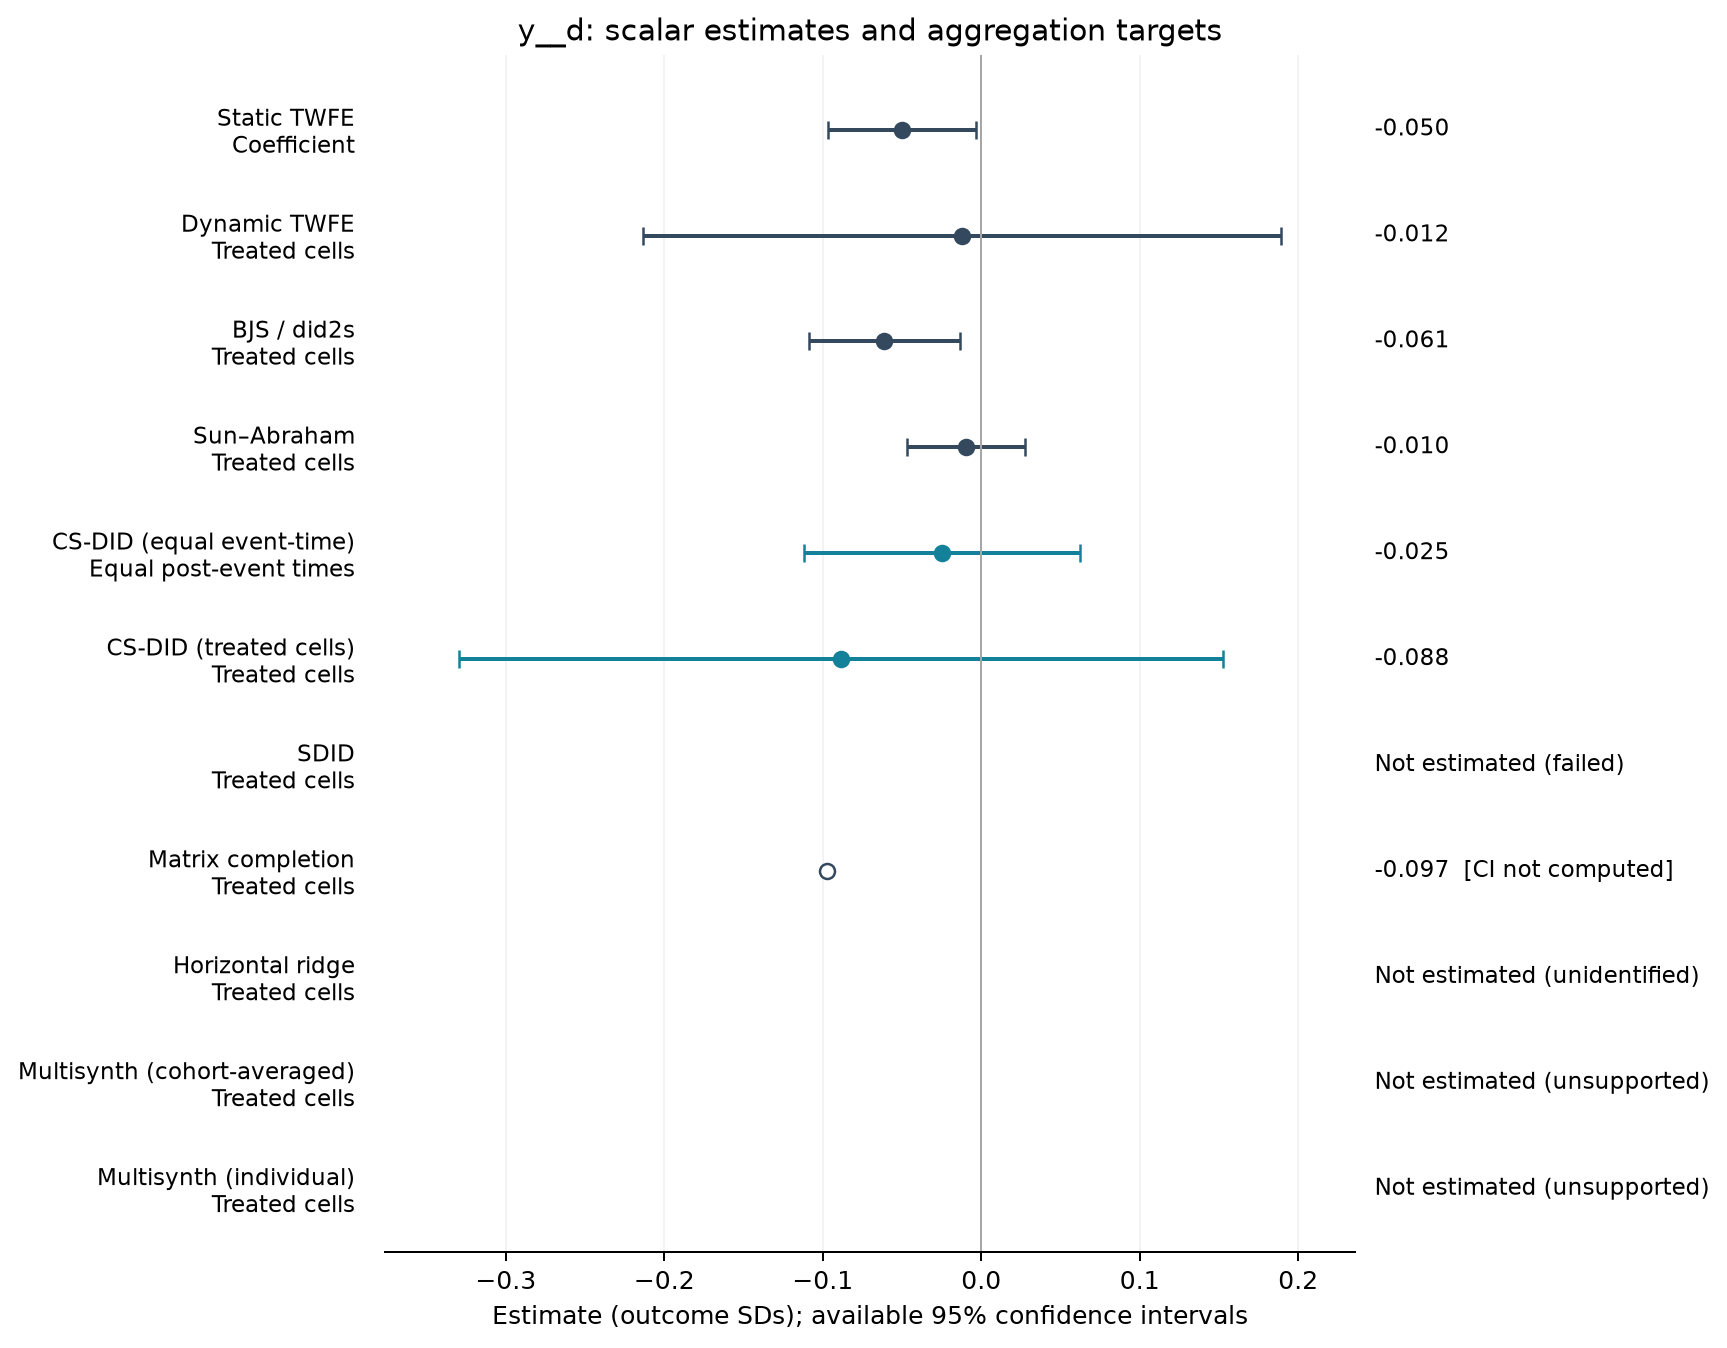
| Estimator | Estimate (SDs) | SE | 95% CI | Averaging |
|---|---|---|---|---|
| Static TWFE | -0.050 | 0.023 | [-0.096, -0.003] | Coefficient |
| Dynamic TWFE | -0.012 | 0.101 | [-0.214, 0.189] | Treated cells |
| BJS / did2s | -0.061 | 0.024 | [-0.109, -0.013] | Treated cells |
| Sun–Abraham | -0.010 | 0.018 | [-0.047, 0.027] | Treated cells |
| CS-DID (equal event-time) | -0.025 | 0.044 | [-0.112, 0.062] | Equal post-event times |
| CS-DID (treated cells) | -0.088 | 0.123 | [-0.330, 0.153] | Treated cells |
| Matrix completion | -0.097 | — | — | Treated cells |
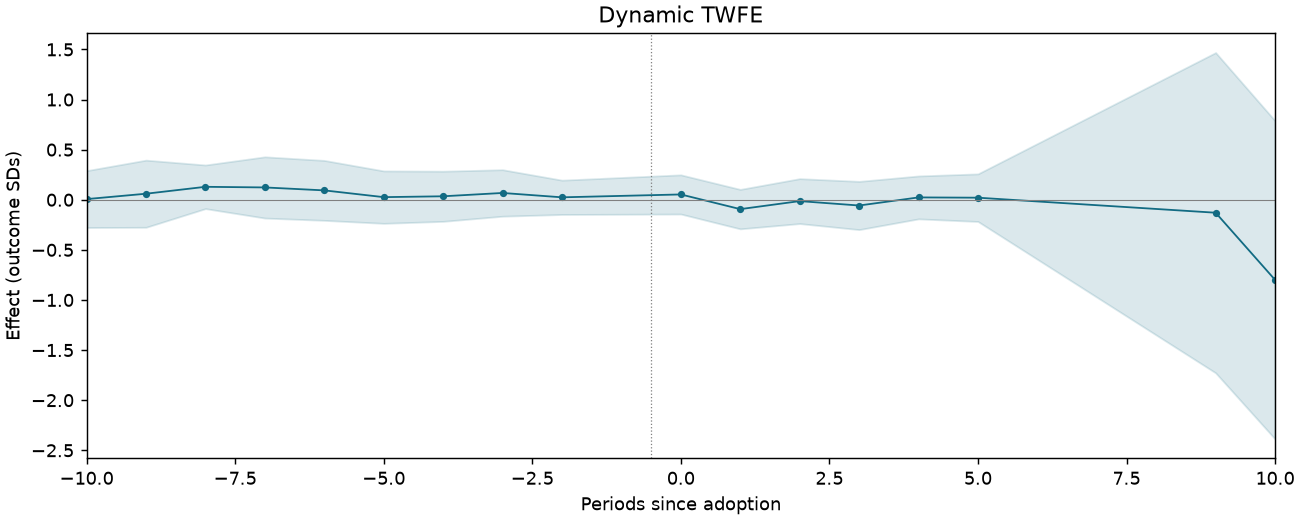
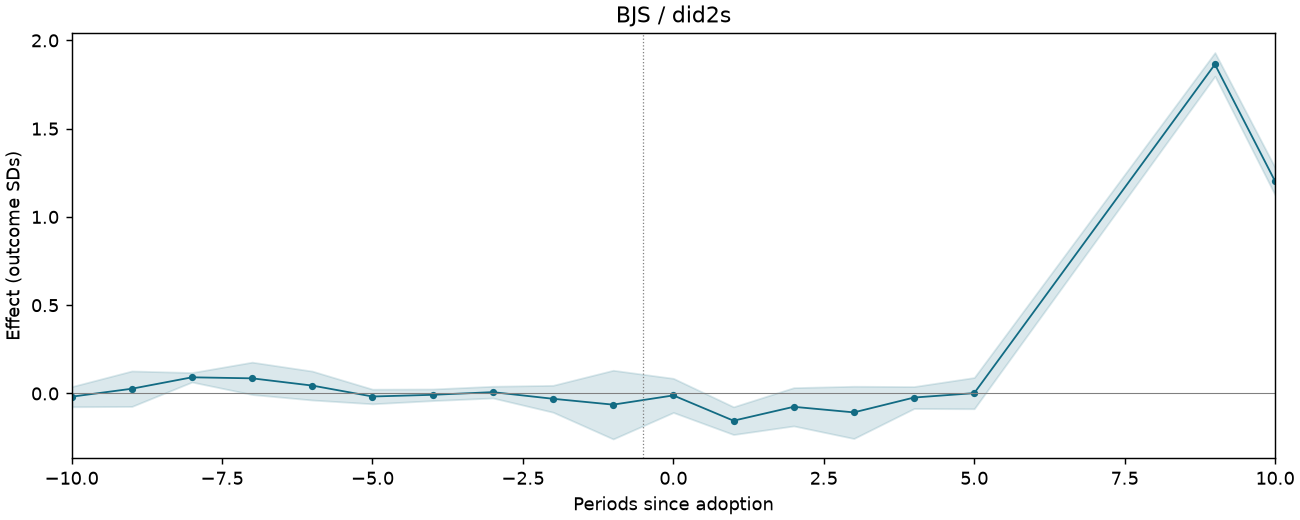
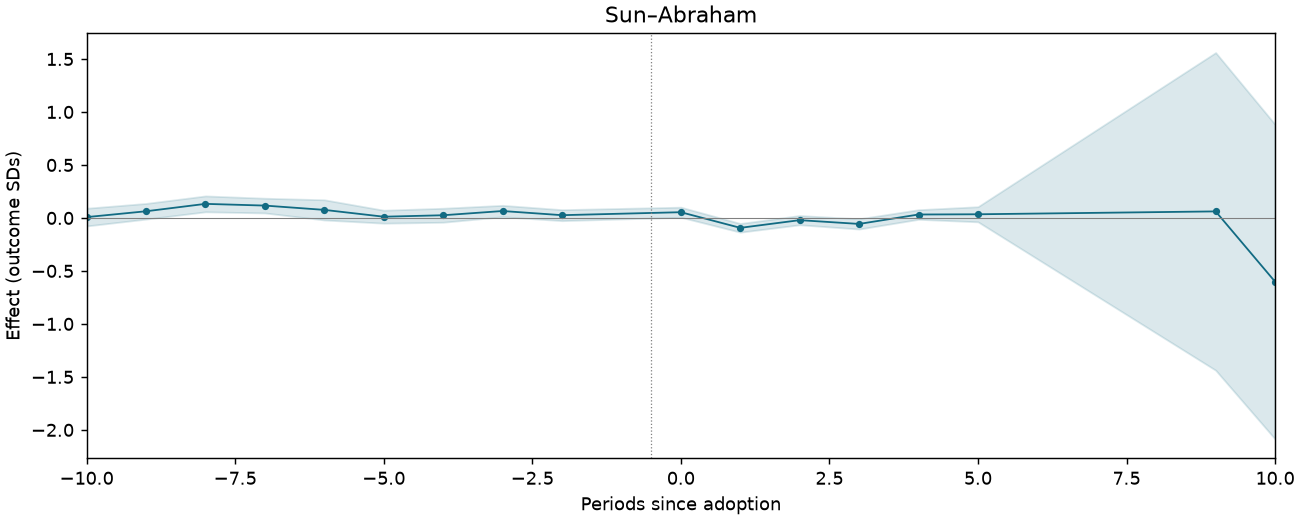
Event studies
Periods −10 to +10; pointwise 95% intervals where available.
PP-REPLY-T1-PA-NOOIL-SALESGR
163,763 observations · 14,993 units · 58 clusters · 766 treated / 14,227 control units.
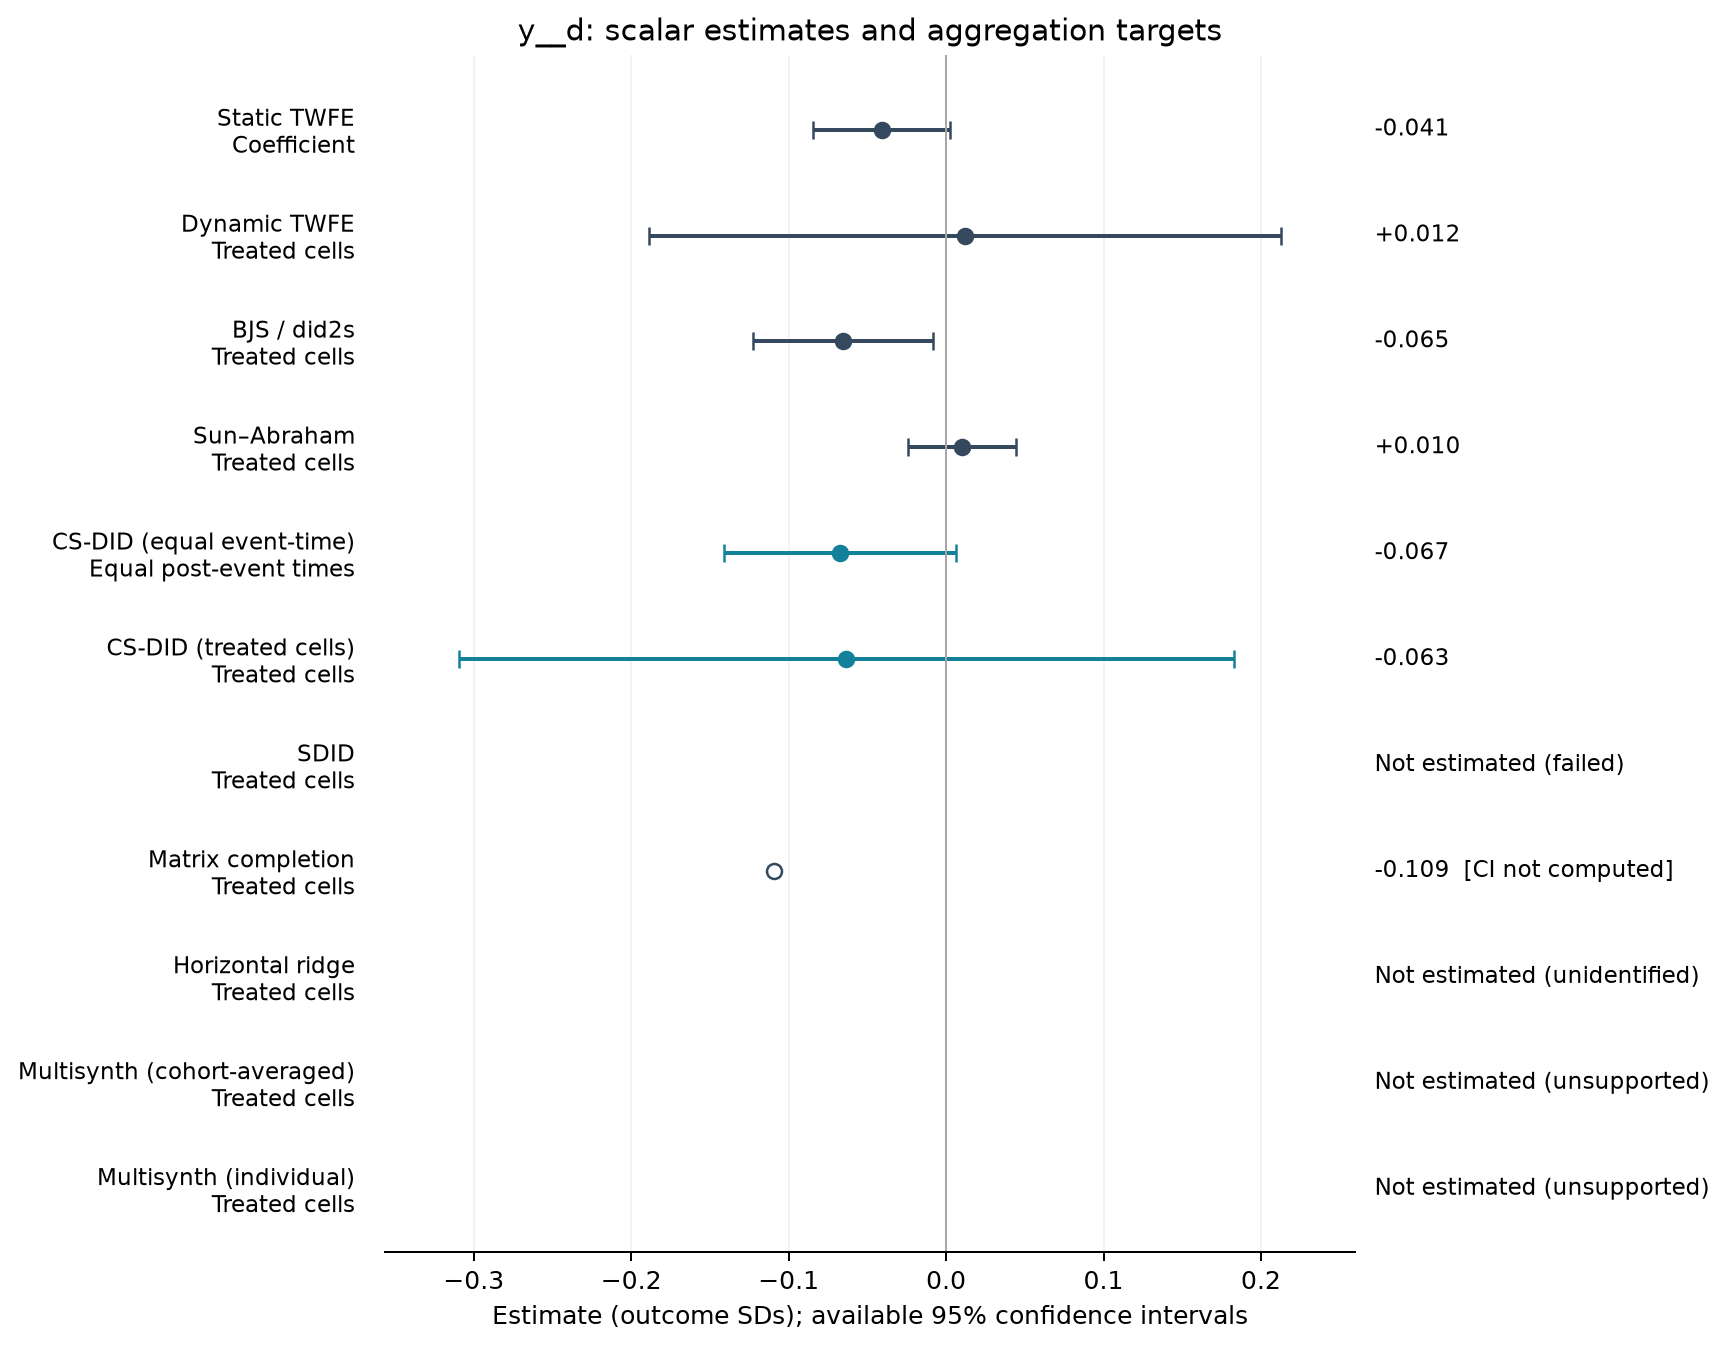
Estimate comparison
| Estimator | Estimate (SDs) | SE | 95% CI | Averaging |
|---|---|---|---|---|
| Static TWFE | -0.041 | 0.022 | [-0.084, 0.003] | Coefficient |
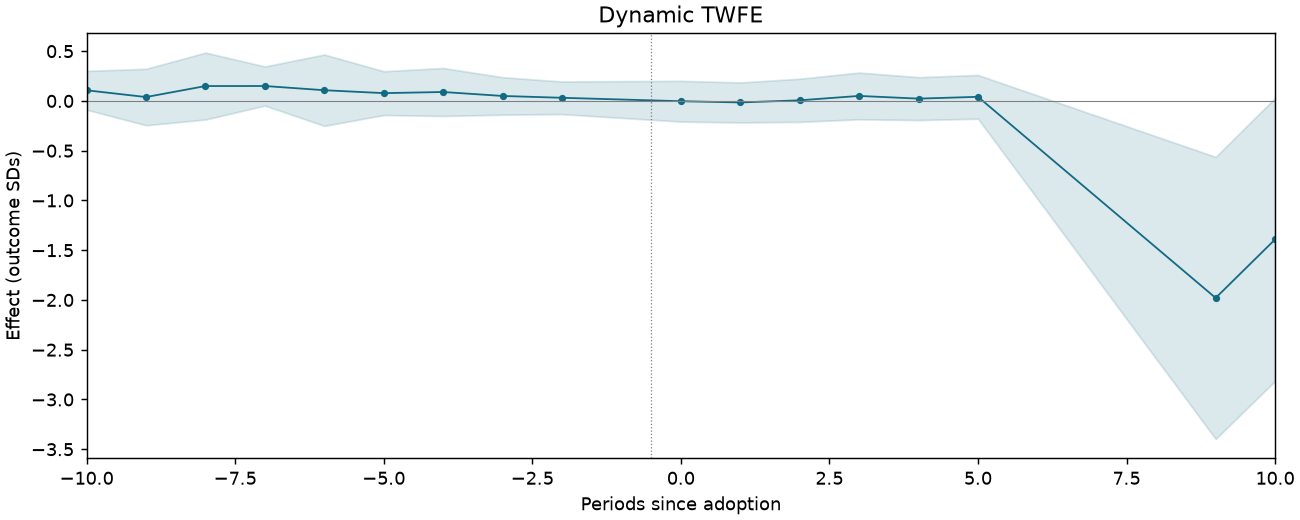
| Dynamic TWFE | 0.012 | 0.100 | [-0.189, 0.213] | Treated cells |
| BJS / did2s | -0.065 | 0.029 | [-0.122, -0.008] | Treated cells |
| Sun–Abraham | 0.010 | 0.017 | [-0.024, 0.045] | Treated cells |
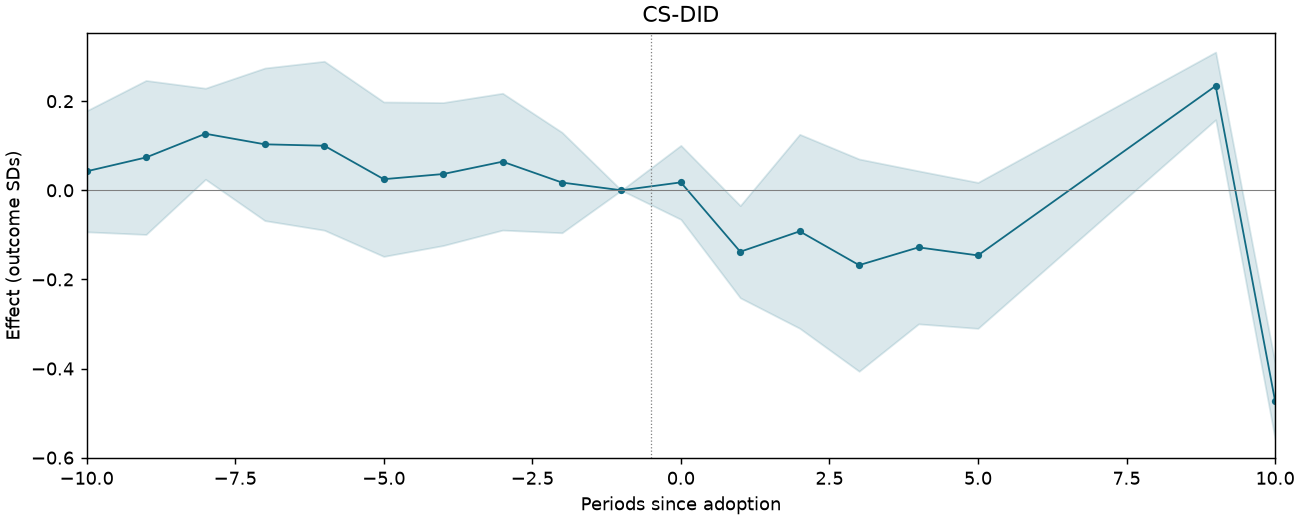
| CS-DID (equal event-time) | -0.067 | 0.038 | [-0.141, 0.006] | Equal post-event times |
| CS-DID (treated cells) | -0.063 | 0.126 | [-0.309, 0.183] | Treated cells |
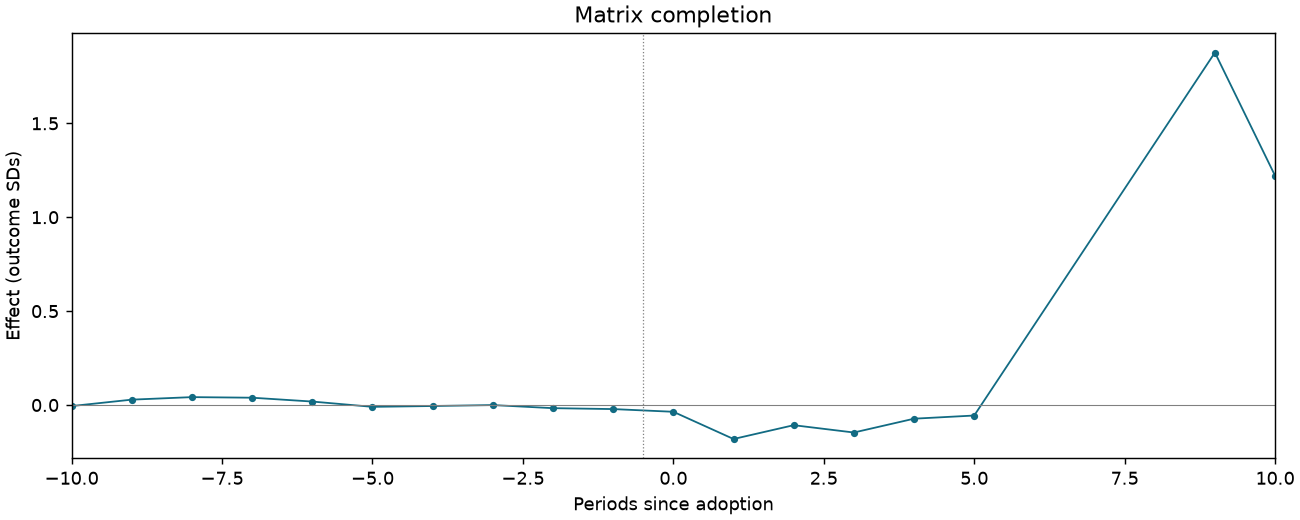
| Matrix completion | -0.109 | — | — | Treated cells |
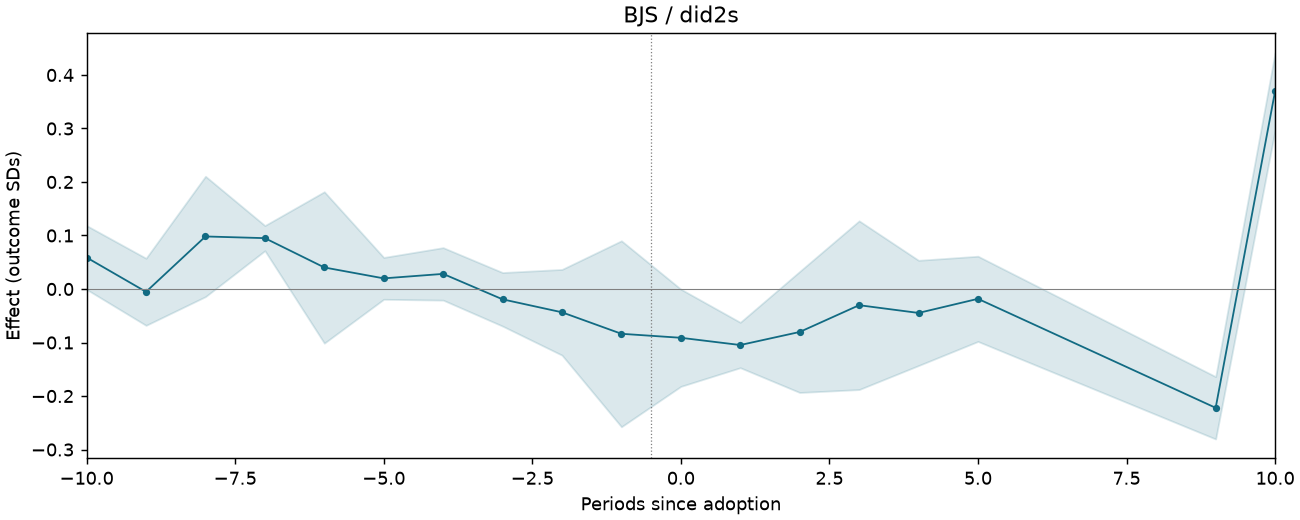
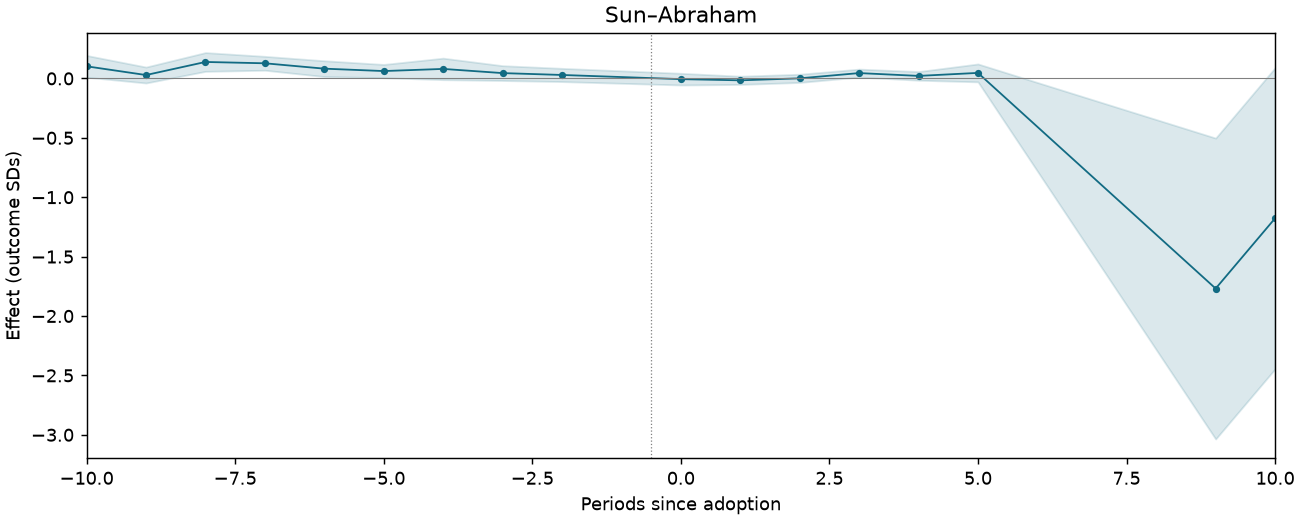
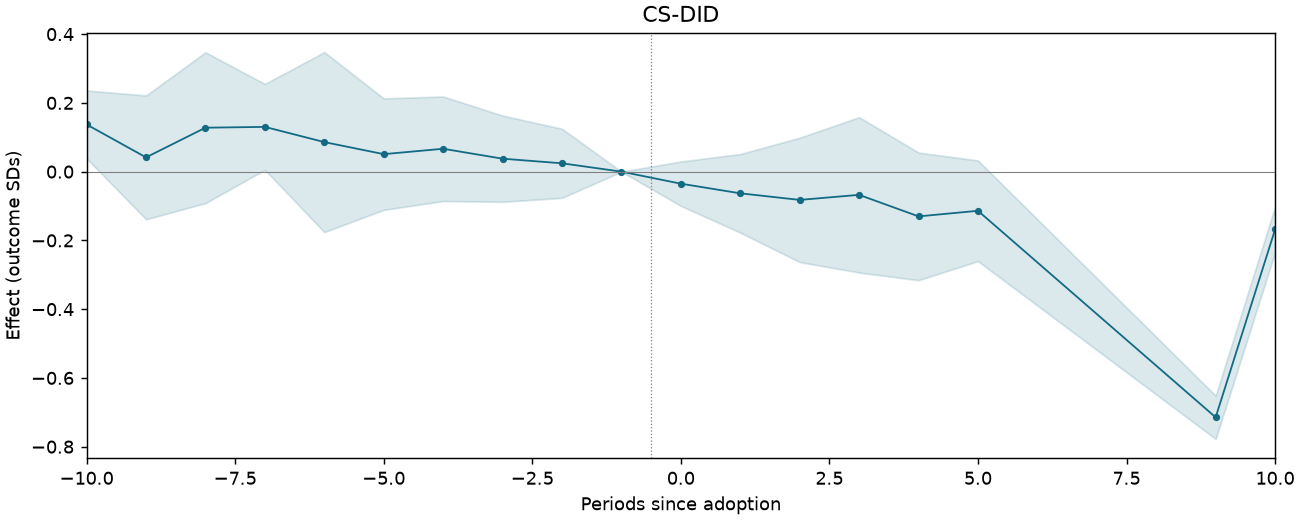
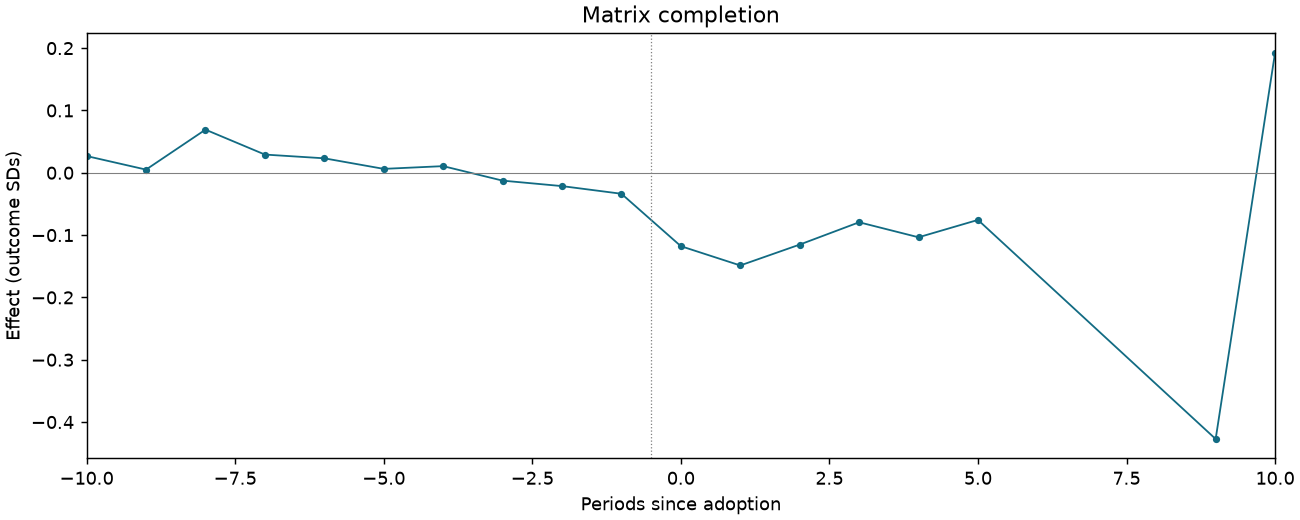
Event studies
Periods −10 to +10; pointwise 95% intervals where available.
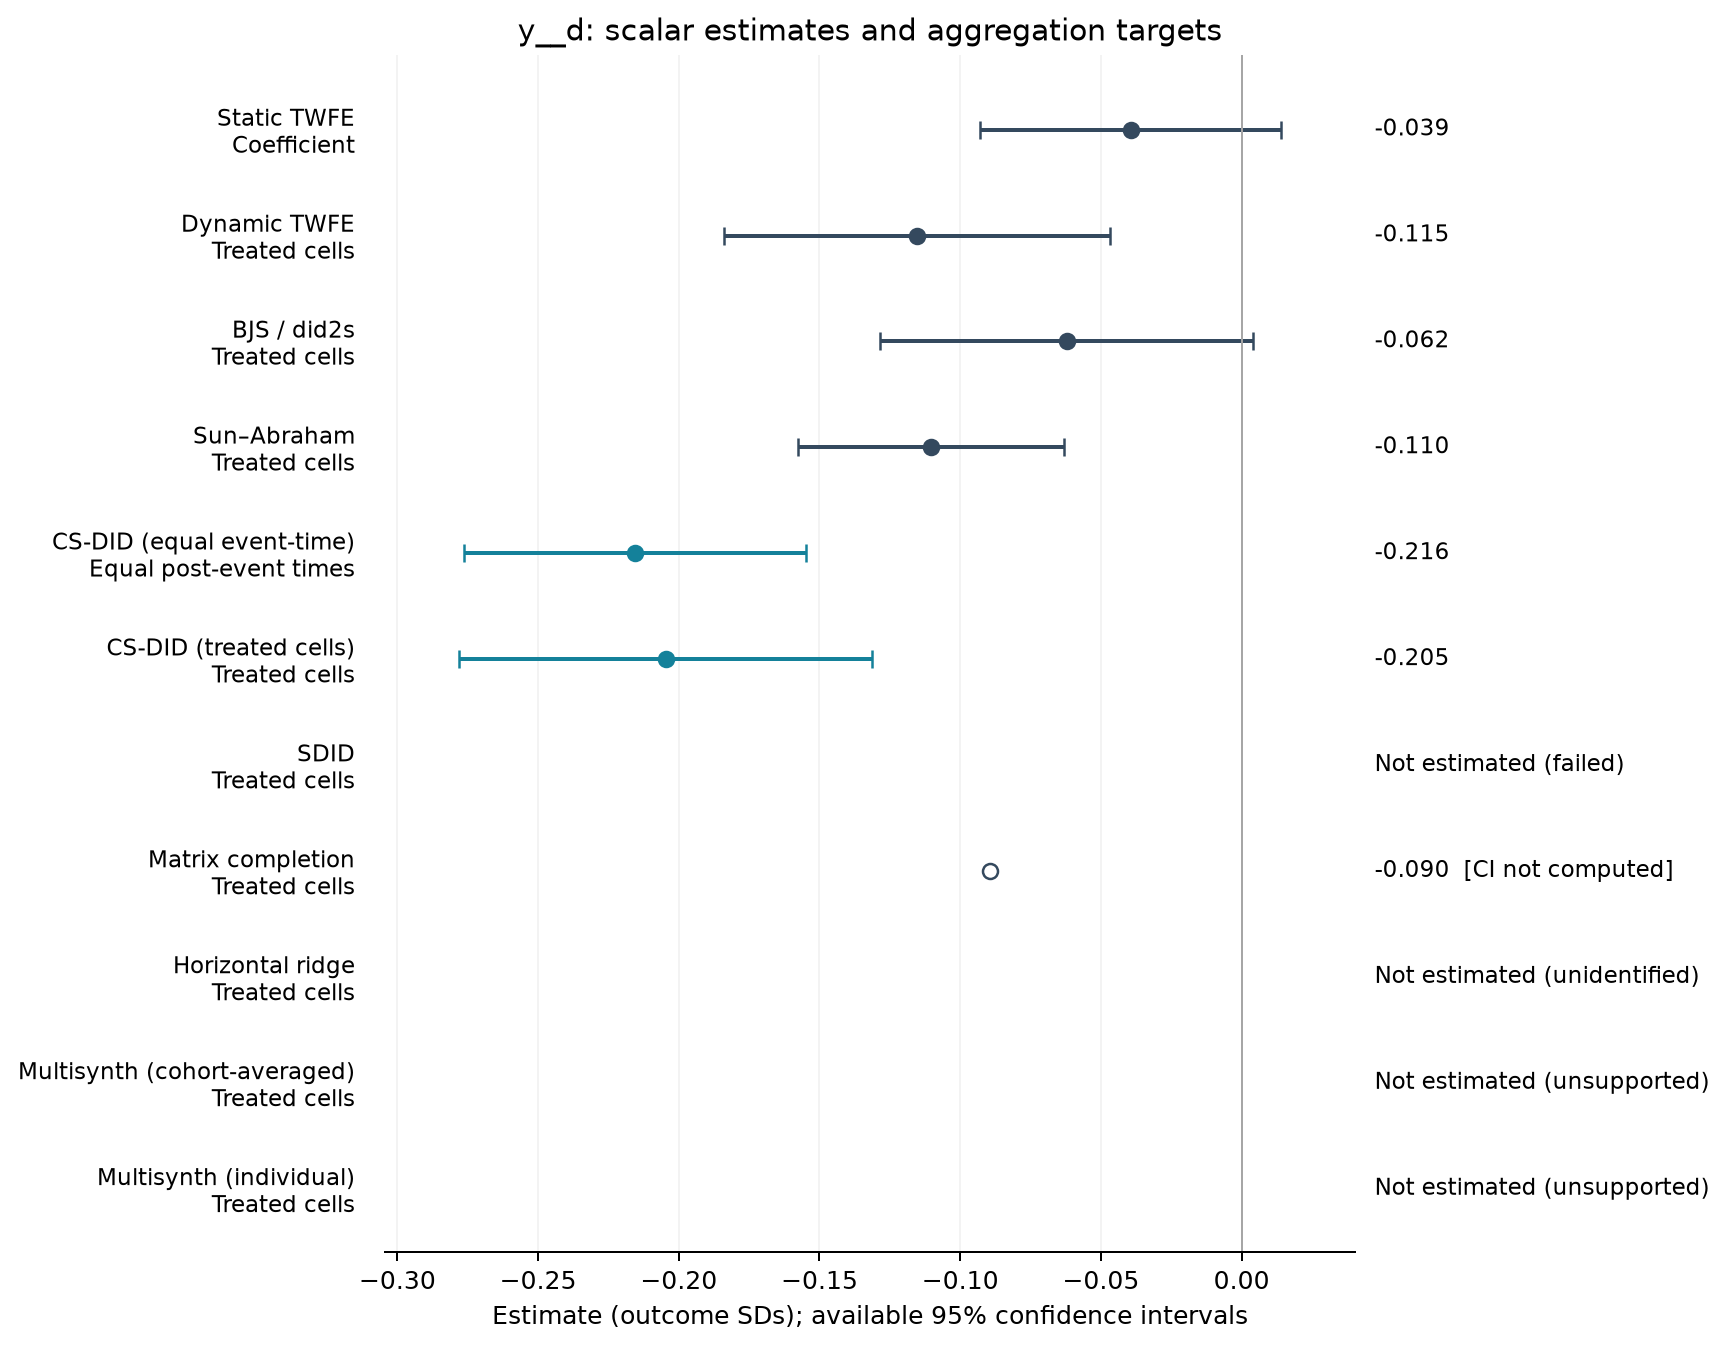
PP-REPLY-T1-PA-NOTX-CHGEMP
148,390 observations · 13,713 units · 56 clusters · 488 treated / 13,225 control units.
Estimate comparison
| Estimator | Estimate (SDs) | SE | 95% CI | Averaging |
|---|---|---|---|---|
| Static TWFE | -0.039 | 0.027 | [-0.093, 0.014] | Coefficient |
| Dynamic TWFE | -0.115 | 0.034 | [-0.184, -0.047] | Treated cells |
| BJS / did2s | -0.062 | 0.033 | [-0.128, 0.004] | Treated cells |
| Sun–Abraham | -0.110 | 0.024 | [-0.157, -0.063] | Treated cells |
| CS-DID (equal event-time) | -0.216 | 0.031 | [-0.276, -0.155] | Equal post-event times |
| CS-DID (treated cells) | -0.205 | 0.037 | [-0.278, -0.131] | Treated cells |
| Matrix completion | -0.090 | — | — | Treated cells |
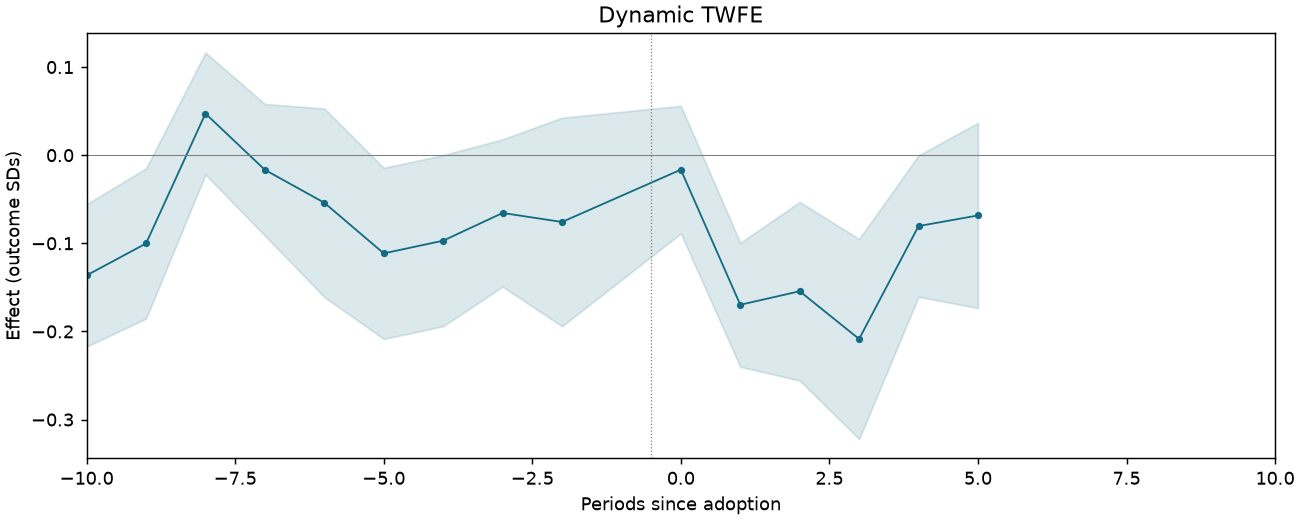
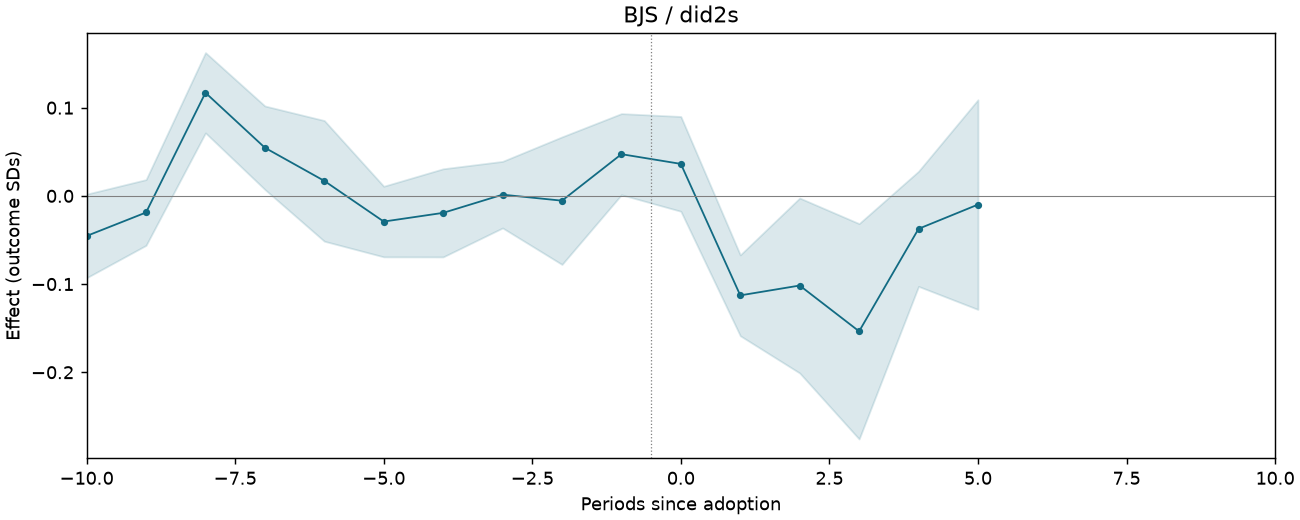
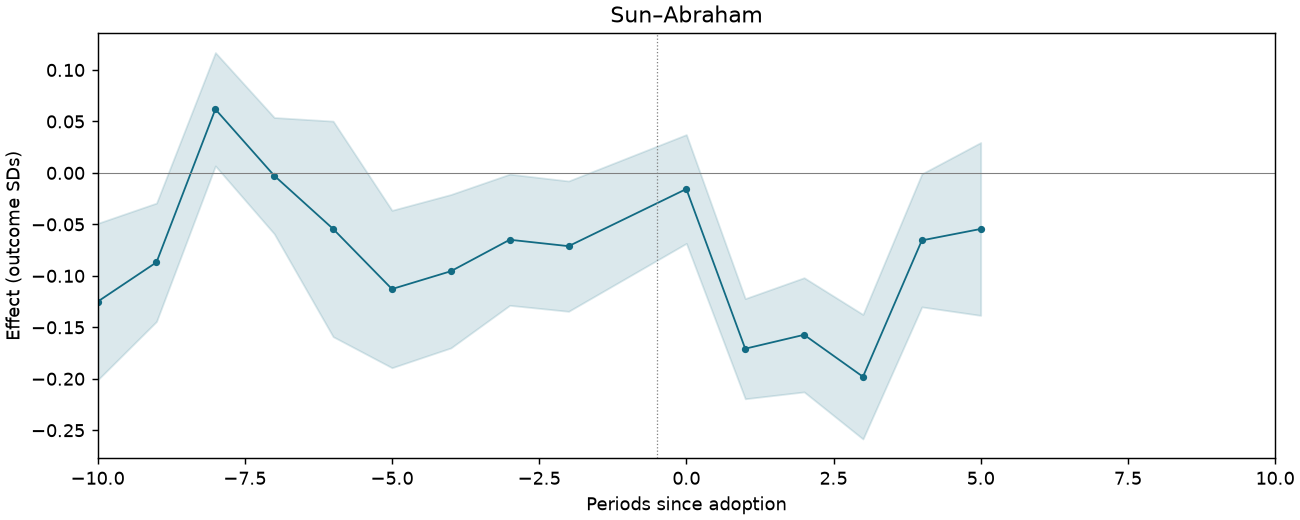
Event studies
Periods −10 to +10; pointwise 95% intervals where available.
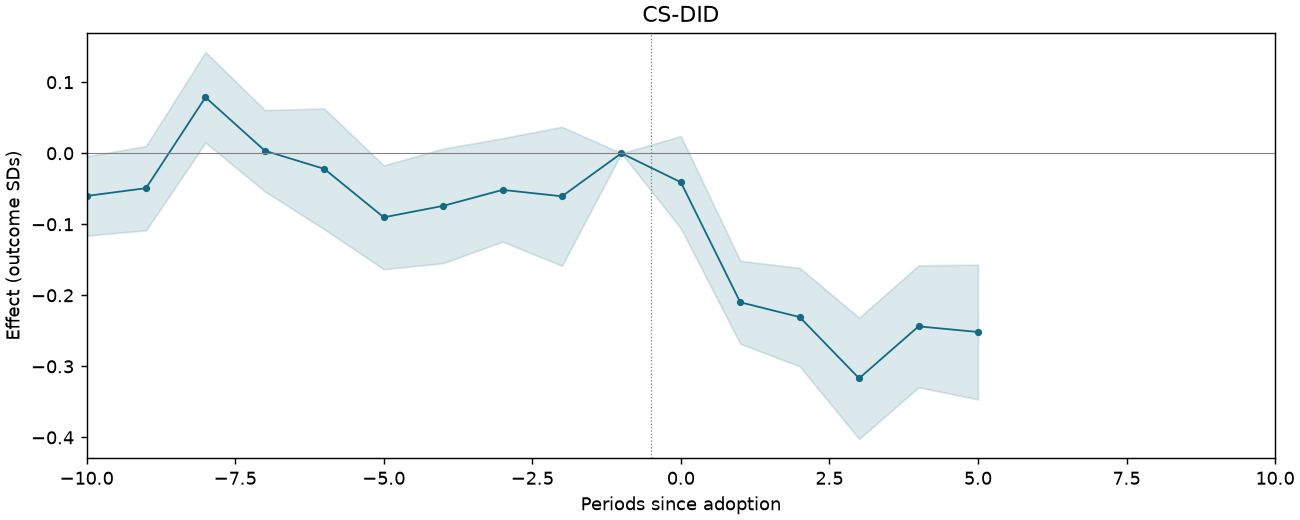
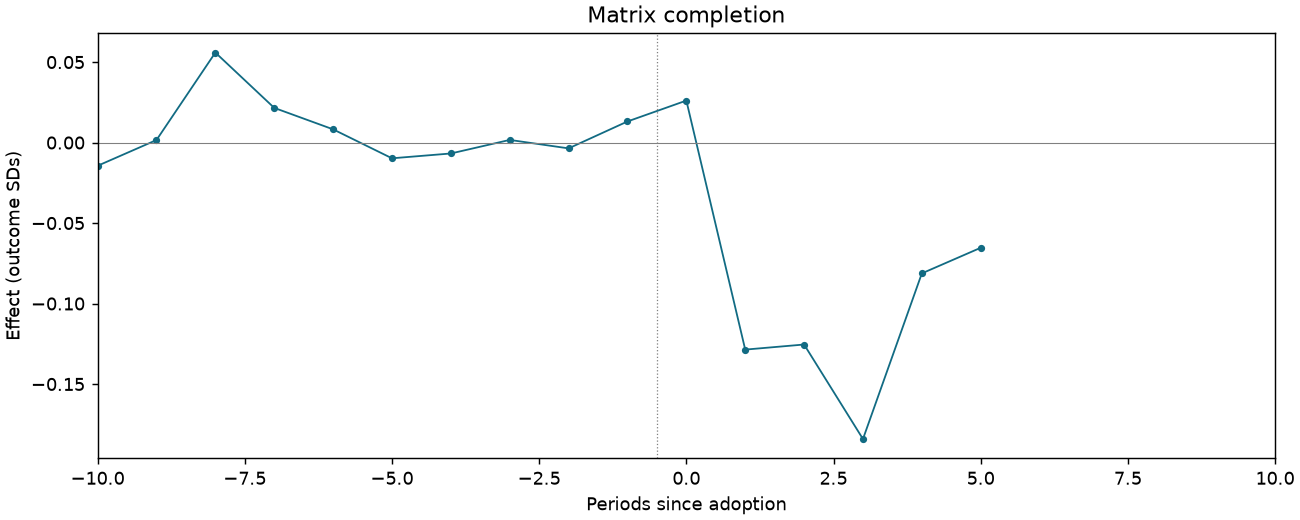
PP-REPLY-T1-PA-NOTX-SALESGR
159,163 observations · 14,409 units · 56 clusters · 519 treated / 13,890 control units.
Estimate comparison
| Estimator | Estimate (SDs) | SE | 95% CI | Averaging |
|---|---|---|---|---|
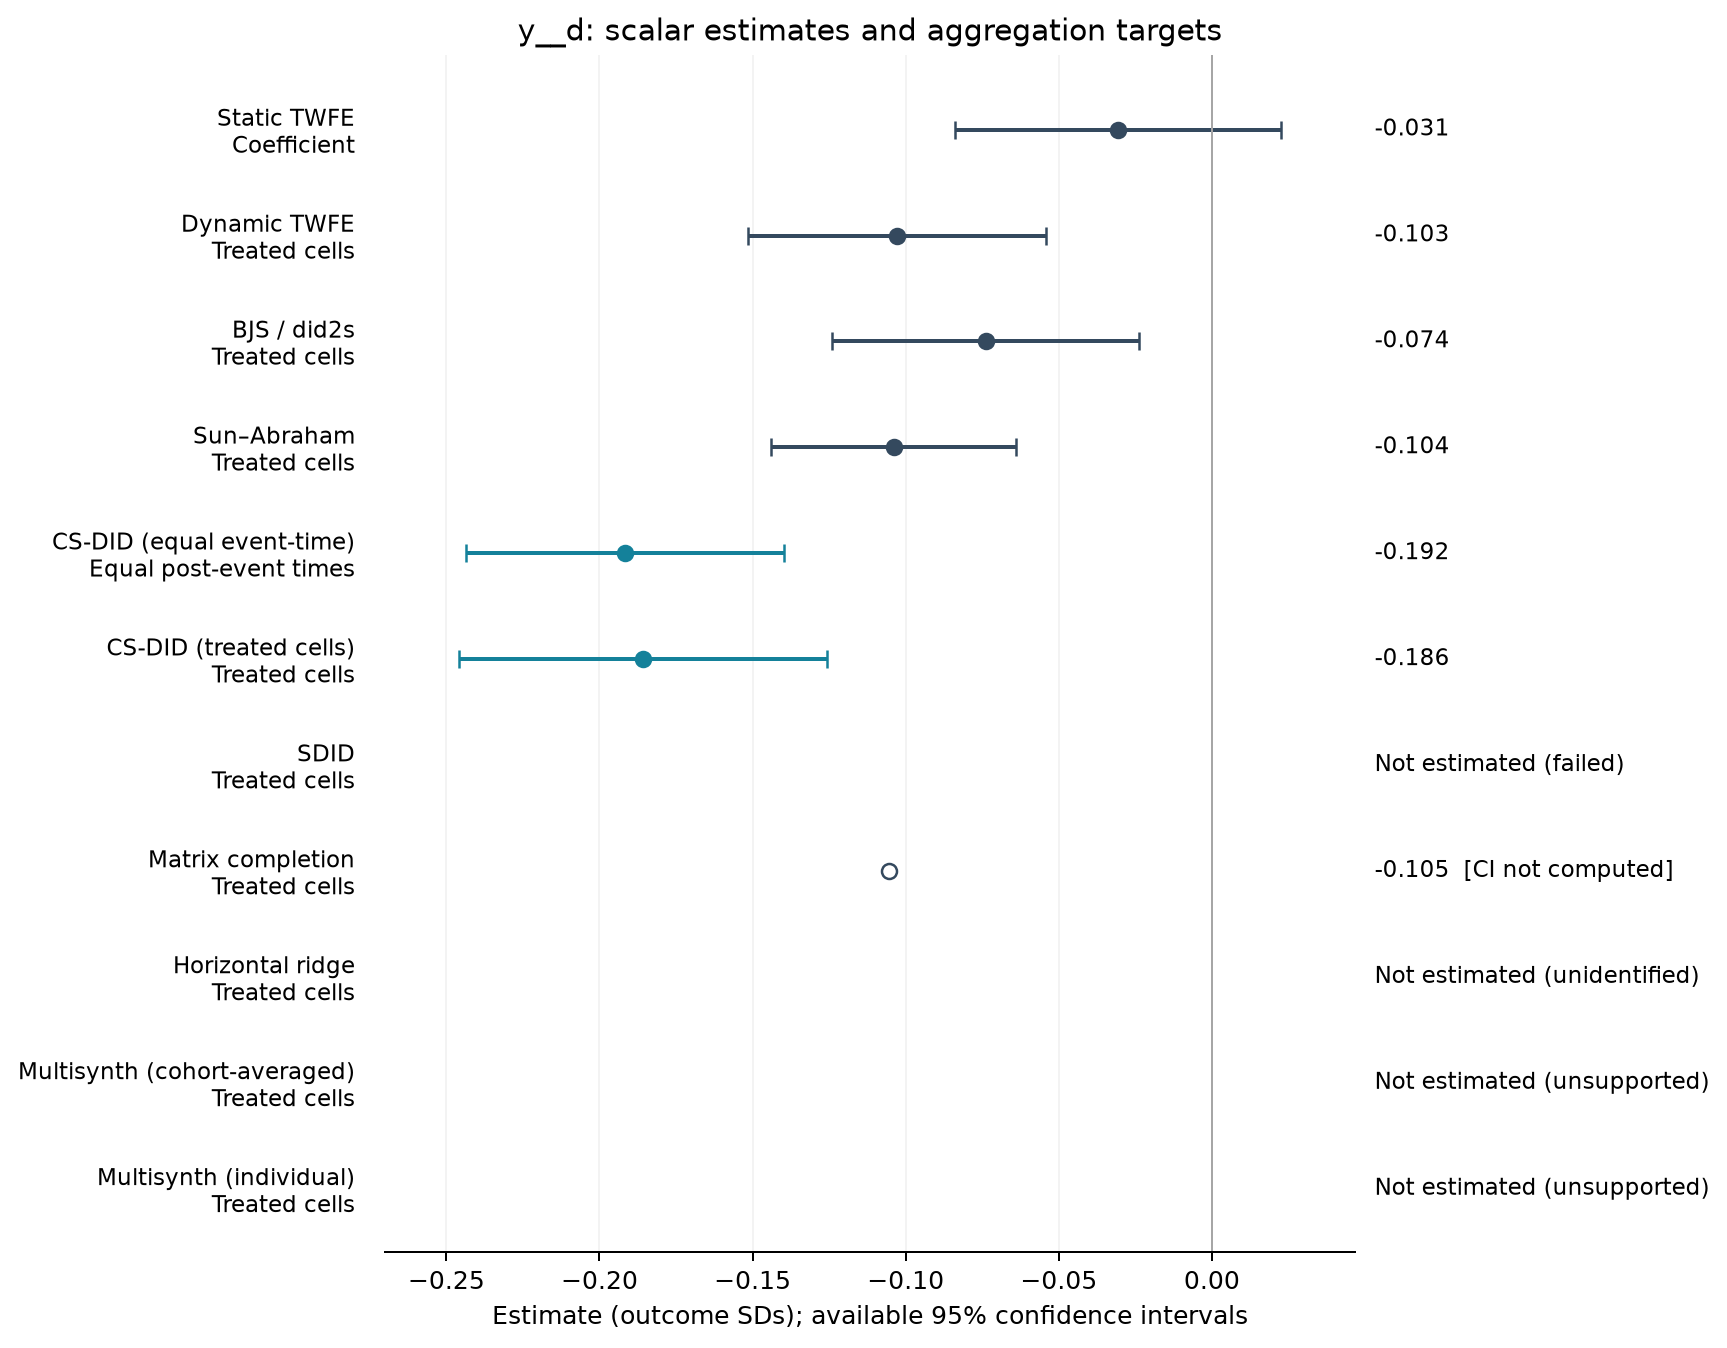
| Static TWFE | -0.031 | 0.027 | [-0.084, 0.023] | Coefficient |
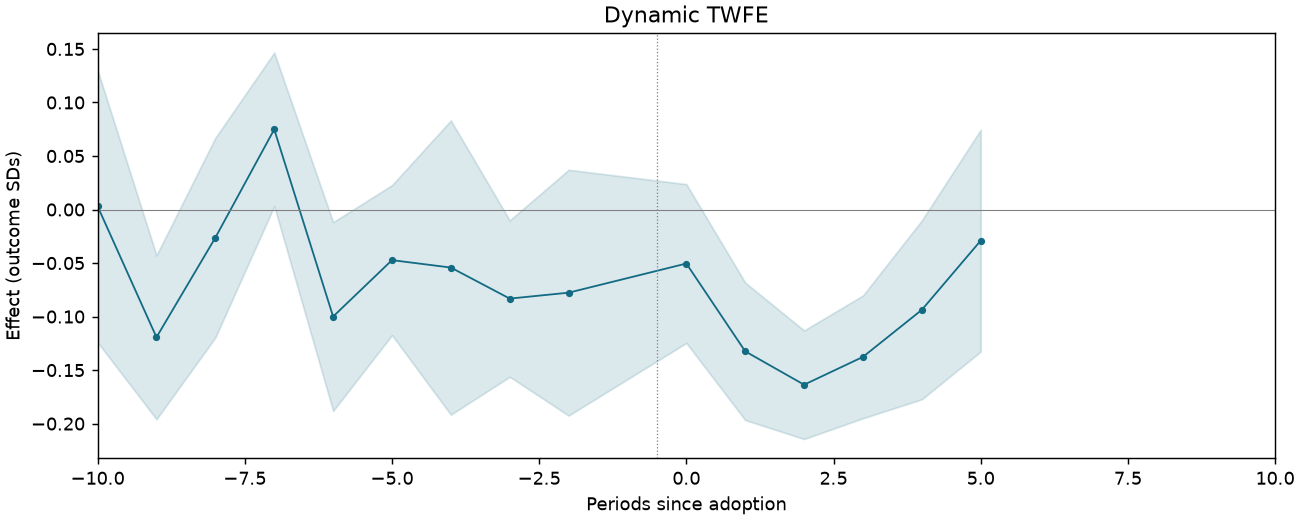
| Dynamic TWFE | -0.103 | 0.024 | [-0.152, -0.054] | Treated cells |
| BJS / did2s | -0.074 | 0.025 | [-0.124, -0.024] | Treated cells |
| Sun–Abraham | -0.104 | 0.020 | [-0.144, -0.064] | Treated cells |
| CS-DID (equal event-time) | -0.192 | 0.027 | [-0.244, -0.140] | Equal post-event times |
| CS-DID (treated cells) | -0.186 | 0.031 | [-0.246, -0.126] | Treated cells |
| Matrix completion | -0.105 | — | — | Treated cells |
Event studies
Periods −10 to +10; pointwise 95% intervals where available.
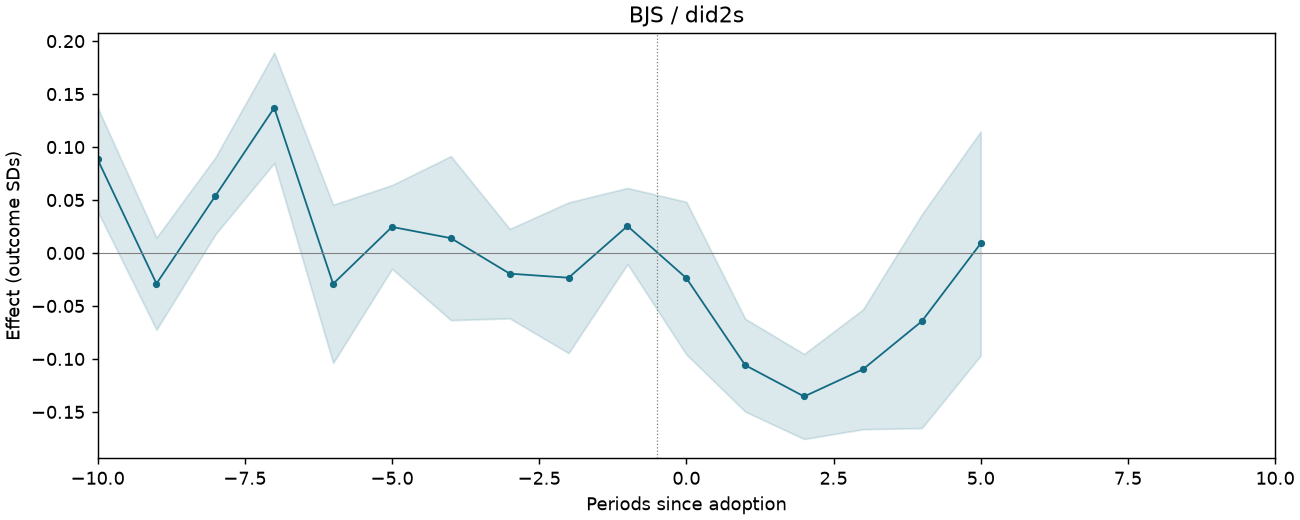
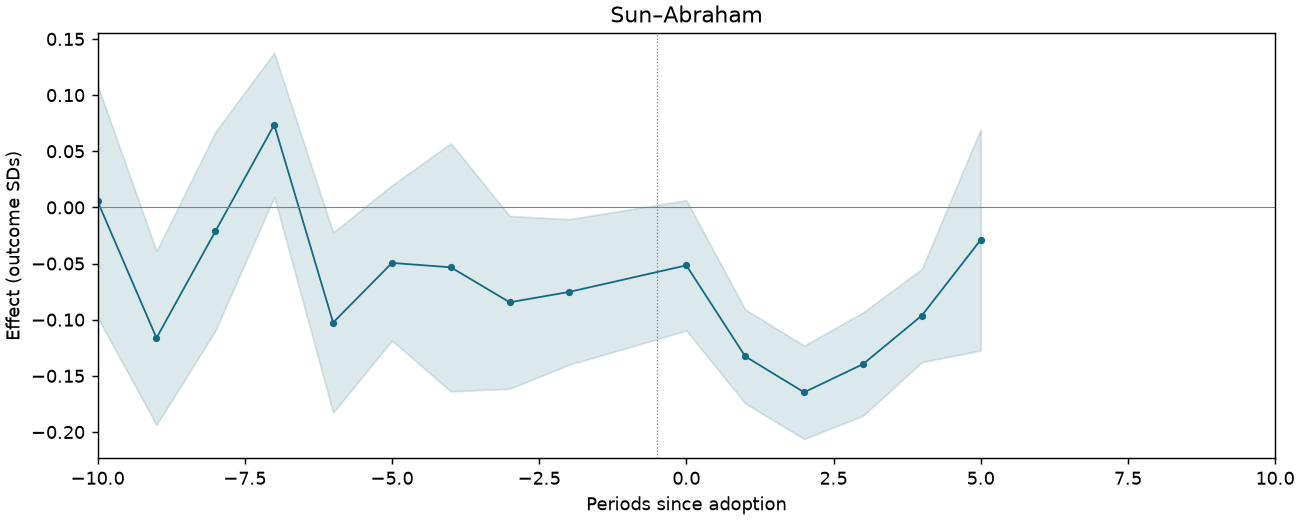
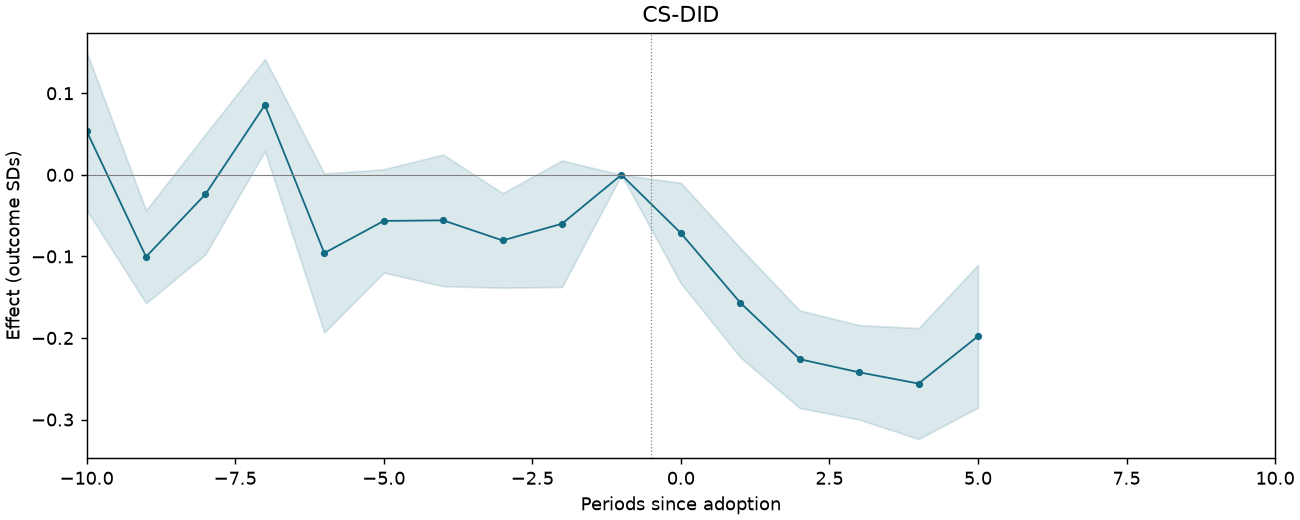
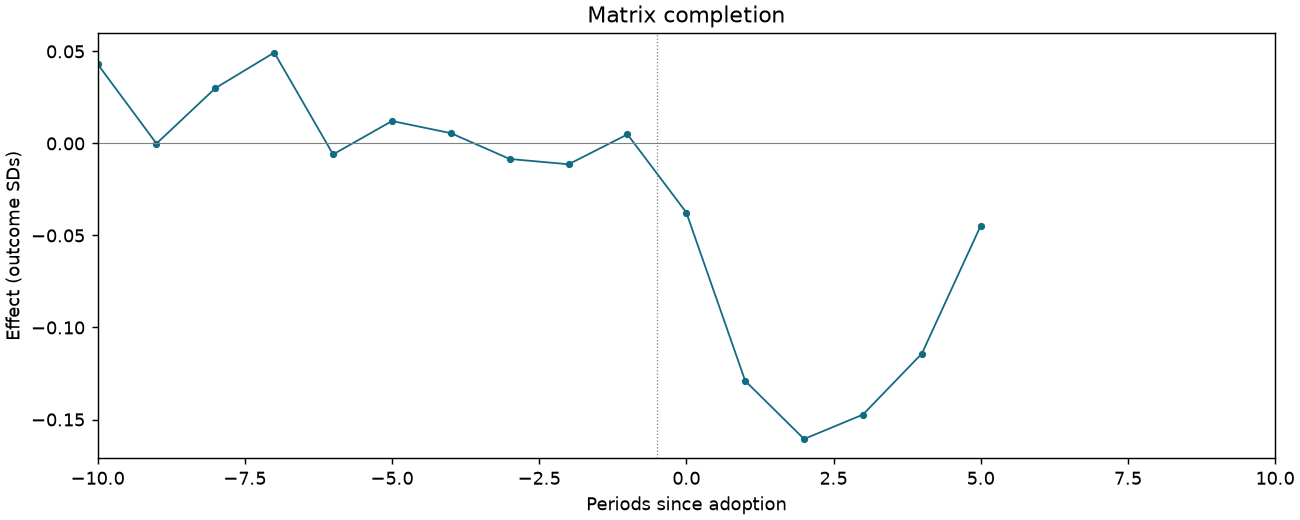
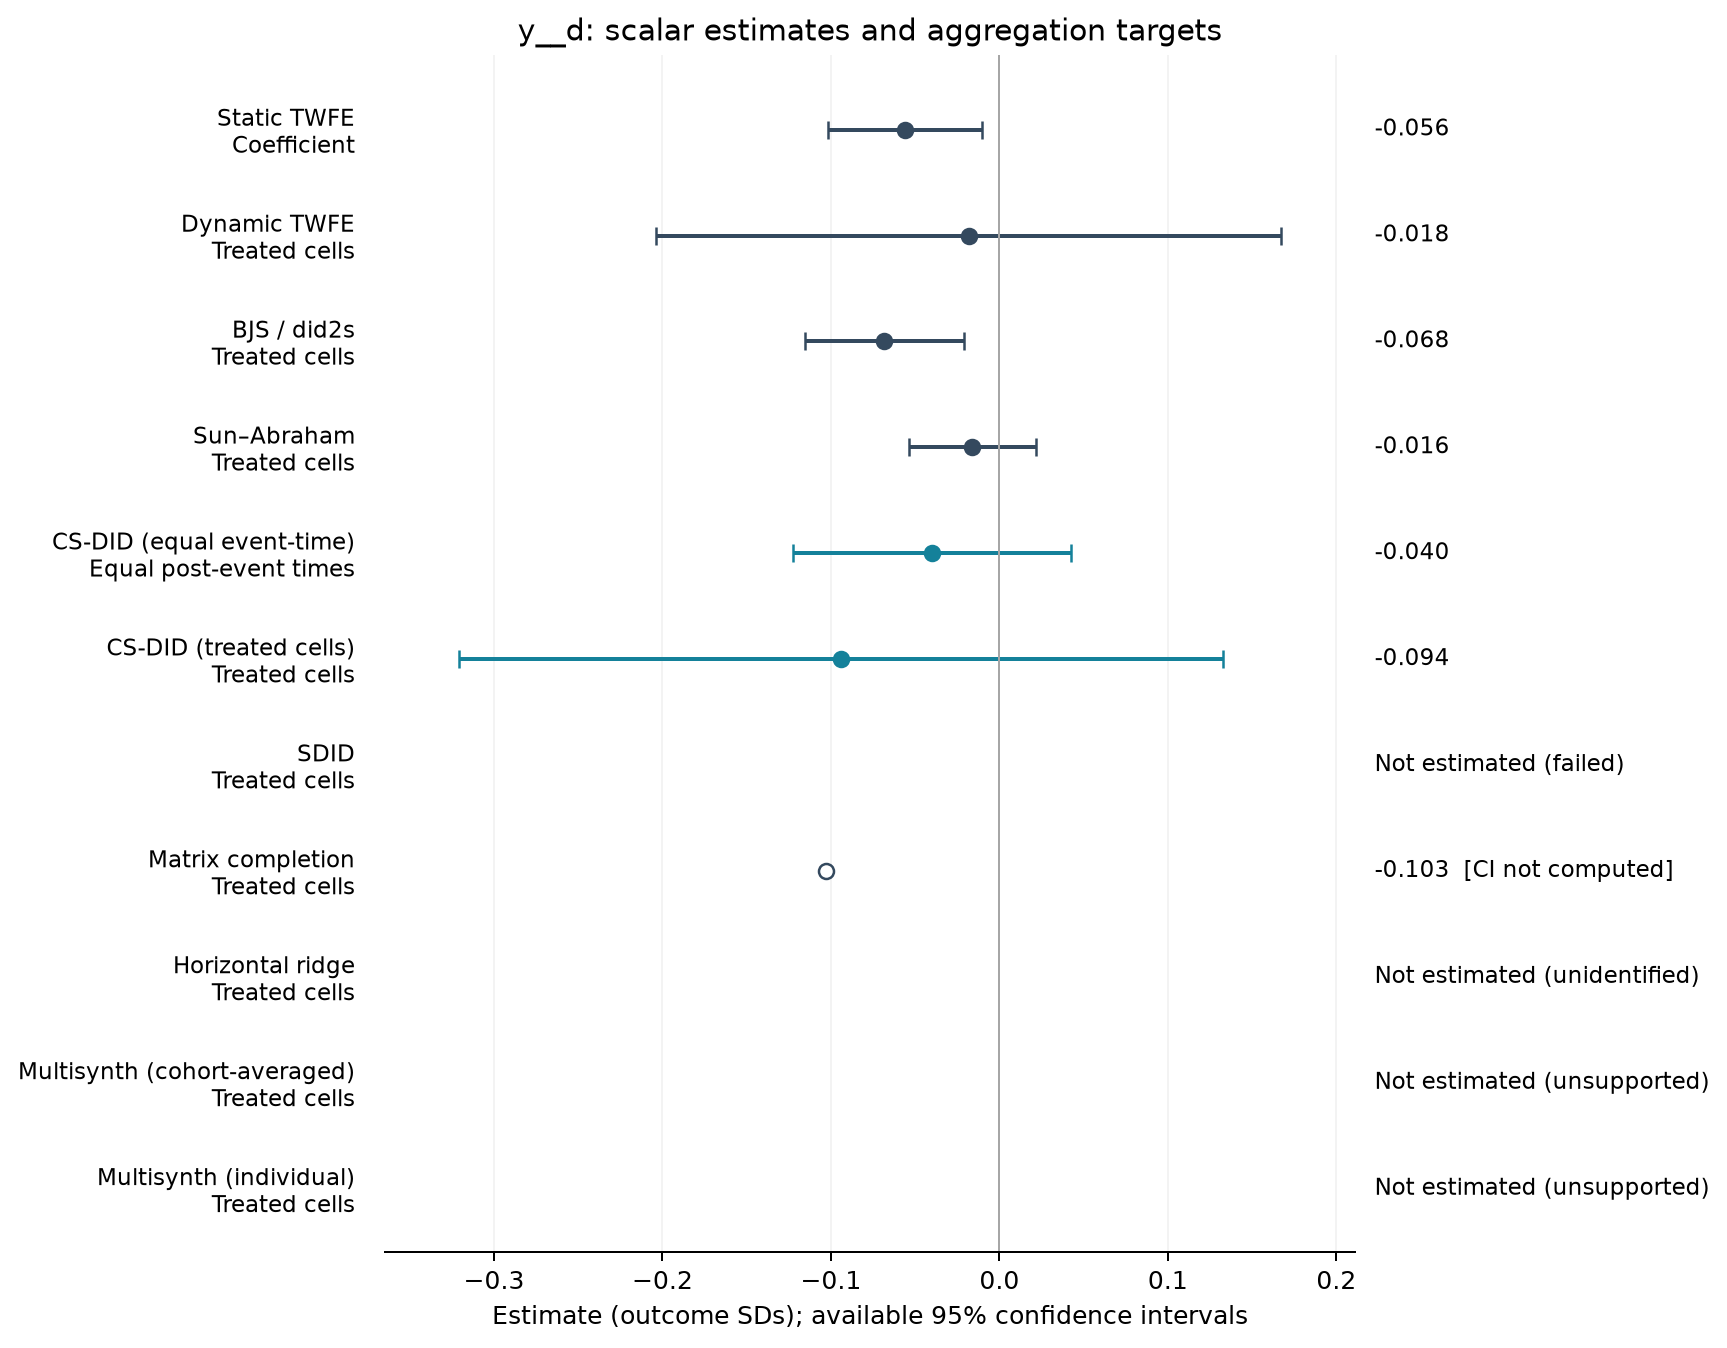
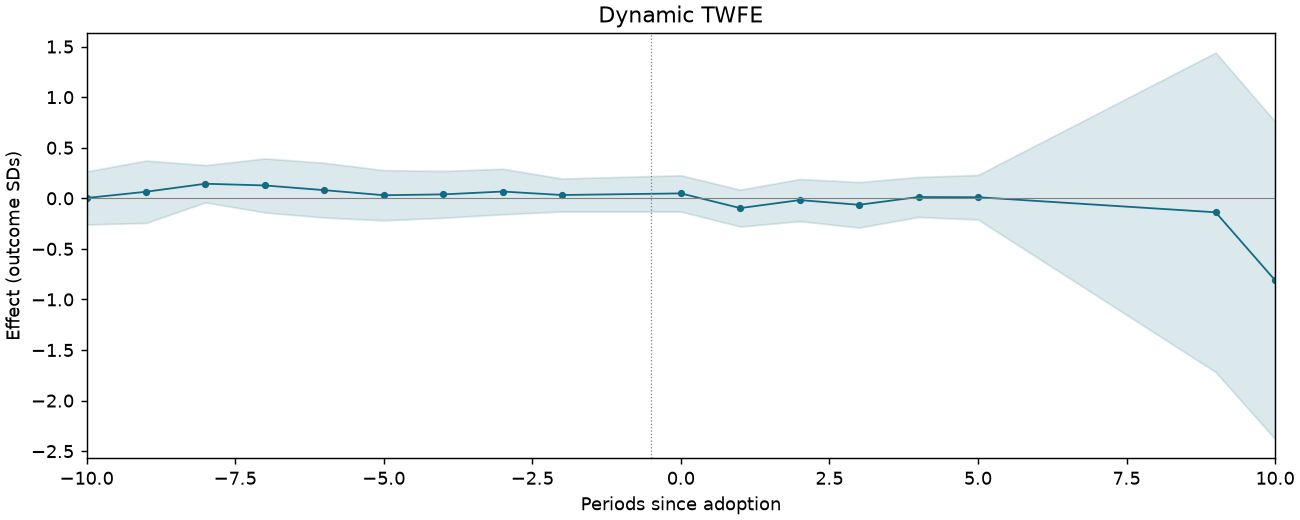
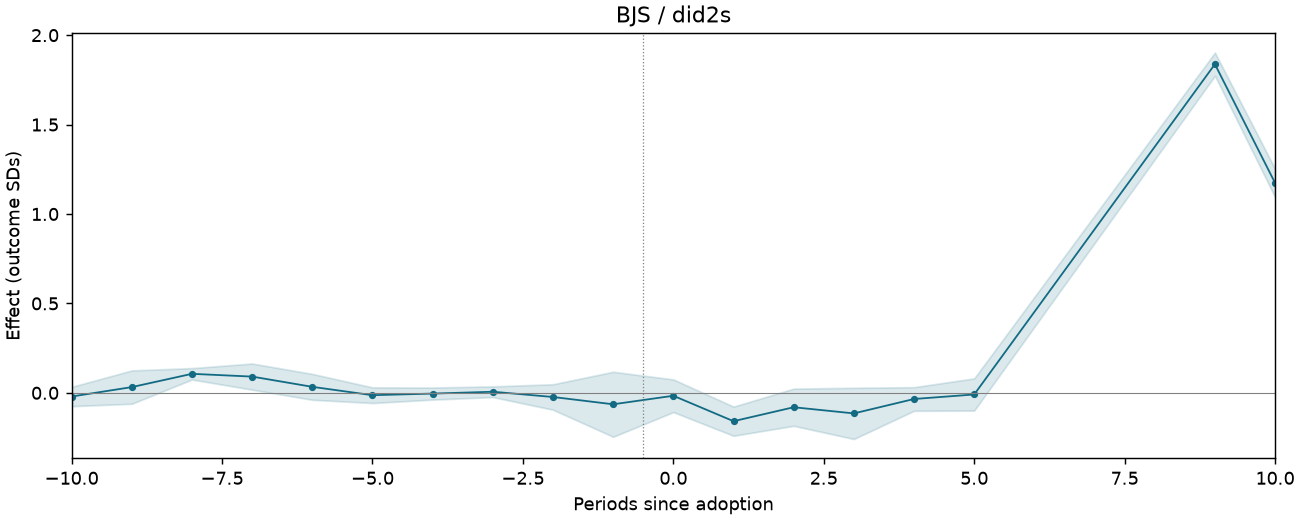
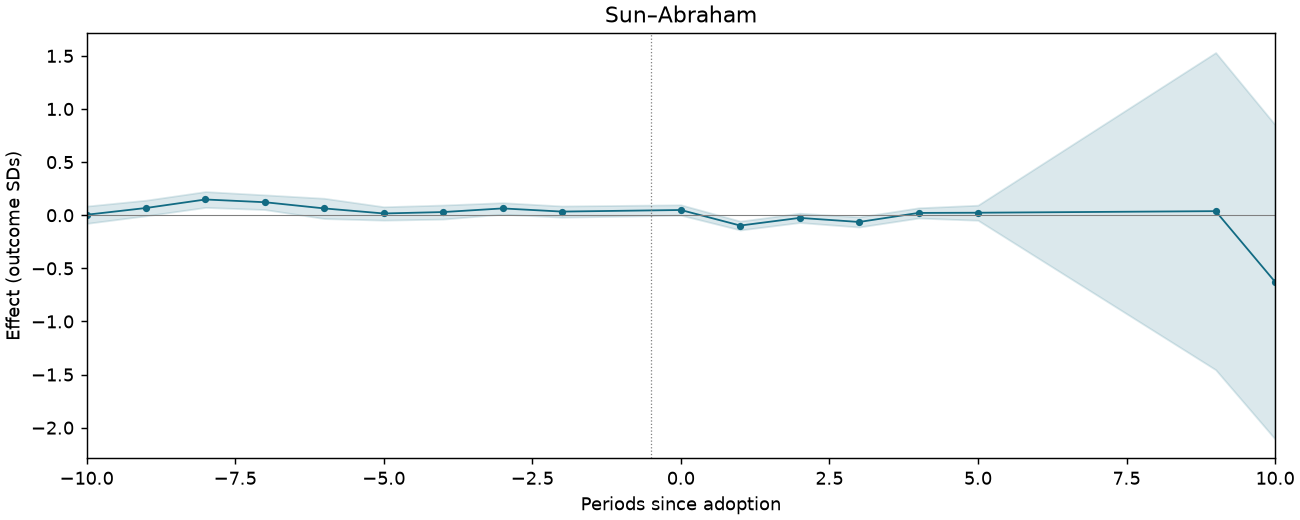
PP-REPLY-T1-PA-NOTXOIL-CHGEMP
156,443 observations · 14,604 units · 58 clusters · 712 treated / 13,892 control units.
Estimate comparison
| Estimator | Estimate (SDs) | SE | 95% CI | Averaging |
|---|---|---|---|---|
| Static TWFE | -0.056 | 0.023 | [-0.102, -0.010] | Coefficient |
| Dynamic TWFE | -0.018 | 0.093 | [-0.204, 0.167] | Treated cells |
| BJS / did2s | -0.068 | 0.024 | [-0.116, -0.021] | Treated cells |
| Sun–Abraham | -0.016 | 0.019 | [-0.054, 0.021] | Treated cells |
| CS-DID (equal event-time) | -0.040 | 0.042 | [-0.122, 0.042] | Equal post-event times |
| CS-DID (treated cells) | -0.094 | 0.116 | [-0.321, 0.133] | Treated cells |
| Matrix completion | -0.103 | — | — | Treated cells |
Event studies
Periods −10 to +10; pointwise 95% intervals where available.
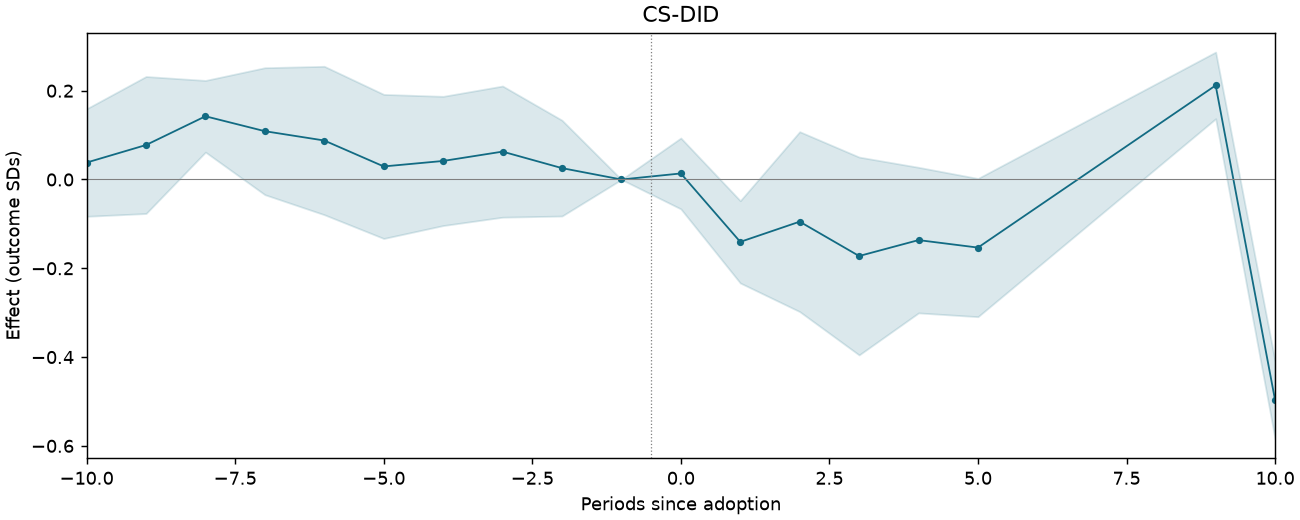
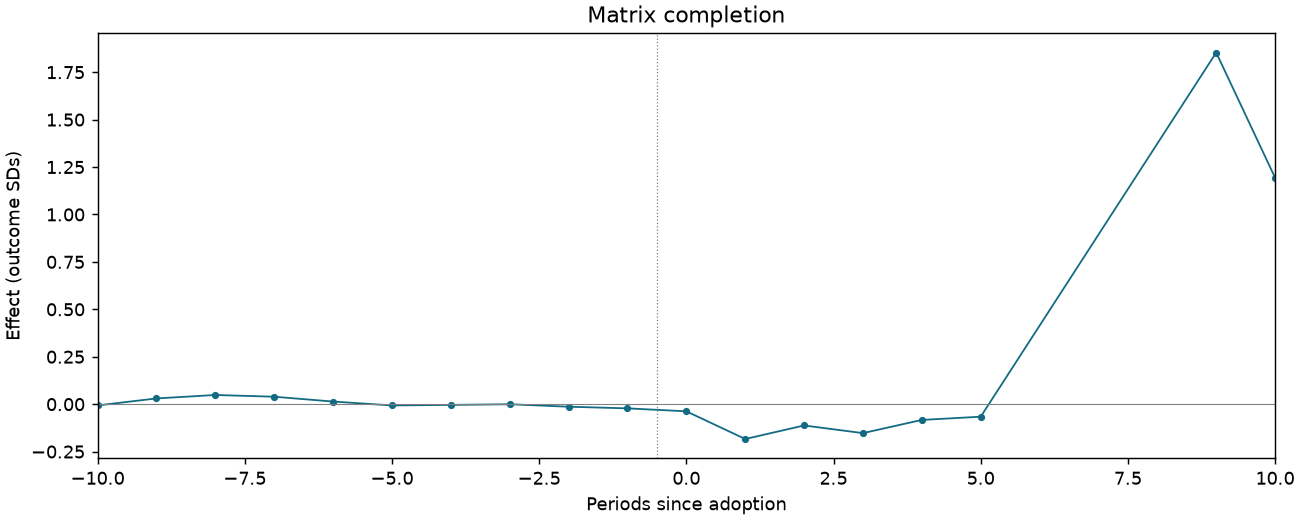
PP-REPLY-T1-PA-NOTXOIL-SALESGR
168,071 observations · 15,356 units · 58 clusters · 771 treated / 14,585 control units.
Estimate comparison
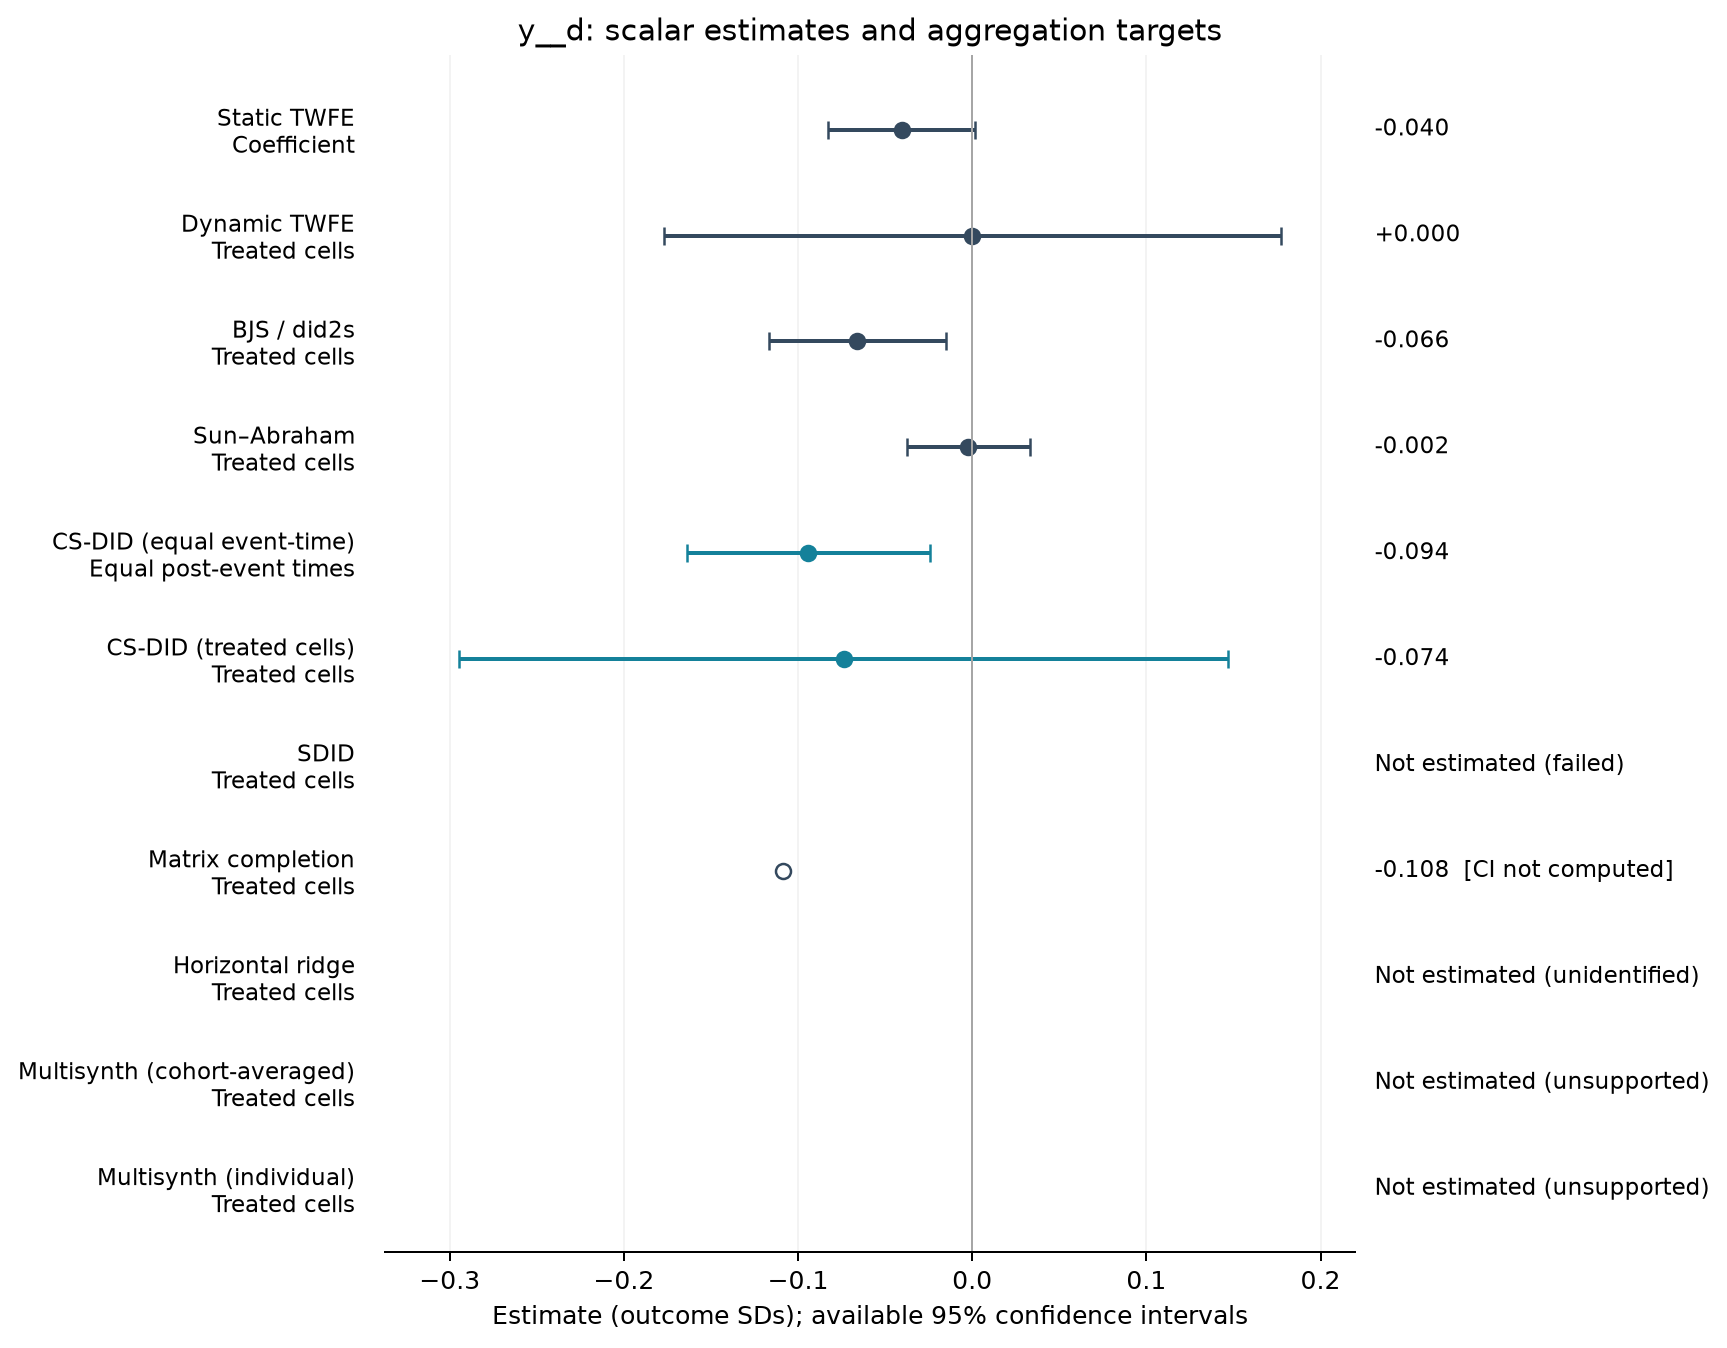
| Estimator | Estimate (SDs) | SE | 95% CI | Averaging |
|---|---|---|---|---|
| Static TWFE | -0.040 | 0.021 | [-0.083, 0.002] | Coefficient |
| Dynamic TWFE | 0.000 | 0.089 | [-0.177, 0.177] | Treated cells |
| BJS / did2s | -0.066 | 0.025 | [-0.117, -0.015] | Treated cells |
| Sun–Abraham | -0.002 | 0.018 | [-0.037, 0.033] | Treated cells |
| CS-DID (equal event-time) | -0.094 | 0.036 | [-0.164, -0.024] | Equal post-event times |
| CS-DID (treated cells) | -0.074 | 0.113 | [-0.295, 0.147] | Treated cells |
| Matrix completion | -0.108 | — | — | Treated cells |
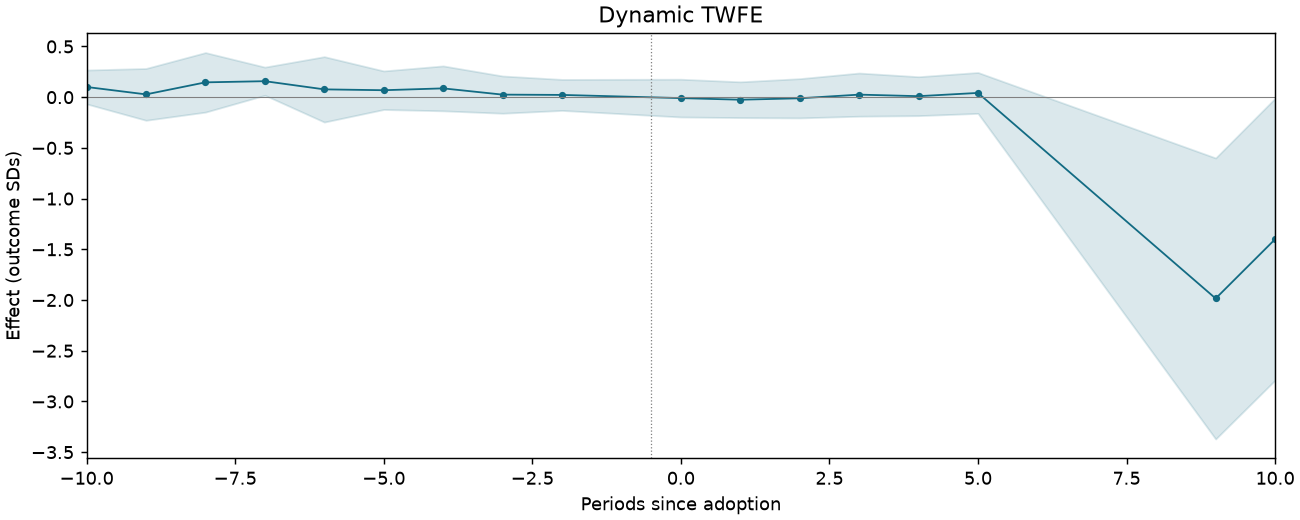
Event studies
Periods −10 to +10; pointwise 95% intervals where available.
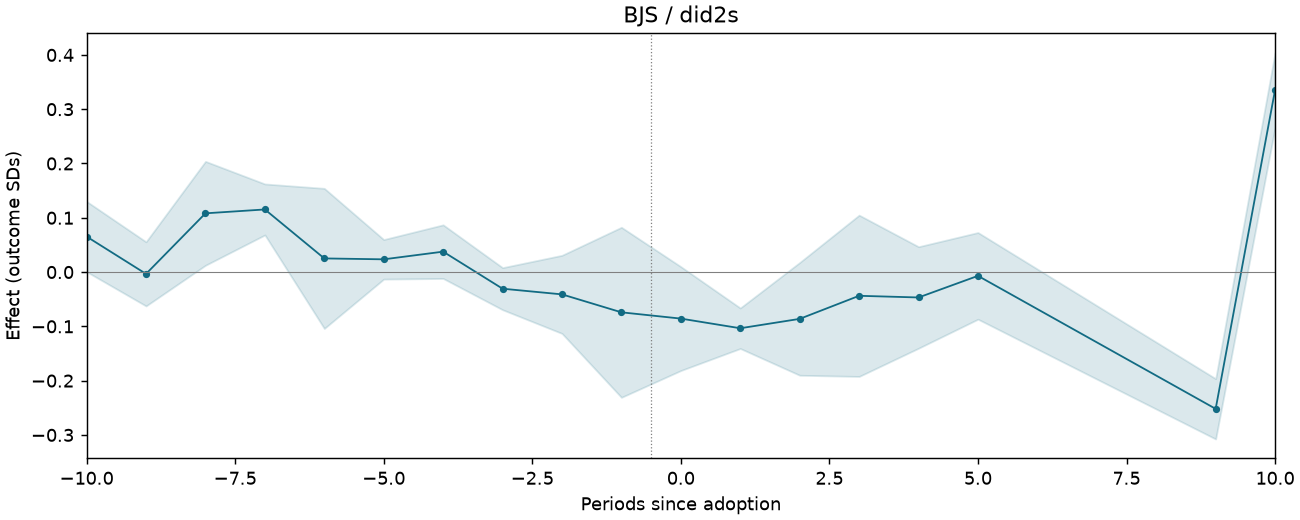
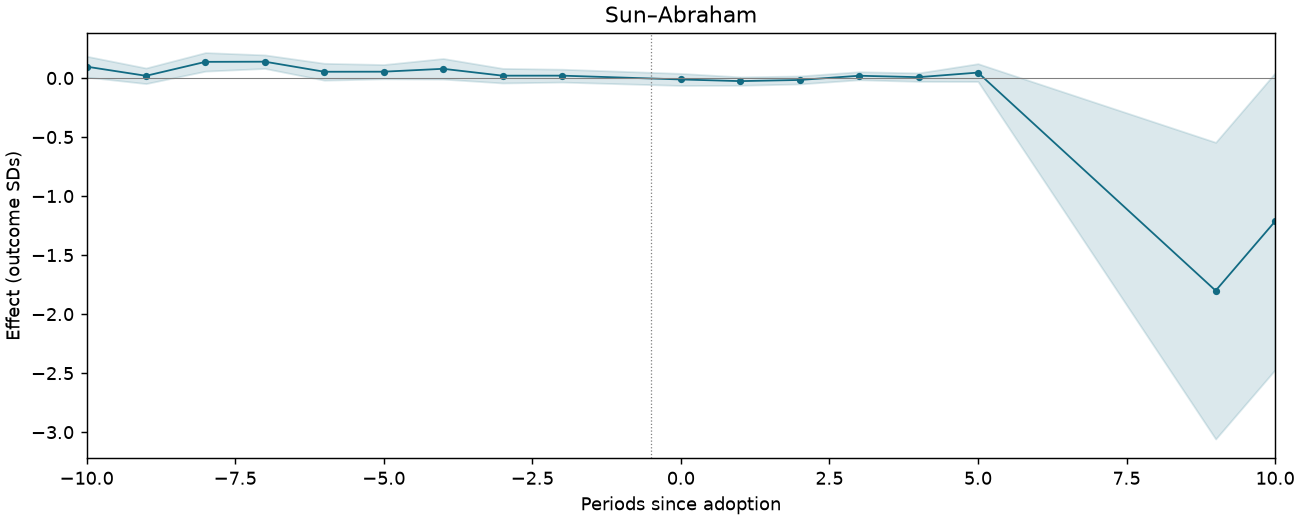
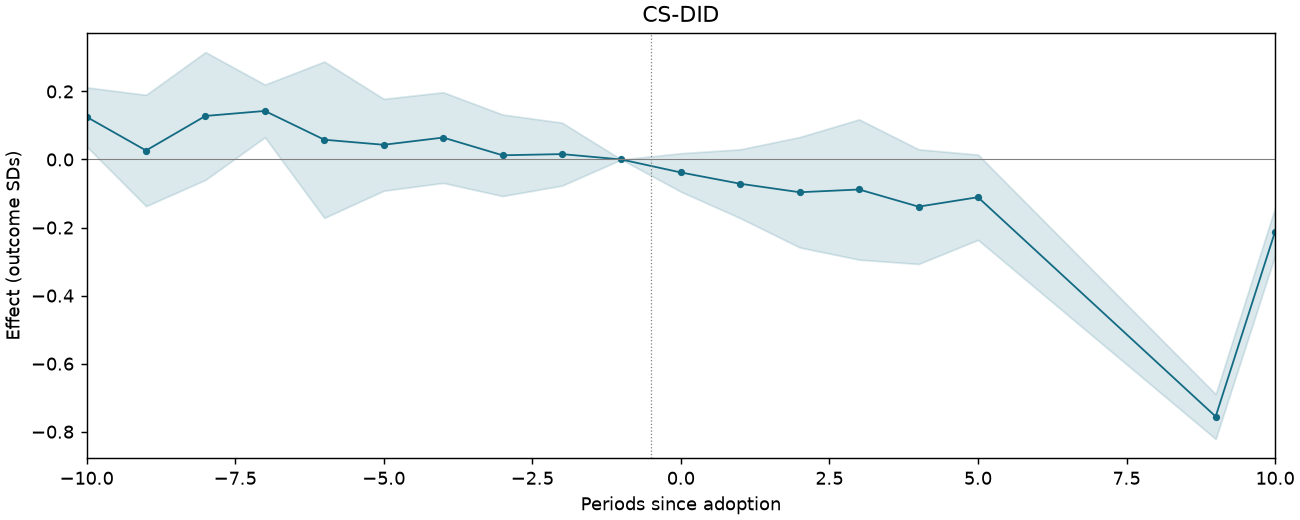
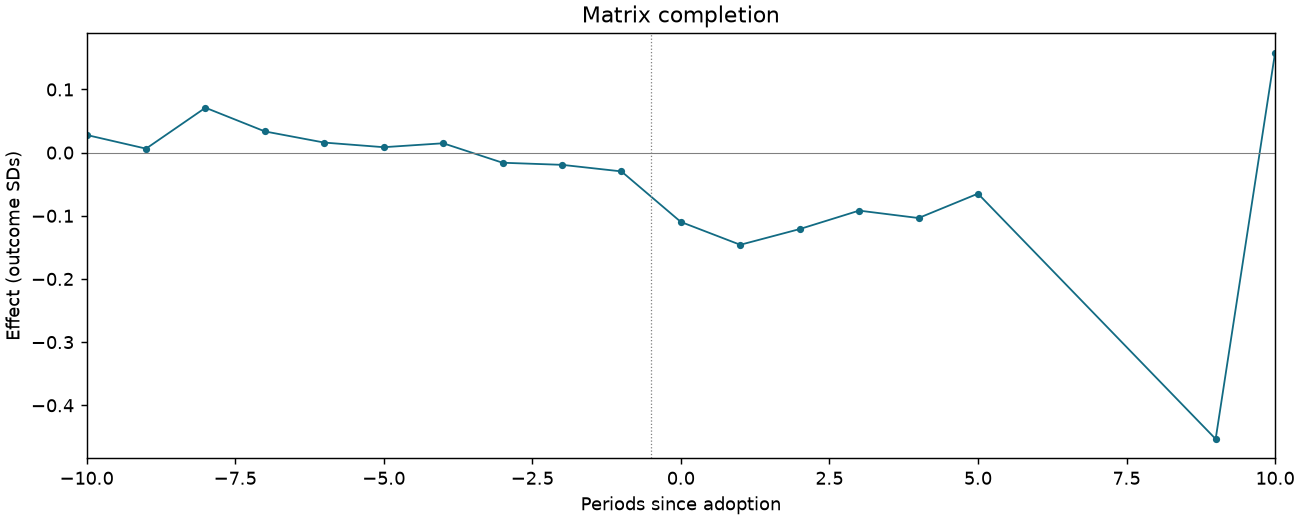
PP-REPLY-T1-PB-ALL-CHGEMP
109,770 observations · 12,555 units · 56 clusters · 26 treated / 12,529 control units.
Estimate comparison
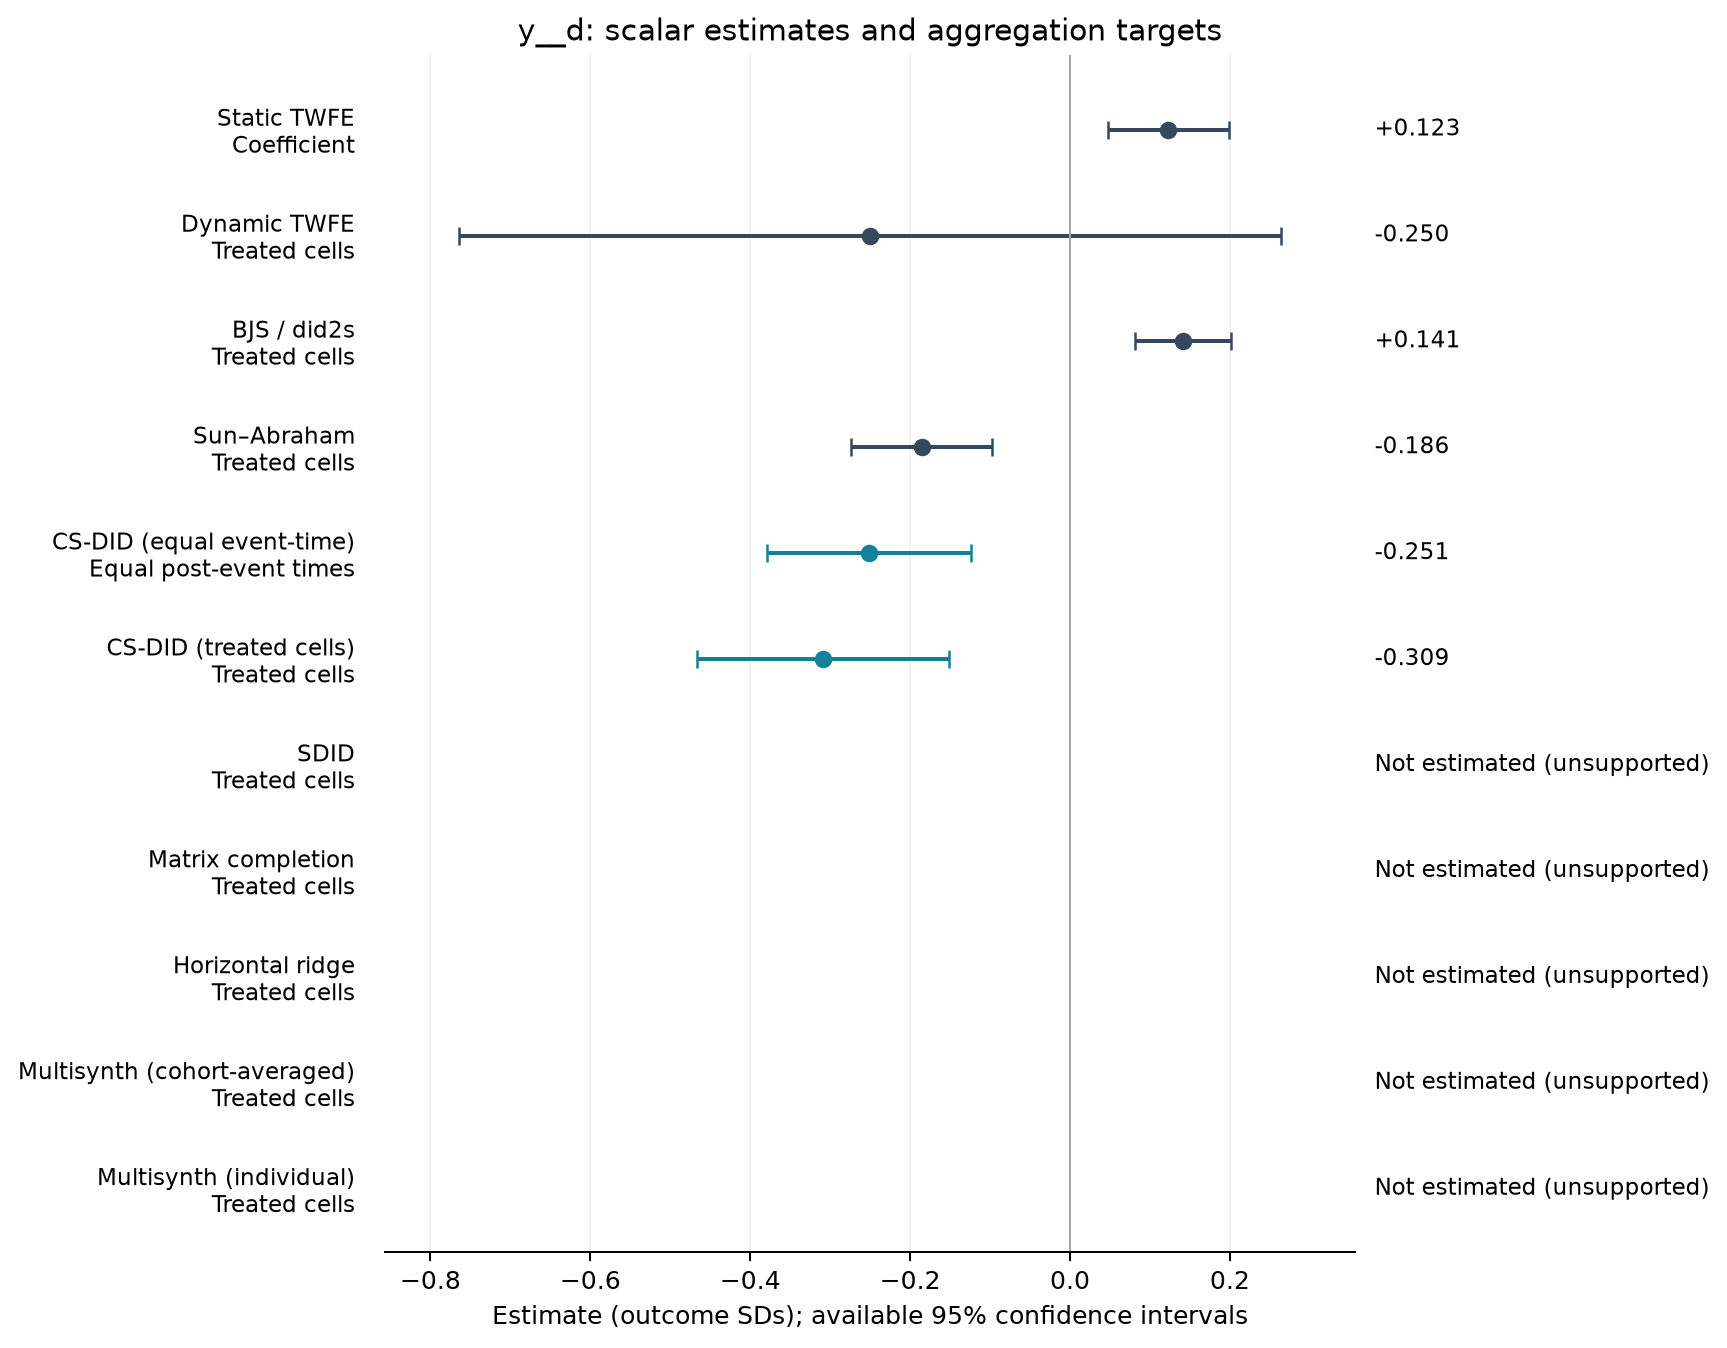
| Estimator | Estimate (SDs) | SE | 95% CI | Averaging |
|---|---|---|---|---|
| Static TWFE | 0.123 | 0.038 | [0.047, 0.198] | Coefficient |
| Dynamic TWFE | -0.250 | 0.257 | [-0.764, 0.264] | Treated cells |
| BJS / did2s | 0.141 | 0.030 | [0.081, 0.201] | Treated cells |
| Sun–Abraham | -0.186 | 0.044 | [-0.274, -0.097] | Treated cells |
| CS-DID (equal event-time) | -0.251 | 0.065 | [-0.379, -0.124] | Equal post-event times |
| CS-DID (treated cells) | -0.309 | 0.080 | [-0.467, -0.152] | Treated cells |
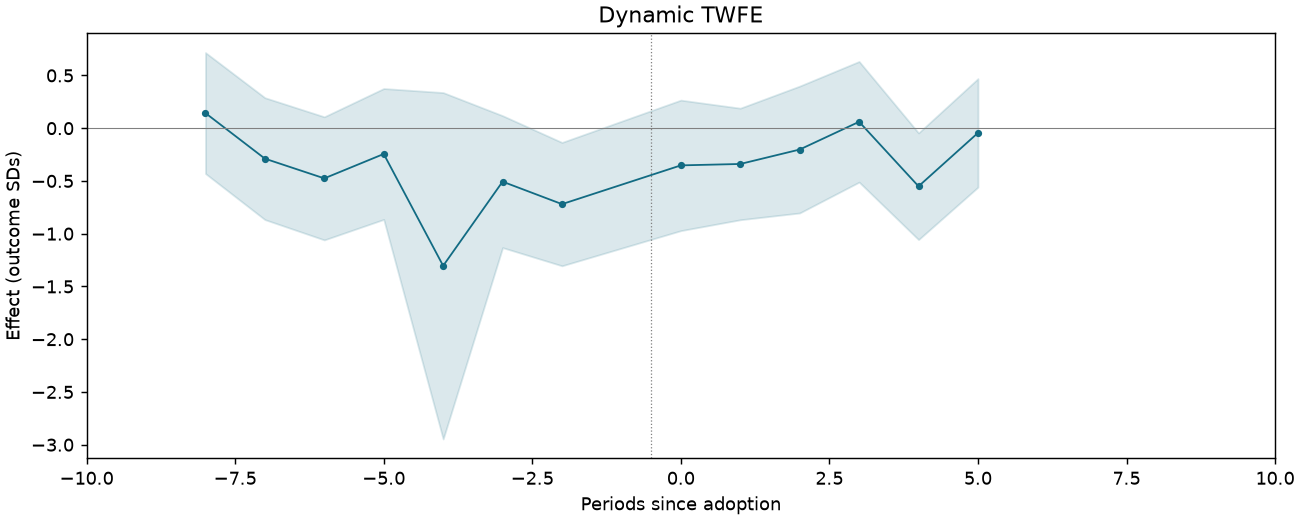
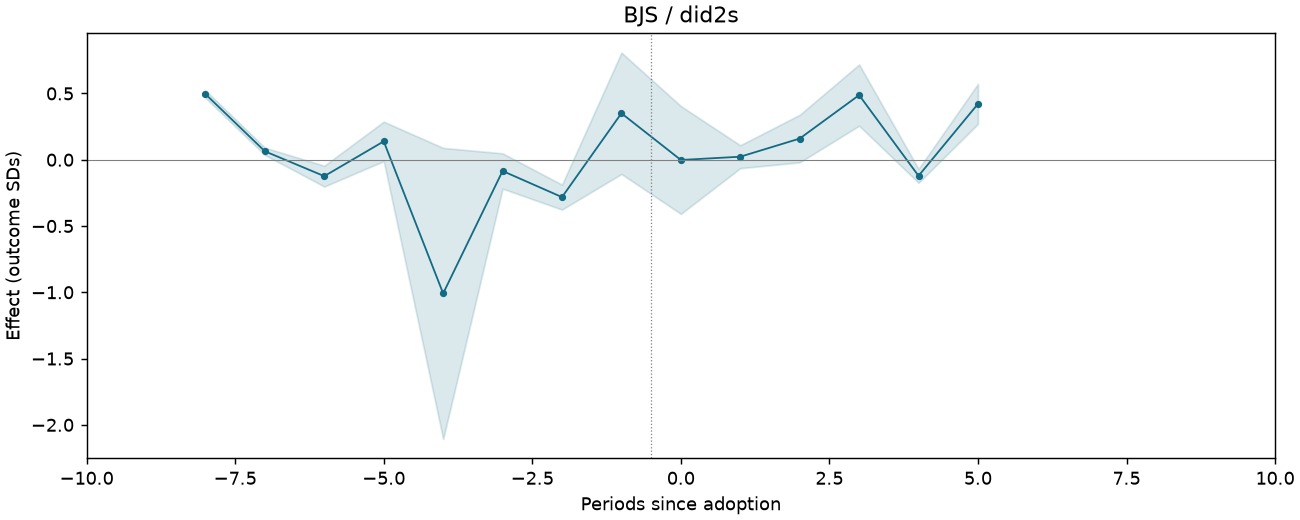
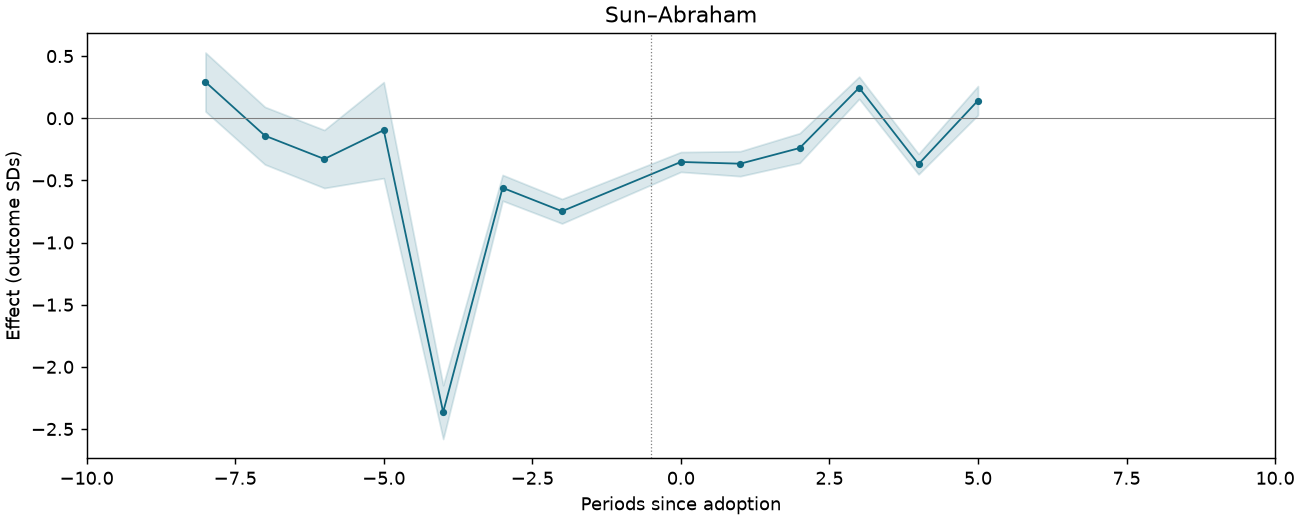
Event studies
Periods −10 to +10; pointwise 95% intervals where available.
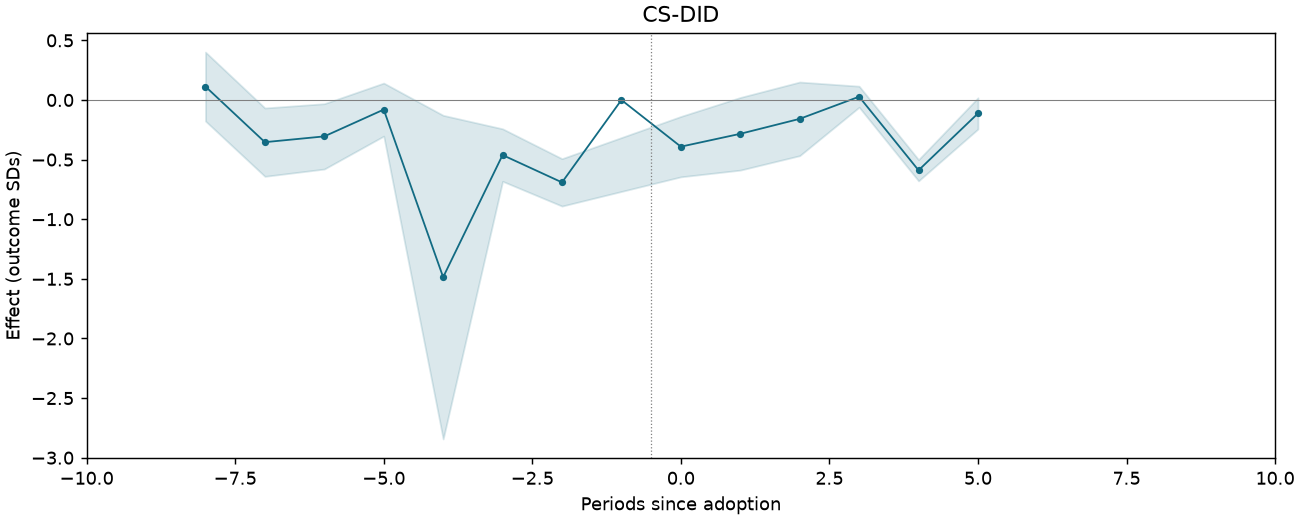
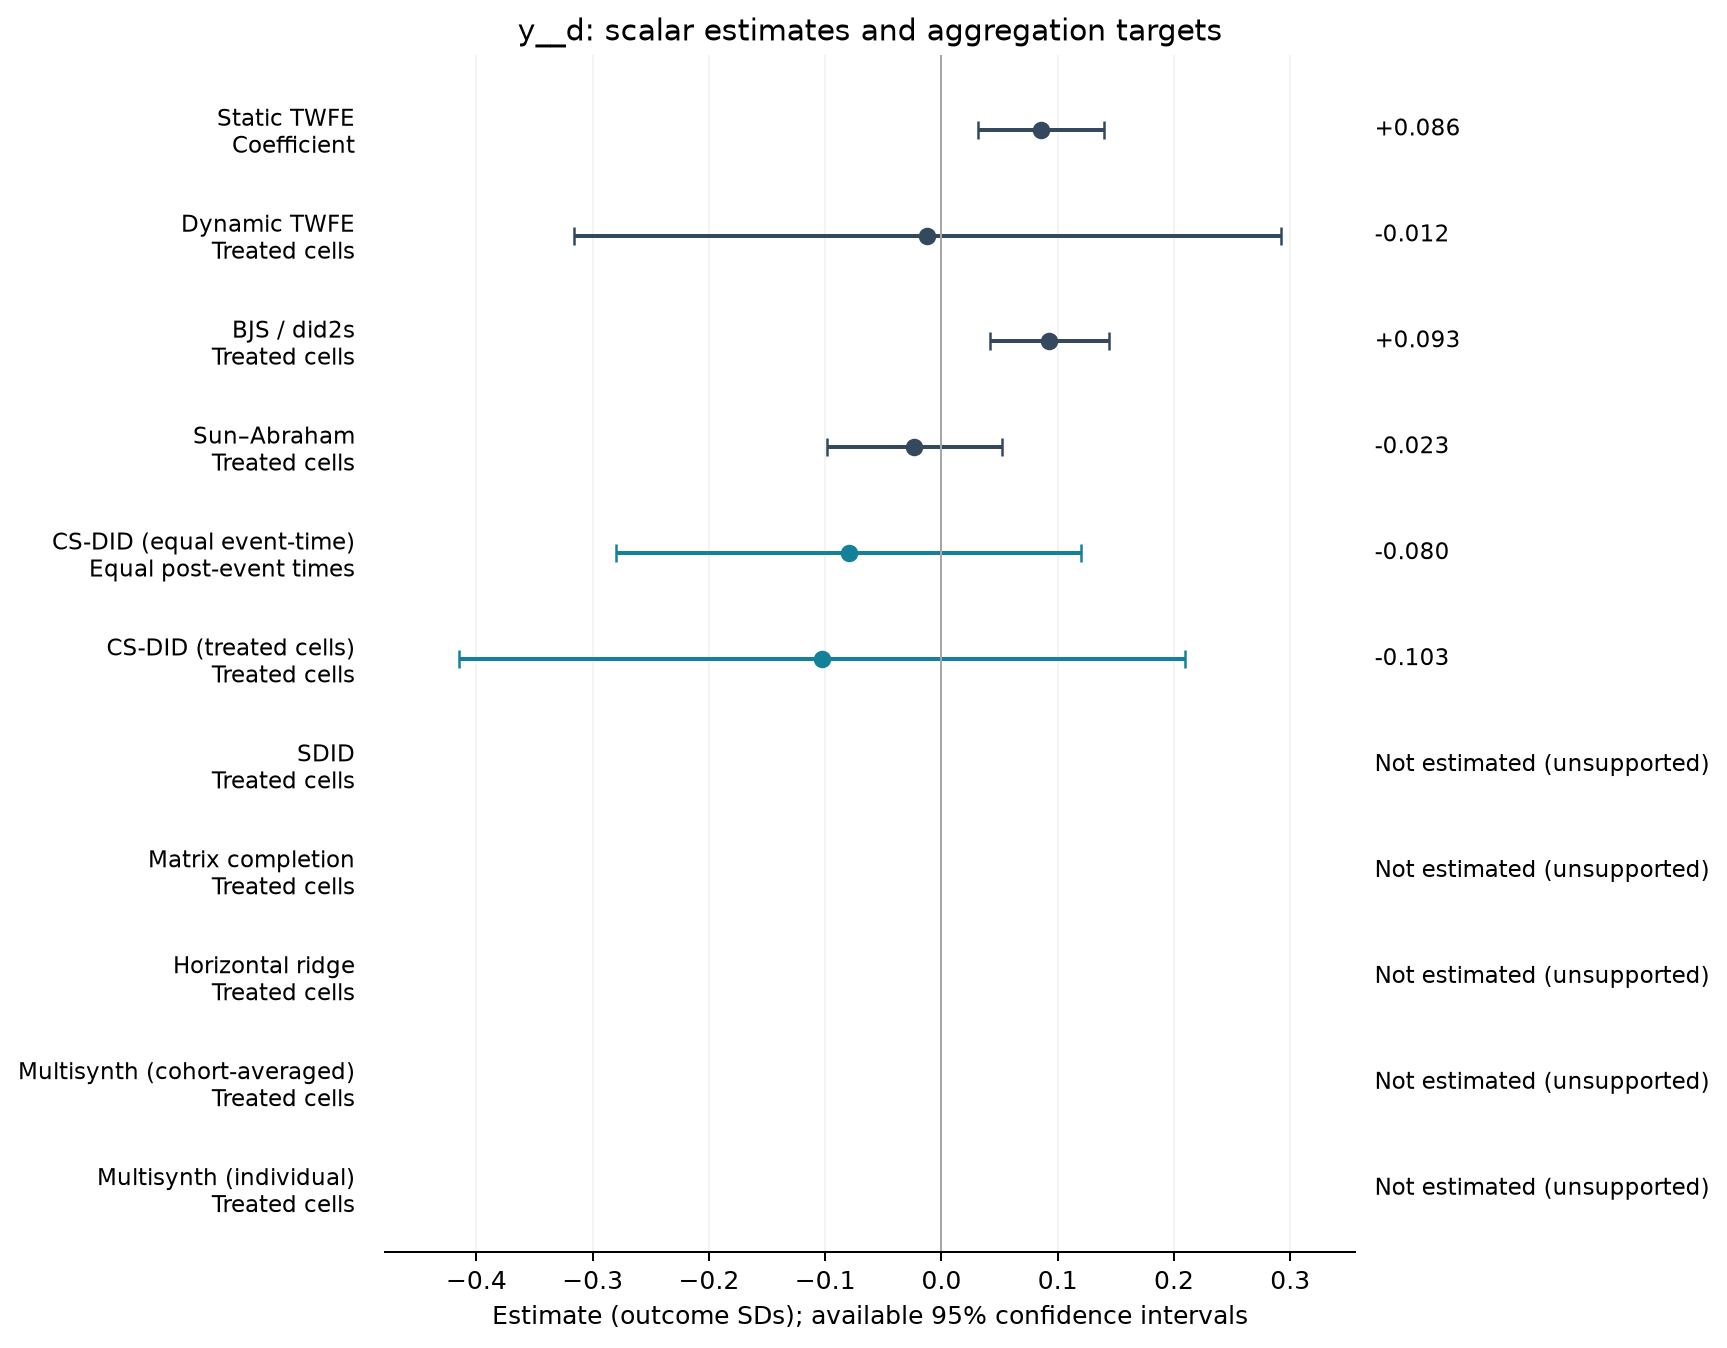
PP-REPLY-T1-PB-ALL-SALESGR
118,800 observations · 13,225 units · 56 clusters · 29 treated / 13,196 control units.
Estimate comparison
| Estimator | Estimate (SDs) | SE | 95% CI | Averaging |
|---|---|---|---|---|
| Static TWFE | 0.086 | 0.027 | [0.032, 0.140] | Coefficient |
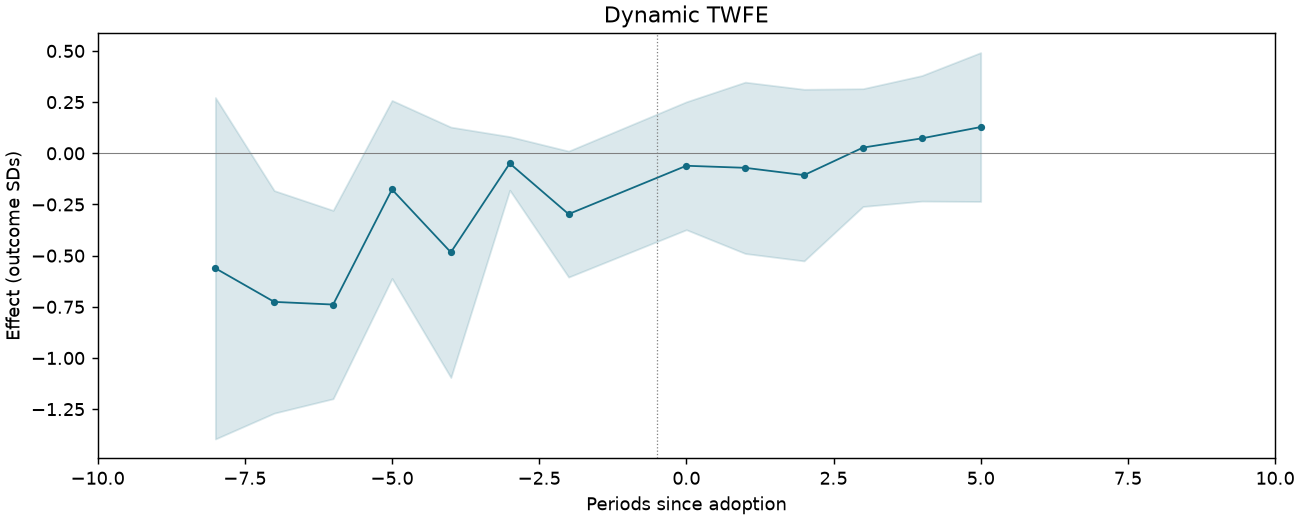
| Dynamic TWFE | -0.012 | 0.152 | [-0.316, 0.292] | Treated cells |
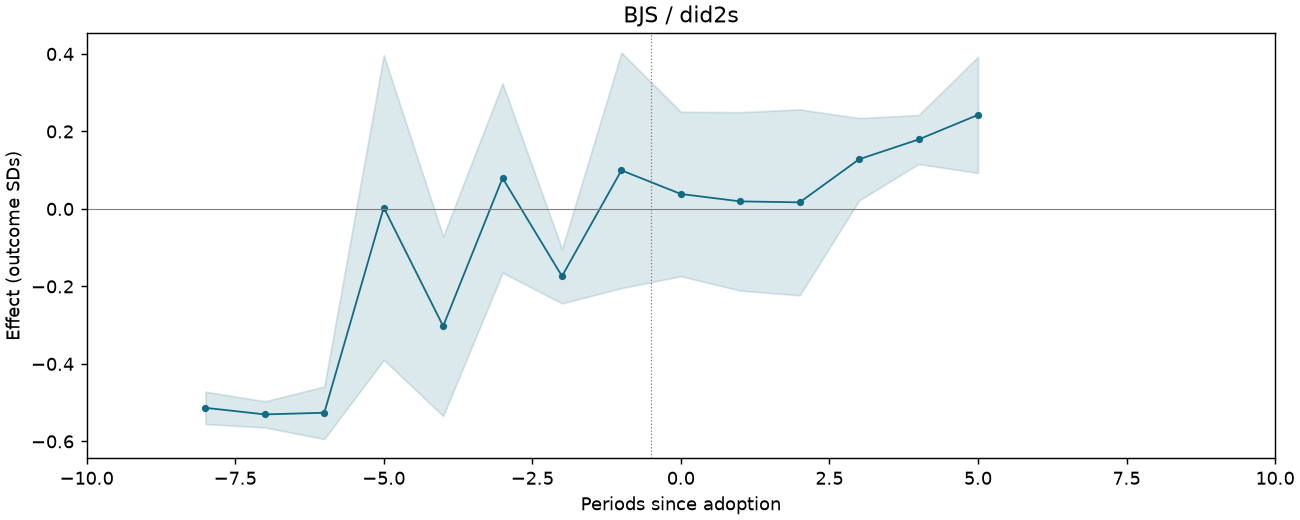
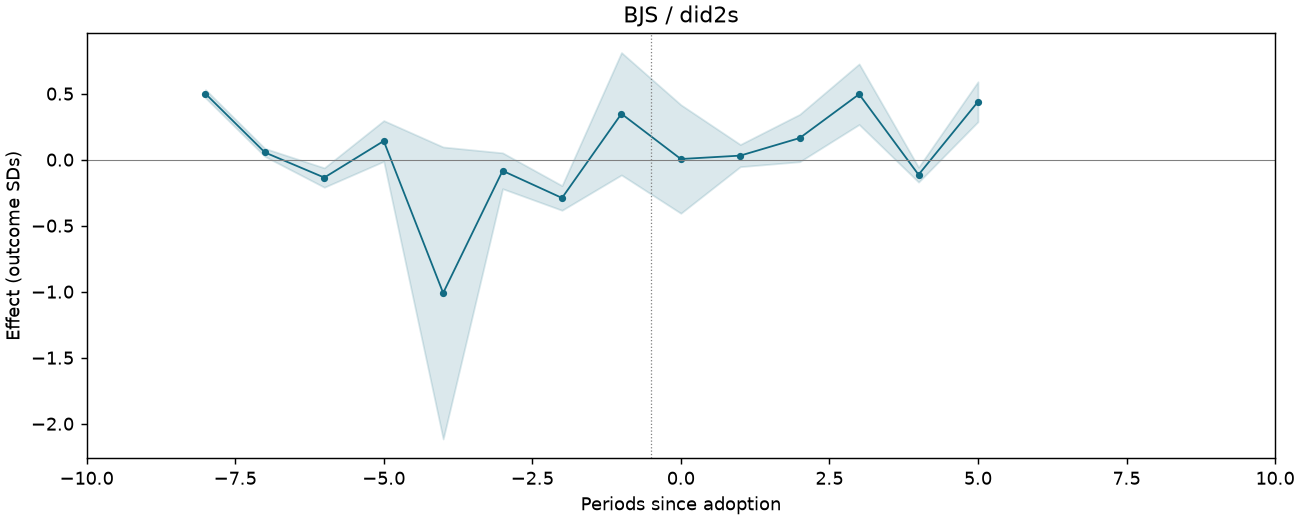
| BJS / did2s | 0.093 | 0.025 | [0.042, 0.144] | Treated cells |
| Sun–Abraham | -0.023 | 0.037 | [-0.098, 0.052] | Treated cells |
| CS-DID (equal event-time) | -0.080 | 0.102 | [-0.280, 0.120] | Equal post-event times |
| CS-DID (treated cells) | -0.103 | 0.159 | [-0.415, 0.210] | Treated cells |
Event studies
Periods −10 to +10; pointwise 95% intervals where available.
PP-REPLY-T1-PB-NOOIL-CHGEMP
105,591 observations · 12,134 units · 56 clusters · 26 treated / 12,108 control units.
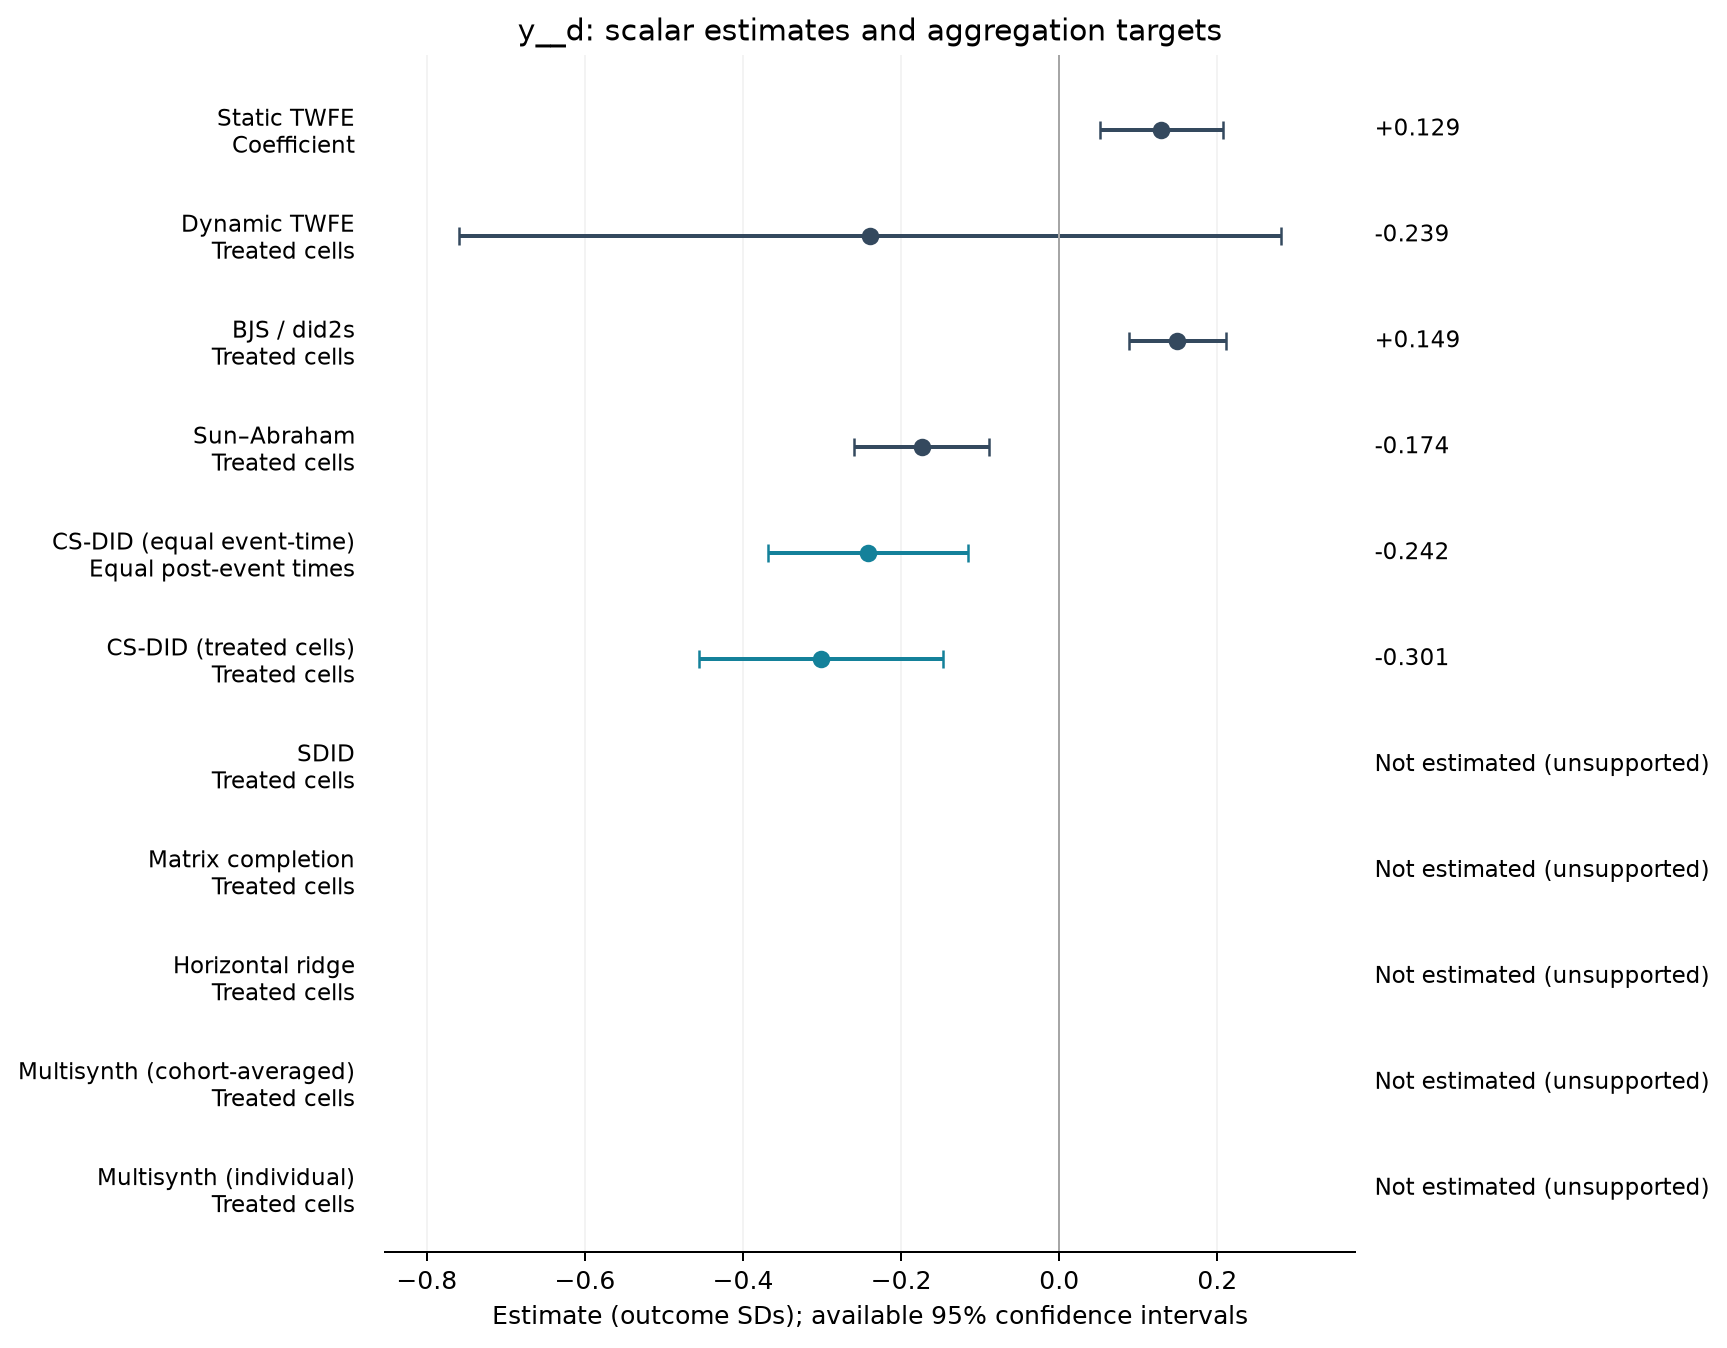
Estimate comparison
| Estimator | Estimate (SDs) | SE | 95% CI | Averaging |
|---|---|---|---|---|
| Static TWFE | 0.129 | 0.039 | [0.051, 0.207] | Coefficient |
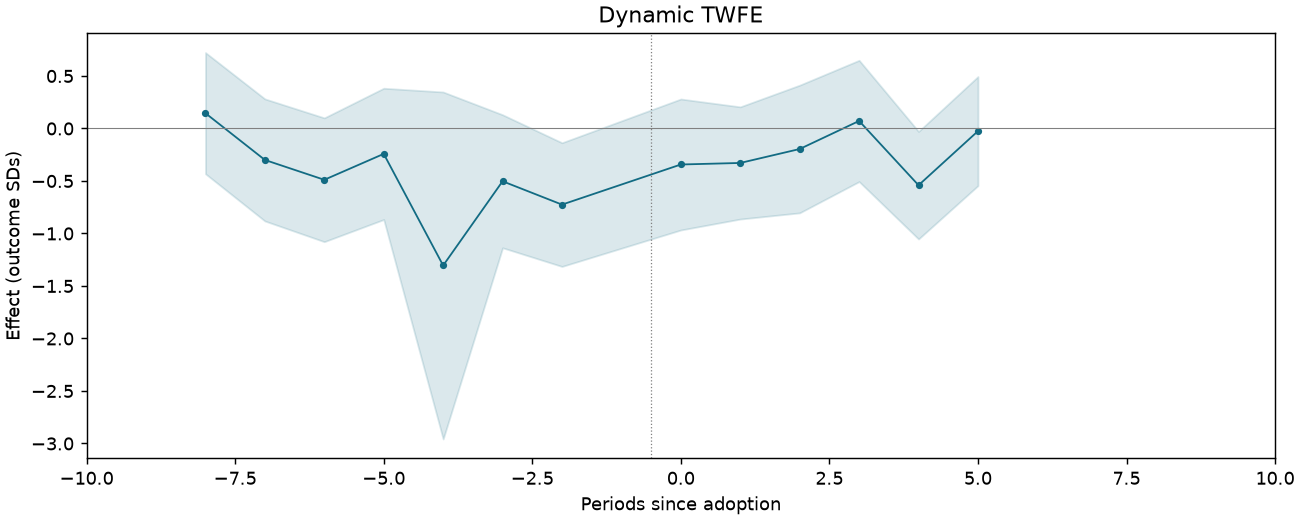
| Dynamic TWFE | -0.239 | 0.259 | [-0.759, 0.281] | Treated cells |
| BJS / did2s | 0.149 | 0.031 | [0.088, 0.211] | Treated cells |
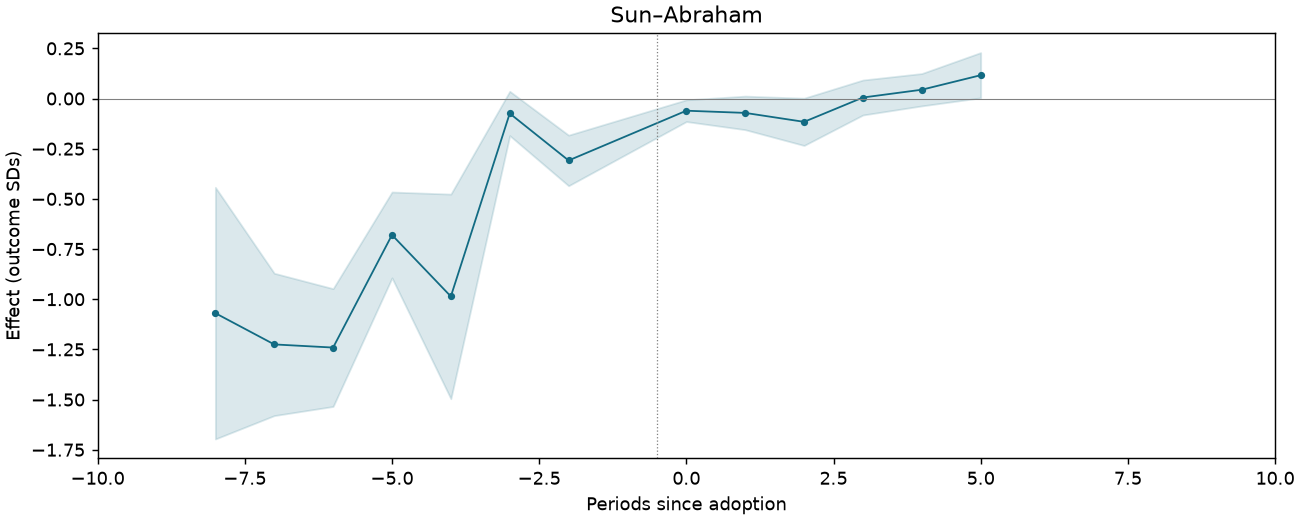
| Sun–Abraham | -0.174 | 0.043 | [-0.260, -0.088] | Treated cells |
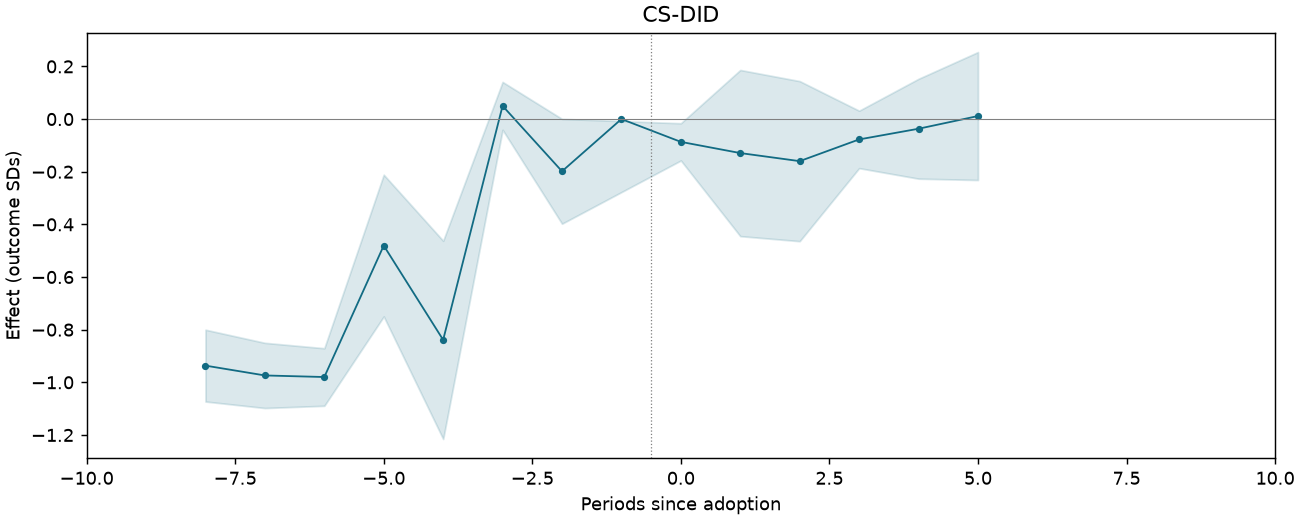
| CS-DID (equal event-time) | -0.242 | 0.065 | [-0.369, -0.115] | Equal post-event times |
| CS-DID (treated cells) | -0.301 | 0.079 | [-0.455, -0.147] | Treated cells |
Event studies
Periods −10 to +10; pointwise 95% intervals where available.
PP-REPLY-T1-PB-NOOIL-SALESGR
114,267 observations · 12,772 units · 56 clusters · 29 treated / 12,743 control units.
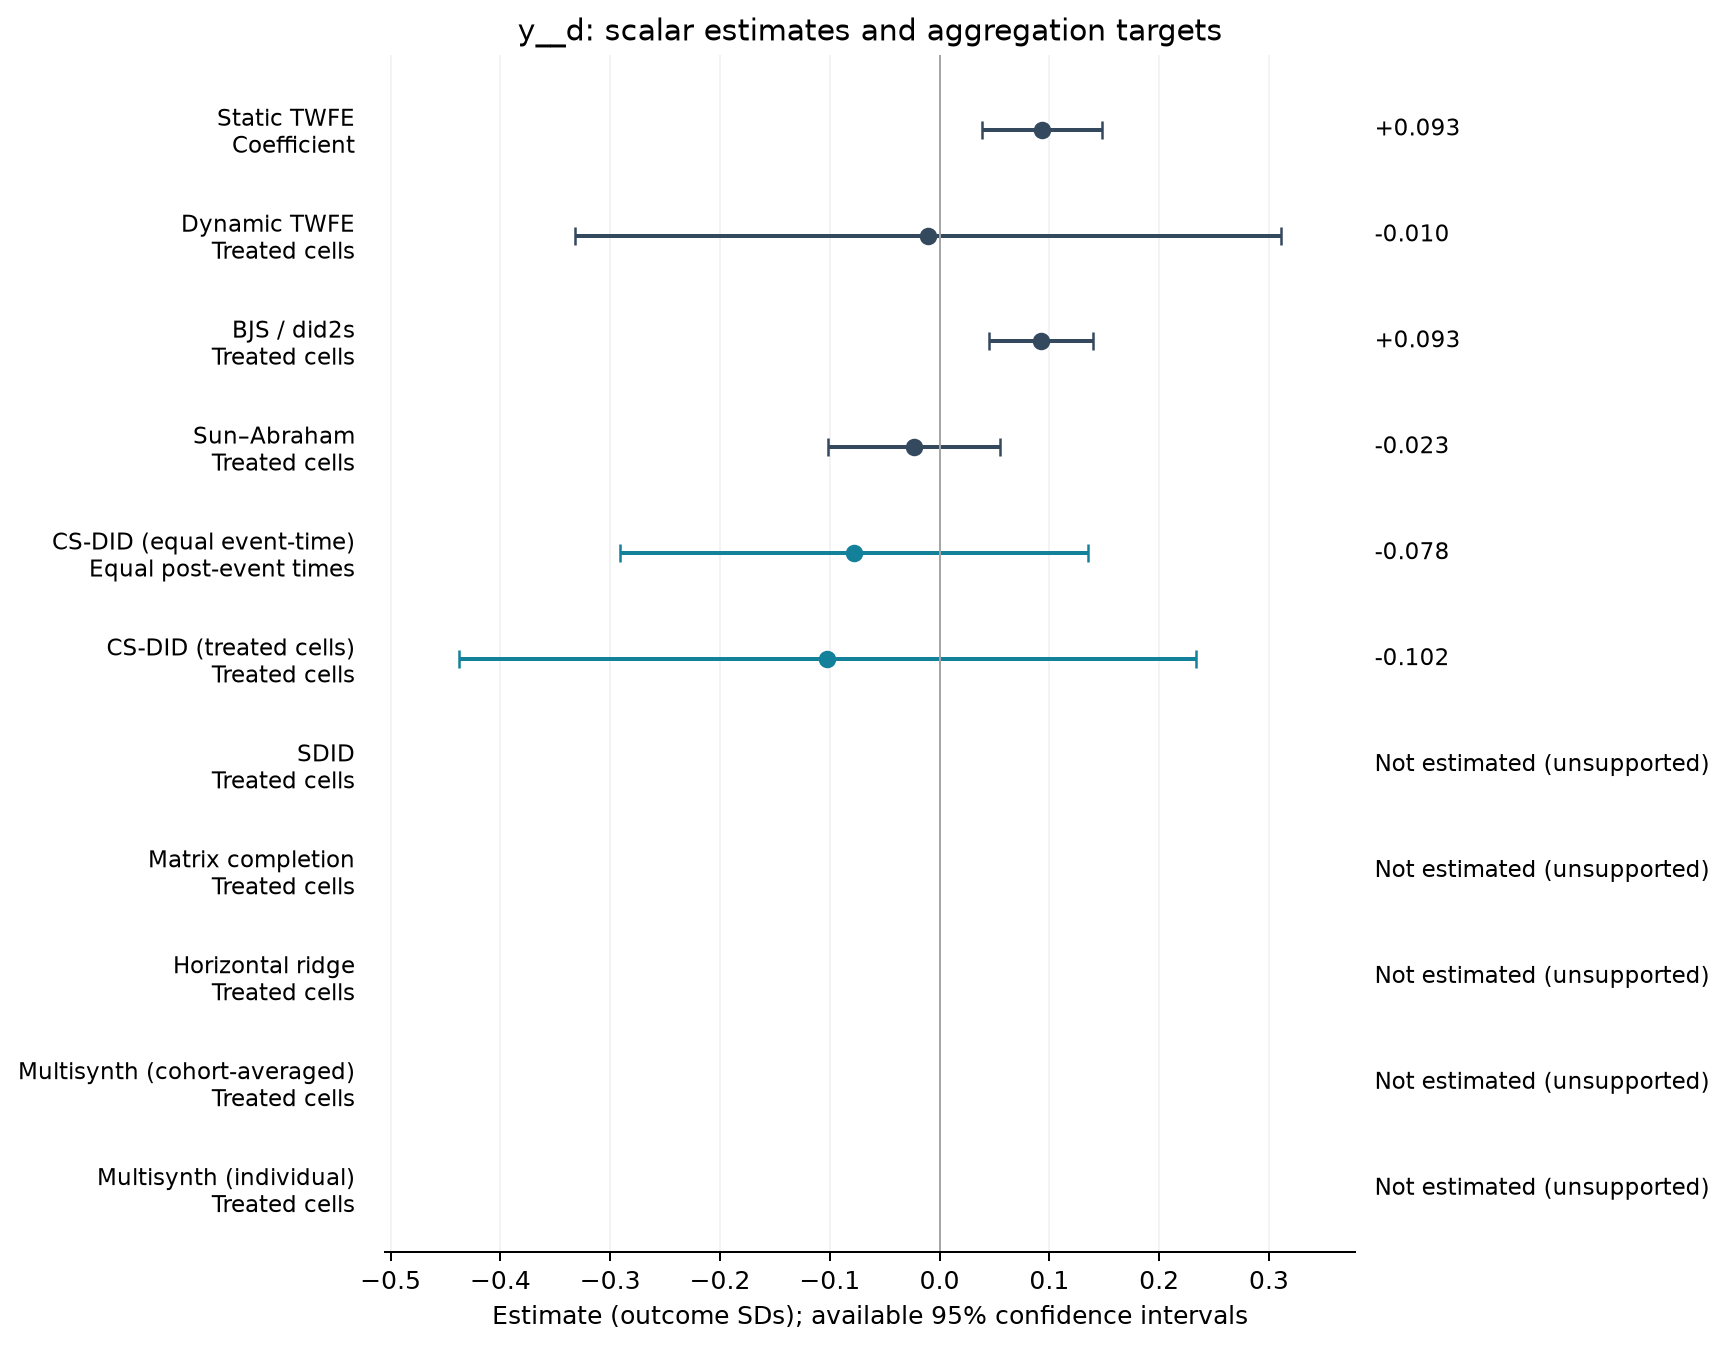
Estimate comparison
| Estimator | Estimate (SDs) | SE | 95% CI | Averaging |
|---|---|---|---|---|
| Static TWFE | 0.093 | 0.027 | [0.038, 0.148] | Coefficient |
| Dynamic TWFE | -0.010 | 0.160 | [-0.332, 0.311] | Treated cells |
| BJS / did2s | 0.093 | 0.024 | [0.045, 0.140] | Treated cells |
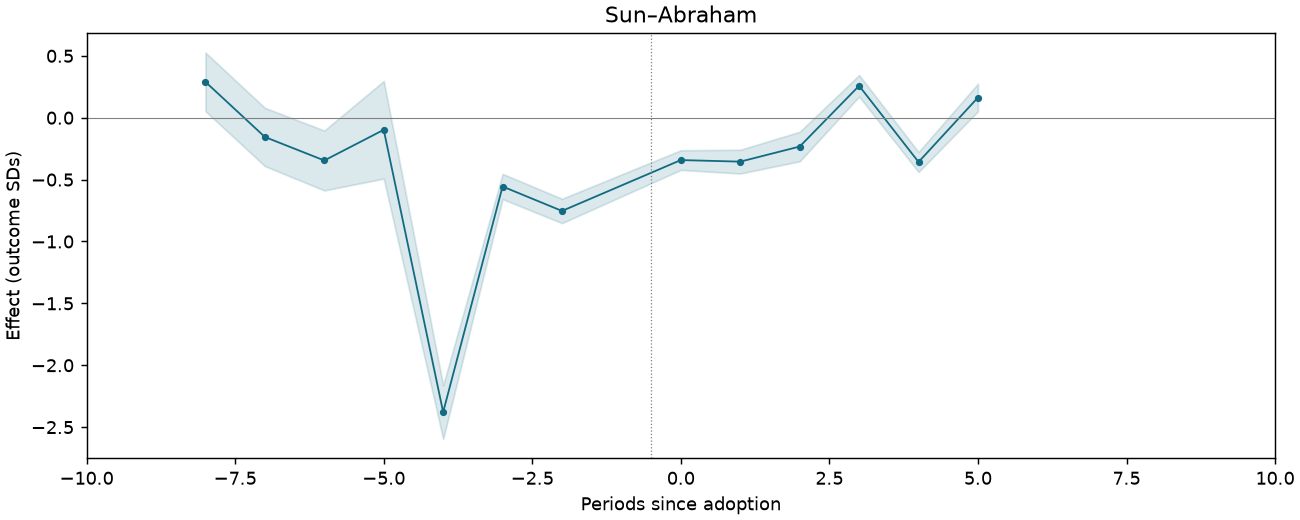
| Sun–Abraham | -0.023 | 0.039 | [-0.102, 0.055] | Treated cells |
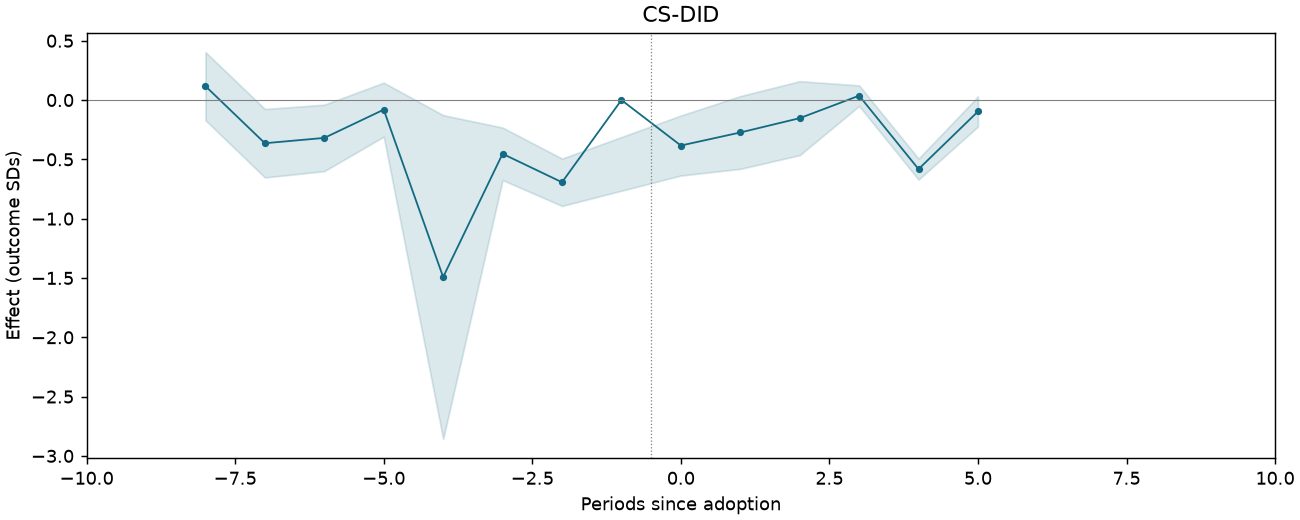
| CS-DID (equal event-time) | -0.078 | 0.109 | [-0.291, 0.136] | Equal post-event times |
| CS-DID (treated cells) | -0.102 | 0.171 | [-0.438, 0.233] | Treated cells |
Event studies
Periods −10 to +10; pointwise 95% intervals where available.
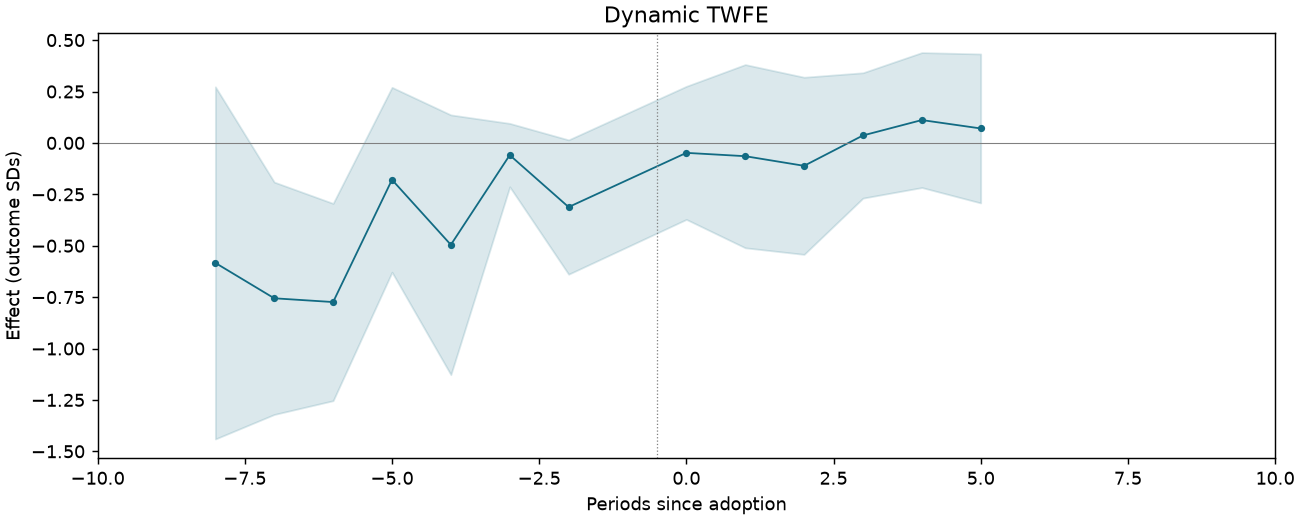
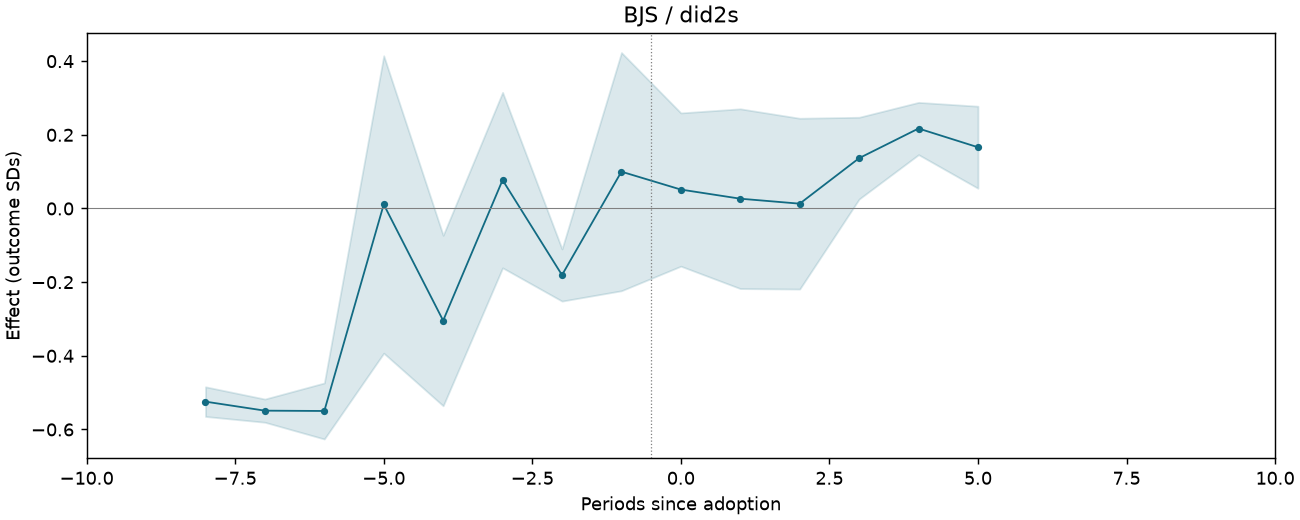
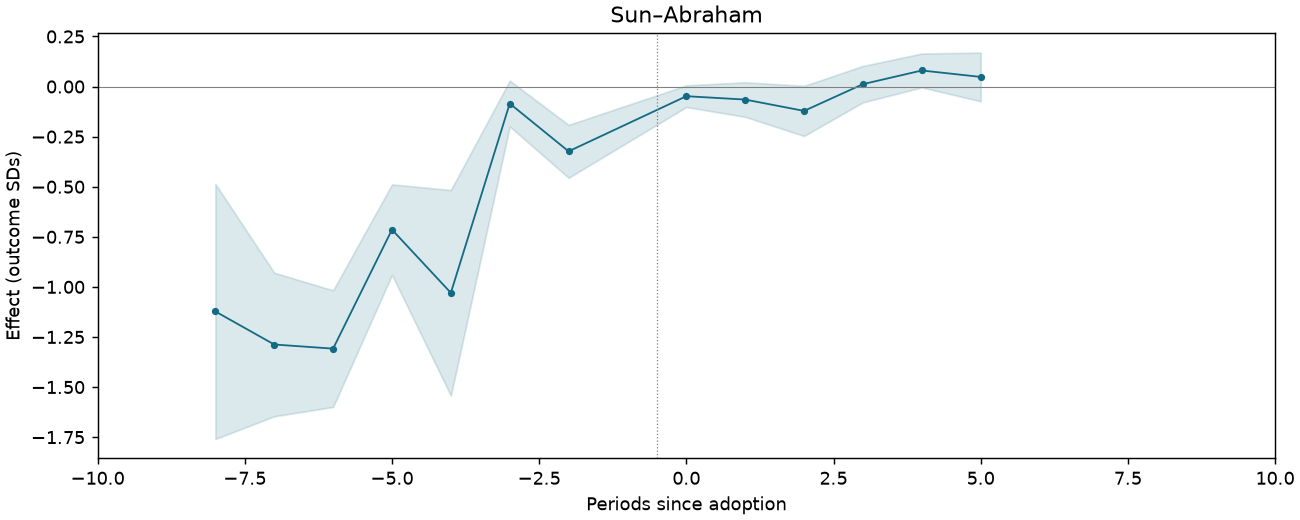
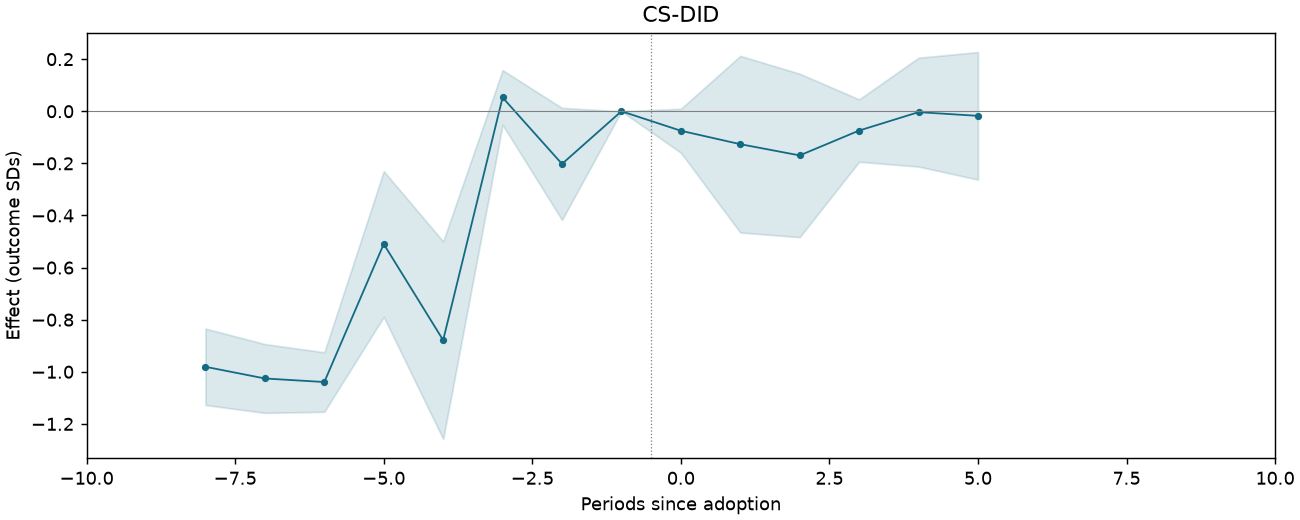
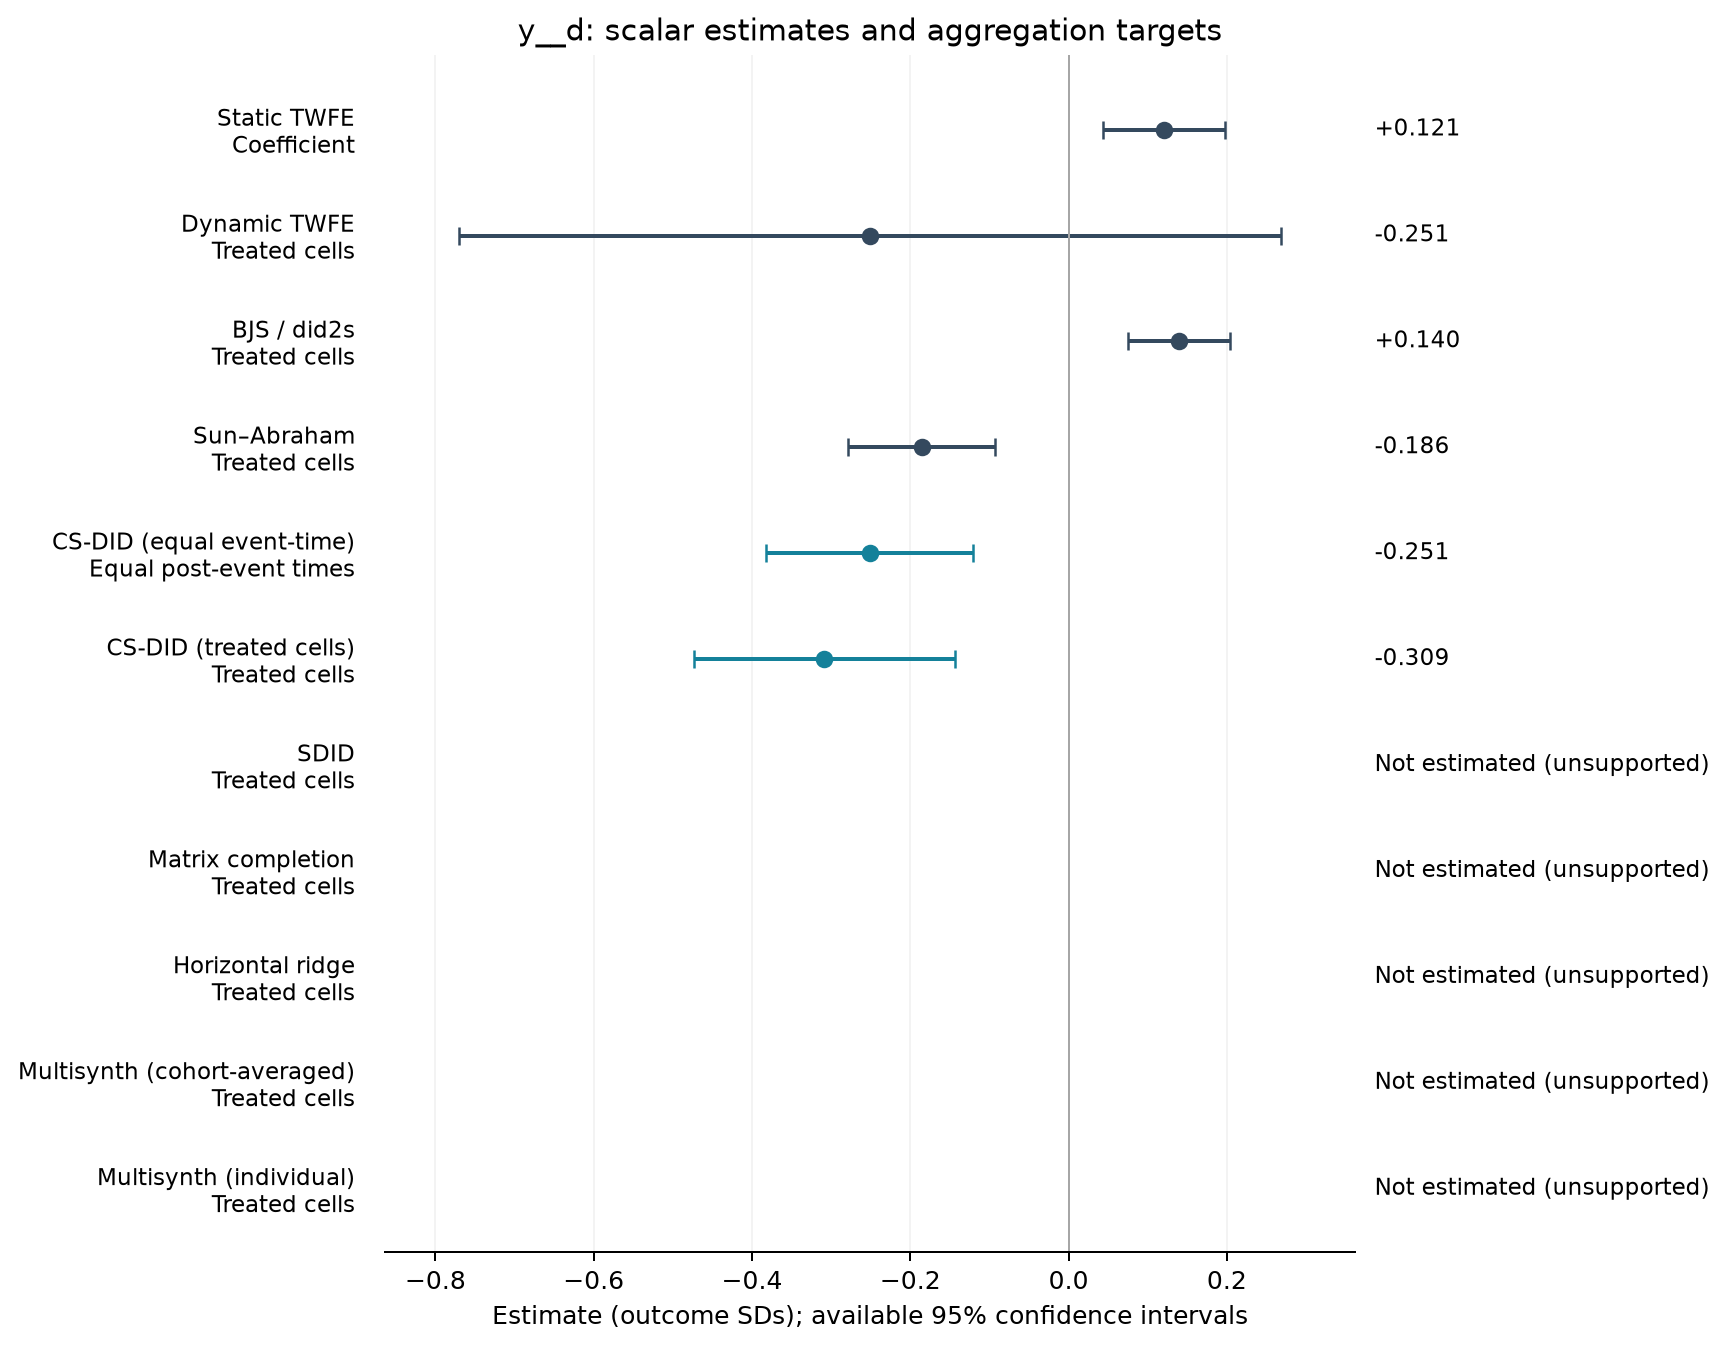
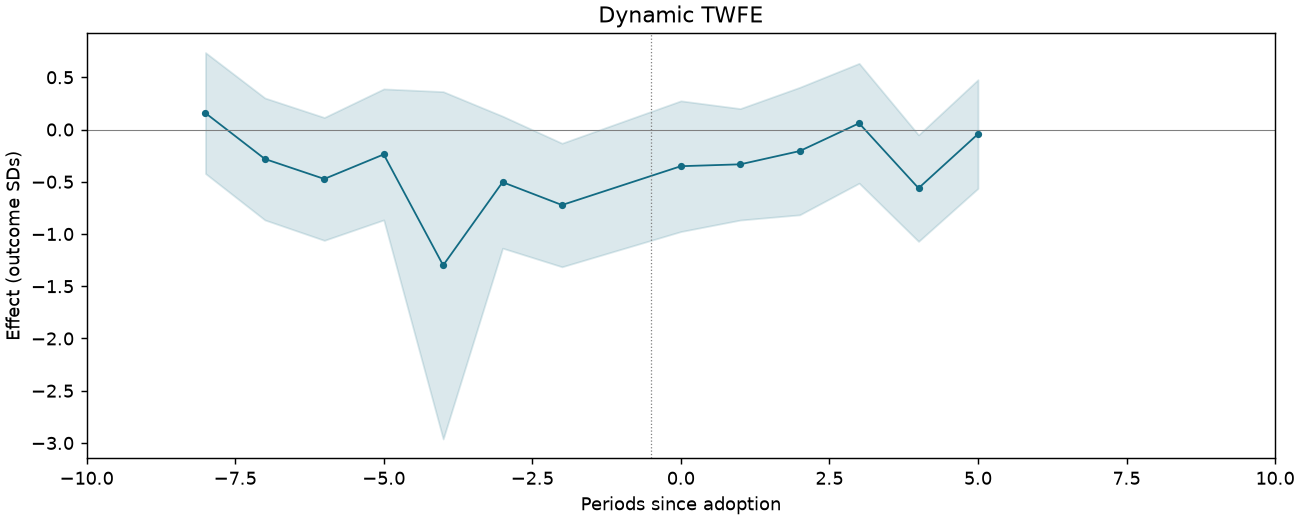
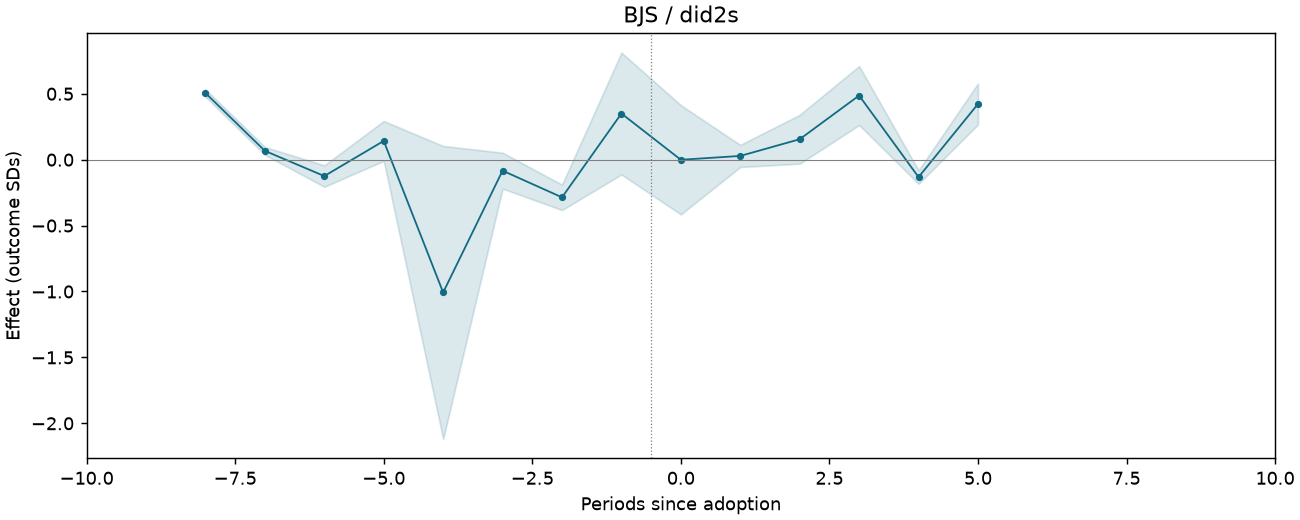
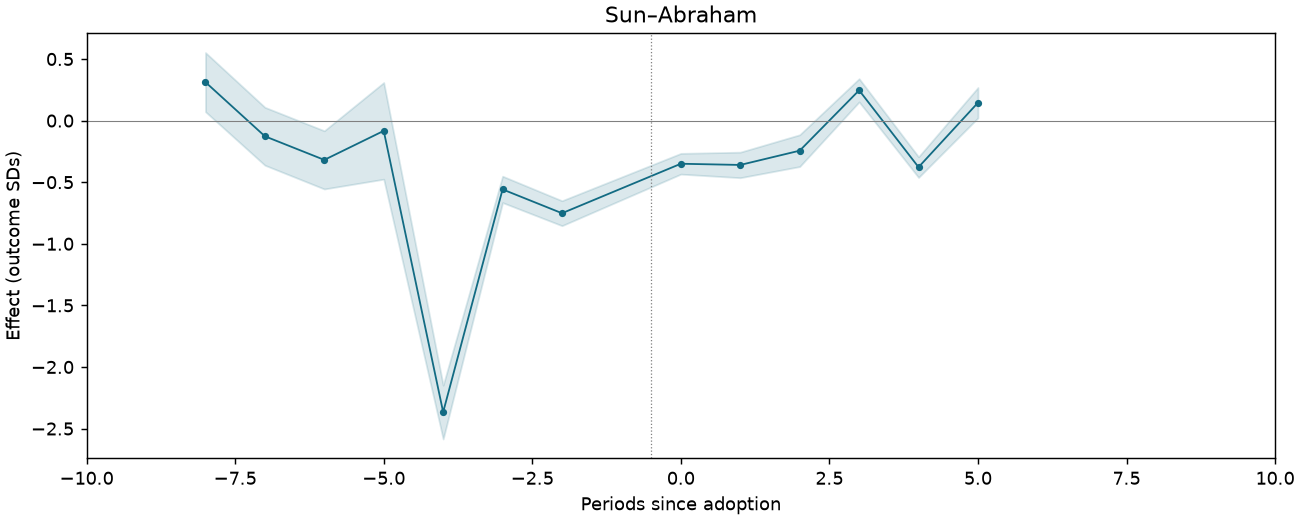
PP-REPLY-T1-PB-NOTX-CHGEMP
100,573 observations · 11,515 units · 55 clusters · 26 treated / 11,489 control units.
Estimate comparison
| Estimator | Estimate (SDs) | SE | 95% CI | Averaging |
|---|---|---|---|---|
| Static TWFE | 0.121 | 0.038 | [0.044, 0.198] | Coefficient |
| Dynamic TWFE | -0.251 | 0.259 | [-0.770, 0.269] | Treated cells |
| BJS / did2s | 0.140 | 0.032 | [0.075, 0.205] | Treated cells |
| Sun–Abraham | -0.186 | 0.046 | [-0.279, -0.092] | Treated cells |
| CS-DID (equal event-time) | -0.251 | 0.067 | [-0.382, -0.120] | Equal post-event times |
| CS-DID (treated cells) | -0.309 | 0.084 | [-0.473, -0.144] | Treated cells |
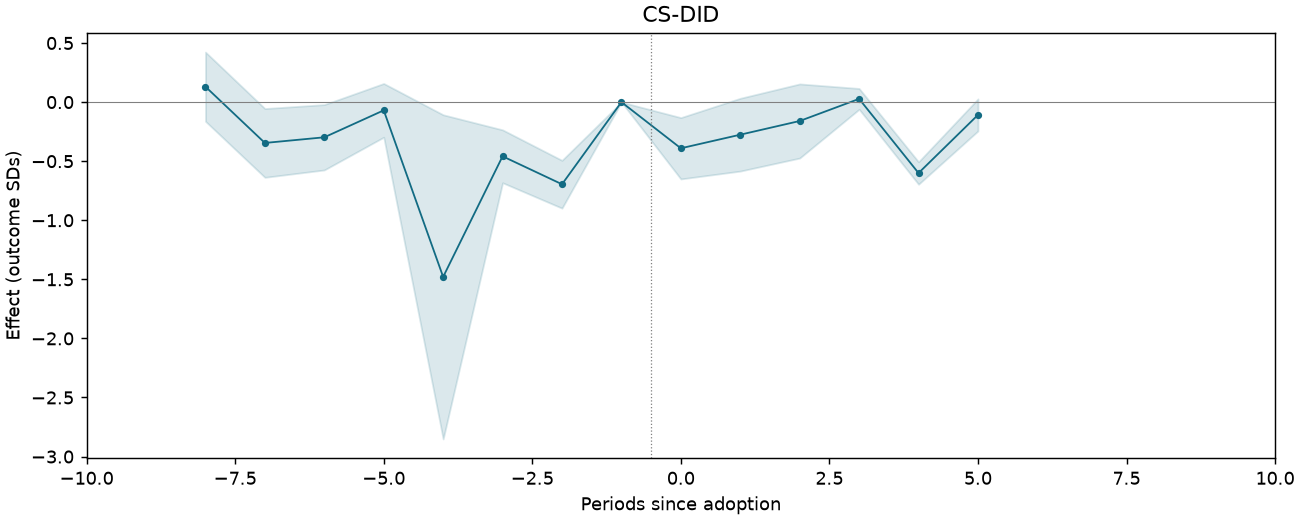
Event studies
Periods −10 to +10; pointwise 95% intervals where available.
PP-REPLY-T1-PB-NOTX-SALESGR
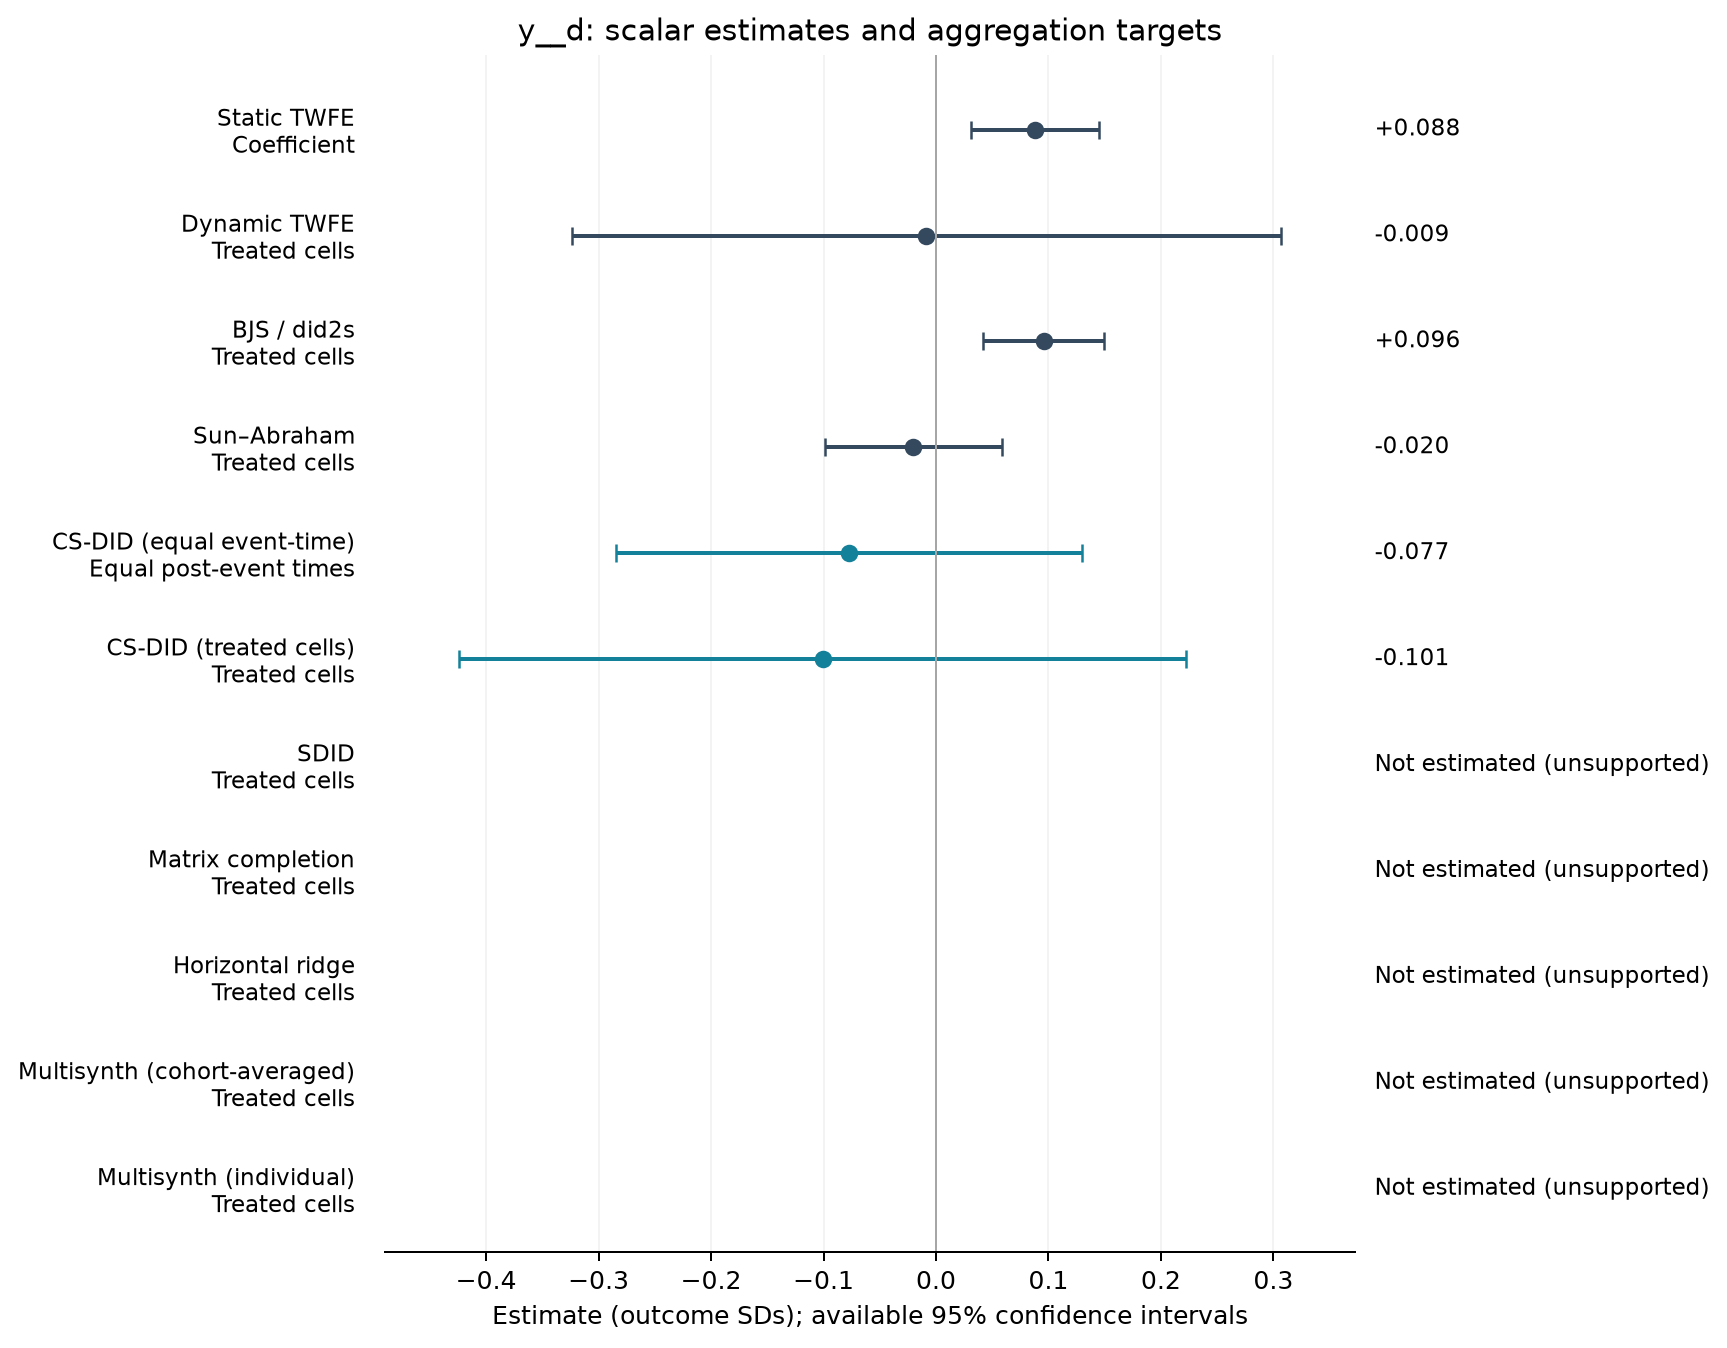
108,685 observations · 12,131 units · 55 clusters · 29 treated / 12,102 control units.
Estimate comparison
| Estimator | Estimate (SDs) | SE | 95% CI | Averaging |
|---|---|---|---|---|
| Static TWFE | 0.088 | 0.028 | [0.031, 0.145] | Coefficient |
| Dynamic TWFE | -0.009 | 0.157 | [-0.324, 0.307] | Treated cells |
| BJS / did2s | 0.096 | 0.027 | [0.042, 0.150] | Treated cells |
| Sun–Abraham | -0.020 | 0.039 | [-0.099, 0.059] | Treated cells |
| CS-DID (equal event-time) | -0.077 | 0.106 | [-0.284, 0.130] | Equal post-event times |
| CS-DID (treated cells) | -0.101 | 0.165 | [-0.424, 0.223] | Treated cells |
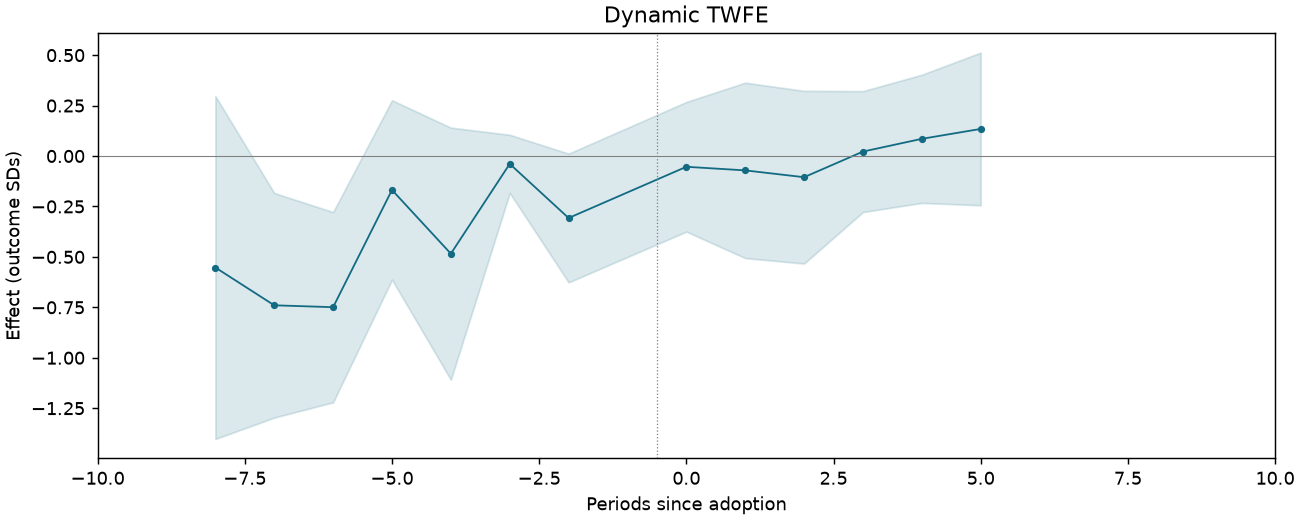
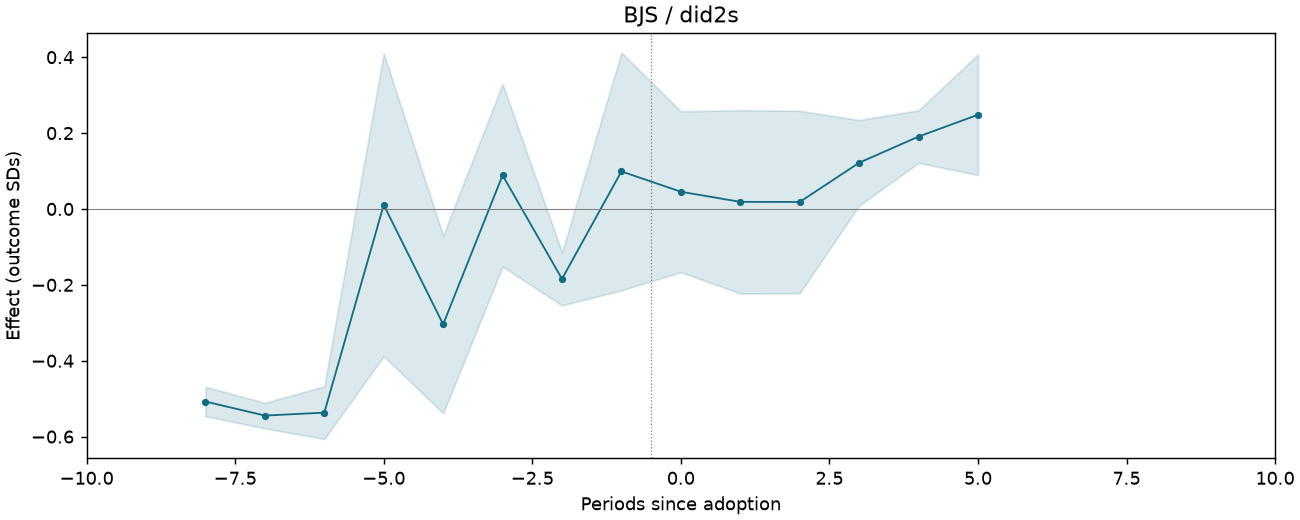
Event studies
Periods −10 to +10; pointwise 95% intervals where available.
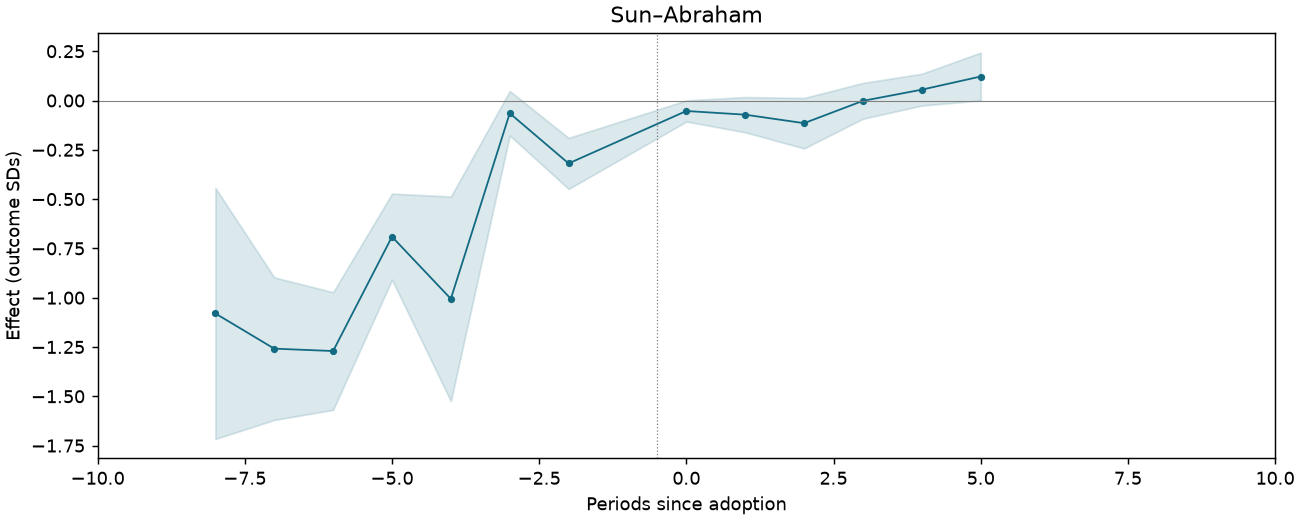
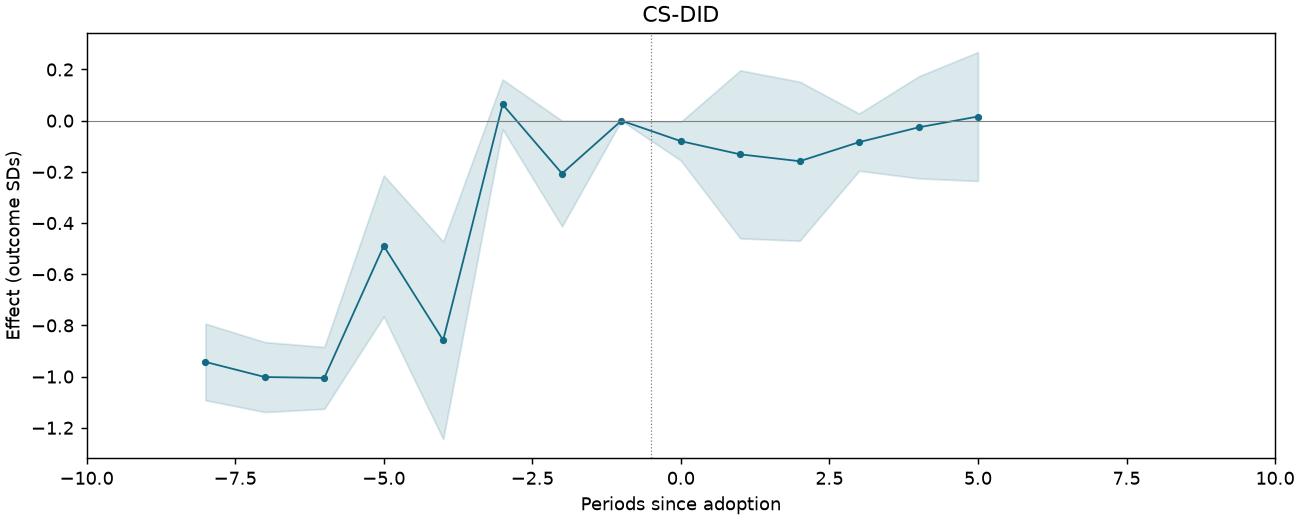
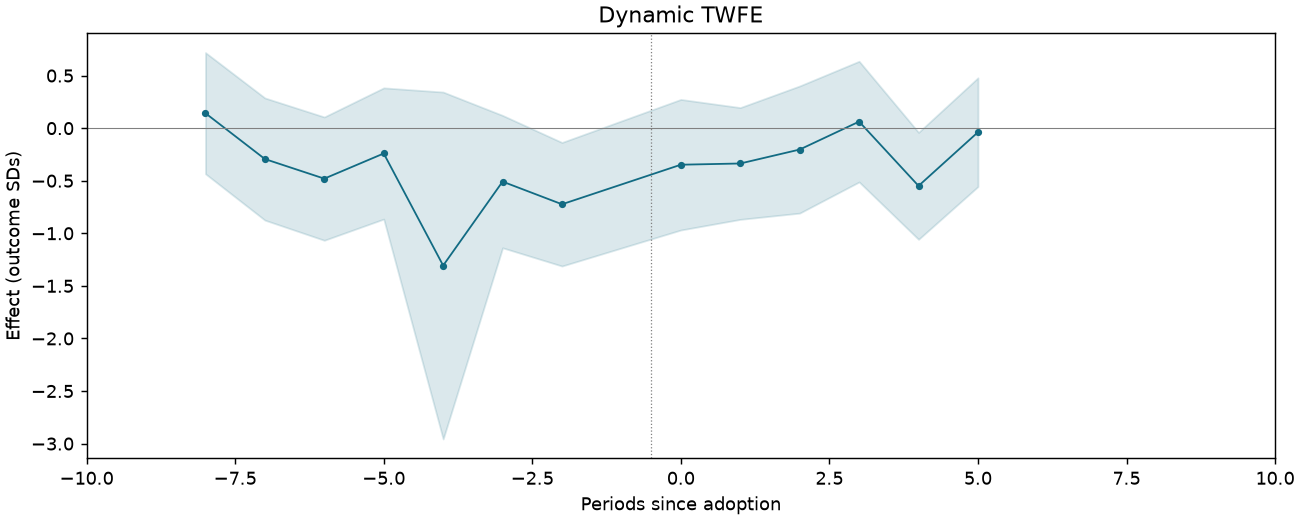
PP-REPLY-T1-PB-NOTXOIL-CHGEMP
107,753 observations · 12,360 units · 56 clusters · 26 treated / 12,334 control units.
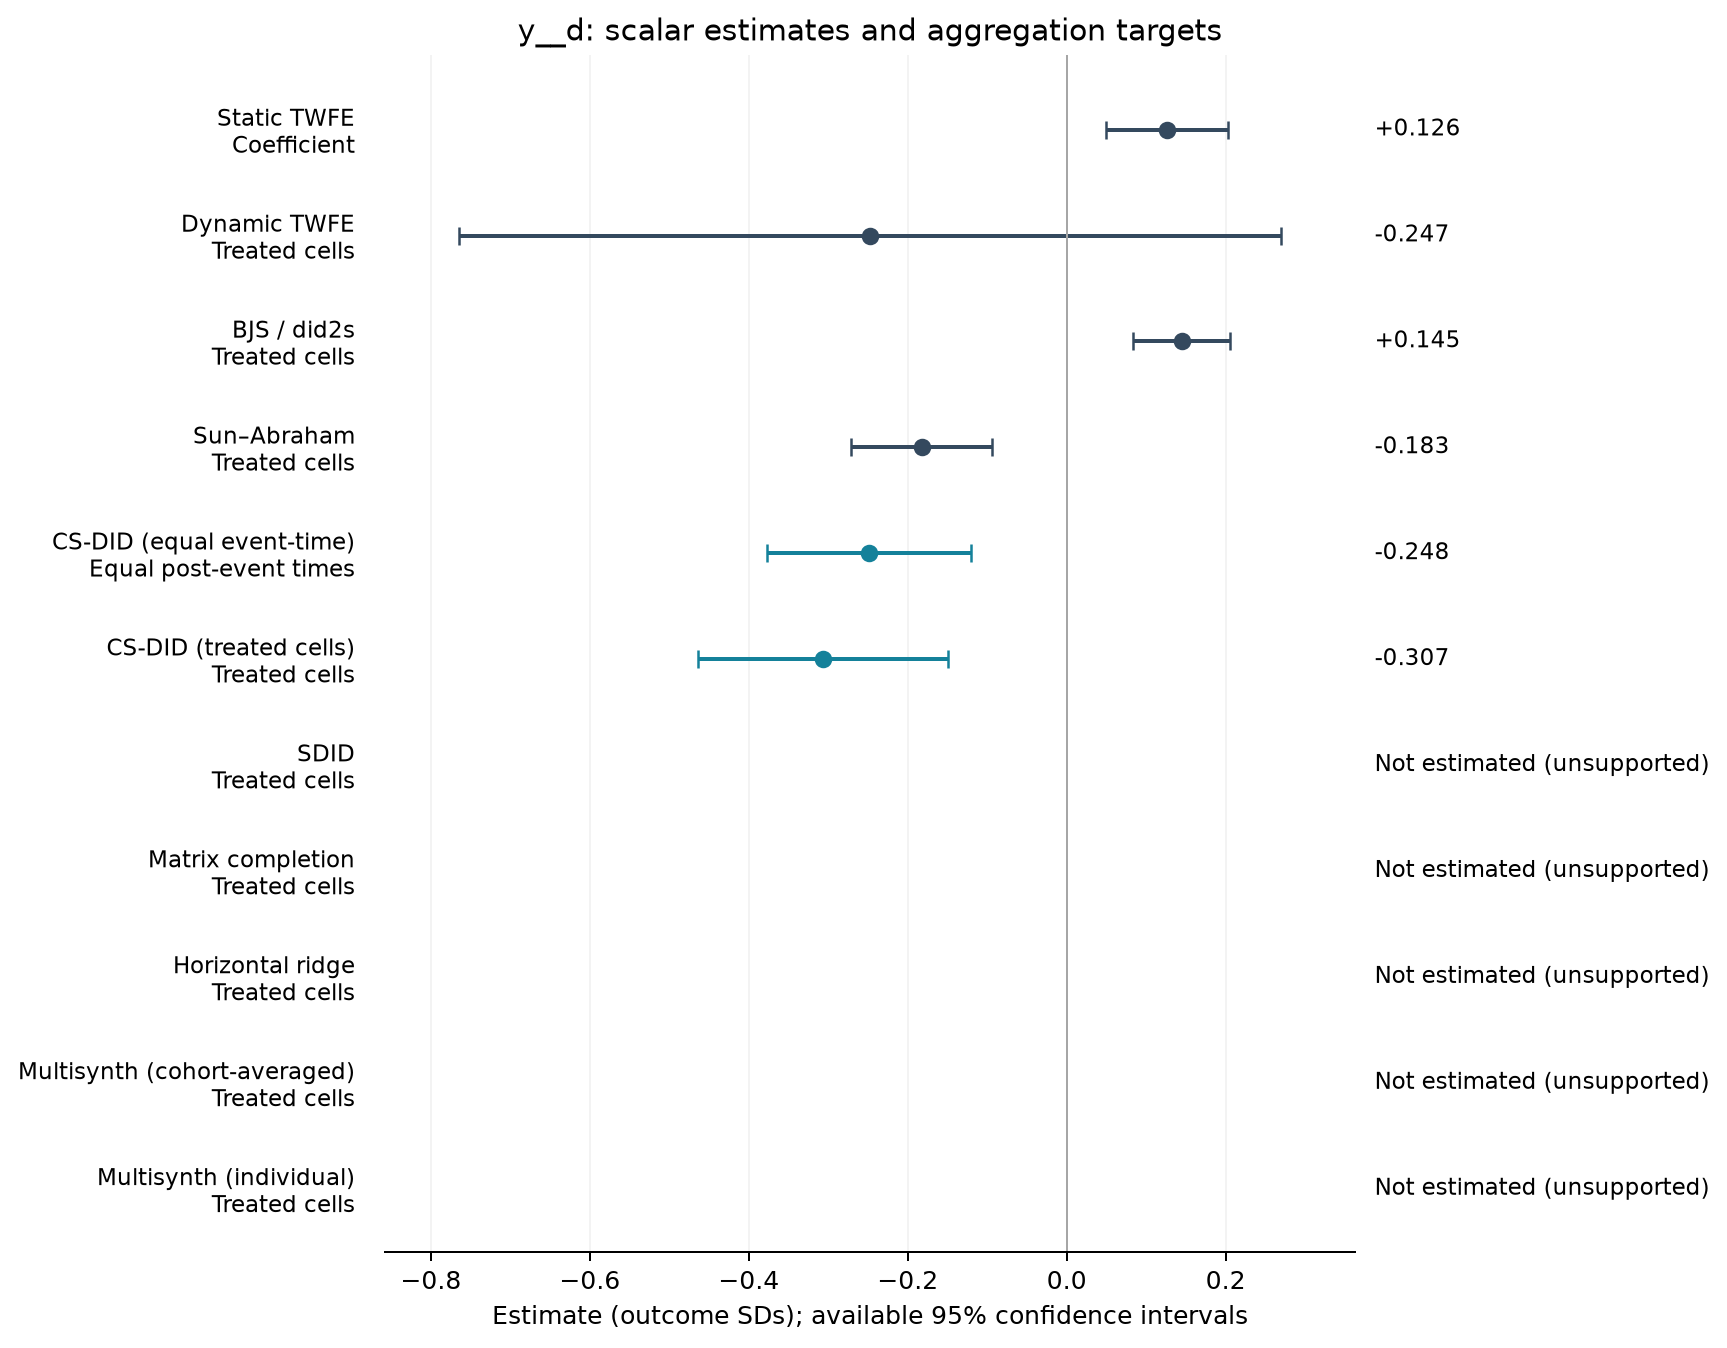
Estimate comparison
| Estimator | Estimate (SDs) | SE | 95% CI | Averaging |
|---|---|---|---|---|
| Static TWFE | 0.126 | 0.038 | [0.049, 0.202] | Coefficient |
| Dynamic TWFE | -0.247 | 0.258 | [-0.765, 0.270] | Treated cells |
| BJS / did2s | 0.145 | 0.031 | [0.083, 0.206] | Treated cells |
| Sun–Abraham | -0.183 | 0.044 | [-0.271, -0.094] | Treated cells |
| CS-DID (equal event-time) | -0.248 | 0.066 | [-0.377, -0.120] | Equal post-event times |
| CS-DID (treated cells) | -0.307 | 0.080 | [-0.464, -0.149] | Treated cells |
Event studies
Periods −10 to +10; pointwise 95% intervals where available.
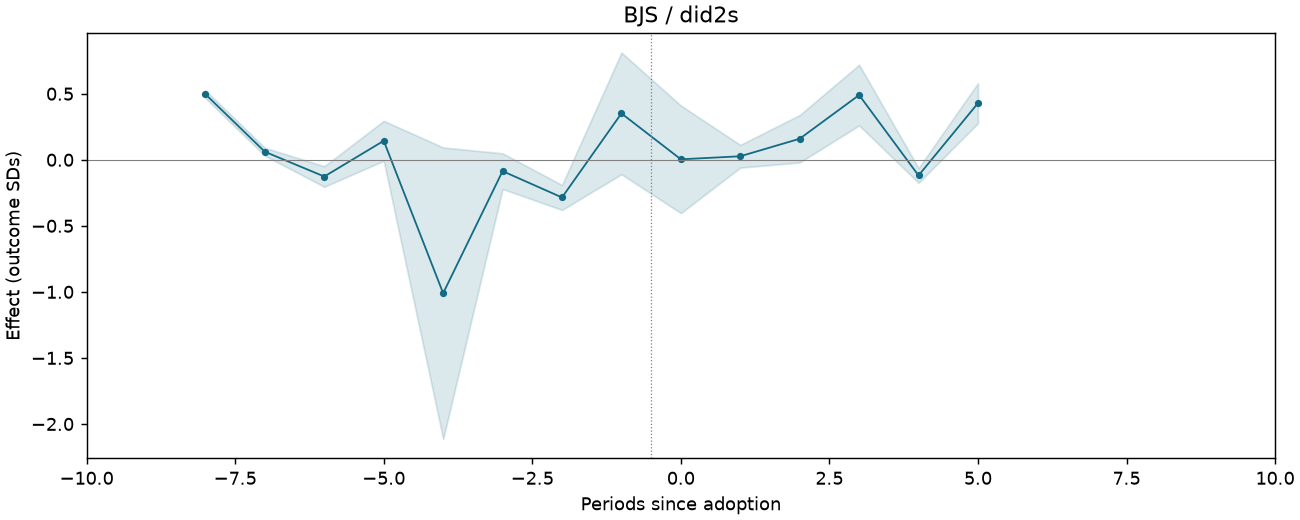
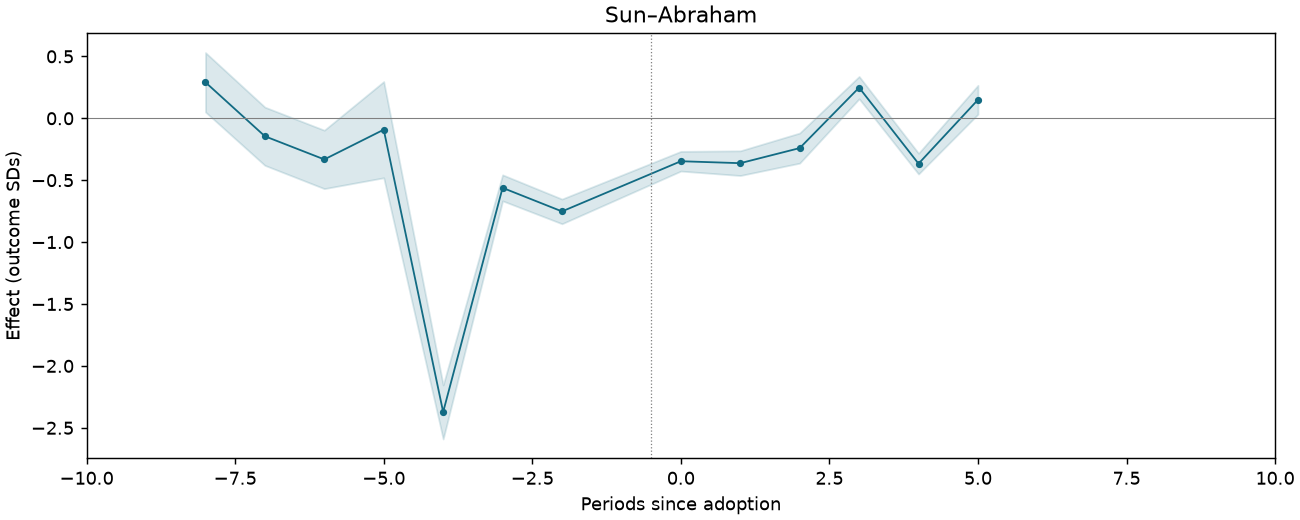
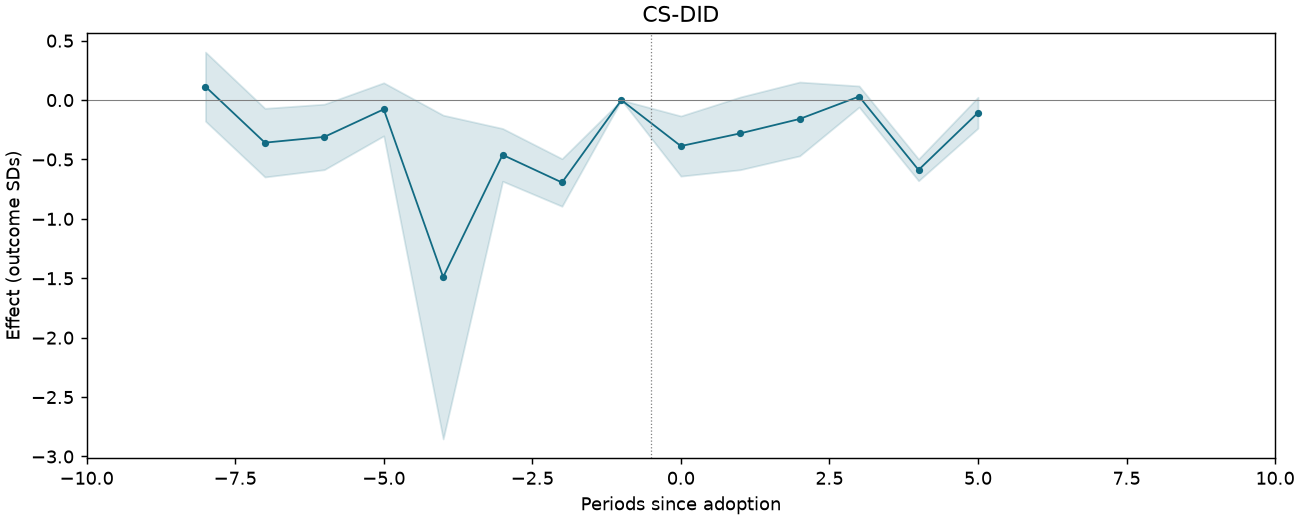
PP-REPLY-T1-PB-NOTXOIL-SALESGR
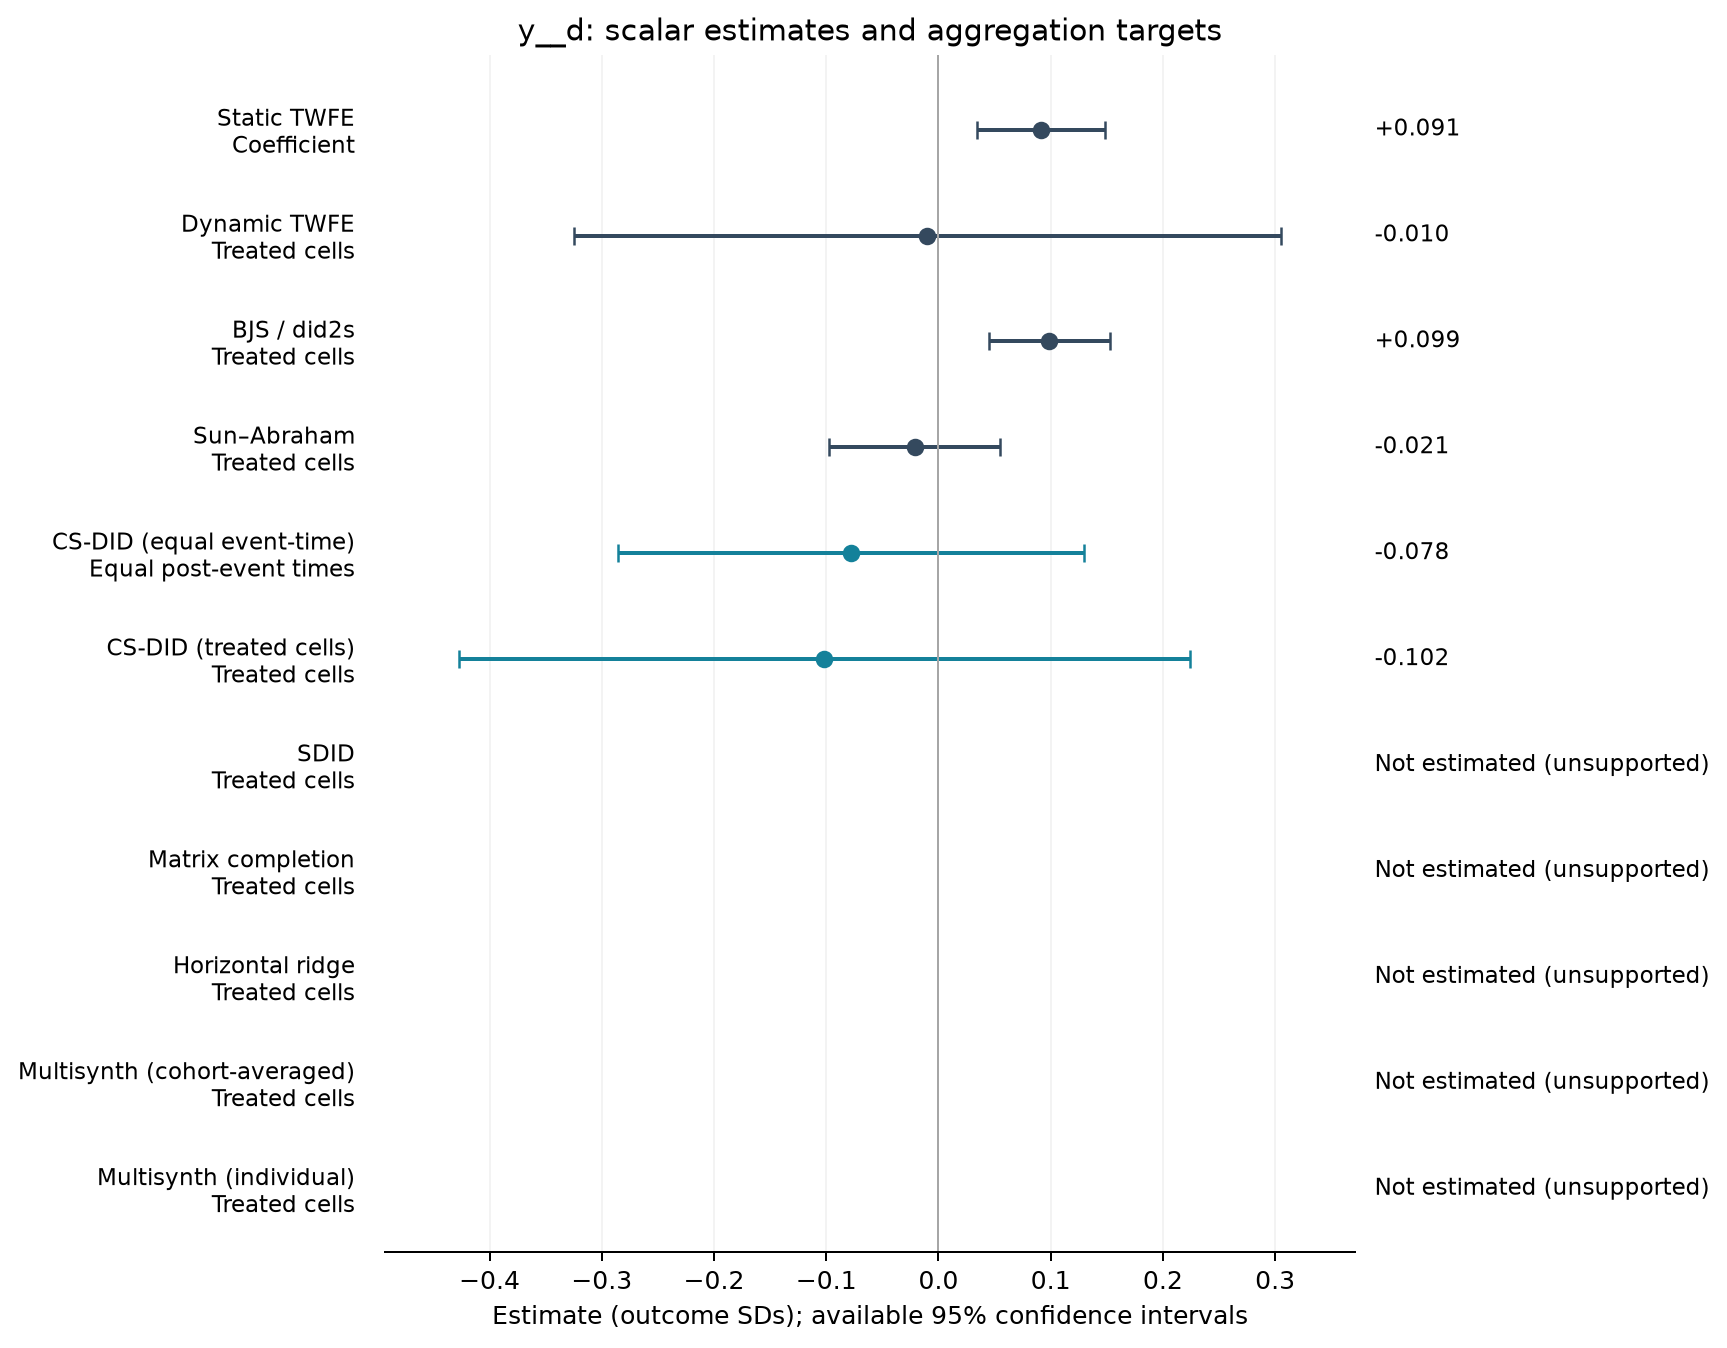
116,613 observations · 13,020 units · 56 clusters · 29 treated / 12,991 control units.
Estimate comparison
| Estimator | Estimate (SDs) | SE | 95% CI | Averaging |
|---|---|---|---|---|
| Static TWFE | 0.091 | 0.028 | [0.034, 0.148] | Coefficient |
| Dynamic TWFE | -0.010 | 0.157 | [-0.325, 0.305] | Treated cells |
| BJS / did2s | 0.099 | 0.027 | [0.045, 0.153] | Treated cells |
| Sun–Abraham | -0.021 | 0.038 | [-0.098, 0.055] | Treated cells |
| CS-DID (equal event-time) | -0.078 | 0.106 | [-0.286, 0.130] | Equal post-event times |
| CS-DID (treated cells) | -0.102 | 0.166 | [-0.427, 0.224] | Treated cells |
Event studies
Periods −10 to +10; pointwise 95% intervals where available.